
Behavior of Reinforcing Bar Connection of Hollow-Core Slabs to Steel Beams under In-Plane Forces


Abstract
:1. Introduction
2. Research Significance
3. Experimental Program
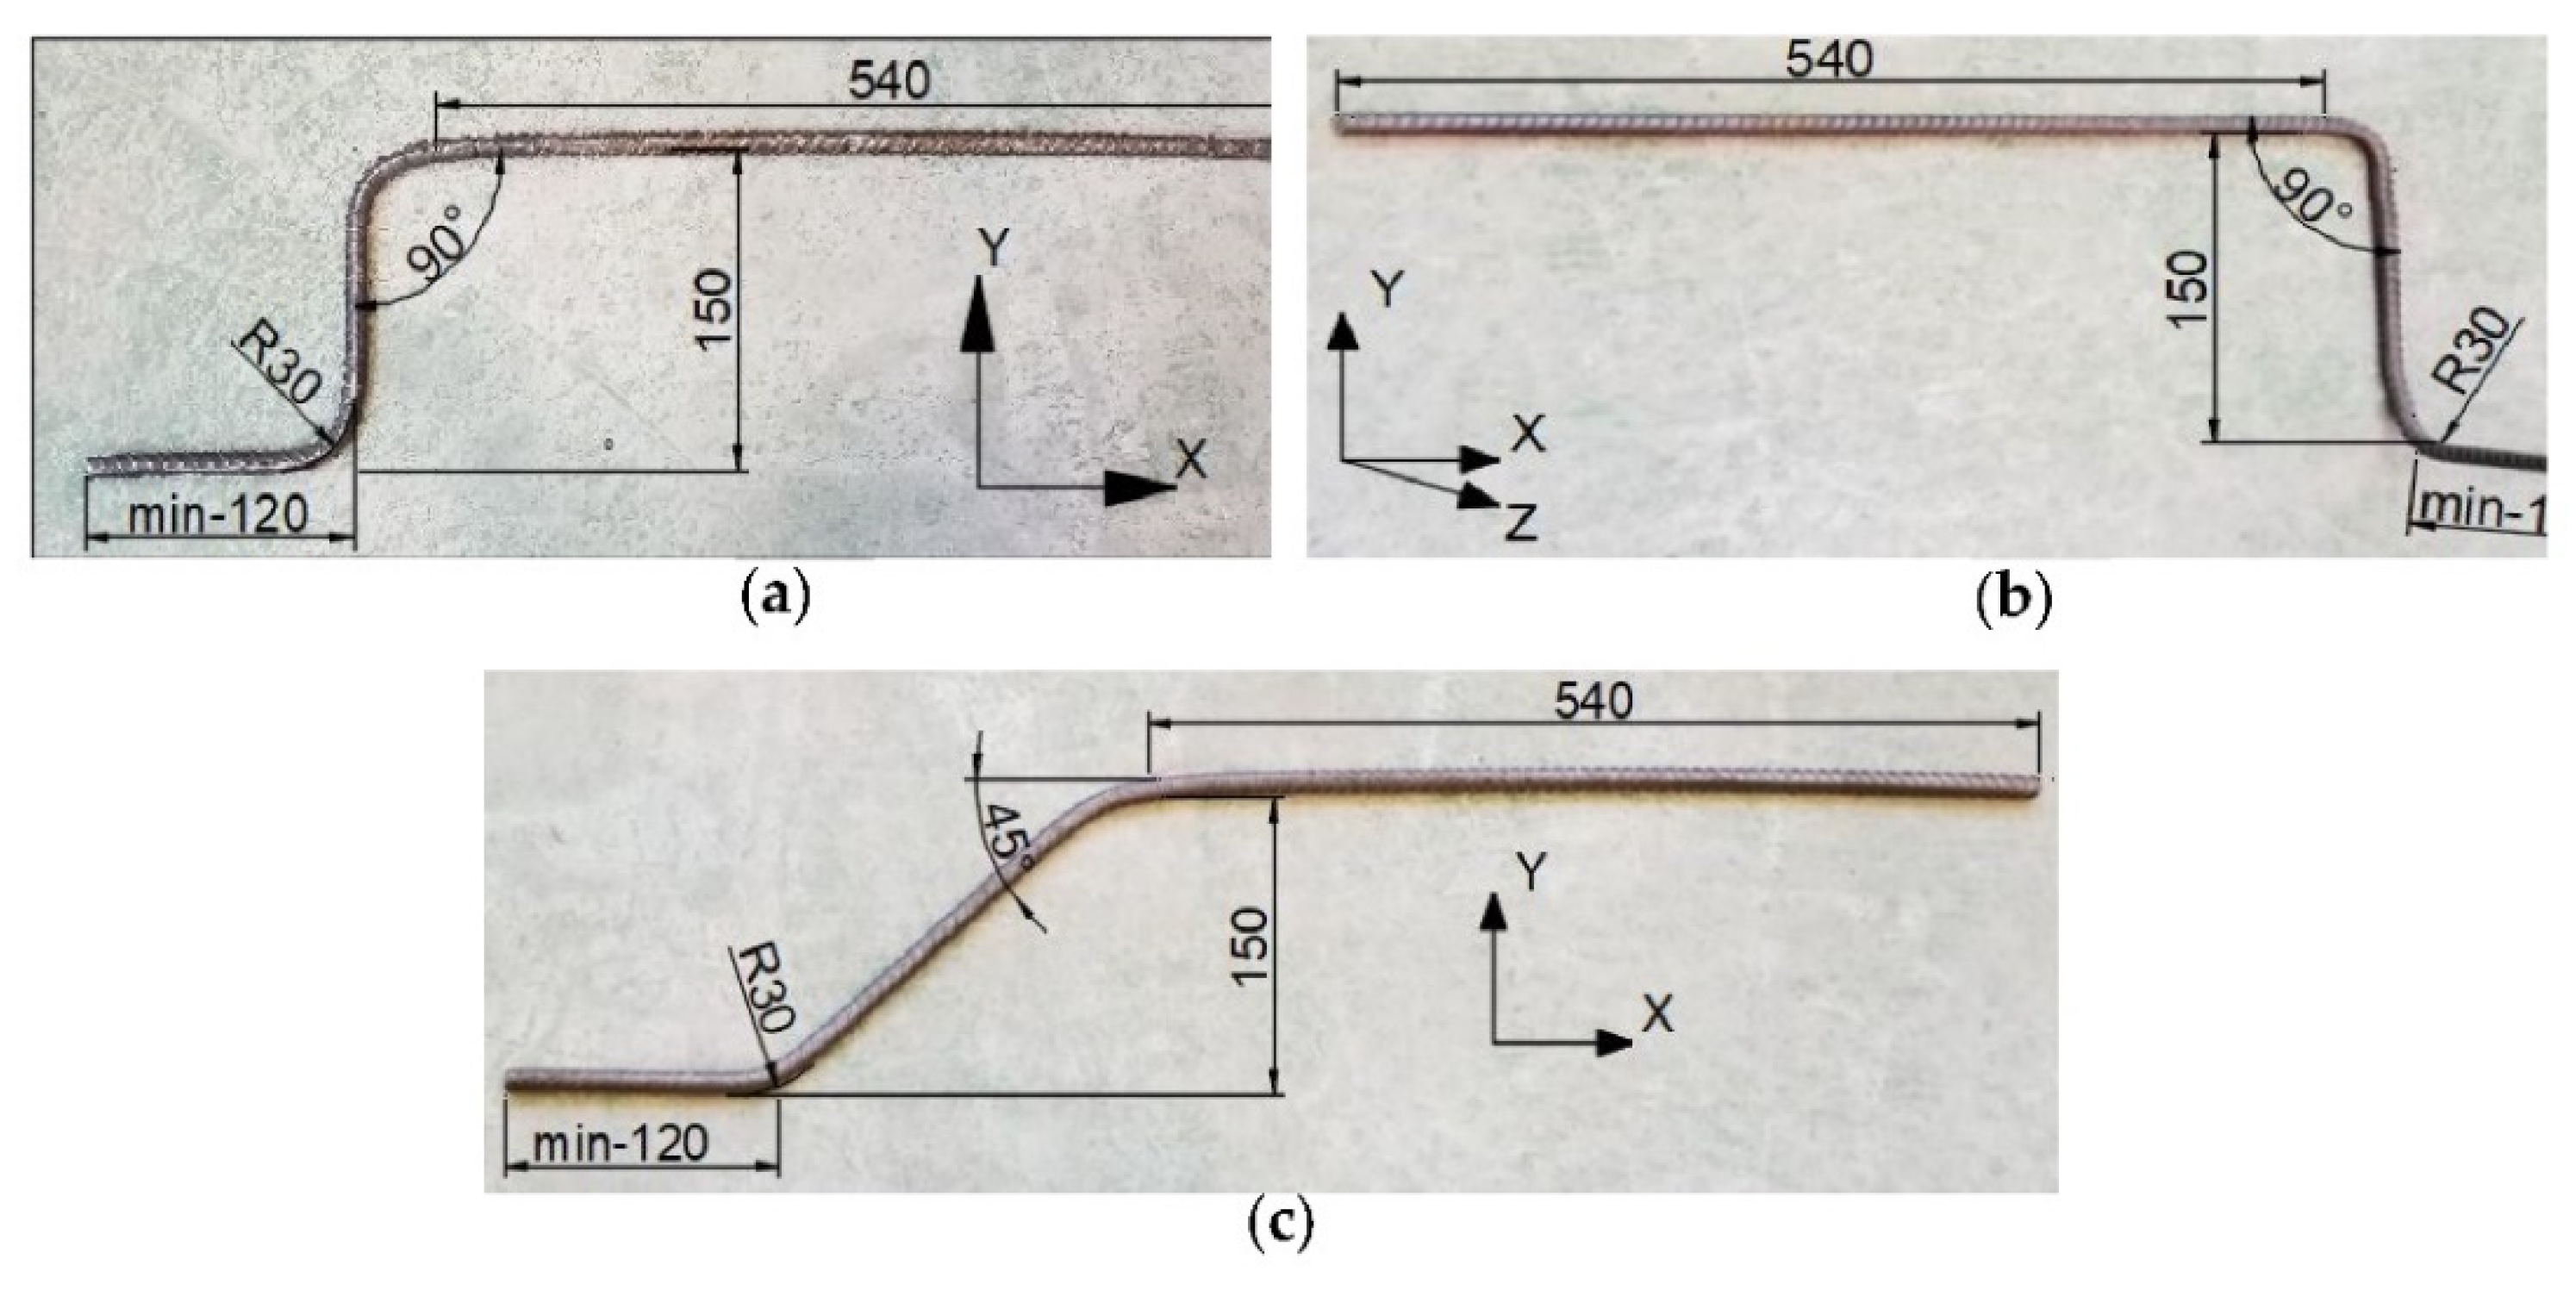
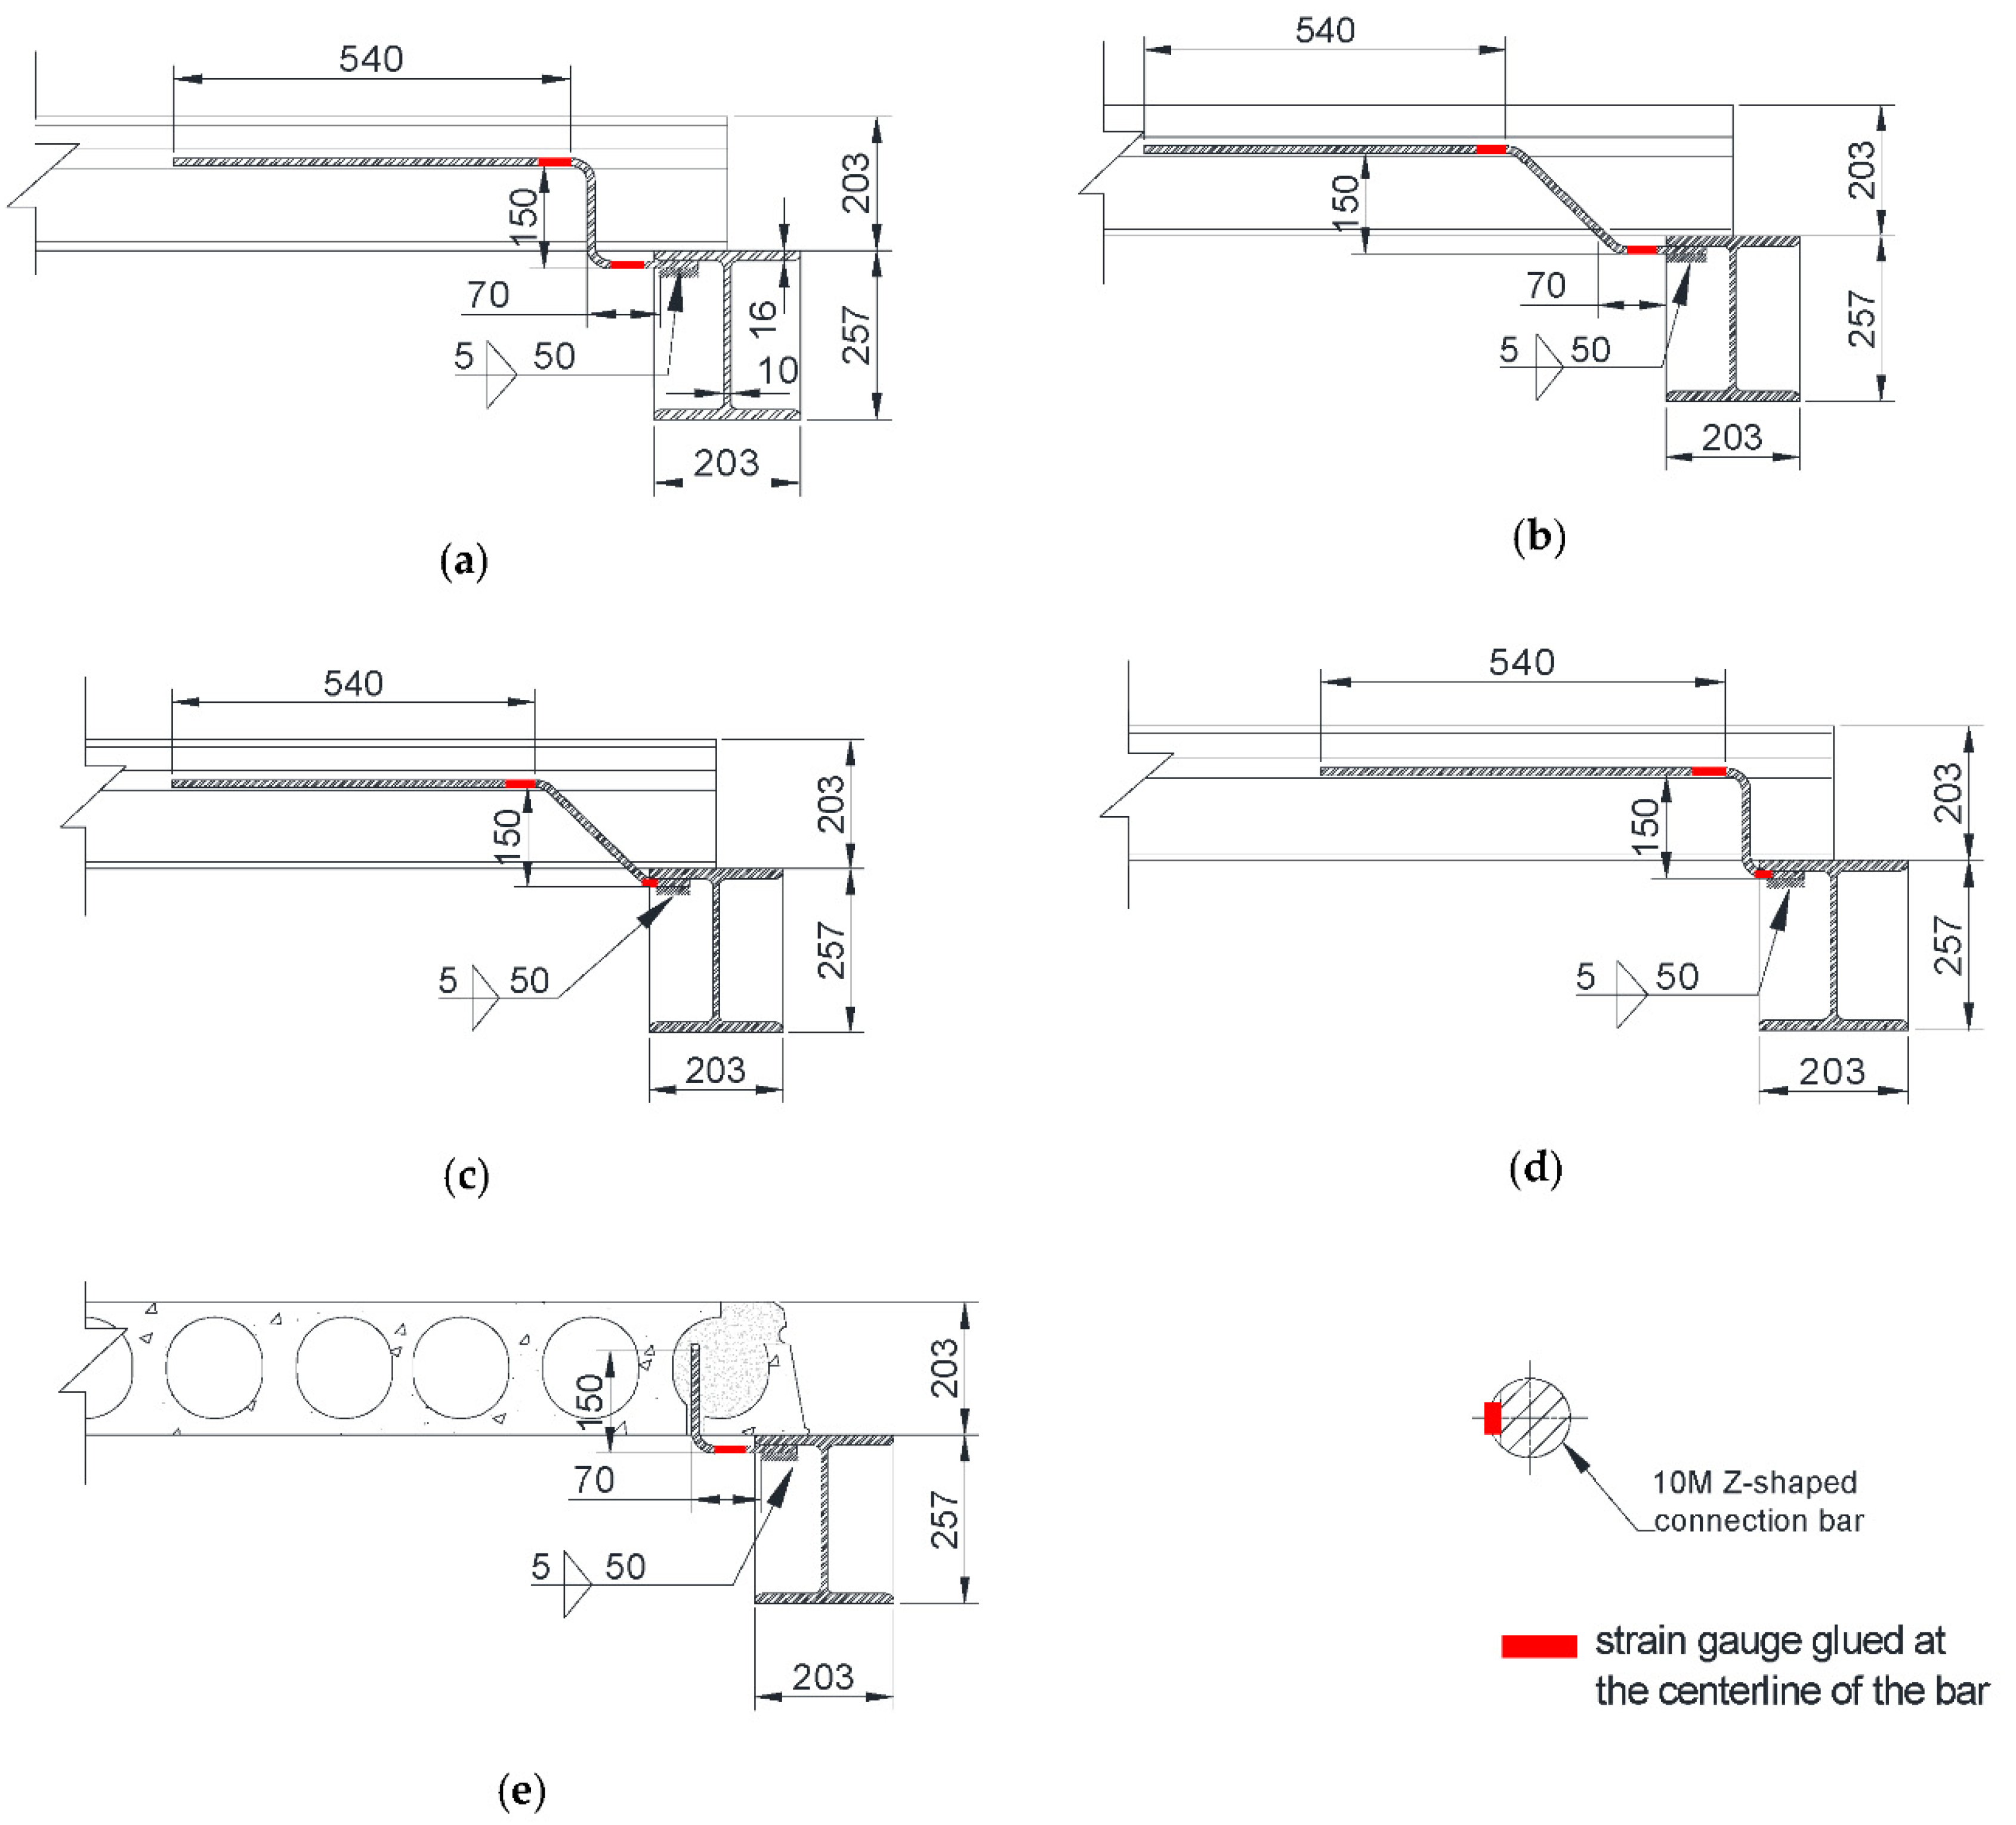
3.1. Test Specimens
3.2. Material Properties
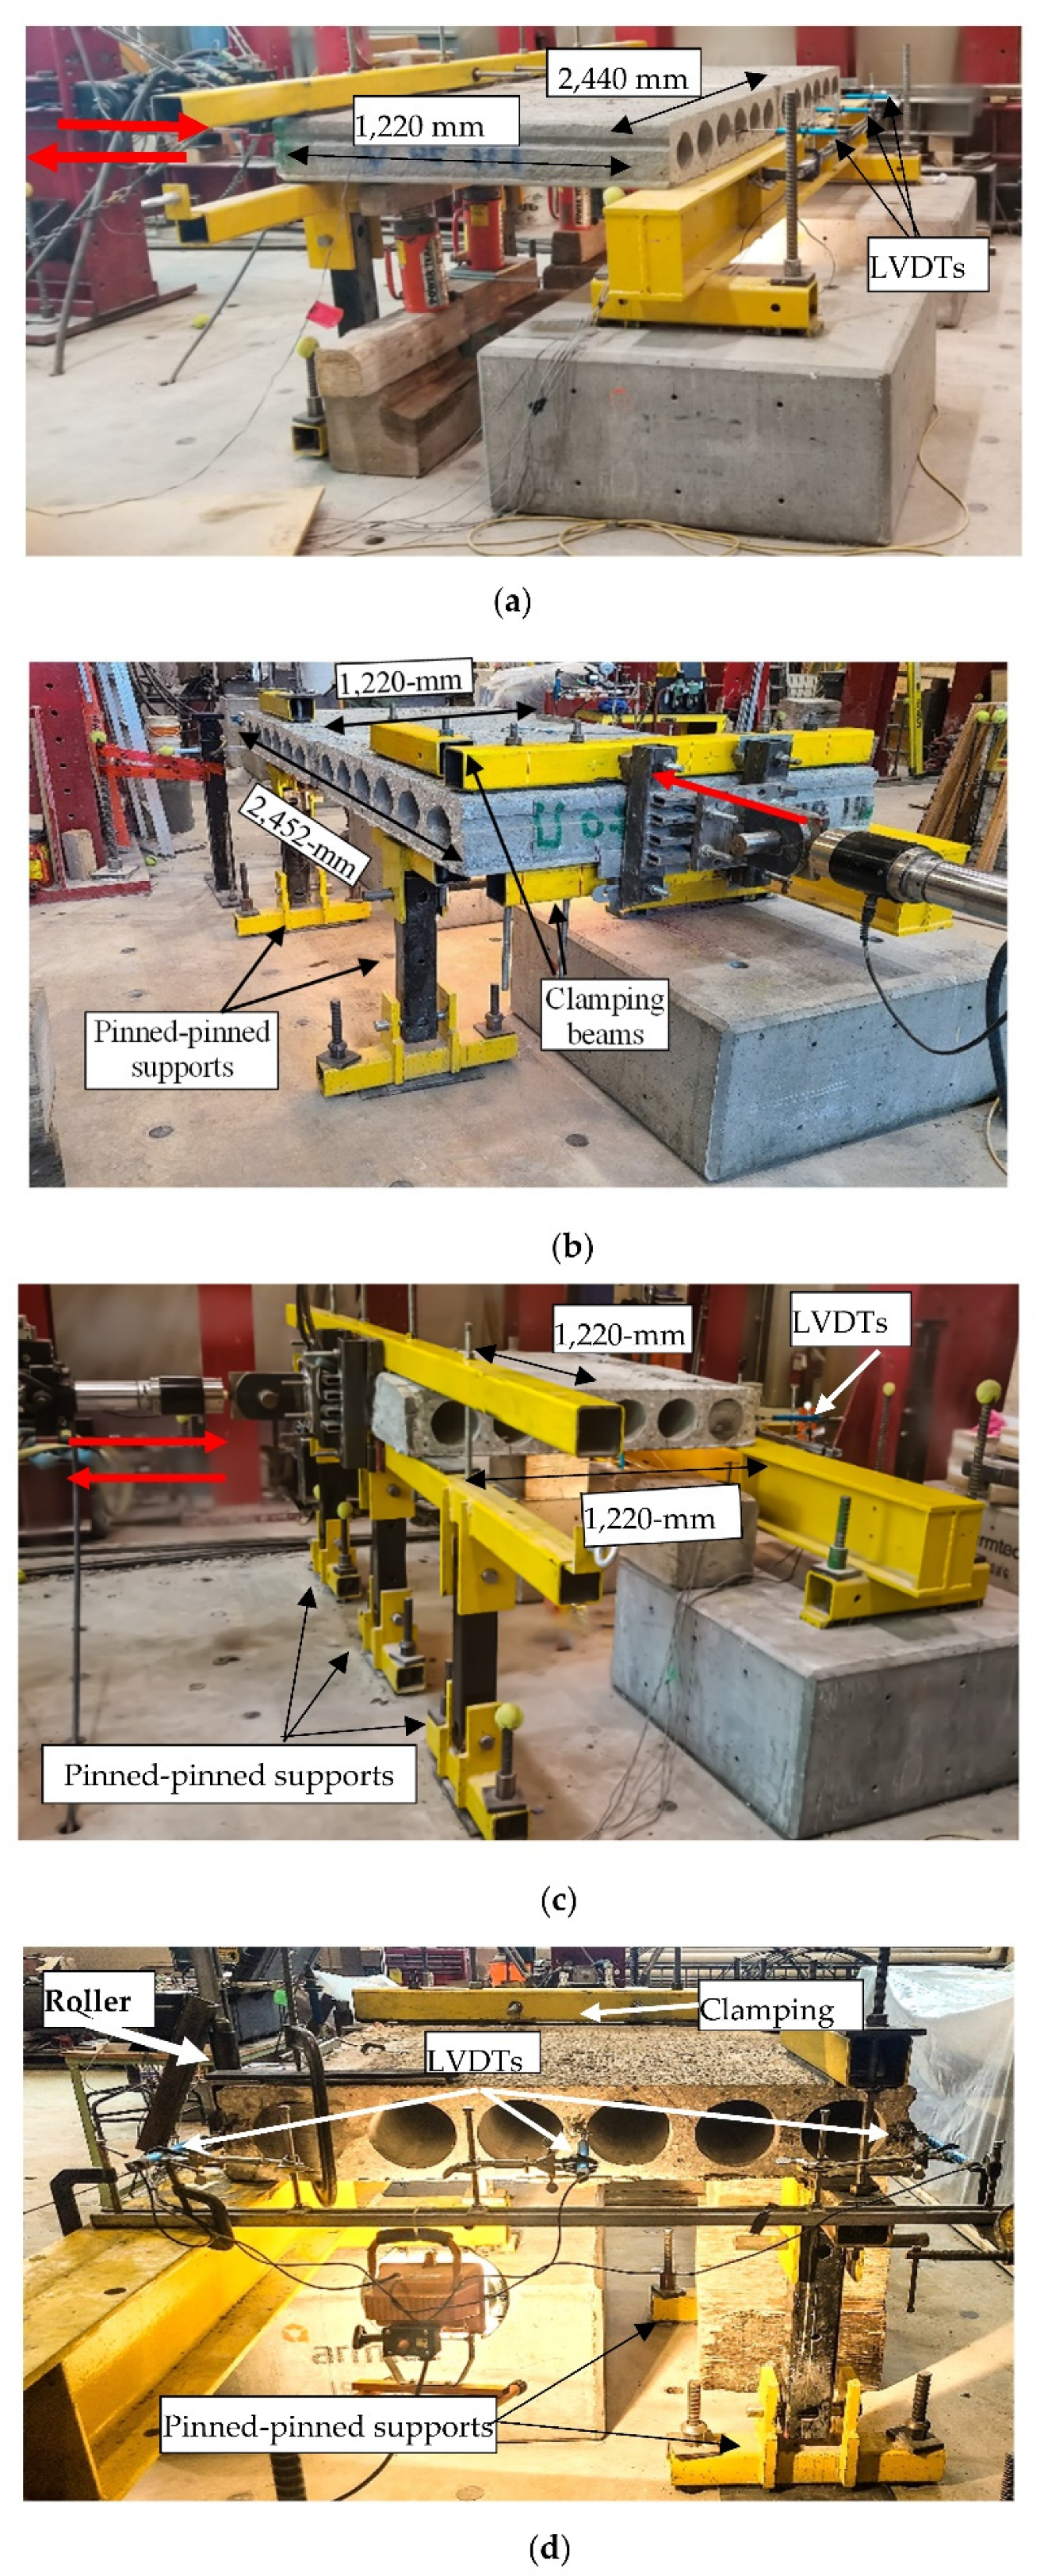
3.3. Test Setup and Instrumentation
4. Test Results and Discussion
4.1. Mode of Failure
4.1.1. Specimens of Series I—End-Bearing Connections
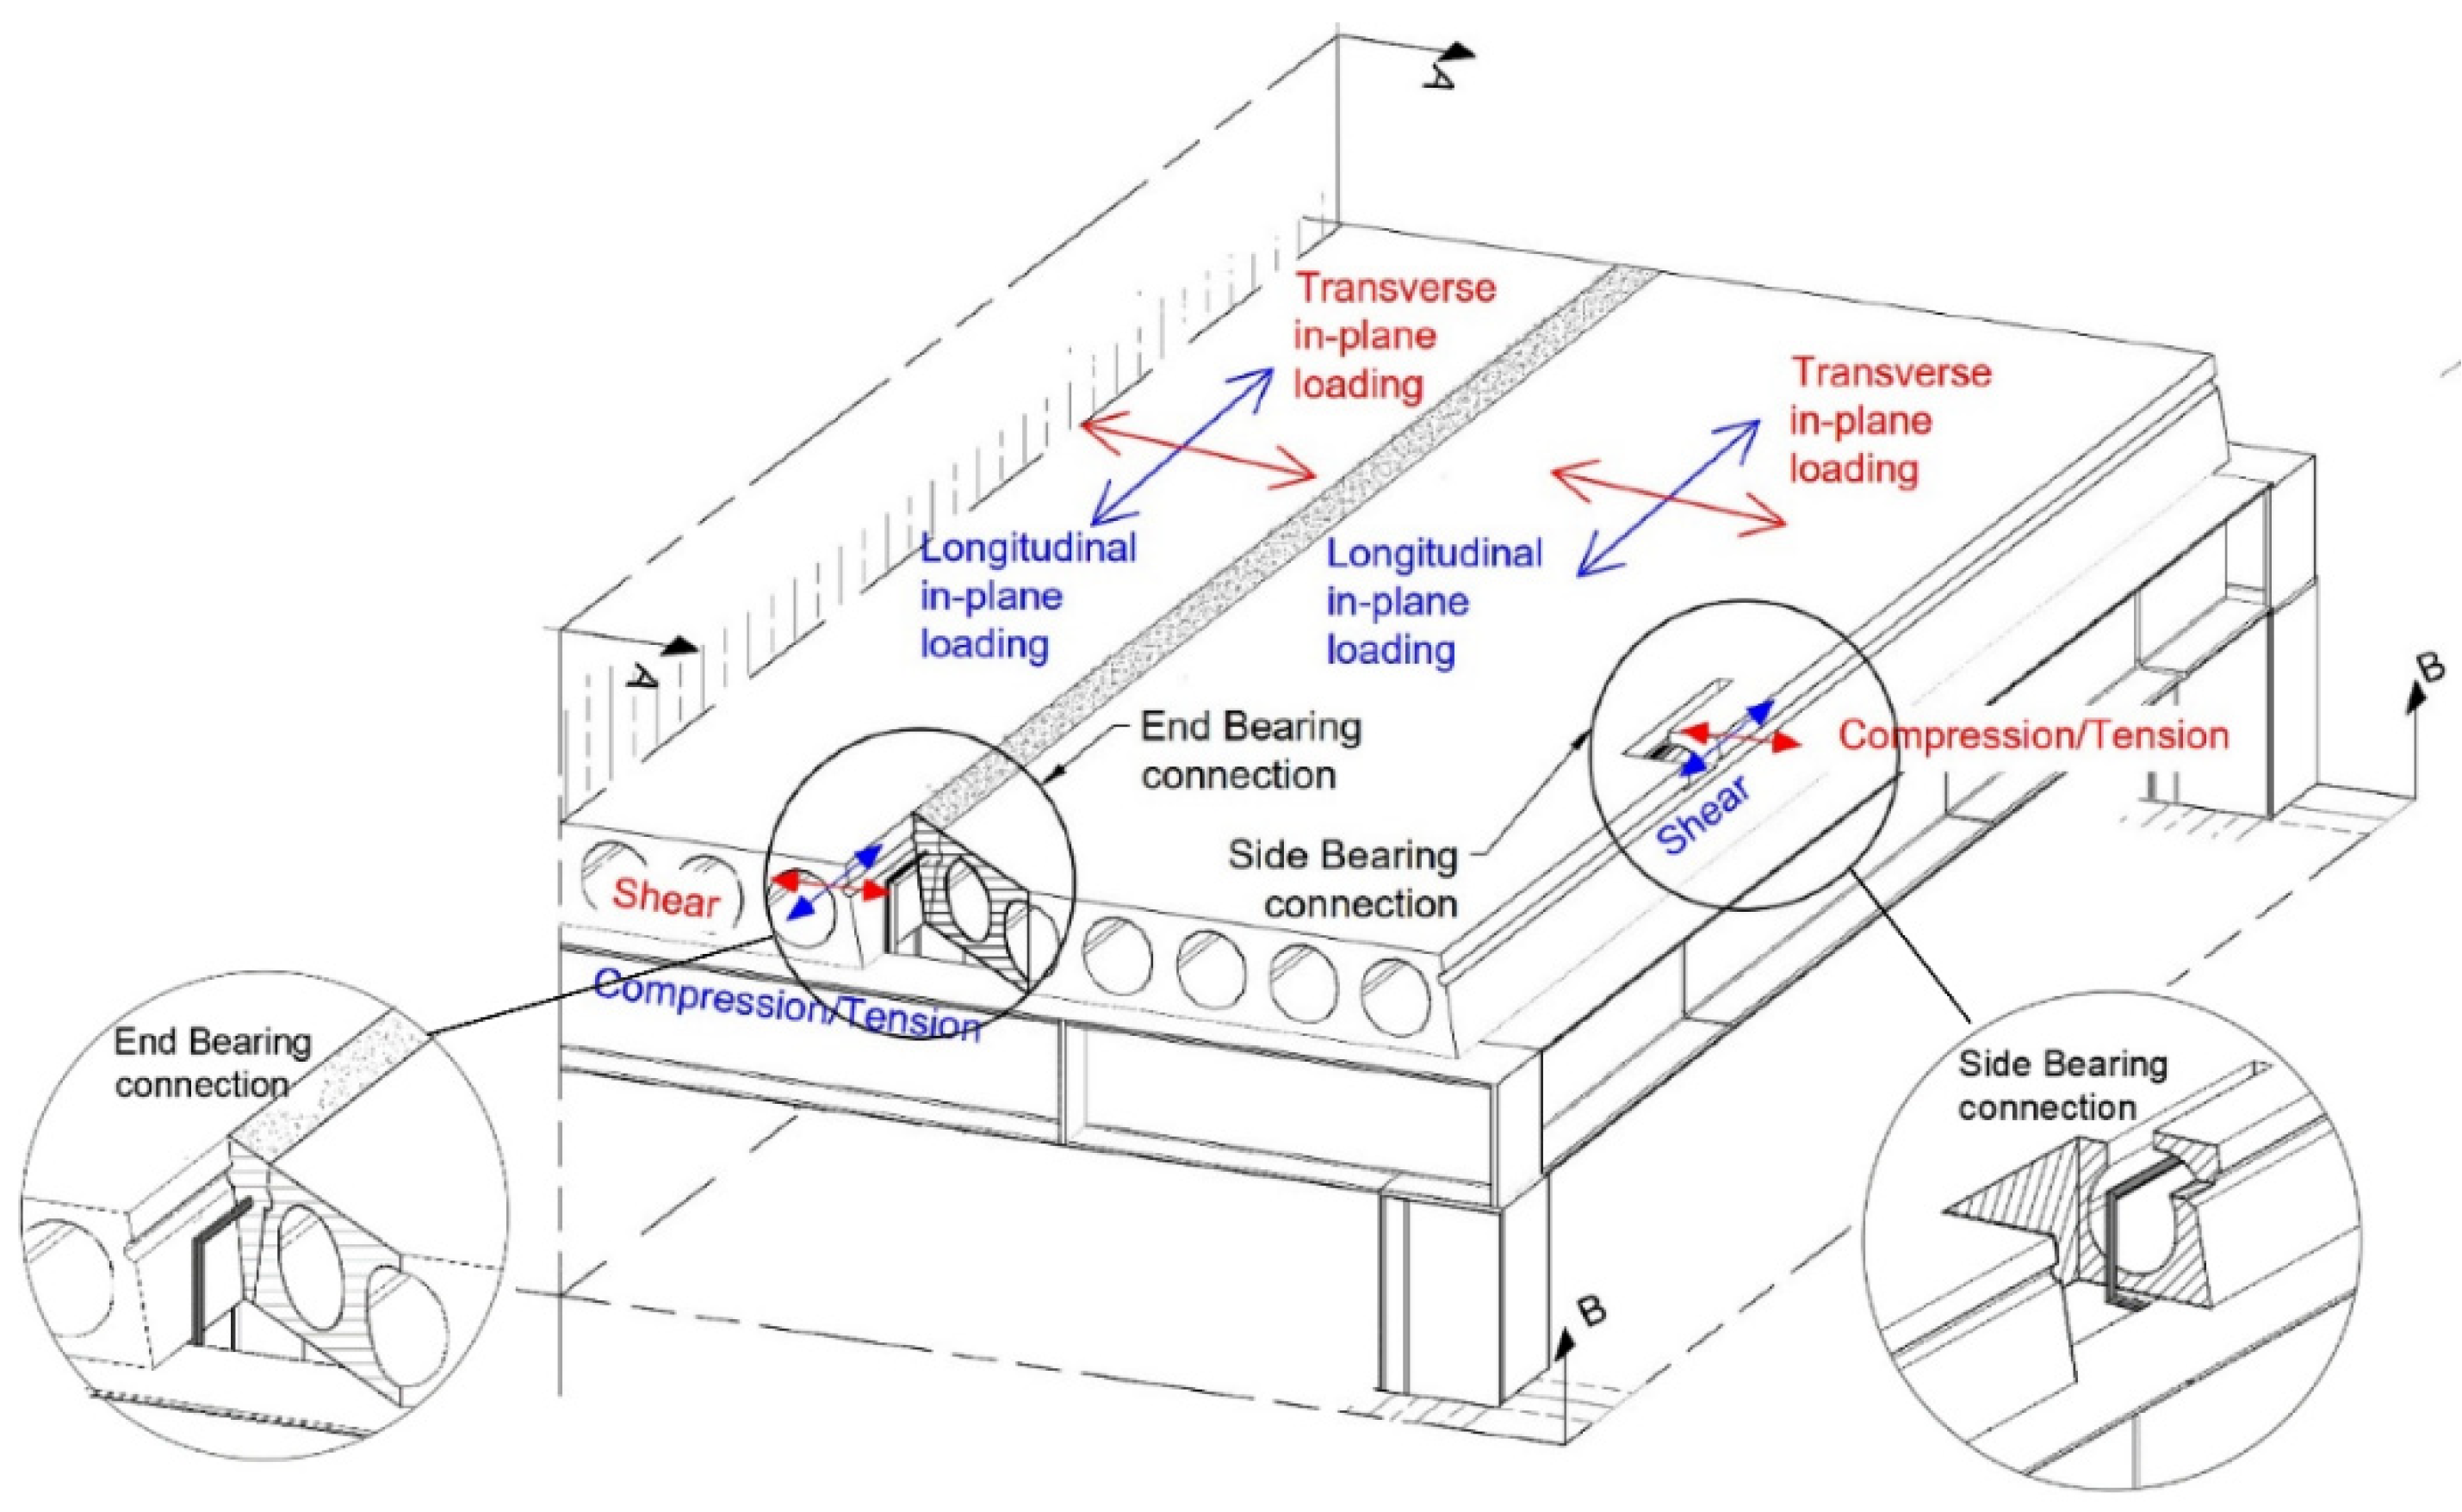
Loading Normal to the Axis of the Supporting Beam
Loading Parallel to the Axis of the Supporting Beam
4.1.2. Specimens of Series II—Side-Bearing Connection
Loading Normal to the Axis of the Supporting Beam
Loading Parallel to the Axis of the Supporting Beam
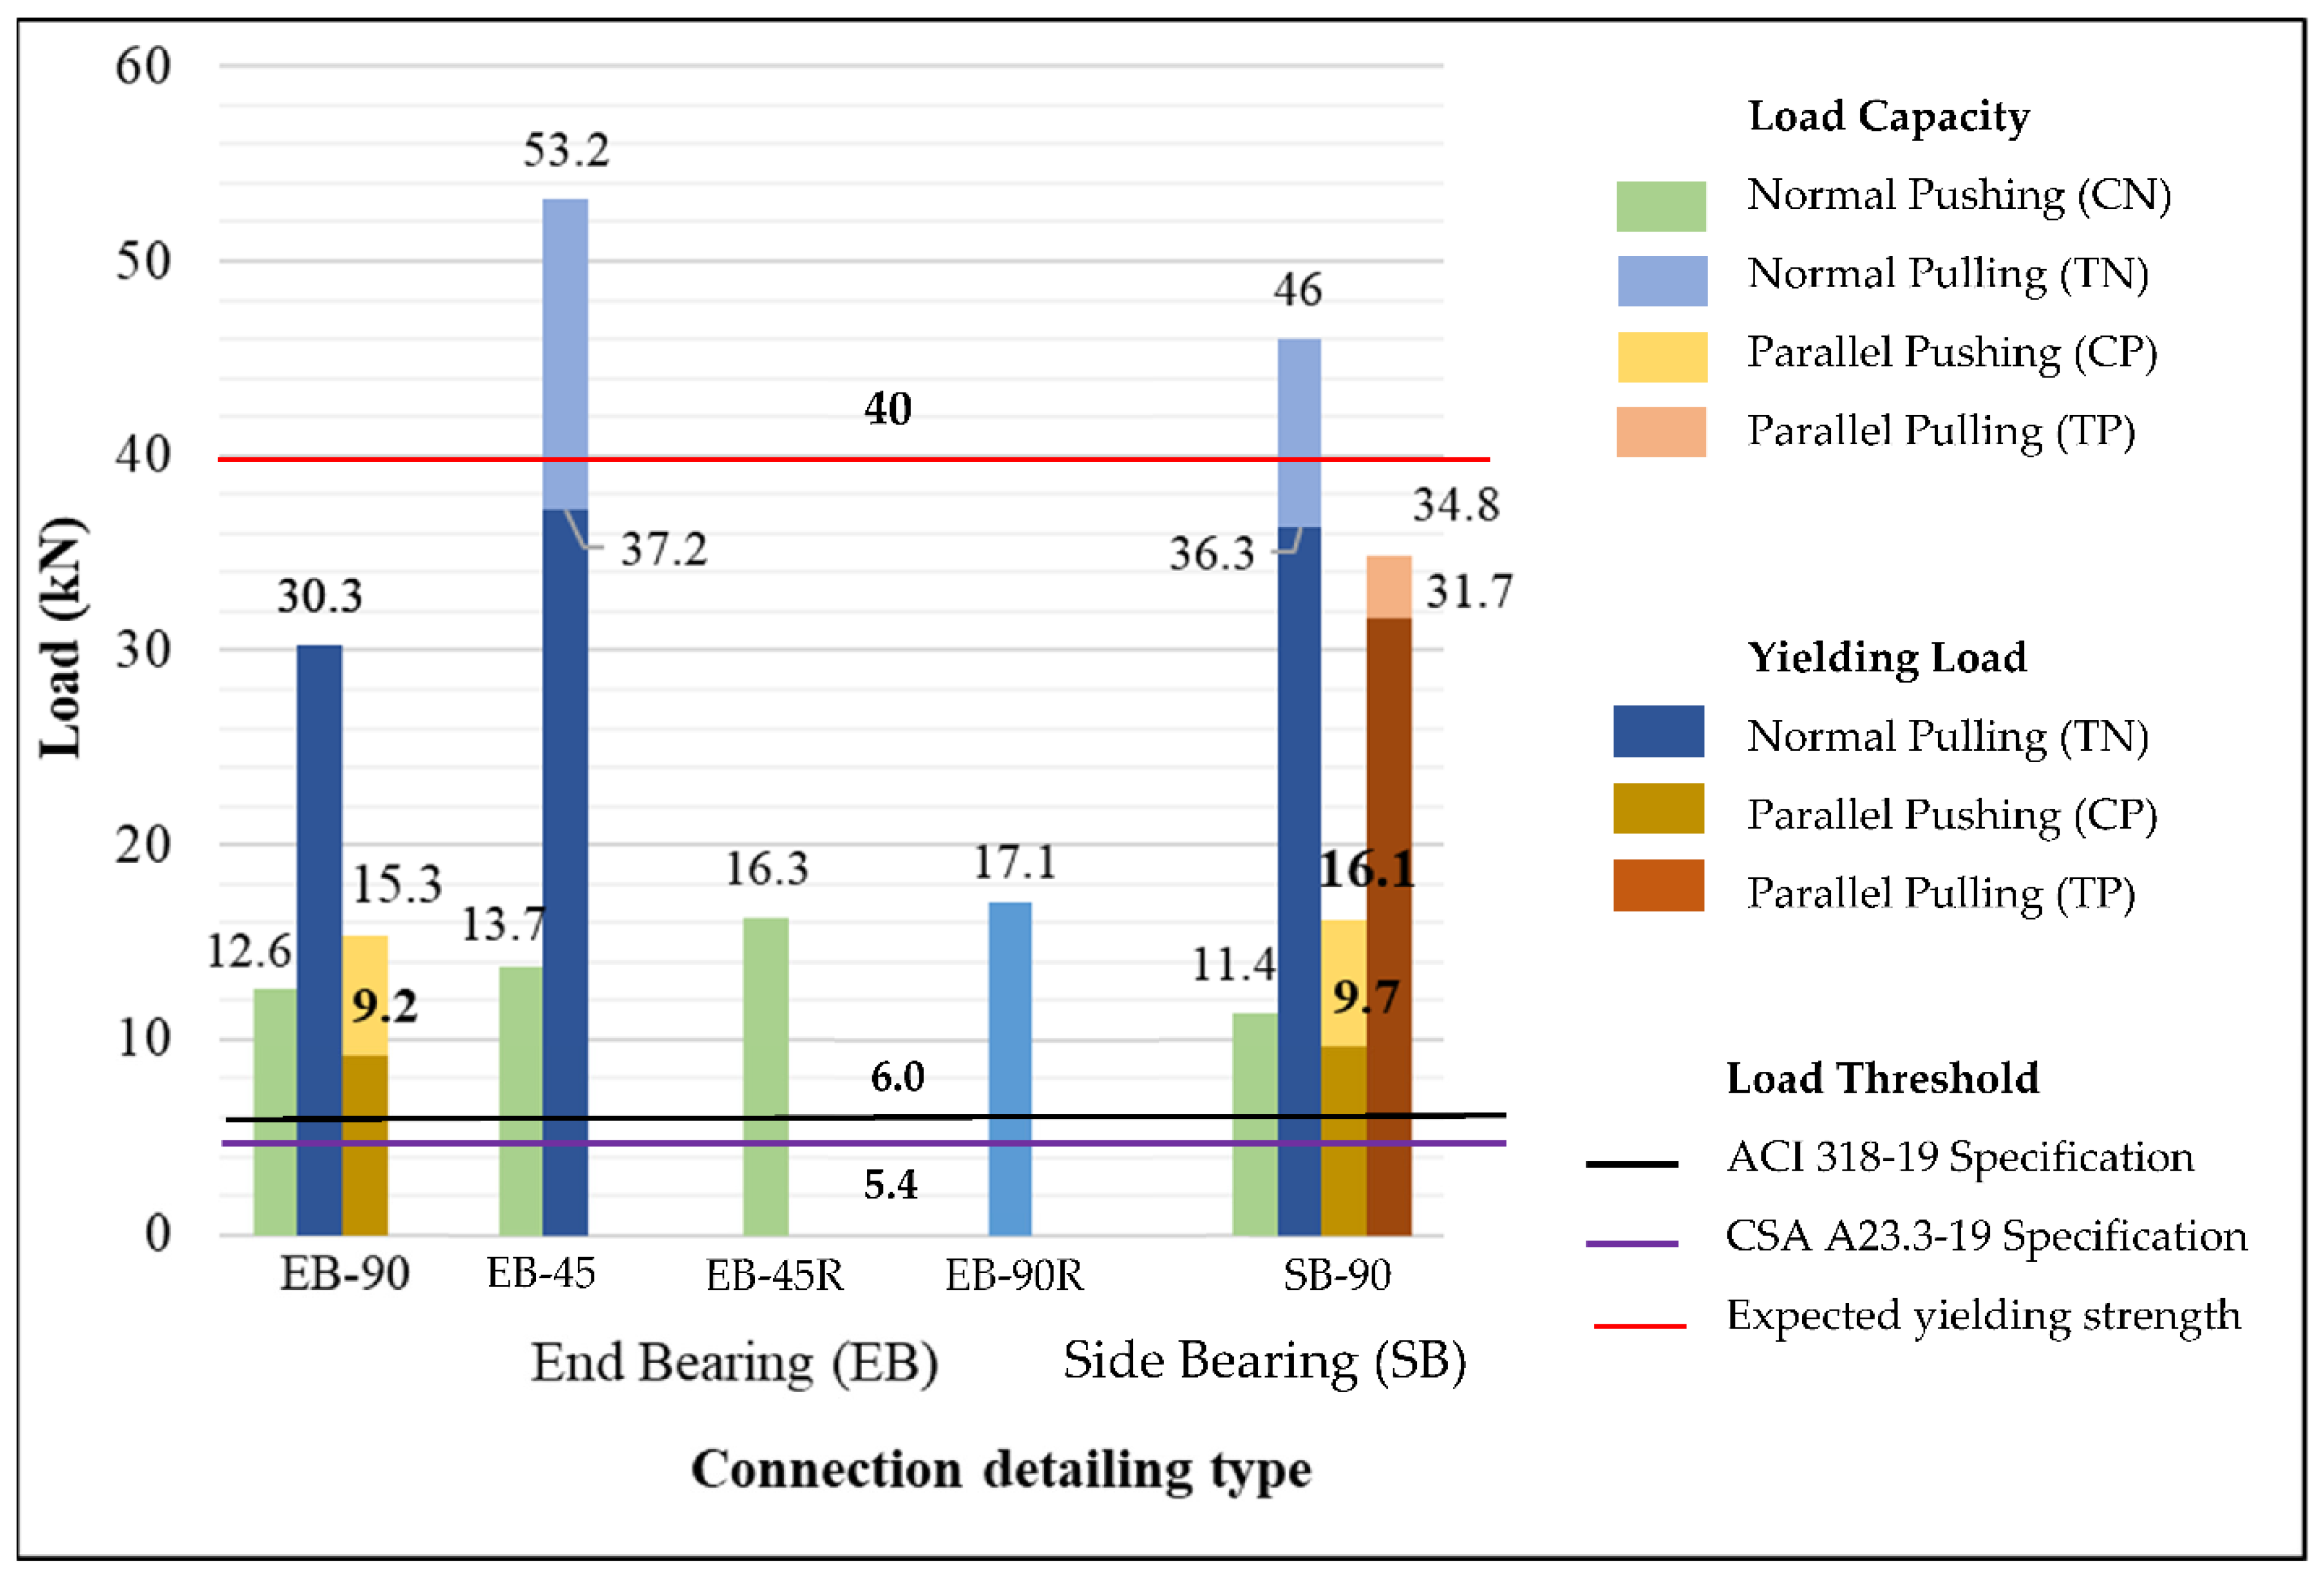
4.2. Connection Load Capacity
4.2.1. Specimens of Series I—End-Bearing Connection
Loading Normal to the Axis of the Supporting Beam
Loading Parallel to the Axis of the Supporting Beam
4.2.2. Specimens of Series II—Side-Bearing Connection
Loading Normal to the Axis of the Supporting Beam
Loading Parallel to the Axis of the Supporting Beam
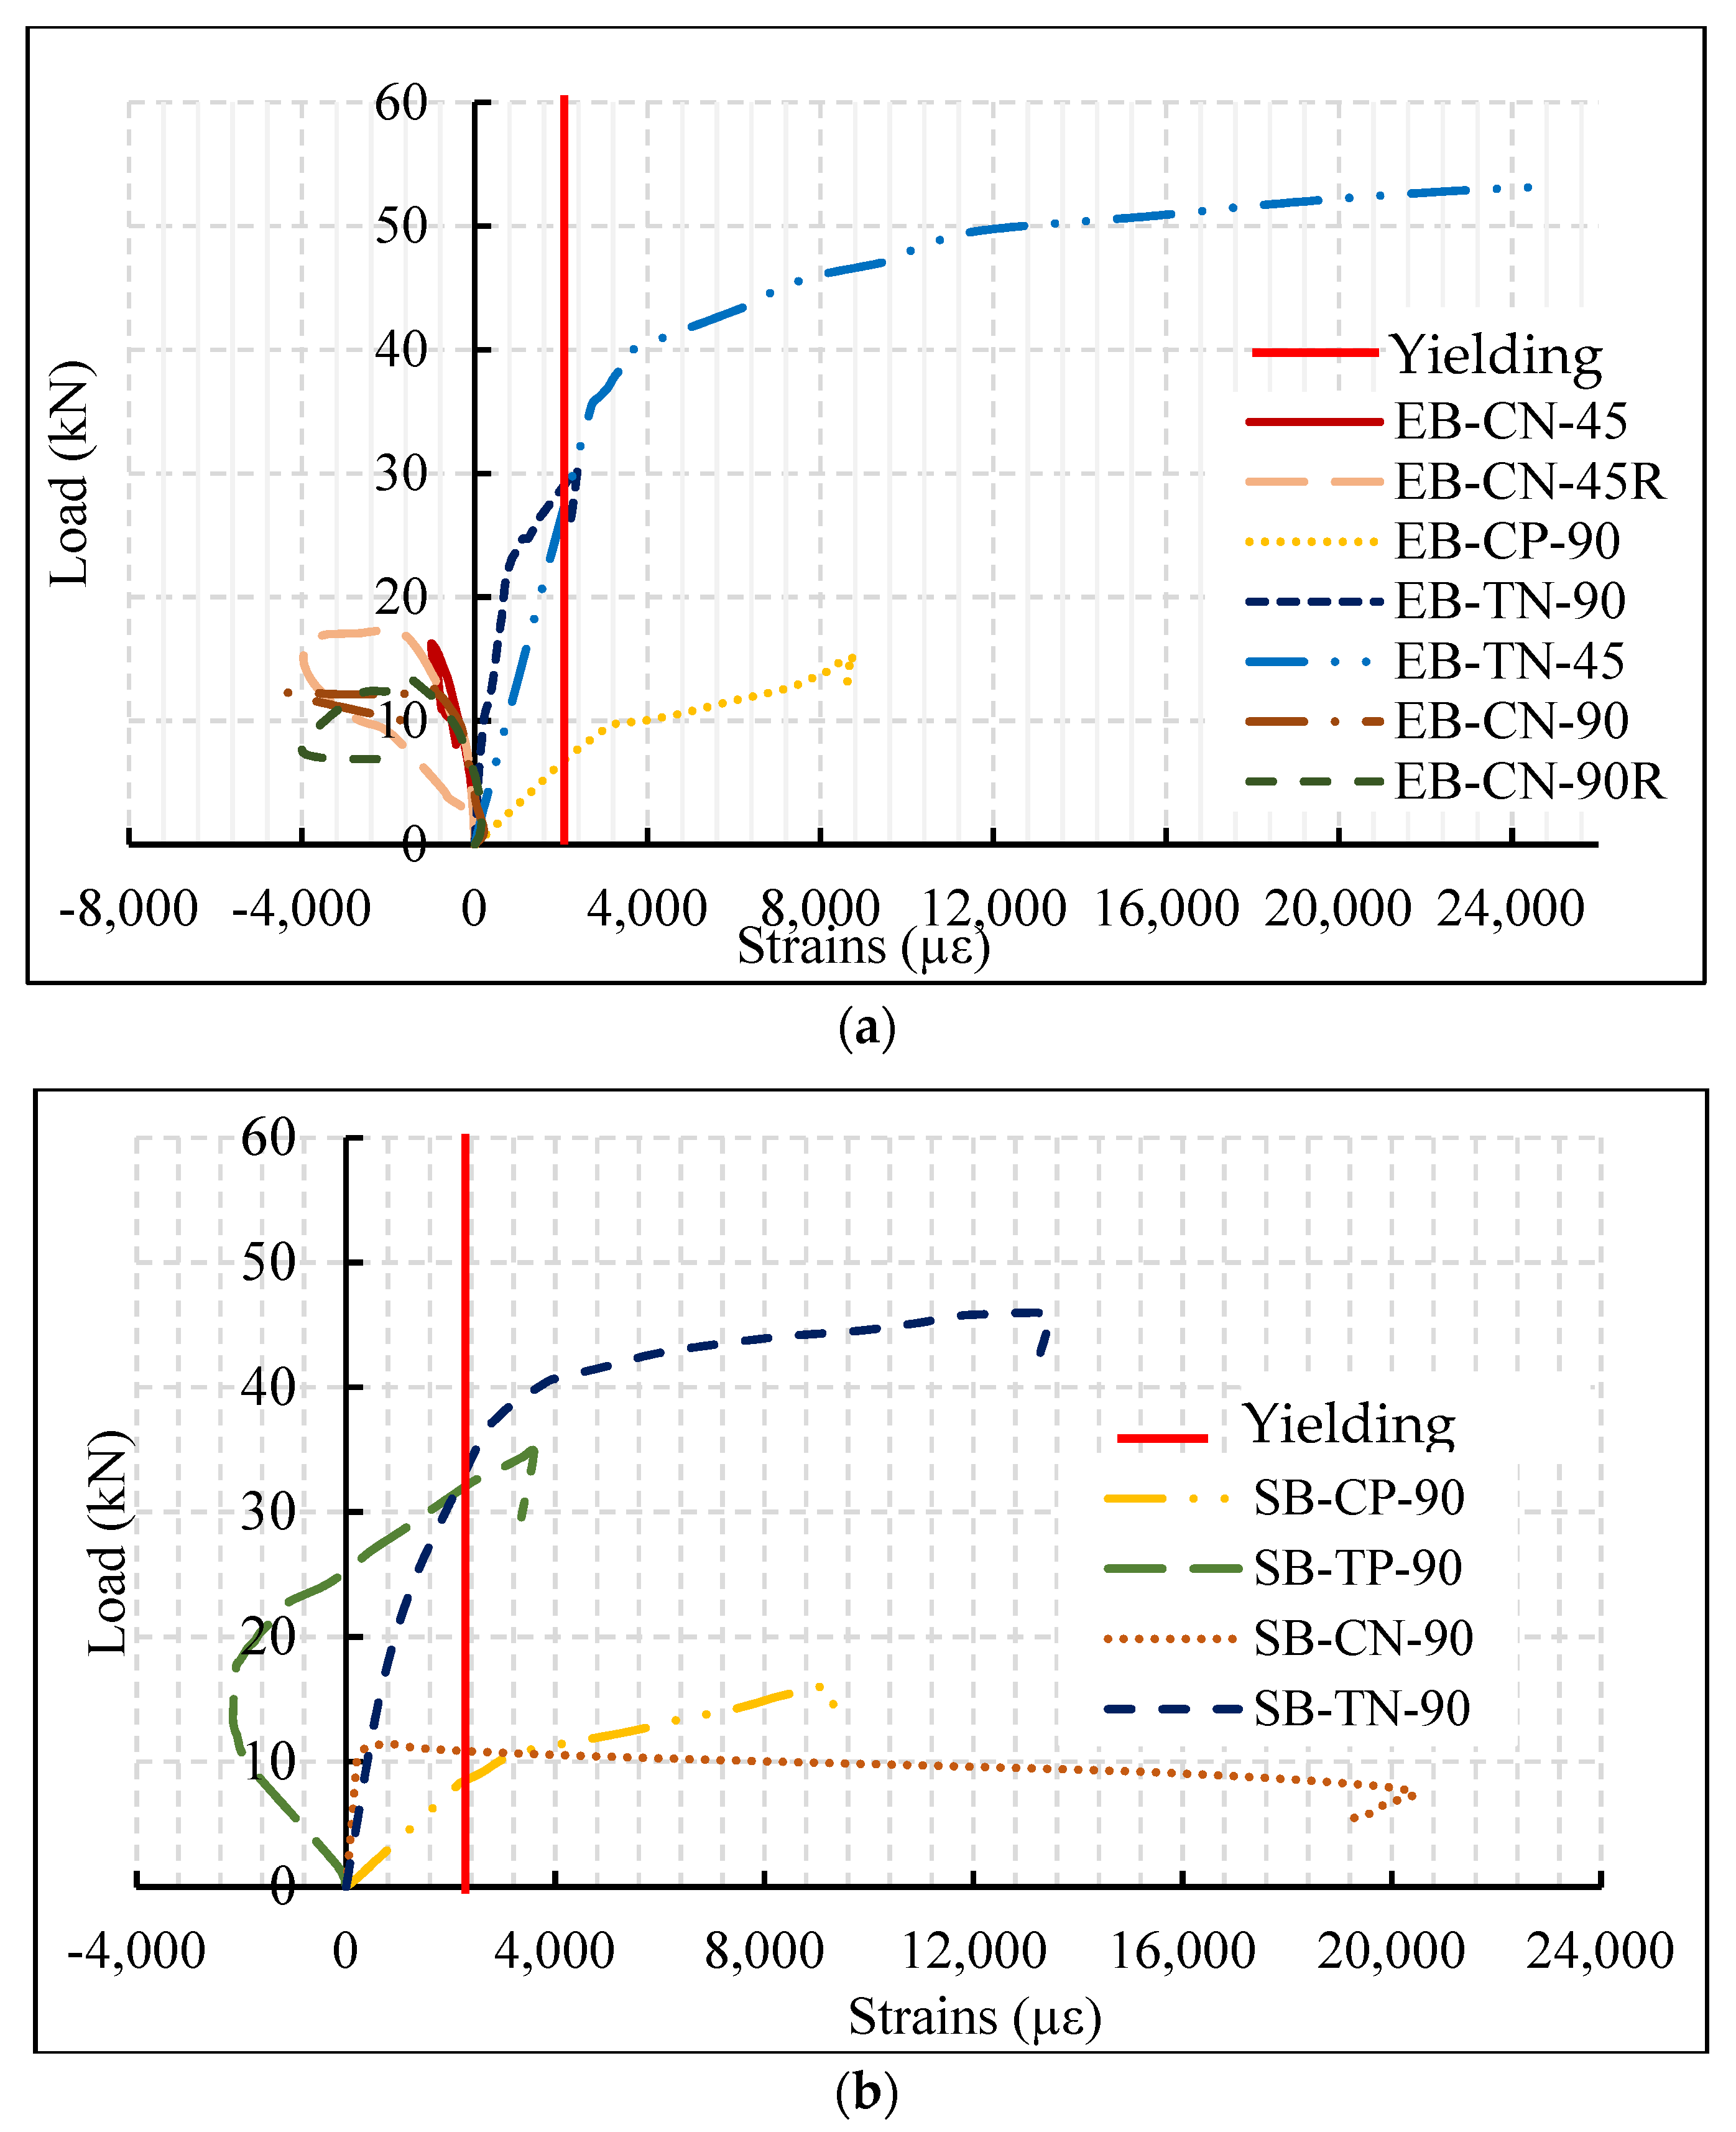
4.3. Strains in the Connection Bar
4.3.1. Specimens of Series I—End-Bearing Connection
Loading Normal to the Axis of the Supporting Beam
Loading Parallel to the Axis of the Supporting Beam
4.3.2. Specimens of Series II—Side-Bearing Connection
Loading Normal to the Axis of the Supporting Beam
Loading Parallel to the Axis of the Supporting Beam
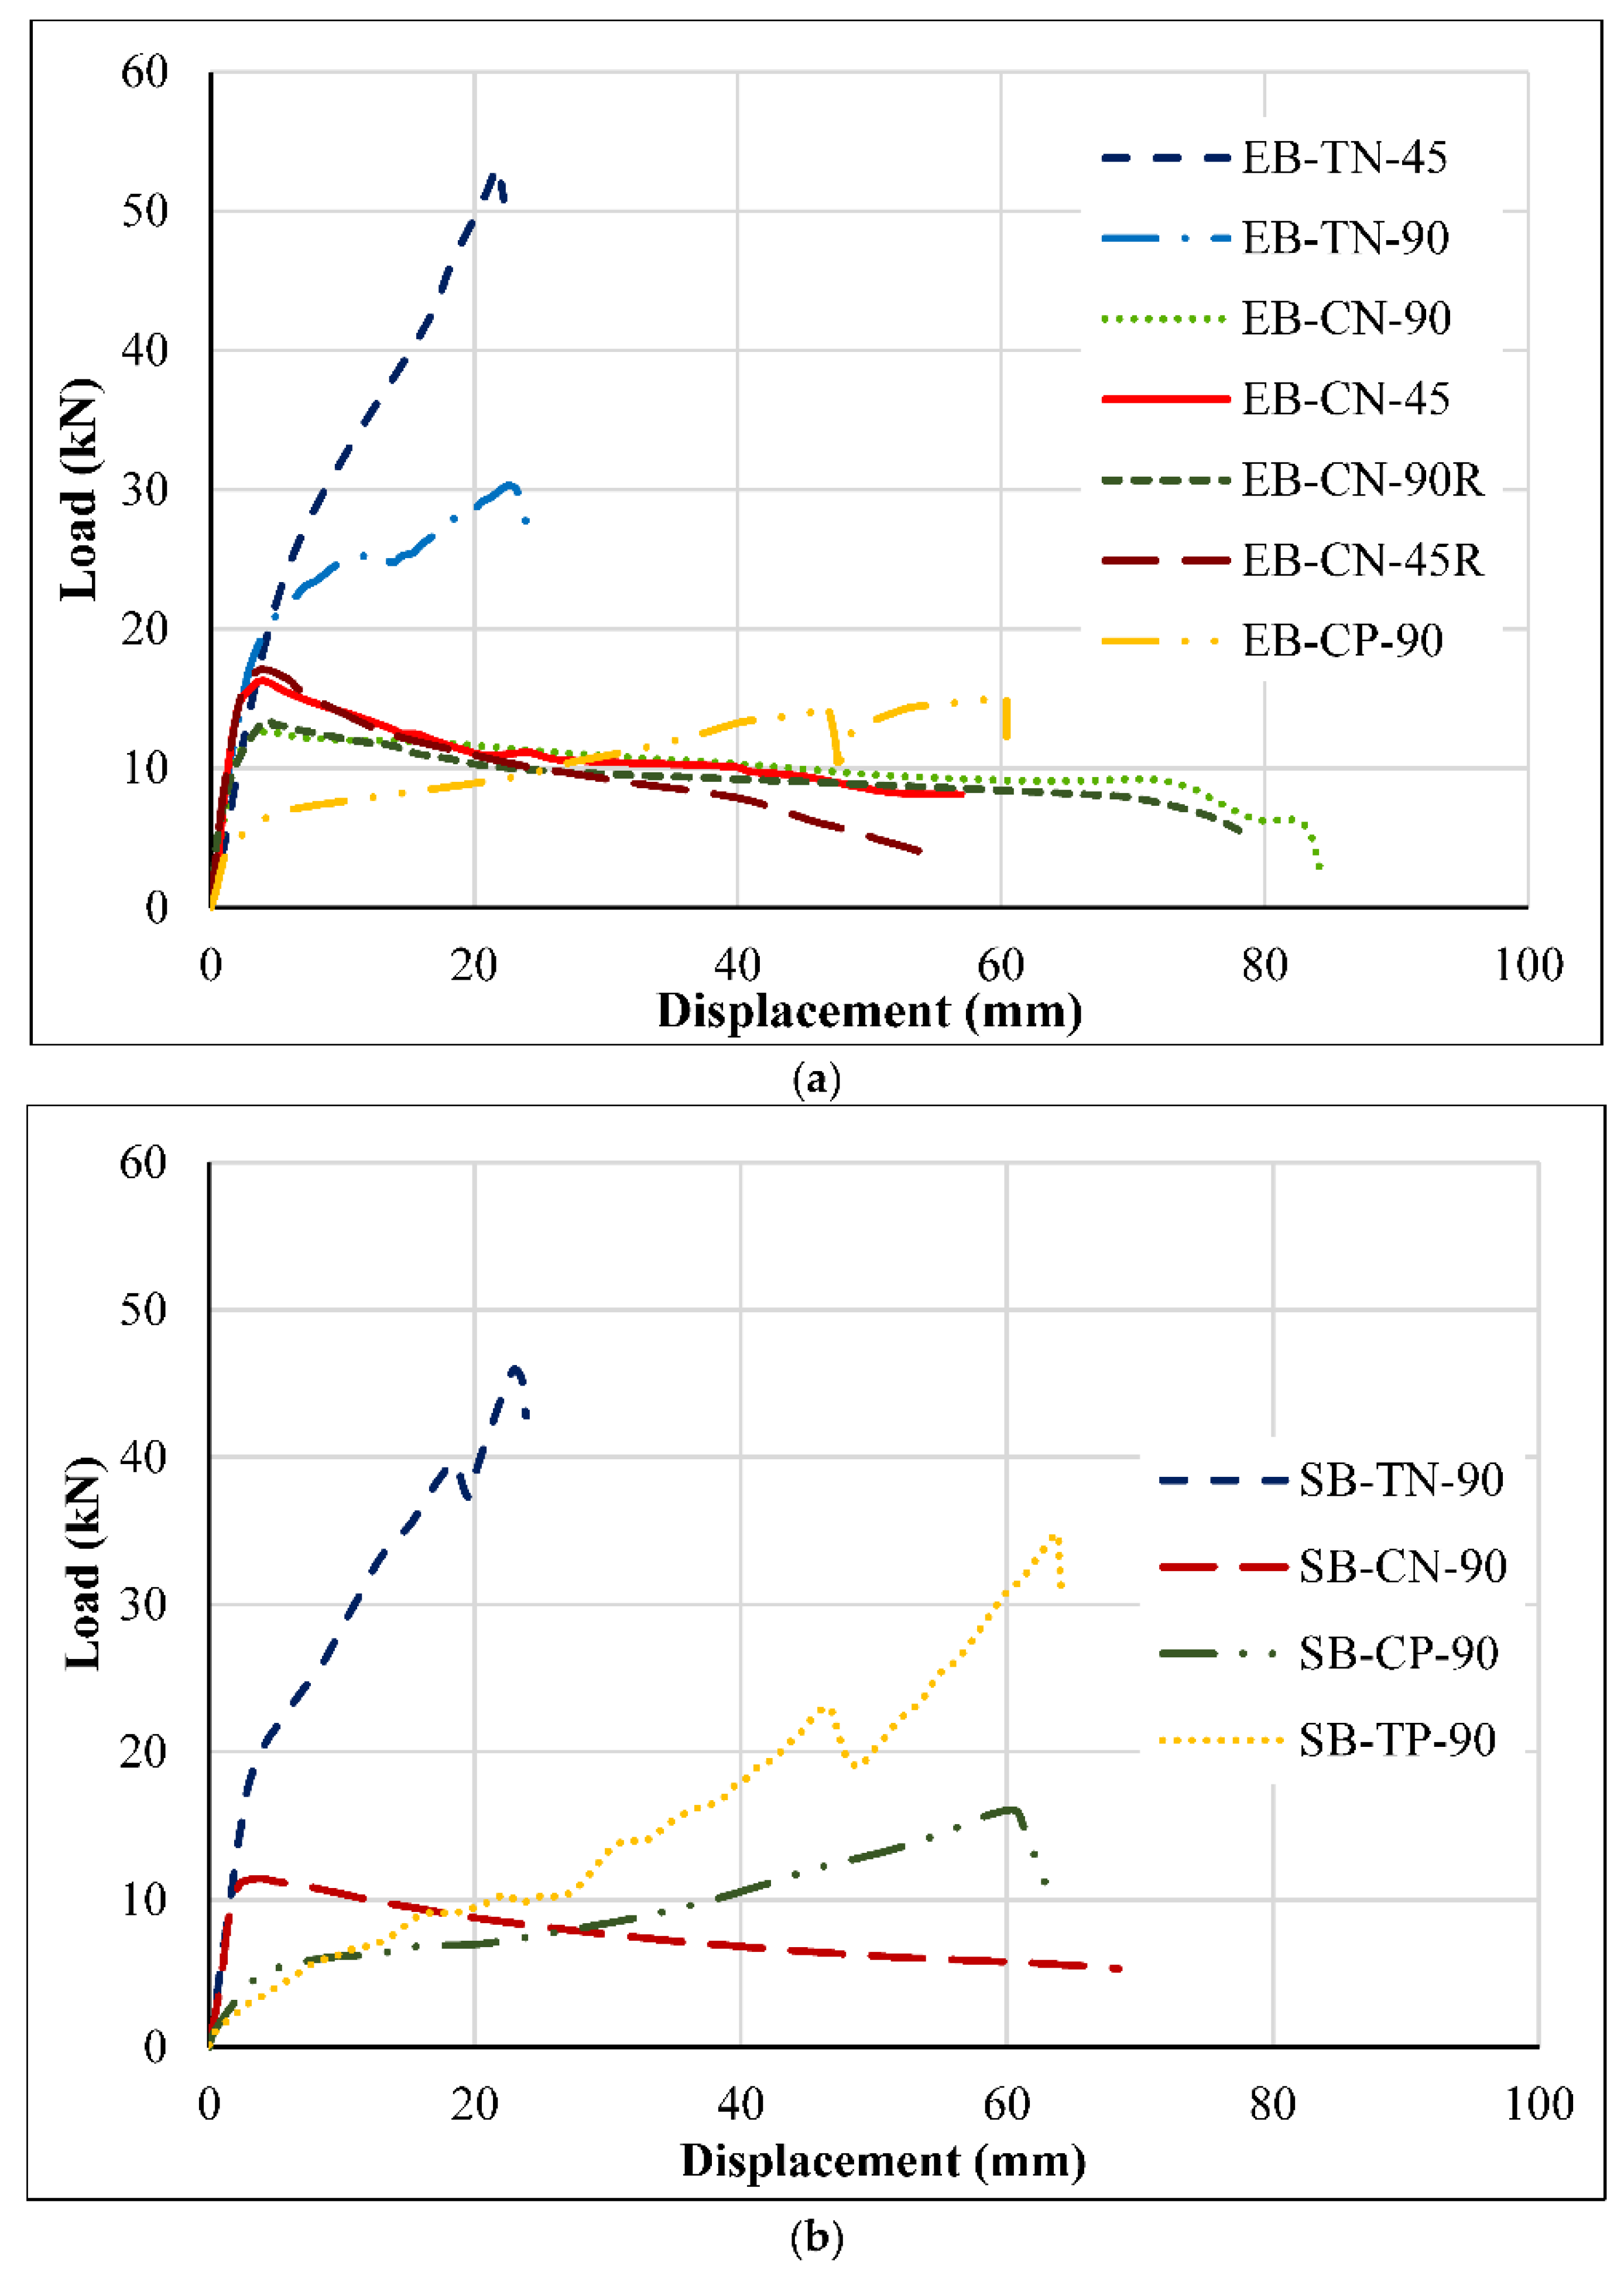
4.4. Displacements in the Slabs
4.4.1. Specimens of Series I—End-Bearing Connection
Loading Normal to the Axis of the Supporting Beam
Loading Parallel to the Axis of the Supporting Beam
4.4.2. Specimens of Series II—Side-Bearing Connection
Loading Normal to the Axis of the Supporting Beam
Loading Parallel to the Axis of the Supporting Beam
5. Conclusions
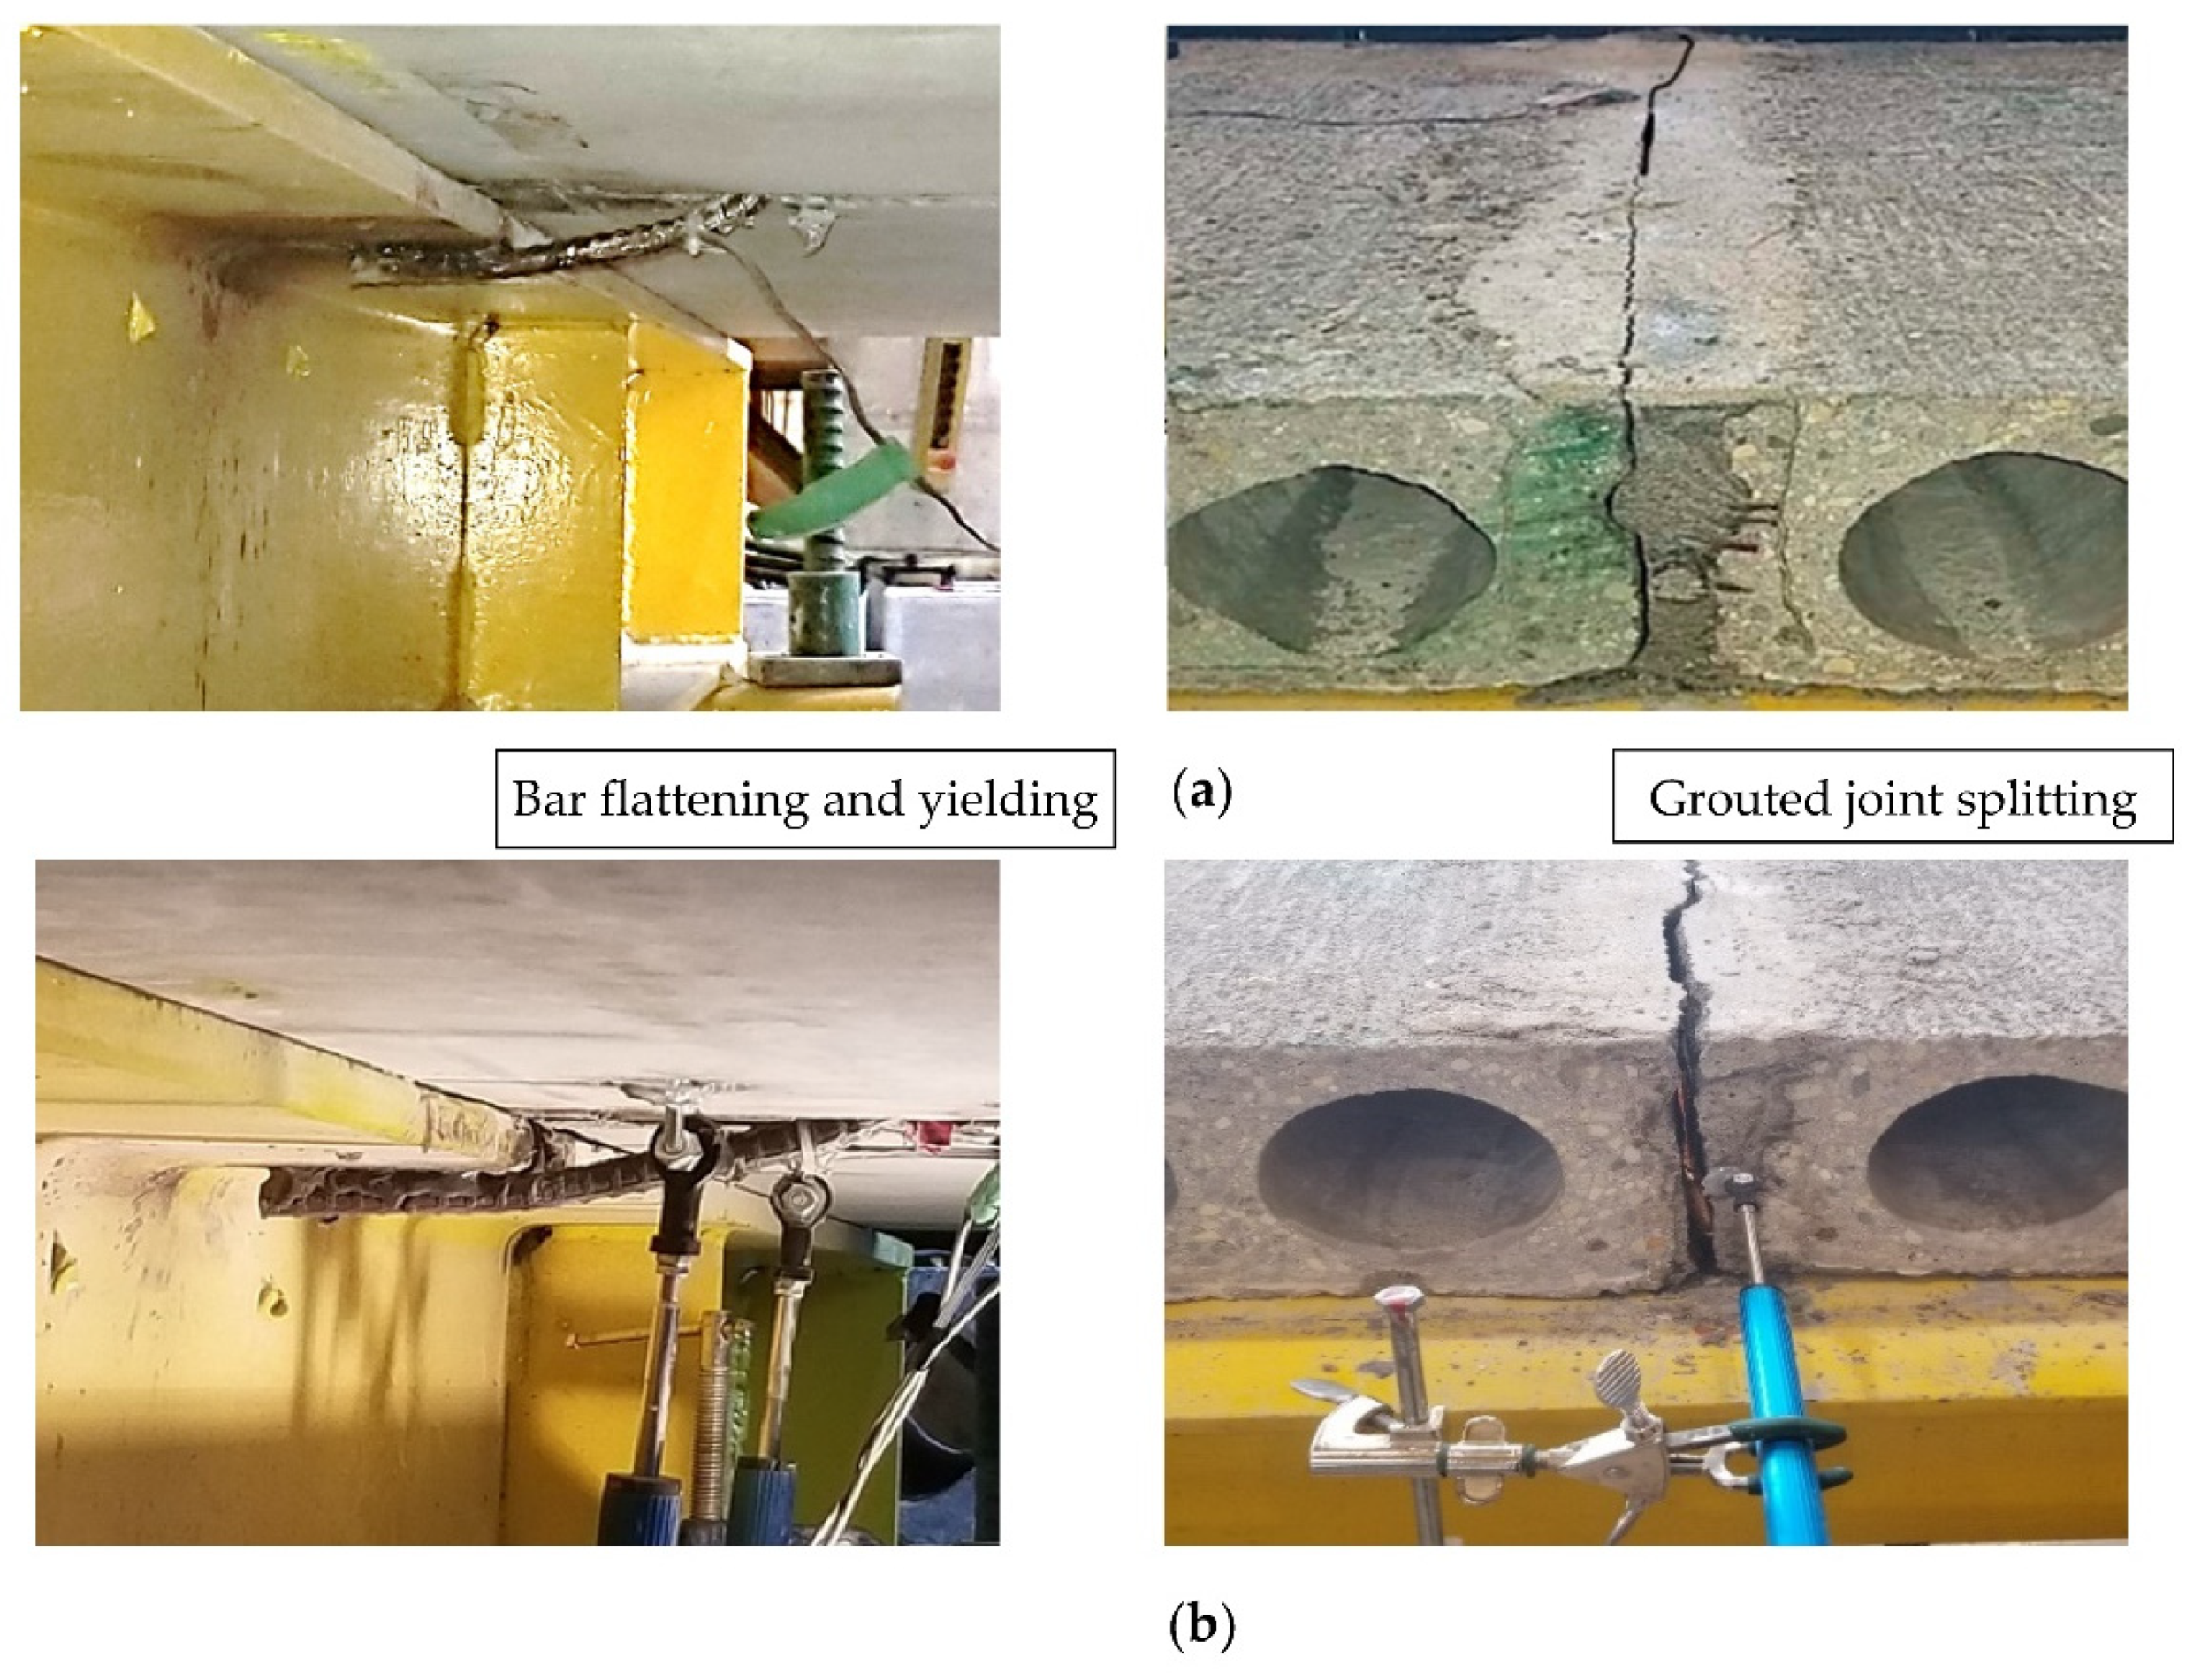
- Specimens tested under tension (pulling normal to support) forces or parallel loads (regardless of load direction) reached yielding or close-to-yielding strains before the peak load. After yielding, the specimens tested under tension forces failed due to grout splitting. However, specimens tested under parallel loads (pushing or pulling) experienced relatively large deformations and yielding under relatively lower loading levels, and no grout or slab cracking was observed after yielding.
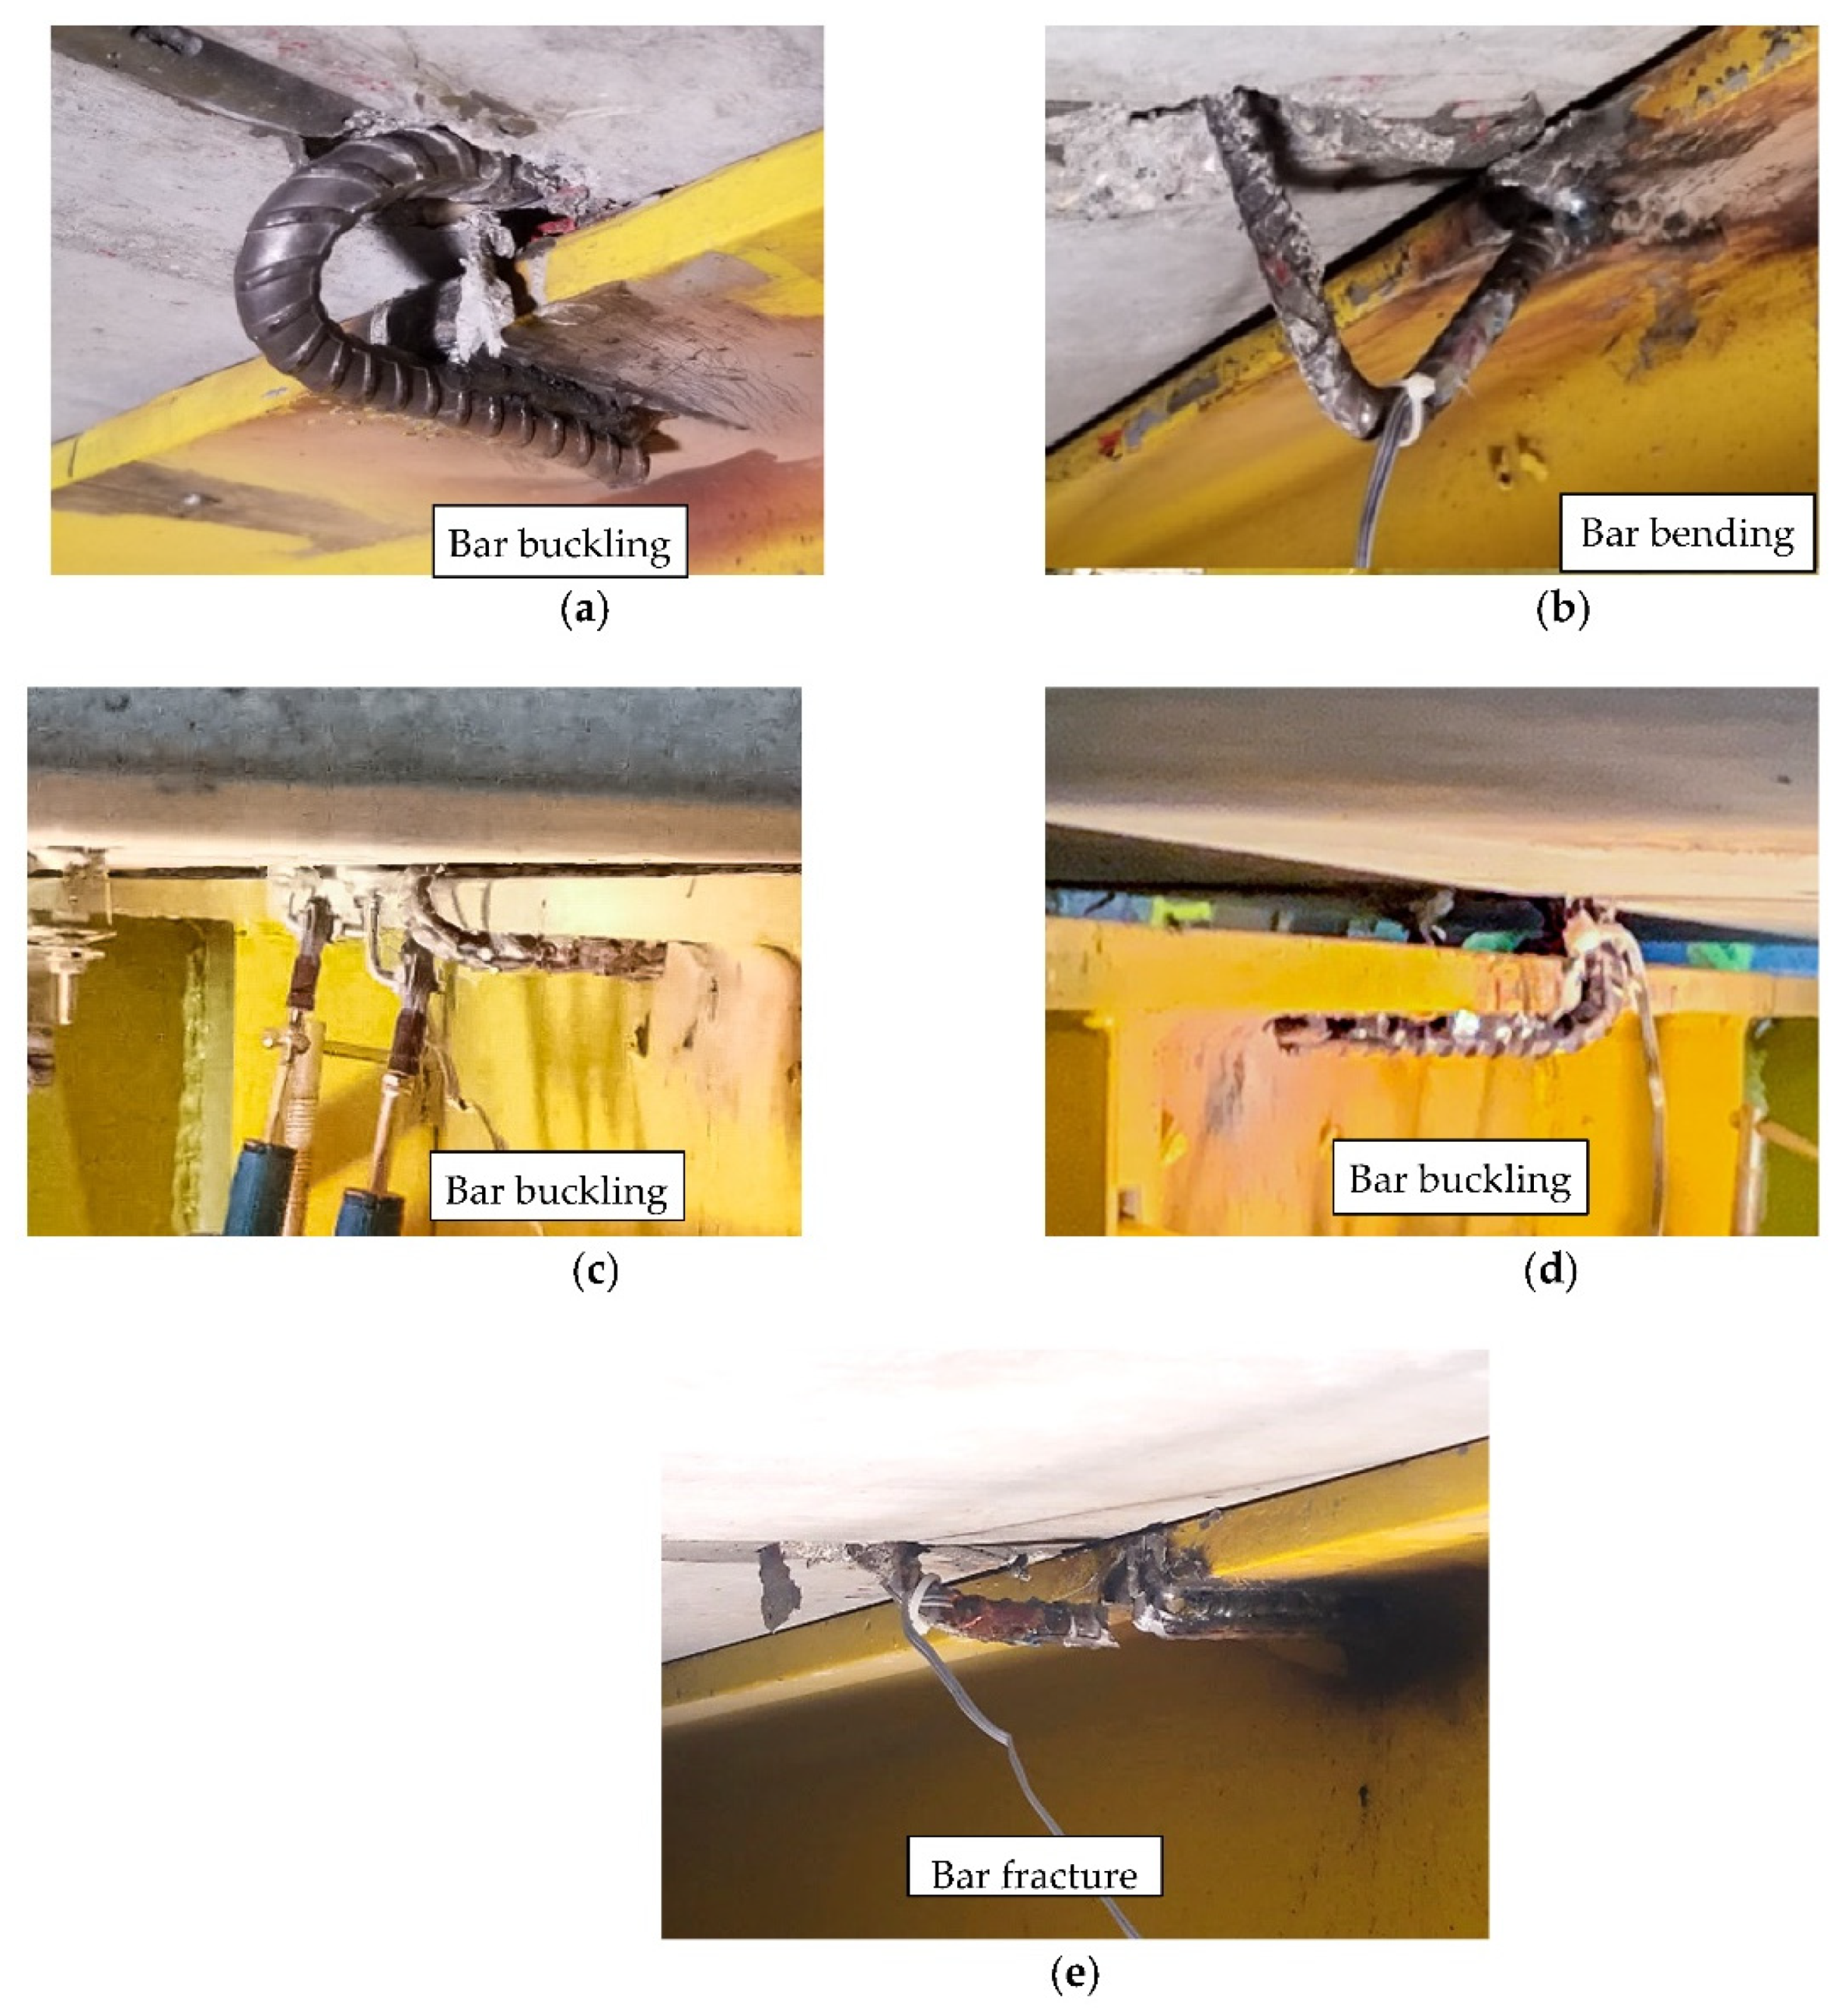
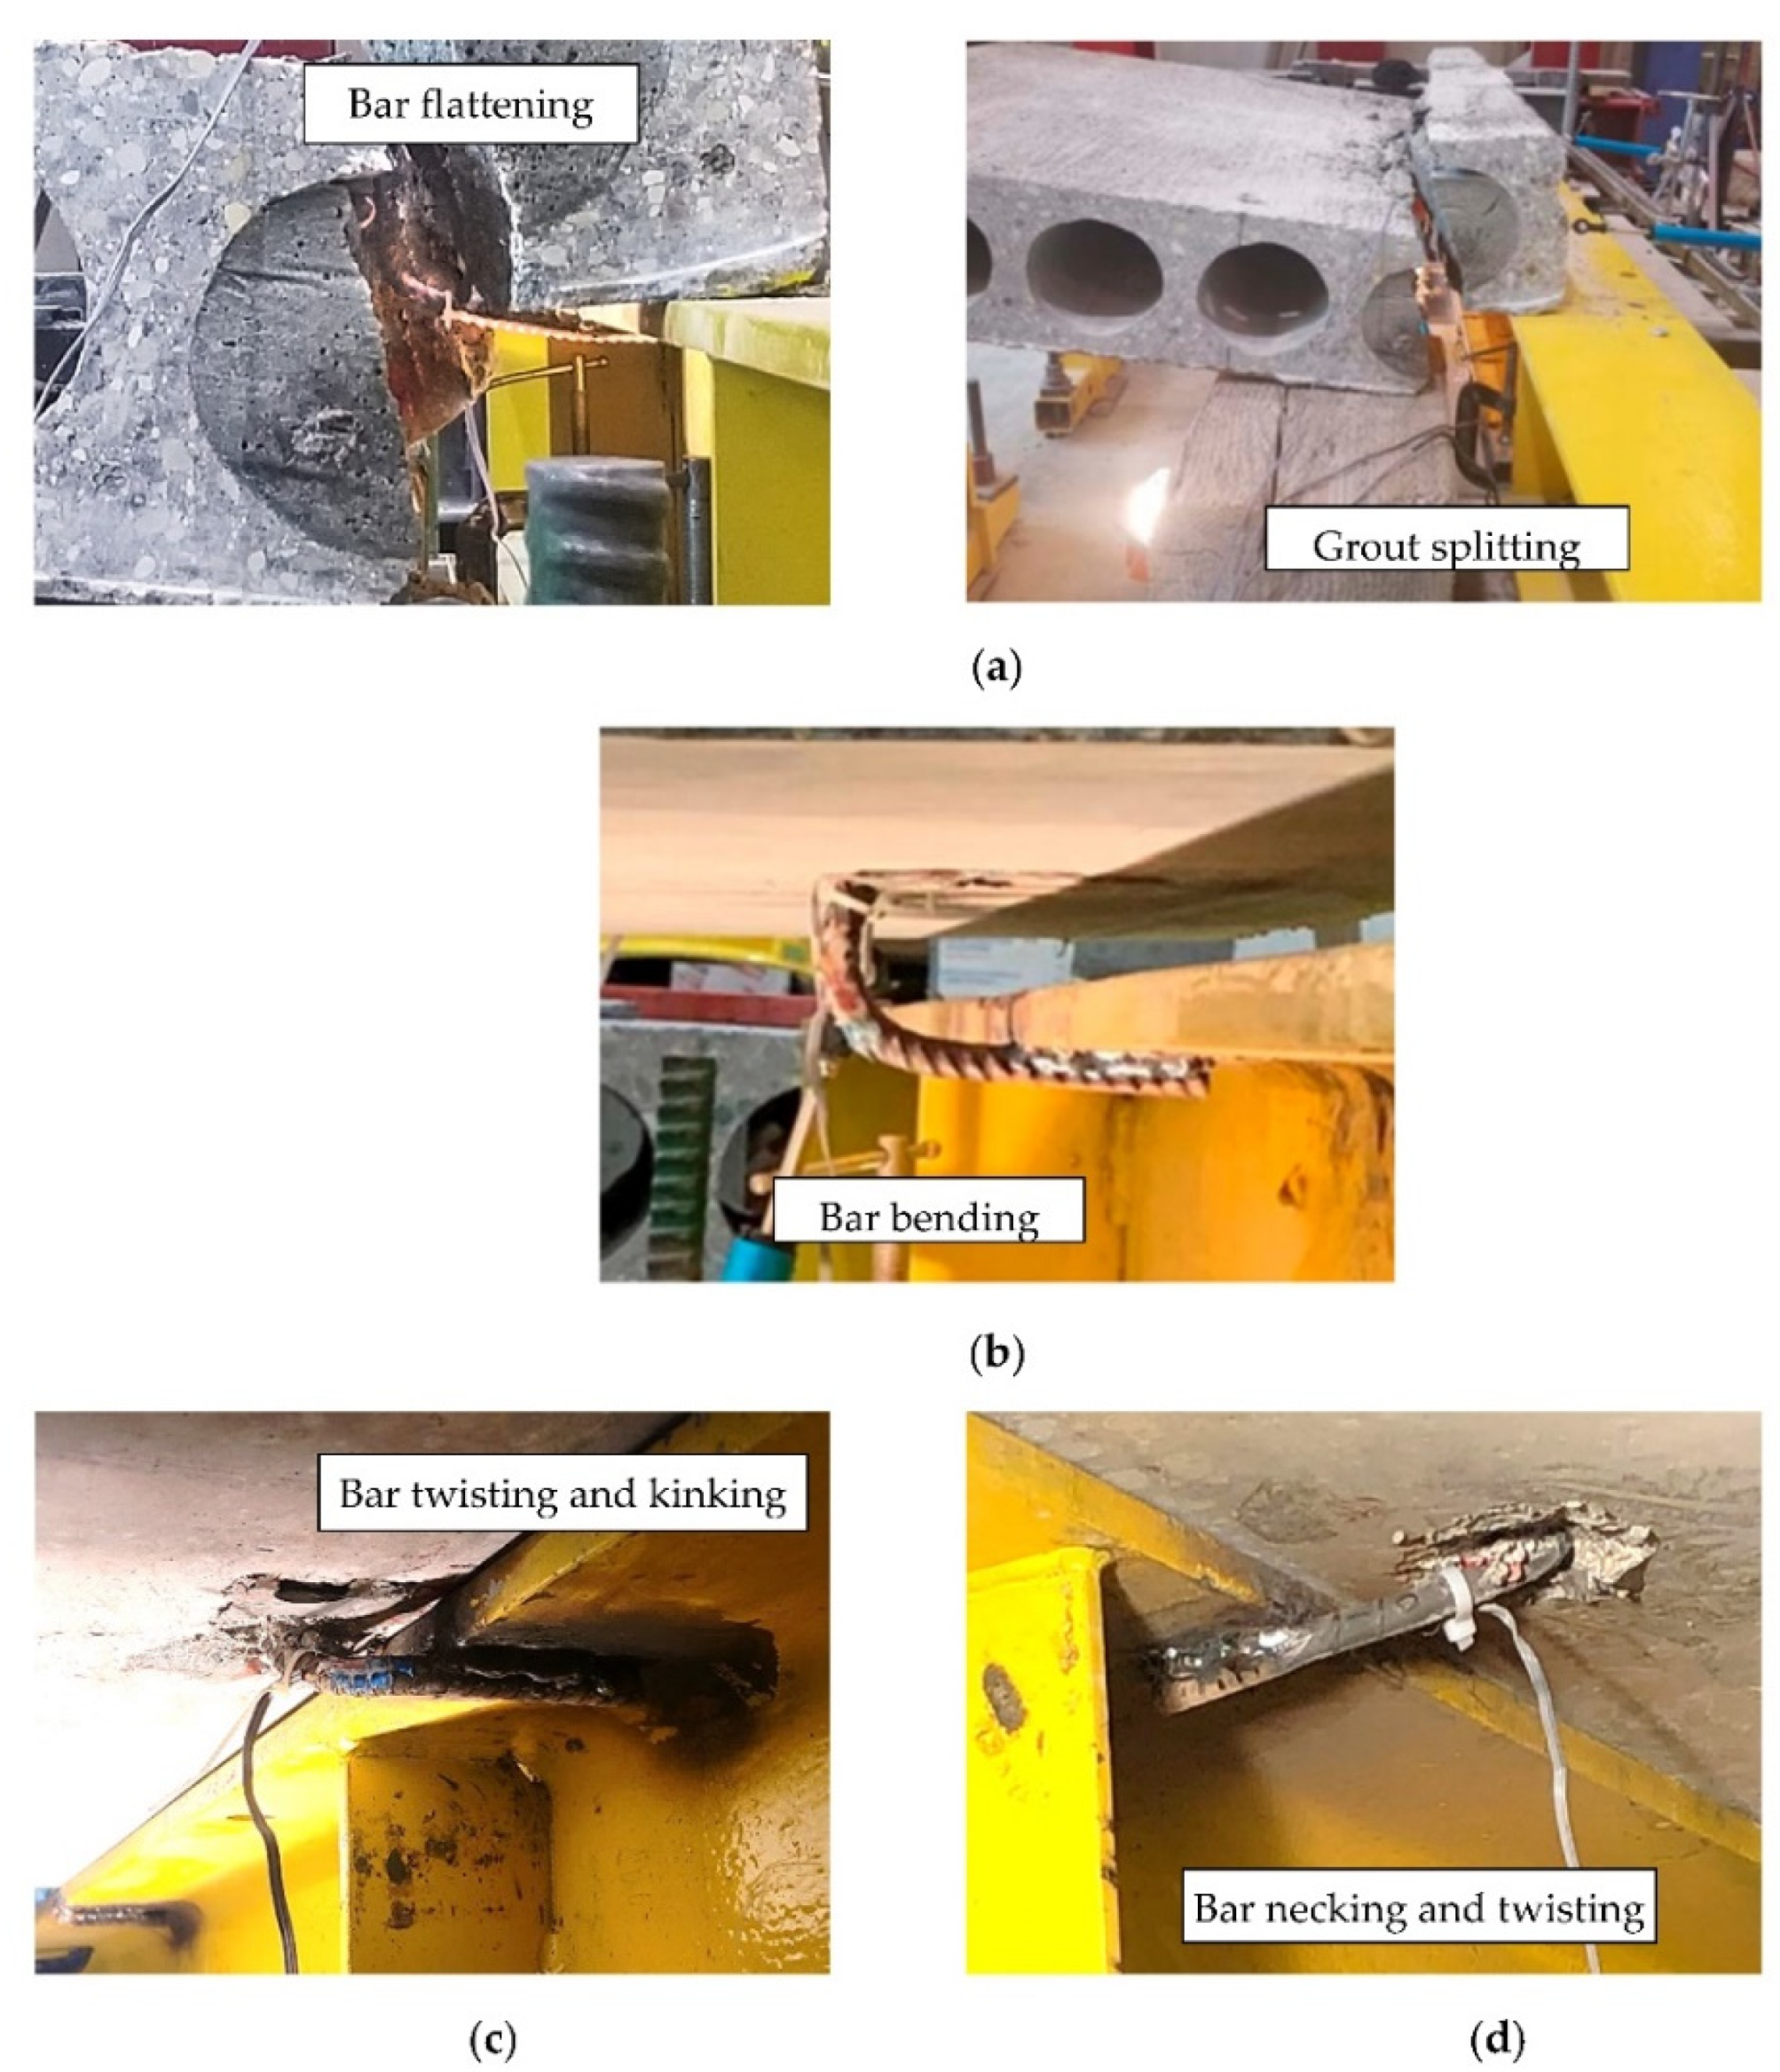
- The mode of failure in the specimens tested under compression was governed by bar bending/buckling without yielding, with the exception of specimen EB-CN-45R. Only this specimen was able to reach yielding before peak load, implying an improvement in the mechanism of failure compared to its counterparts with different connection detailing under compression.
- There is no significant difference in the behavior of the end- and side-bearing connections with similar detailing when tested under pushing or pulling forces applied either normal or parallel to the supporting beam.
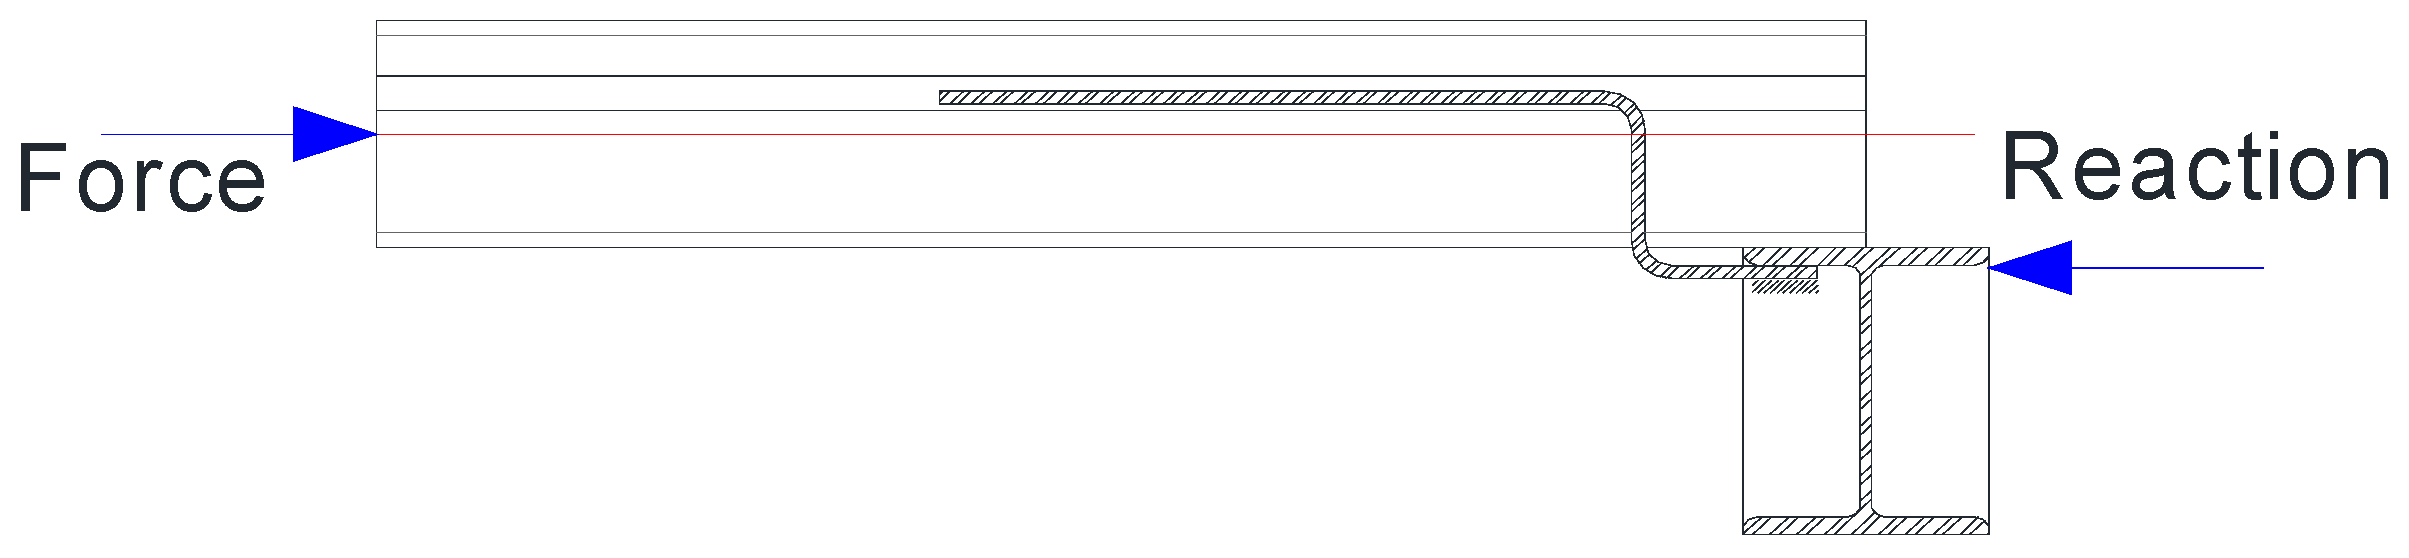
- The eccentricity in the load path between the applied load and the reaction at the weld triggered the early bending/buckling of the bar at the bend location. Eliminating this eccentricity is expected to increase the connection capacity significantly.
Author Contributions
Funding
Data Availability Statement
Acknowledgments
Conflicts of Interest
References
- Hall, B.J.; Canadian Precast/Prestressed Concrete Institute, Ottawa, ON, Canada. Personal communication, April 2021.
- Speyer, I.J. Considerations for the Design of Precast Concrete Bearing Wall Buildings to Withstand Abnormal Loads. J. Prestress. Concr. Inst. 1976, 21, 18–51. [Google Scholar]
- CPCI. CPCI Design Manual, 5th ed.; Precast and Prestressed Concrete; Canadian Precast/Prestressed Concrete Institute: Ottawa, ON, Canada, 2017. [Google Scholar]
- ACI 318-19; Building Code Requirements for Structural Concrete and Commentary. ACI 318 Committee; American Concrete Institute: Detroit, MI, USA, 2019.
- CSA A23.3-19; Design of Concrete Structures. Canadian Standards Association (CSA): Toronto, ON, Canada, 2019.
- PCI. Manual for the Design of Hollow Core Slabs and Walls, 3rd ed.; Electronic Version; PCI Hollow Core Slab Producers Committee: Chicago, IL, USA, 2015; Available online: https://www.coreslab.com/wp-content/uploads/2013/07/PCI-Hollowcore-Design-Manual-MNL-116.pdf (accessed on 19 September 2022).
- Lam, D.; Elliott, K.S.; Nethercot, D.A. Parametric Study on Composite Steel Beams with Precast Concrete Hollow Core Floor Slabs. J. Constr. Steel Res. 2000, 54, 283–304. [Google Scholar] [CrossRef]
- Lam, D. Composite Steel Beams with Precast Hollow Core Slabs: Behaviour and Design. Prog. Struct. Eng. Mater. 2002, 4, 179–185. [Google Scholar] [CrossRef]
- Lam, D. Capacities of Headed Stud Shear Connectors in Composite Steel Beams with Precast Hollowcore Slabs. J. Constr. Steel Res. 2007, 63, 1160–1174. [Google Scholar] [CrossRef]
- Truderung, K.; Tower Engineering Group, Calgary, AB, Canada. Personal communication, January 2019.
- ASTM A370-20; Standard Test Methods and Definitions for Mechanical Testing of Steel Products. American Society for Testing and Materials, International (ASTM): West Conshohocken, PA, USA, 2020.
- ASTM C109/C109M-20b; Standard Test Method for Compressive Strength of Hydraulic Cement Mortars (Using 2-in or [50 Mm] Cube Specimens). American Society for Testing and Materials, International (ASTM): West Conshohocken, PA, USA, 2020.
- Mejia-McMaster, J.C.; Park, R. Tests on Special Reinforcement for the End Support of Hollow-Core Slabs. PCI J. 1994, 39, 90–105. [Google Scholar] [CrossRef]
- Herlihy, M.D. Precast Concrete Floor Support and Diaphragm Action. Ph.D. Thesis, University of Canterbury, Christchruch, New Zealand, 1999. [Google Scholar]
- Dhakal, R.P.; Maekawa, K. Modeling for Postyield Buckling of Reinforcement. J. Struct. Eng. 2002, 128, 1139–1147. [Google Scholar] [CrossRef]
- Urmson, C.R.; Mander, J.B. Local Bucling Analysis of Longitudinal Reinforcing Bars. J. Struct. Eng. 2012, 138, 62–71. [Google Scholar] [CrossRef]


| Series | Type of Bearing | Specimen ID | Load Direction/ Orientation | Bend Angles (Degrees) |
|---|---|---|---|---|
| Series I | End-Bearing | EB-CN-90 | Pushing/Normal | 90 |
| EB-CN-90R | 90 R * | |||
| EB-CN-45 | 45 | |||
| EB-CN-45R | 45 R * | |||
| EB-TN-90 | Pulling/Normal | 90 | ||
| EB-TN-45 | 45 | |||
| EB-CP-90 | Pushing/Parallel | 90 | ||
| Series II | Side-Bearing | SB-CN-90 | Pushing/Normal | 90 |
| SB-TN-90 | Pulling/Normal | 90 | ||
| SB-CP-90 | Pushing/Parallel | 90 | ||
| SB-TP-90 | Pulling/Parallel | 90 |
| Series | Type of Bearing | Specimen ID | Load Direction/ Orientation | Mode of Failure | Yielding Load (kN) | Peak Load (kN) | Strains at Peak Load (µε) | Slab Displacement at Peak Load (mm) |
|---|---|---|---|---|---|---|---|---|
| Series I | End-Bearing | EB-CN-90 | Pushing/Normal | Bar buckling | - | 12.6 | −1050 | 3.9 |
| EB-CN-90R | Bar buckling | - | 13.7 | −1460 | 4 | |||
| EB-CN-45 | Bar bending | - | 16.3 | −1010 | 3.9 | |||
| EB-CN-45R | Bar buckling | 17.1 | 17.1 | −2770 | 3.9 | |||
| EB-TN-90 | Pulling/Normal | Bar yielding & grout splitting | 30.3 | 30.3 | 2370 | 22.6 | ||
| EB-TN-45 | 37.2 | 53.2 | 24,980 | 21.8 | ||||
| EB-CP-90 | Pushing/Parallel | Bar yielding | 9.2 | 15.3 | 8080 | 60.3 | ||
| Series II | Side-Bearing | SB-CN-90 | Pushing/Normal | Bar buckling | - | 11.4 | 900 | 3.5 |
| SB-TN-90 | Pulling/Normal | Bar yielding & grout splitting | 36.3 | 46 | 13,410 | 22.9 | ||
| SB-CP-90 | Pushing/Parallel | Bar yielding | 9.7 | 16.1 | 9330 | 60.5 | ||
| SB-TP-90 | Pulling/Parallel | Bar yielding | 31.7 | 34.8 | 3350 | 63.8 |
Publisher’s Note: MDPI stays neutral with regard to jurisdictional claims in published maps and institutional affiliations. |
© 2022 by the authors. Licensee MDPI, Basel, Switzerland. This article is an open access article distributed under the terms and conditions of the Creative Commons Attribution (CC BY) license (https://creativecommons.org/licenses/by/4.0/).
Share and Cite
Brito, S.H.; Mahmoud, K.; El-Salakawy, E.F. Behavior of Reinforcing Bar Connection of Hollow-Core Slabs to Steel Beams under In-Plane Forces. CivilEng 2022, 3, 831-849. https://doi.org/10.3390/civileng3040048
Brito SH, Mahmoud K, El-Salakawy EF. Behavior of Reinforcing Bar Connection of Hollow-Core Slabs to Steel Beams under In-Plane Forces. CivilEng. 2022; 3(4):831-849. https://doi.org/10.3390/civileng3040048
Chicago/Turabian StyleBrito, Susana Hernandez, Karam Mahmoud, and Ehab F. El-Salakawy. 2022. "Behavior of Reinforcing Bar Connection of Hollow-Core Slabs to Steel Beams under In-Plane Forces" CivilEng 3, no. 4: 831-849. https://doi.org/10.3390/civileng3040048