
Incident Analysis and Prediction of Safety Performance on Construction Sites


Abstract
:1. Introduction
2. Measuring Safety Performance in Construction
2.1. Lagging Indicators
2.2. Leading Indicators
3. Materials and Methods
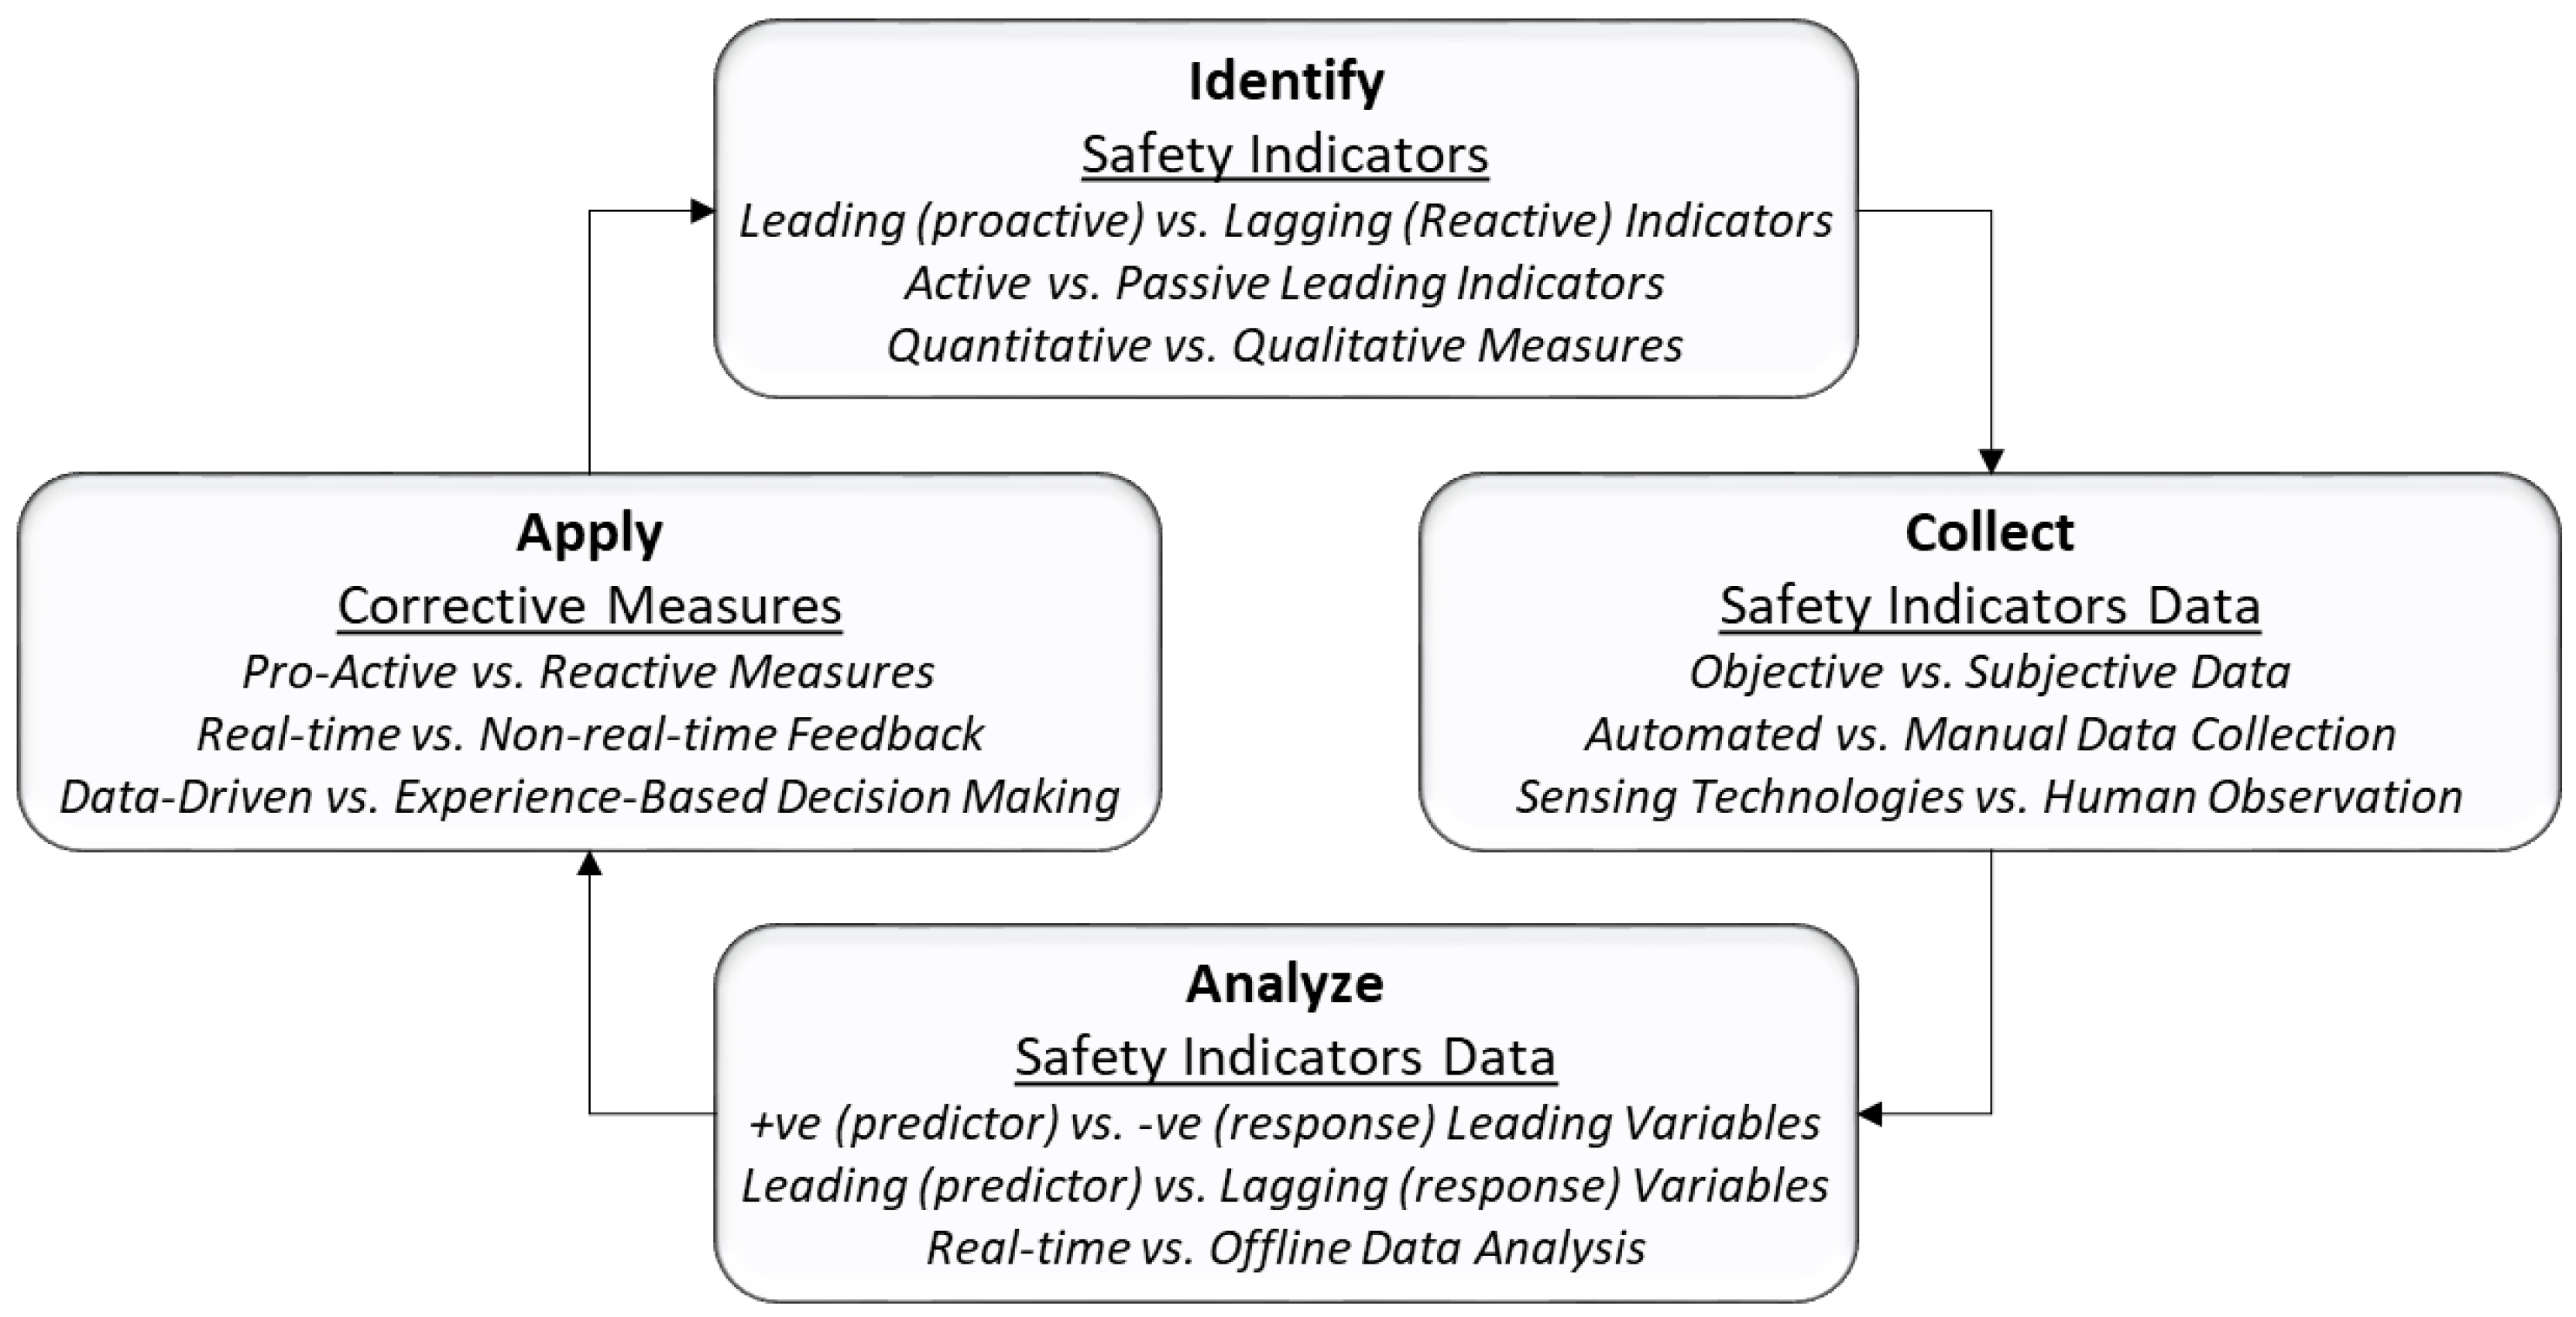
3.1. Framework for Monitoring and Measuring Safety Performance
3.1.1. Step 1: Identification of Safety Indicators
3.1.2. Step 2: Collection of Safety Indicators Data
3.1.3. Step 3: Analysis of Safety Indicators Data
3.1.4. Step 4: Application of Corrective Measures
3.2. Analysis of Safety Indicators Data
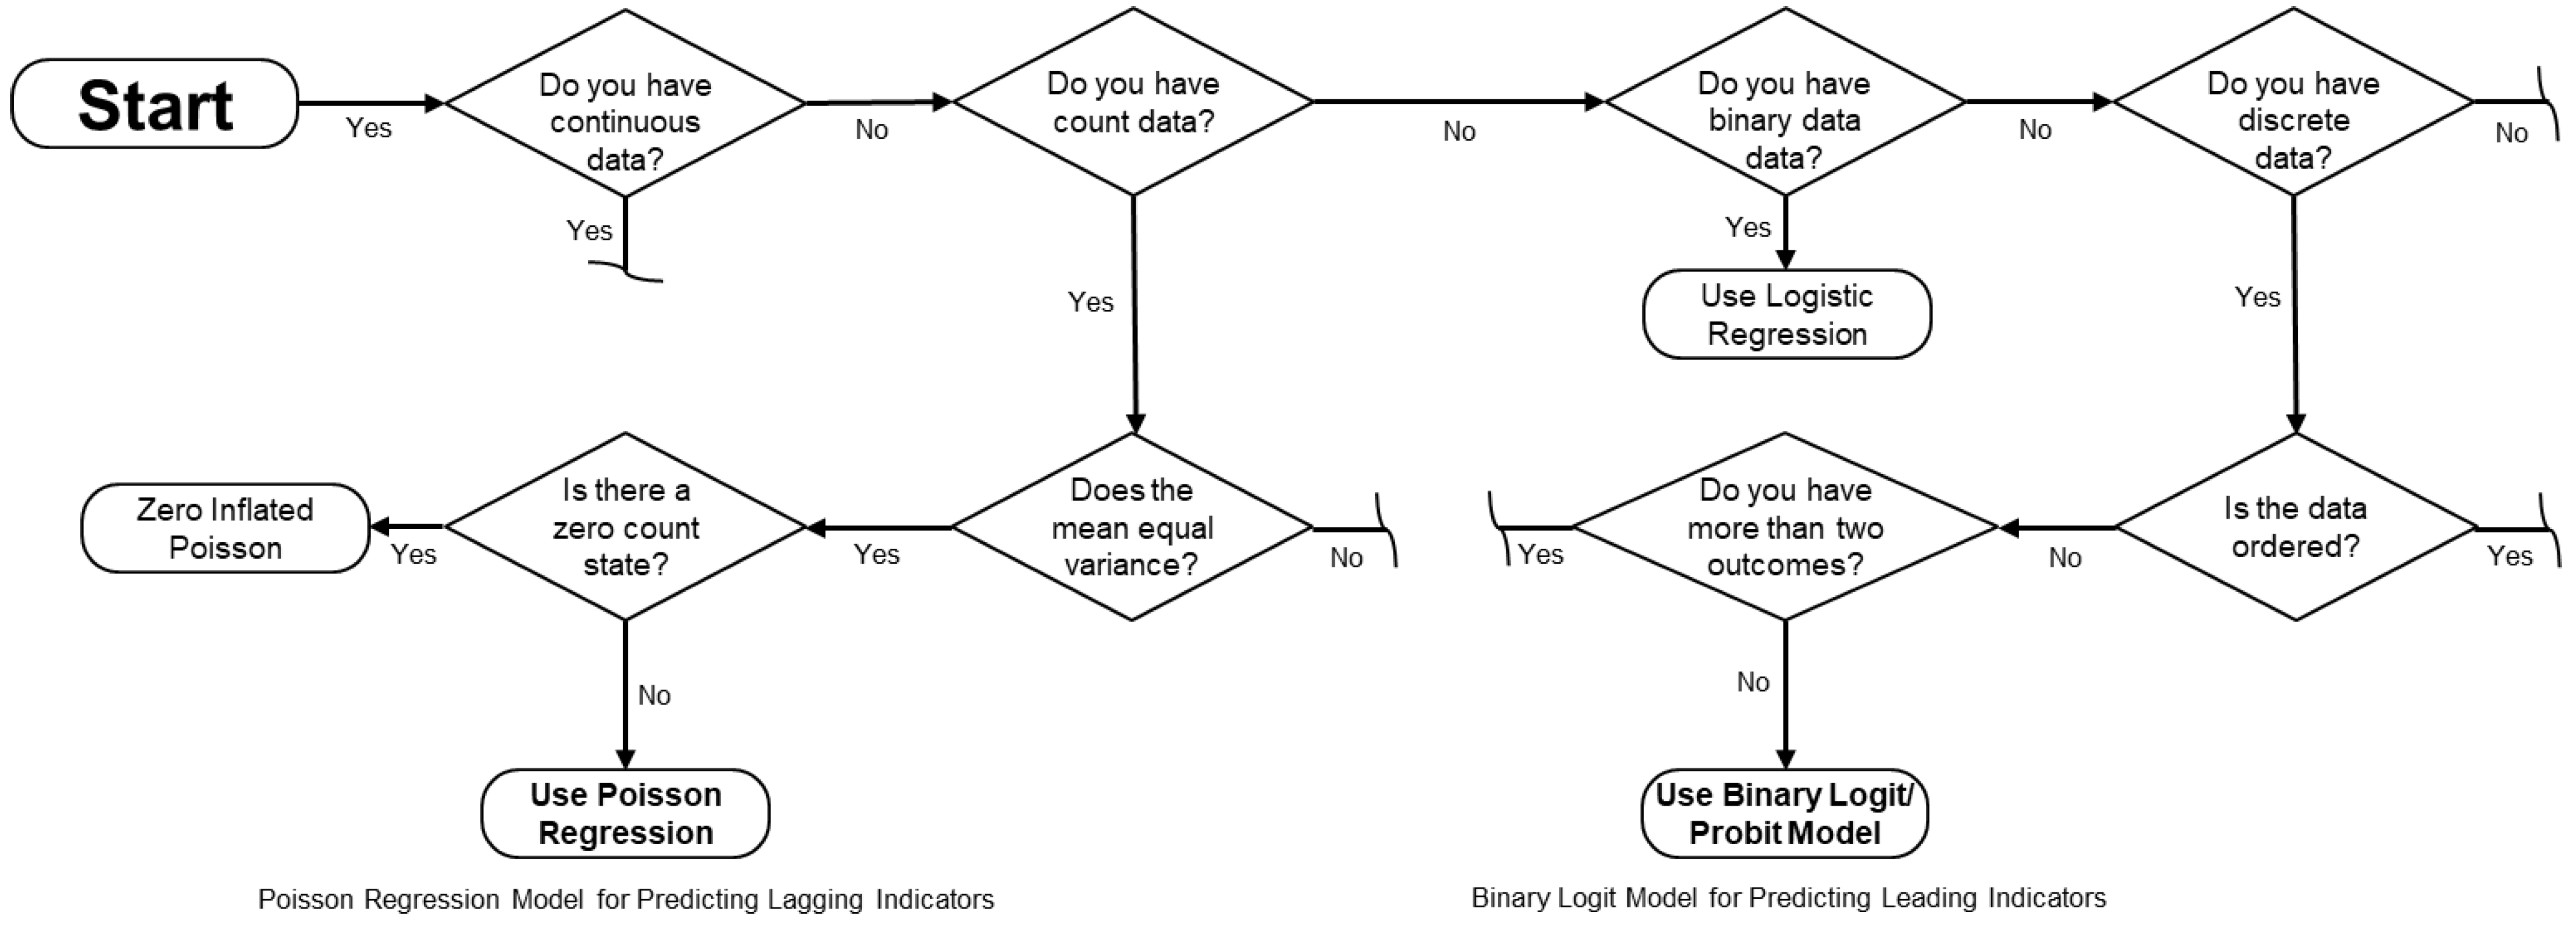
3.2.1. Binary Logit Model for Predicting Leading Indicators
3.2.2. Poisson Regression Model for Predicting Lagging Indicators
4. Results and Discussion
4.1. Analysis of Safety Indicators Data
4.2. Results of Binary Logit Model
4.3. Results of Poisson Regression Model
5. Conclusions
Author Contributions
Funding
Data Availability Statement
Conflicts of Interest
References
- Bansal, V.K. Application of geographic information systems in construction safety planning. Int. J. Proj. Manag. 2011, 29, 66–77. [Google Scholar] [CrossRef]
- Yoon, S.J.; Lin, H.K.; Chen, G.; Yi, S.; Choi, J.; Rui, Z. Effect of occupational health and safety management system on work-related accident rate and differences of occupational health and safety management system awareness between managers in South Korea’s construction industry. Saf. Health Work 2013, 4, 201–209. [Google Scholar] [CrossRef] [PubMed] [Green Version]
- Poh, C.Q.; Ubeynarayana, C.U.; Goh, Y.M. Safety leading indicators for construction sites: A machine learning approach. Autom. Constr. 2018, 93, 375–386. [Google Scholar] [CrossRef]
- Hong Kong Occupational Safety and Health (HKOSH). Occupational Safety and Health Statistics 2018. Labor Department, The Government of the Hong Kong Special Administrative Region; 2018. Available online: https://www.labour.gov.hk/eng/osh/pdf/archive/statistics/OSH_Statistics_2018_eng.pdf (accessed on 12 May 2022).
- Health and Safety Executive (HSE). Construction Statistics in Great Britain, 2019. Health and Safety Executive; 2019. Available online: https://www.hse.gov.uk/statistics/industry/construction.pdf (accessed on 12 May 2022).
- Bureau of Labor Statistics (BLS). Census of Fatal Occupational Injuries (CFOI)-Current and Revised Data. U.S. Department of Labor; 2020. Available online: http://www.bls.gov/iif/oshcfoi1.htm#charts (accessed on 12 May 2022).
- Awolusi, I.; Marks, E.; Hallowell, M. Physiological data collection and monitoring of construction equipment operators. Constr. Res. Congr. 2016, 2016, 2946–2956. [Google Scholar]
- Anger, W.K.; Kyler-Yano, J.; Vaughn, K.; Wipfli, B.; Olson, R.; Blanco, M. Total Worker Health® intervention for construction workers alters safety, health, well-being measures. J. Occup. Environ. Med. 2018, 60, 700–709. [Google Scholar] [CrossRef] [PubMed]
- Choudhry, R.M.; Fang, D. Why operatives engage in unsafe work behavior: Investigating factors on construction sites. Saf. Sci. 2008, 46, 566–584. [Google Scholar] [CrossRef]
- Seo, J.; Han, S.; Lee, S.; Kim, H. Computer vision techniques for construction safety and health monitoring. Adv. Eng. Informatics 2015, 29, 239–251. [Google Scholar] [CrossRef]
- Mitropoulos, P.; Abdelhamid, T.S.; Howell, G.A. Systems model of construction accident causation. J. Constr. Eng. Manag. 2005, 131, 816–825. [Google Scholar] [CrossRef]
- Abdelhamid, T.S.; Everett, J.G. Identifying root causes of construction accidents. J. Constr. Eng. Manag. 2000, 126, 52–60. [Google Scholar] [CrossRef]
- Marks, E.; Awolusi, I.G.; McKay, B. Near-Hit Reporting: Reducing Construction Industry Injuries. Prof. Saf. 2016, 61, 56–62. [Google Scholar]
- Oguz Erkal, E.D.; Hallowell, M.R.; Bhandari, S. Practical Assessment of Potential Predictors of Serious Injuries and Fatalities in Construction. J. Constr. Eng. Manag. 2021, 147, 4021129. [Google Scholar] [CrossRef]
- Pardo-Ferreira, M.C.; Rubio-Romero, J.C.; Martínez-Rojas, M. Applying Resilience Engineering to improve Safety Management in a Construction Site: Design and Validation of a Questionnaire. Int. J. Ind. Manuf. Eng. 2018, 12, 1237–1242. [Google Scholar]
- Pardo-Ferreira, M.D.; Martínez-Rojas, M.; Salguero-Caparrós, F.; Rubio-Romero, J.C. Evolution of the Functional Resonance Analysis Method (FRAM) through the combination with other methods. Dir. Organ. 2019, 68, 41–50. [Google Scholar] [CrossRef]
- Hollnagel, E.; Woods, D.D.; Leveson, N. (Eds.) Resilience Engineering: Concepts and Precepts; Ashgate Publishing, Ltd.: Farnham, UK, 2006. [Google Scholar]
- Hallowell, M.R.; Hinze, J.W.; Baud, K.C.; Wehle, A. Proactive construction safety control: Measuring, monitoring, and responding to safety leading indicators. J. Constr. Eng. Manag. 2013, 139, 4013010. [Google Scholar] [CrossRef]
- Awolusi, I.G.; Marks, E.D. Safety activity analysis framework to evaluate safety performance in construction. J. Constr. Eng. Manag. 2017, 143, 5016022. [Google Scholar] [CrossRef] [Green Version]
- Akroush, N.S. Leading Safety Indicators in the Construction Industry: The Case of Tennessee. Master’s Thesis, The University of Tennessee, Knoxville, TN, USA, 2017. [Google Scholar]
- Grabowski, M.; Ayyalasomayajula, P.; Merrick, J.; Harrald, J.R.; Roberts, K. Leading indicators of safety in virtual organizations. Saf. Sci. 2007, 45, 1013–1043. [Google Scholar] [CrossRef]
- Chen, J.R.; Yang, Y.T. A predictive risk Index for safety performance in process industries. J. Loss Prev. Process Ind. 2004, 17, 233–242. [Google Scholar] [CrossRef]
- Hinze, J.; Thurman, S.; Wehle, A. Leading indicators of construction safety performance. Saf. Sci. 2013, 51, 23–28. [Google Scholar] [CrossRef]
- Dağdeviren, M.; Yüksel, İ.; Kurt, M. A fuzzy analytic network process (ANP) model to identify faulty behavior risk (FBR) in work system. Saf. Sci. 2008, 46, 771–783. [Google Scholar] [CrossRef]
- Mahmoudi, S.; Ghasemi, F.; Mohammadfam, I.; Soleimani, E. Framework for continuous assessment and improvement of occupational health and safety issues in construction companies. Saf. Health Work 2014, 5, 125–130. [Google Scholar] [CrossRef] [Green Version]
- Costin, A.; Wehle, A.; Adibfar, A. Leading indicators—A conceptual IoT-based framework to produce active leading indicators for construction safety. Safety 2019, 5, 86. [Google Scholar] [CrossRef] [Green Version]
- Organization for Economic Cooperation and Development (OECD). Guidance on Safety Performance Indicators; OECD Environment, Health and Safety Publications, Series on Chemical Accidents; Organization for Economic Cooperation and Development (OECD): Paris, France, 2003; No. 11. [Google Scholar]
- Reiman, T.; Pietikäinen, E. Leading indicators of system safety–monitoring and driving the organizational safety potential. Saf. Sci. 2012, 50, 1993–2000. [Google Scholar] [CrossRef]
- Health and Safety Executive (HSE). Developing Process Safety Indicators: A Step-By-Step Guide for Chemical and Major Hazard Industries; Health and Safety Executive (HSE): London, UK, 2006. [Google Scholar]
- Toellner, J. Improving safety & health performance: Identifying & measuring leading indicators. Prof. Saf. 2001, 46, 42. [Google Scholar]
- Øien, K.; Utne, I.B.; Herrera, I.A. Building safety indicators: Part 1–theoretical foundation. Saf. Sci. 2011, 49, 148–161. [Google Scholar] [CrossRef]
- Flin, R.; Mearns, K.; O’Connor, P.; Bryden, R. Measuring safety climate: Identifying the common features. Saf. Sci. 2000, 34, 177–192. [Google Scholar] [CrossRef]
- Hinze, J. A Paradigm Shift: Leading To Safety. In Proceedings of the 4th Triennial International Conference Rethinking and Revitalizing Construction Safety, Health, Environment and Quality, Gqeberha, South Africa, 17–20 May 2005; pp. 1–11. [Google Scholar]
- Fearnley, J.; Nair, S.R. Determining process safety performance indicators for major accident hazards using site process hazard information. IChemE Symp. 2009, 155, 221–225. [Google Scholar]
- Hallowell, M.R.; Bhandari, S.; Alruqi, W. Methods of safety prediction: Analysis and integration of risk assessment, leading indicators, precursor analysis, and safety climate. Constr. Manag. Econ. 2020, 38, 308–321. [Google Scholar] [CrossRef]
- Fu, X.; Liu, J.; Jones, S.; Barnett, T.; Khattak, A.J. From the past to the future: Modeling the temporal instability of safety performance functions. Accid. Anal. Prev. 2022, 167, 106592. [Google Scholar] [CrossRef]
- Awolusi, I.; Marks, E.; Hallowell, M. Wearable technology for personalized construction safety monitoring and trending: Review of applicable devices. Autom. Constr. 2018, 85, 96–106. [Google Scholar] [CrossRef]
- Ahn, C.R.; Lee, S.; Sun, C.; Jebelli, H.; Yang, K.; Choi, B. Wearable sensing technology applications in construction safety and health. J. Constr. Eng. Manag. 2019, 145, 3119007. [Google Scholar] [CrossRef]
- Tang, S.; Golparvar-Fard, M. Machine Learning-Based Risk Analysis for Construction Worker Safety from Ubiquitous Site Photos and Videos. J. Comput. Civ. Eng. 2021, 35, 4021020. [Google Scholar] [CrossRef]
- Ding, L.; Fang, W.; Luo, H.; Love, P.E.; Zhong, B.; Ouyang, X. A deep hybrid learning model to detect unsafe behavior: Integrating convolution neural networks and long short-term memory. Autom. Constr. 2018, 86, 118–124. [Google Scholar] [CrossRef]
- Zhu, R.; Hu, X.; Hou, J.; Li, X. Application of machine learning techniques for predicting the consequences of construction accidents in China. Process Saf. Environ. Prot. 2021, 145, 293–302. [Google Scholar] [CrossRef]
- Washington, S.P.; Karlaftis, M.G.; Mannering, F.L. Statistical and Econometric Methods for Transportation Data Analysis; Taylor and Francis Group: Abingdon, UK, 2011. [Google Scholar]
- McFadden, D. Econometric Models Of Probabilistic Choice. In Structural Analysis of Discrete Data with Econometric Applications; Manski, C.F., McFadden, D.L., Eds.; MIT Press: Cambridge, MA, USA, 1981; p. 198272. [Google Scholar]
- Hubbard, S.M.; Bullock, D.M.; Mannering, F.L. Right turns on green and pedestrian level of service: Statistical assessment. J. Transp. Eng. 2009, 135, 153–159. [Google Scholar] [CrossRef]
- Winston, C.; Maheshri, V.; Mannering, F. An exploration of the offset hypothesis using disaggregate data: The case of airbags and antilock brakes. J. Risk Uncertain. 2006, 32, 83–99. [Google Scholar] [CrossRef]
- Wallace, B.; Mannering, F.; Rutherford, G.S. Evaluating effects of transportation demand management strategies on trip generation by using Poisson and negative binomial regression. Transp. Res. Rec. 1999, 1682, 70–77. [Google Scholar] [CrossRef]
- Devore, J. Probability and Statistics, 9th ed.; Cengage Learning: Boston, MA, USA, 2015; pp. 131–136. [Google Scholar]
- Bryson, A.; Forth, J. Are There Day of The Week Productivity Effects? London Manpower Human Resources Lab, London School of Economics and Political Science. Discussion Paper. July 2007. Available online: https://cep.lse.ac.uk/pubs/download/mhrldp0004.pdf (accessed on 24 May 2022).
- Alshebani, M.N.; Wedawatta, G. Making the construction industry resilient to extreme weather: Lessons from construction in hot weather conditions. Procedia Econ. Financ. 2014, 18, 635–642. [Google Scholar] [CrossRef] [Green Version]
- Jung, M.; Park, M.; Lee, H.S.; Kim, H. Weather-delay simulation model based on vertical weather profile for high-rise building construction. J. Constr. Eng. Manag. 2016, 142, 4016007. [Google Scholar] [CrossRef]
- Barkhordari, A.; Malmir, B.; Malakoutikhah, M. An analysis of individual and social factors affecting occupational accidents. Saf. Health Work 2019, 10, 205–212. [Google Scholar] [CrossRef]


| Category | Description | Frequency | Percentage |
|---|---|---|---|
| Lagging Indicators (dependent variables) | |||
| Property Damage Cases | An incident that results in the destruction of real or personal property. | 54 | 55.67% |
| First Aid Cases | Any incident that requires stopping work but does not require a trained medical professional for assistance | 41 | 42.27% |
| Medical Aid Cases | An injury or illness that results in death, days away from work, restricted work, medical treatment beyond first aid, or loss of consciousness | 2 | 2.06% |
| Leading Indicators (dependent and independent variables) | |||
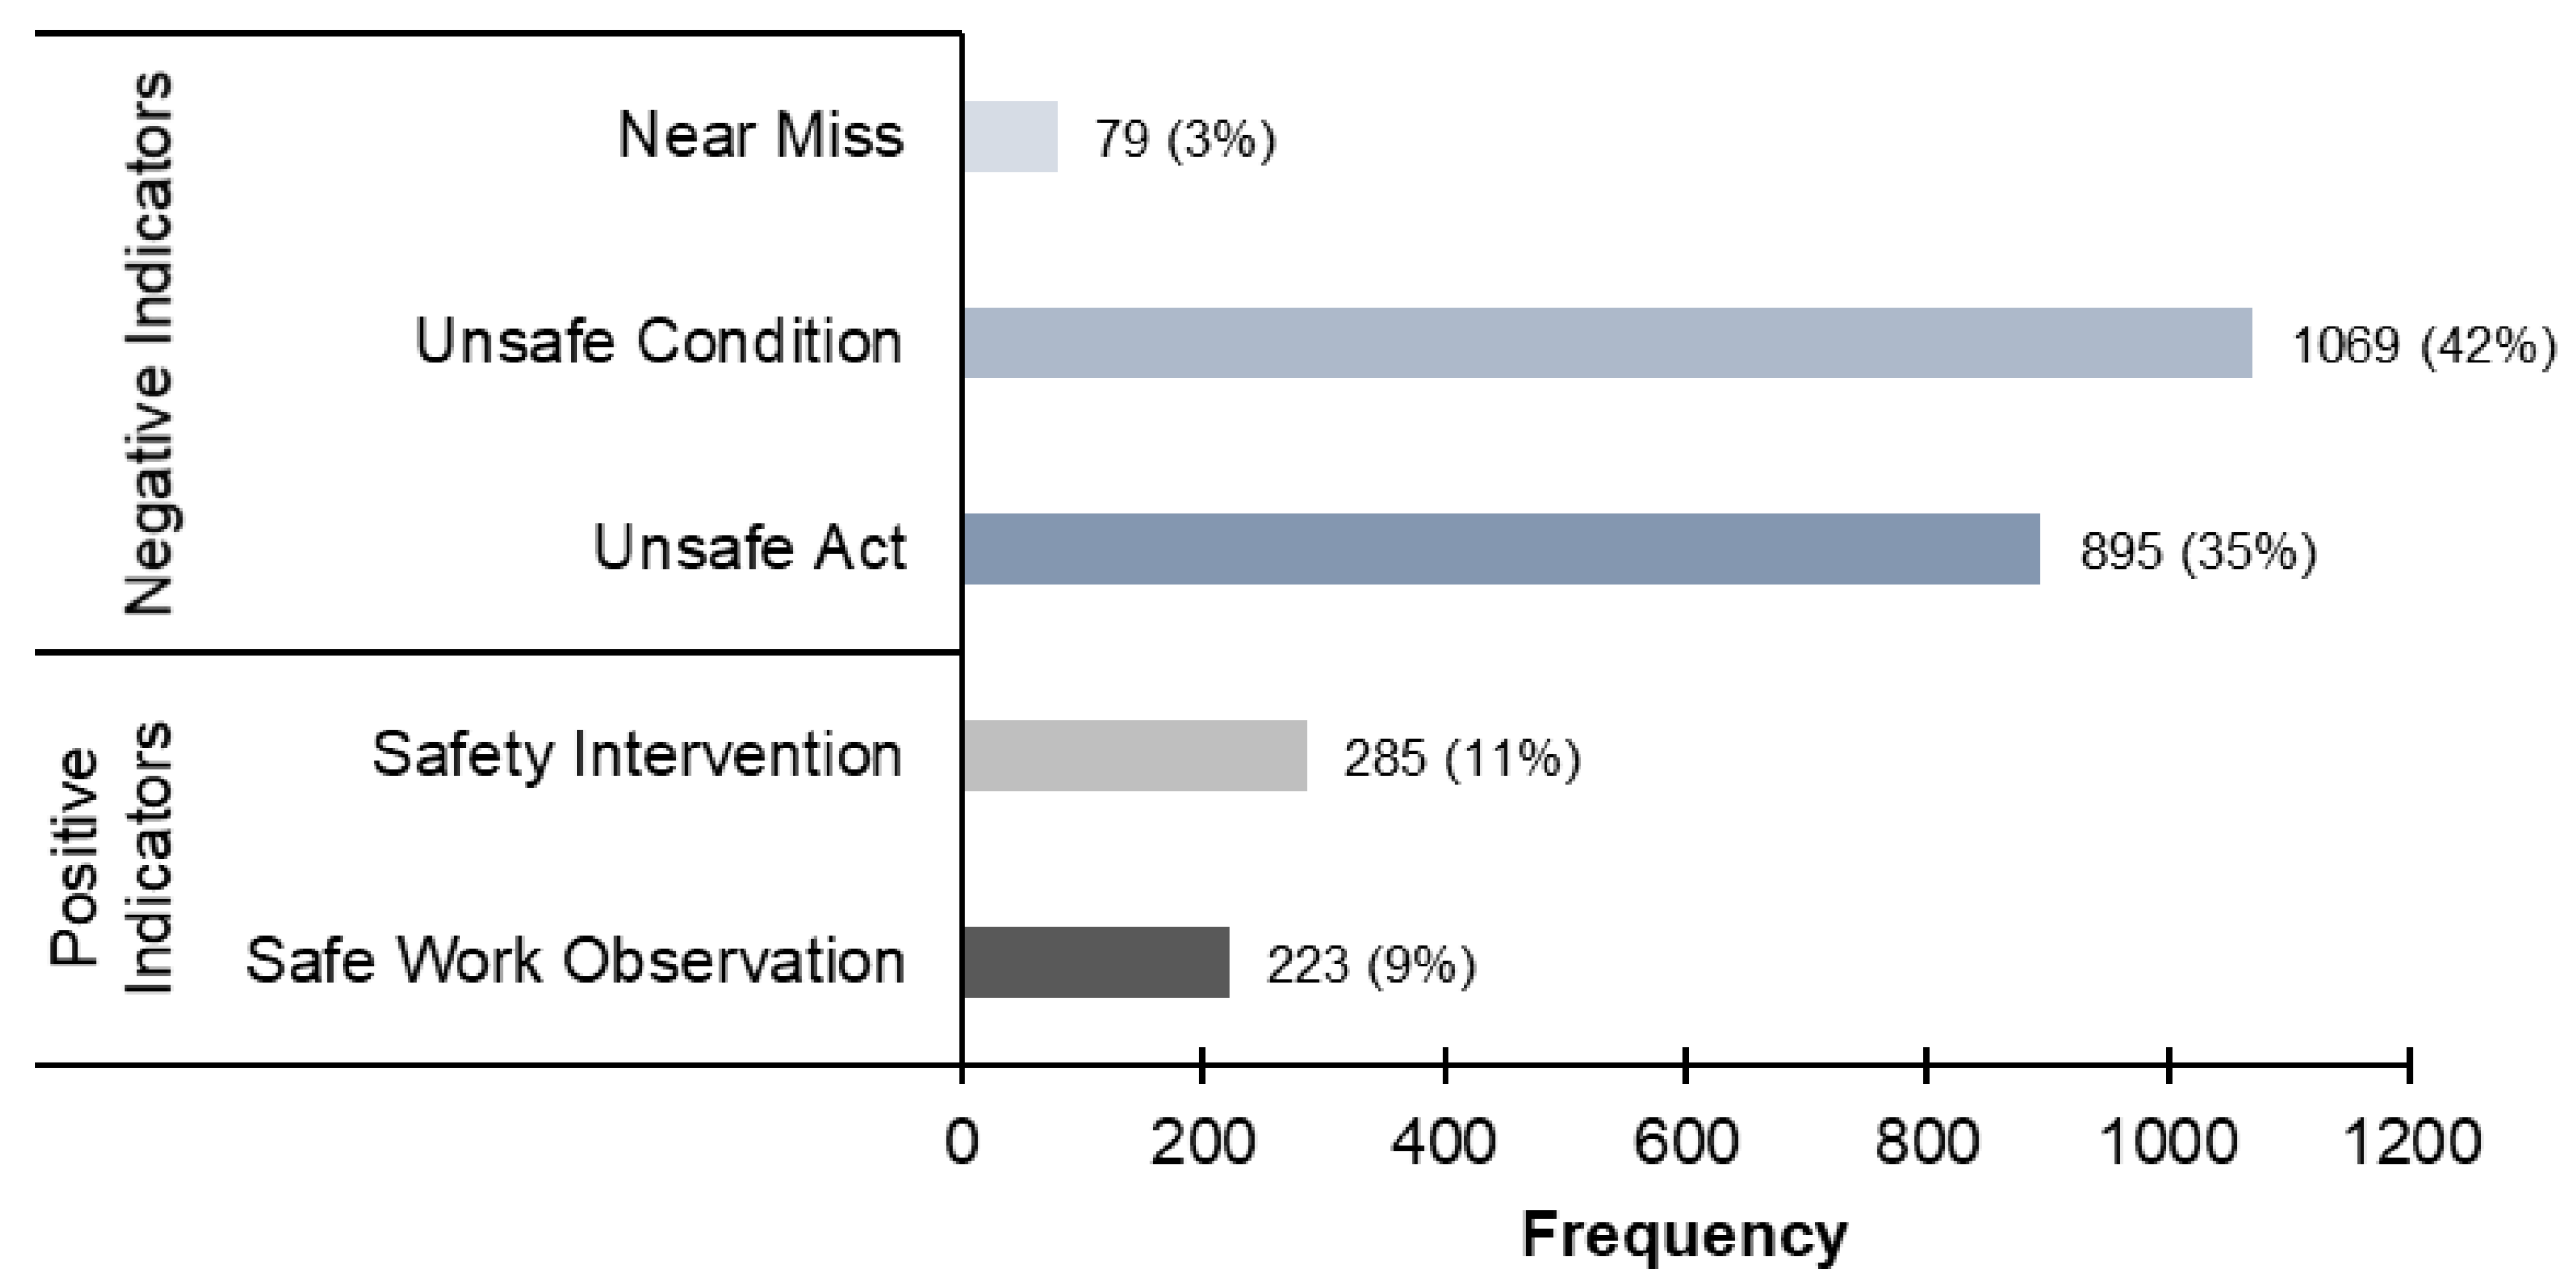
| Safe Work Observation | Counts of the number of safe actions or conditions in a work area for a given time | 223 | 8.74% |
| Safety Intervention | An attempt to change how things are performed in order to improve safety | 285 | 11.17% |
| Unsafe Act | Unaccepted practices that have the potential to contribute to future accidents and injuries | 895 | 35.08% |
| Unsafe Condition | A situation in which the physical layout of the workplace or work location or the status of tools, equipment, and material violates contemporary safety standards | 1069 | 41.91% |
| Near Miss | An unplanned event or unsafe condition that has the potential for injury or illness to people, or damage to property, or the environment | 79 | 3.10% |
| Causal Factors (Independent variables) | |||
| Heavy Equipment | Incidents associated with heavy construction equipment, such as a truck, trailer, and excavator | 267 | 10.47% |
| Vertical Access Equipment | Incidents associated with vertical access equipment, such as ladders, scaffolds, and stairs | 187 | 7.33% |
| Site Conditions | Incidents associated with site conditions, such as snow and ice, hole and trench, and roadway | 625 | 24.50% |
| Non-use of PPE | Incidents associated with failure to use PPE, such as earplugs, hardhats, and safety glasses | 733 | 28.73% |
| Incident Type | Incident type, such as trip, slip, fall, and electrical | 295 | 11.56% |
| Construction Materials | Incidents associated with certain construction materials, such as steel/rebar, concrete, nail, and fuel | 267 | 10.47% |
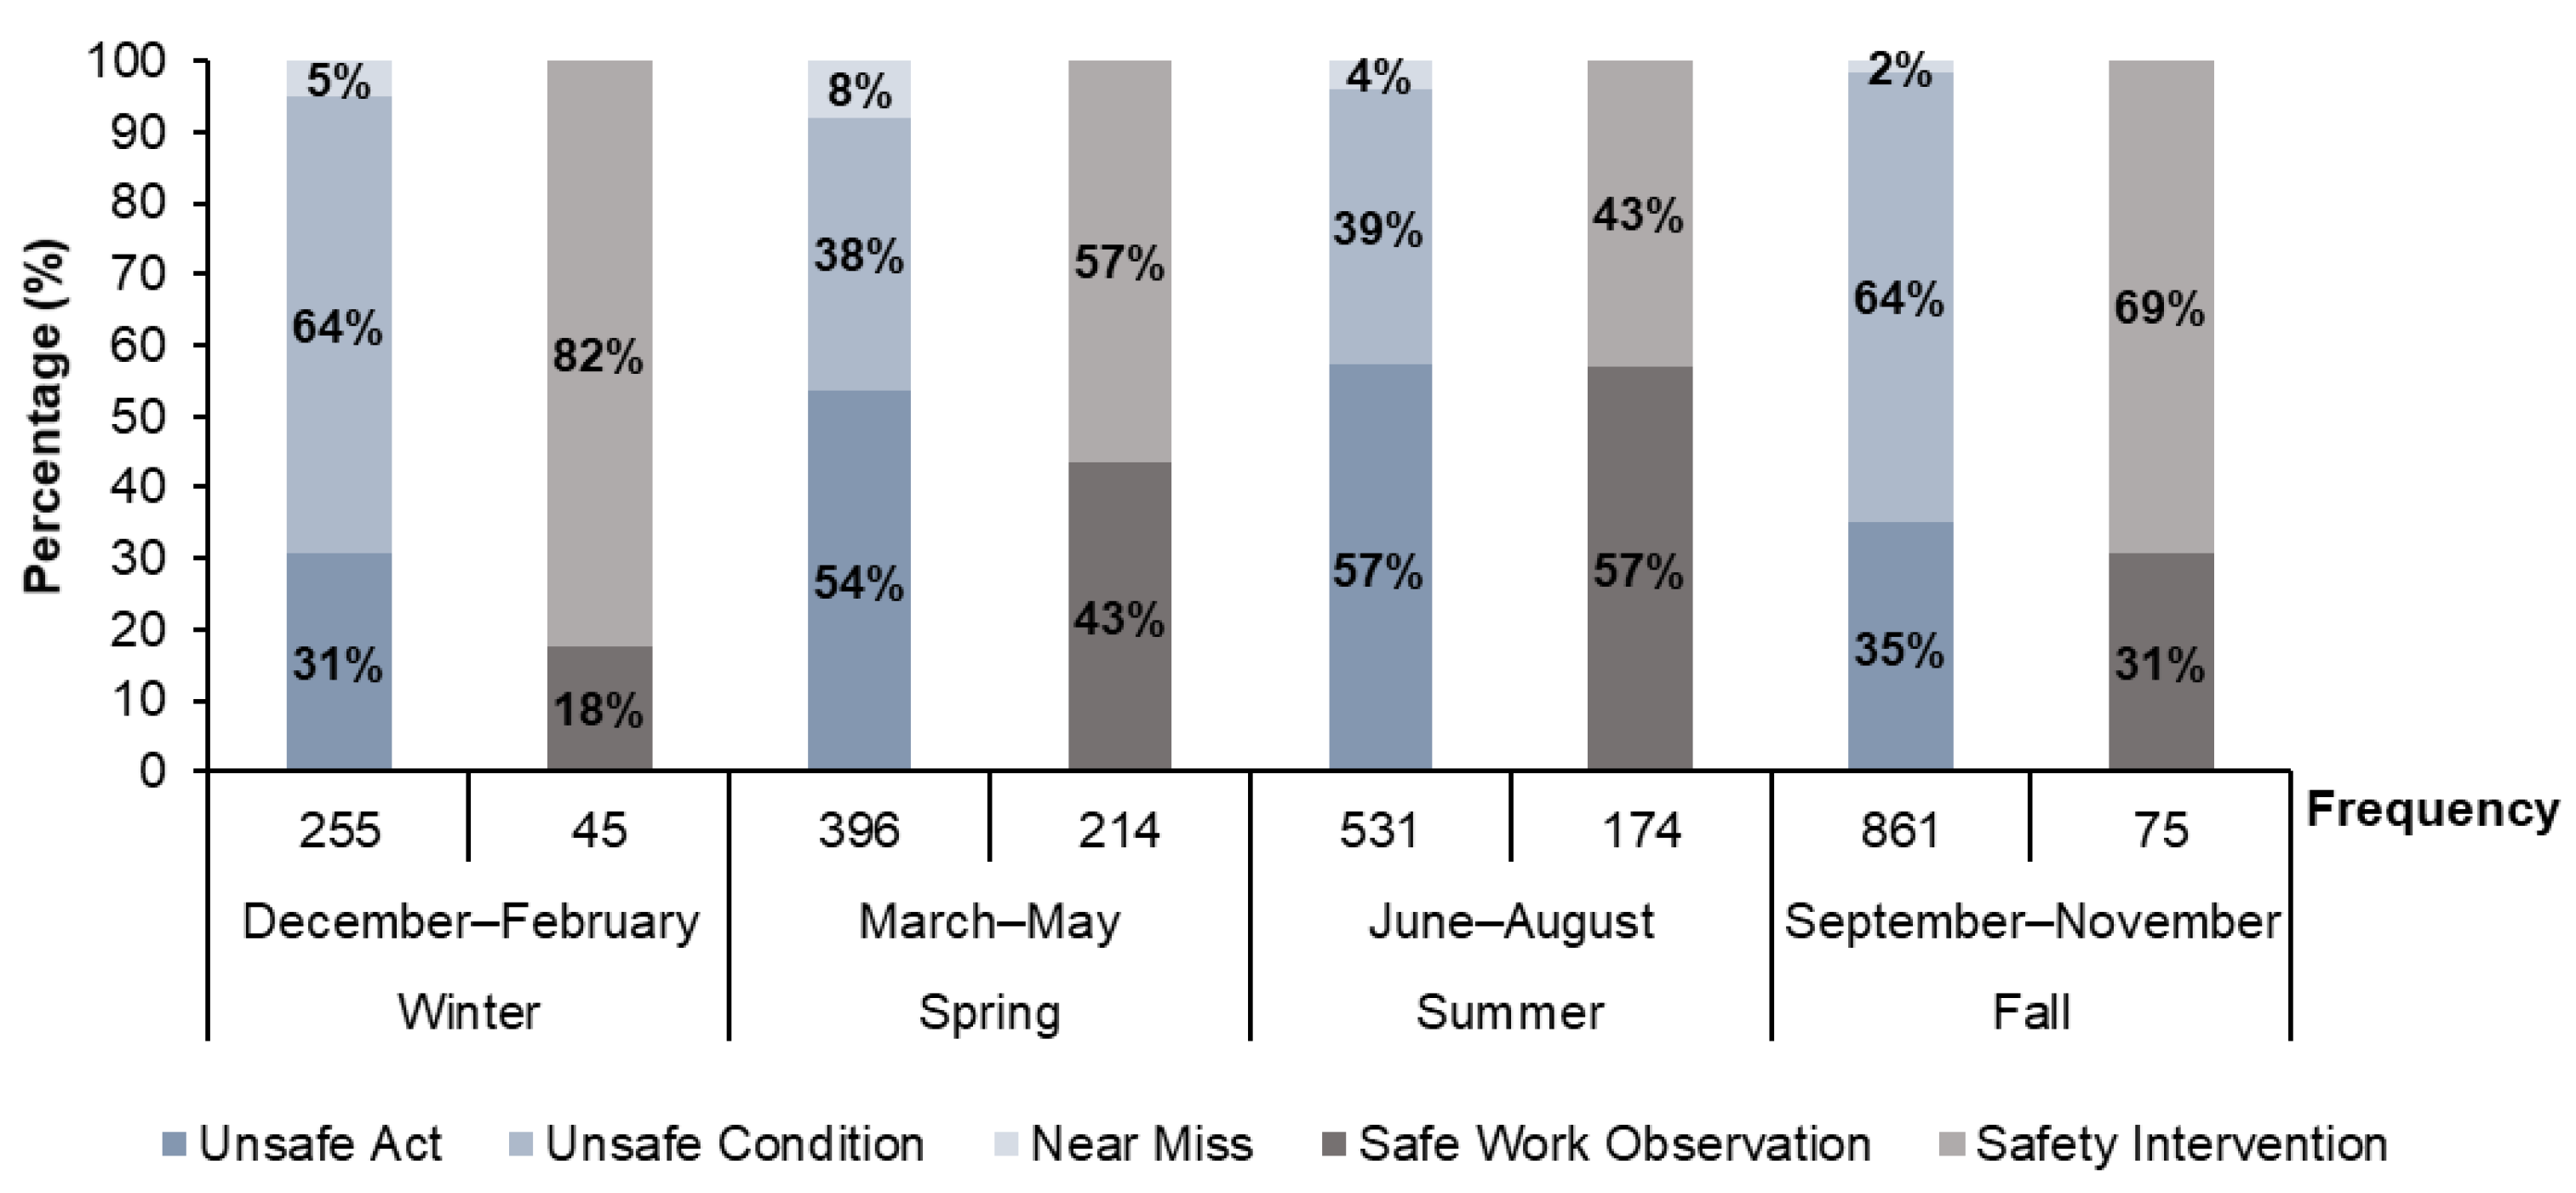
| Days of the Week | Days of the week on which incidents occur | ||
| Months of the Year | Months of the year in which incidents occur | ||
| Variables Description | Mean (Std. Dev.) | Unsafe Act | Unsafe Condition | Near Miss | ||||||
|---|---|---|---|---|---|---|---|---|---|---|
| Parameter Estimate | t-Statistic | Average Elasticity | Parameter Estimate | t-Statistic | Average Elasticity | Parameter Estimate | t-Statistic | Average Elasticity | ||
| Constant | −0.709 *** | −10.150 | −1.185 *** | −17.470 | −4.160 *** | −18.090 | ||||
| Midweek Indicator | 0.213 (0.409) | 0.528 *** | 1.990 | 0.017 | ||||||
| First Month of Spring Indicator | 0.105 (0.307) | −1.232 *** | −6.560 | −0.198 | −0.652 *** | −3.930 | −0.120 | 0.853 *** | 2.860 | 0.031 |
| Last Month of Spring Indicator | 0.083 (0.277) | 0.577 *** | 3.630 | 0.110 | ||||||
| First Month of Summer Indicator | 0.118 (0.323) | 0.669 *** | 4.860 | 0.128 | ||||||
| Last Month of Fall Indicator | 0.297 (0.457) | 1.095 *** | 10.950 | 0.229 | −1.146 *** | −3.000 | −0.025 | |||
| Incident Related to the Use of Ladder | 0.030 (0.170) | 0.861 *** | 3.420 | 0.166 | ||||||
| Incident Related to the Use of Scaffold | 0.023 (0.150) | −0.667 * | −1.820 | −0.113 | 0.911 *** | 2.850 | 0.184 | 1.191 * | 1.830 | 0.053 |
| Incident Involving Stairs | 0.020 (0.141) | −1.089 * | −1.880 | −0.172 | 0.998 ** | 2.500 | 0.201 | |||
| Roadway Incident | 0.044 (0.205) | 0.856 *** | 4.040 | 0.172 | ||||||
| Incident Involving Truck | 0.073 (0.259) | 0.523 *** | 3.080 | 0.099 | ||||||
| Incident Involving Trailer | 0.032 (0.176) | −0.706 ** | −2.010 | −0.119 | 1.068 *** | 3.680 | 0.215 | |||
| Incident Related to the Use of PPE | 0.287 (0.452) | 1.086 *** | 6.690 | 0.215 | 0.757 *** | 3.060 | 0.023 | |||
| Incident Related to Hearing and Use of Earplugs | 0.111 (0.314) | 0.559 *** | 2.990 | 0.109 | ||||||
| Incident Related to the Use of Hardhat | 0.080 (0.271) | −0.516 ** | −2.550 | −0.089 | ||||||
| Incident Related to Eye and Use of Glasses | 0.044 (0.206) | 0.454 * | 1.860 | 0.087 | ||||||
| Incident Related to Snow and Ice | 0.177 (0.382) | −1.015 *** | −6.920 | −0.172 | 1.156 *** | 9.580 | 0.239 | −1.435 *** | −2.980 | −0.027 |
| Trip Incident | 0.054 (0.227) | −1.737 *** | −5.390 | −0.248 | 1.453 *** | 6.460 | 0.293 | 1.146 *** | 2.940 | 0.049 |
| Slip Incident | 0.028 (0.165) | −2.789 *** | −4.500 | −0.312 | 1.492 *** | 4.460 | 0.297 | 1.332 *** | 2.910 | 0.063 |
| Fall Incident | 0.046 (0.209) | −0.747 *** | −2.840 | −0.125 | 0.403 * | 1.870 | 0.080 | 1.762 *** | 5.330 | 0.095 |
| Incident Related to Hole and Trench | 0.024 (0.154) | −0.686 ** | −2.170 | −0.116 | 0.828 *** | 2.970 | 0.167 | 1.097 * | 1.950 | 0.047 |
| Electrical Incident | 0.046 (0.209) | 0.691 *** | 3.390 | 0.138 | ||||||
| Incident Related to the Use of Fuel | 0.042 (0.201) | 1.252 *** | 2.990 | 0.056 | ||||||
| Incident Involving Nails | 0.040 (0.196) | −1.628 *** | −4.290 | −0.235 | 2.362 *** | 7.970 | 0.437 | |||
| Incident Related to Steel and Rebar | 0.033 (0.180) | 1.008 ** | 2.110 | 0.042 | ||||||
| Number of Observations | 2551 | 2551 | 2551 | |||||||
| Log-likelihood at Zero | −1652.963 | −1734.639 | −352.273 | |||||||
| Log-likelihood at Convergence | −1380.781 | −1451.982 | −301.606 | |||||||
| Variable Description | Mean (Std. Dev) | Safe Work Observation | Safety Intervention | ||||
|---|---|---|---|---|---|---|---|
| Parameter Estimate | t-Statistic | Average Elasticity | Parameter Estimate | t-Statistic | Average Elasticity | ||
| Constant | −1.869 *** | −17.360 | −2.100 *** | −22.280 | |||
| First Month of Spring Indicator | 0.105 (0.307) | 1.282 *** | 7.520 | 0.128 | 1.044 *** | 6.490 | 0.130 |
| First Month of Summer Indicator | 0.118 (0.323) | −0.615 ** | −2.290 | −0.038 | |||
| Last Month of Fall Indicator | 0.297 (0.457) | −1.983 *** | −6.450 | −0.095 | −0.853 *** | −4.550 | −0.069 |
| Incident related to the use of Ladder | 0.030 (0.170) | −2.186 ** | −2.150 | −0.078 | |||
| Incident related to the use of PPE | 0.287 (0.452) | −0.852 *** | −4.610 | −0.054 | 0.357 *** | 2.610 | 0.036 |
| Incident related to Snow and Ice | 0.177 (0.382) | −0.450 ** | −2.090 | −0.029 | |||
| Trip Incident | 0.054 (0.227) | −1.070 ** | −2.300 | −0.071 | |||
| Slip Incident | 0.028 (0.165) | −2.425 ** | −2.380 | −0.103 | |||
| Electrical Incident | 0.046 (0.209) | −1.077 ** | −2.280 | −0.056 | |||
| Number of Observations | 2551 | 2551 | |||||
| Log-likelihood at Zero | −756.422 | −893.101 | |||||
| Log-likelihood at Convergence | −657.333 | −837.514 | |||||
| Variable Description | Estimated Parameter | z-Statistic | Partial Effect | Mean (Std. Dev) |
|---|---|---|---|---|
| Constant | −1.912 *** | −8.540 | ||
| Midweek Indicator | 0.789 ** | 2.110 | 0.141 | 0.000 (0.000) |
| Fourth Day of Workweek Indicator | 0.569 | 1.370 | 0.097 | 0.000 (0.000) |
| Last Month of Autumn Indicator | −1.413 | −1.390 | −0.112 *** | 0.283 (0.452) |
| Safe Work Observations Indicator | −0.448 * | −1.710 | −0.062 * | 0.657 (1.521) |
| Near Misses Indicator | −0.486 | −1.260 | −0.067 | 0.259 (0.082) |
| Number of Observations | 297 | |||
| Log-likelihood (at Zero) | −124.960 | |||
| Log-likelihood at Convergence | −116.858 | |||
| Chi-Squared | 16.202 | |||
Publisher’s Note: MDPI stays neutral with regard to jurisdictional claims in published maps and institutional affiliations. |
© 2022 by the authors. Licensee MDPI, Basel, Switzerland. This article is an open access article distributed under the terms and conditions of the Creative Commons Attribution (CC BY) license (https://creativecommons.org/licenses/by/4.0/).
Share and Cite
Awolusi, I.; Marks, E.; Hainen, A.; Alzarrad, A. Incident Analysis and Prediction of Safety Performance on Construction Sites. CivilEng 2022, 3, 669-686. https://doi.org/10.3390/civileng3030039
Awolusi I, Marks E, Hainen A, Alzarrad A. Incident Analysis and Prediction of Safety Performance on Construction Sites. CivilEng. 2022; 3(3):669-686. https://doi.org/10.3390/civileng3030039
Chicago/Turabian StyleAwolusi, Ibukun, Eric Marks, Alexander Hainen, and Ammar Alzarrad. 2022. "Incident Analysis and Prediction of Safety Performance on Construction Sites" CivilEng 3, no. 3: 669-686. https://doi.org/10.3390/civileng3030039