Article

Finite-Element Analysis of Adjacent Concrete Box Girders Transversely Post-Tensioned at the Top Flanges Only

by
Shady N. Labib
1 and
Ehab F. El-Salakawy
2,*
1
Tetra Tech Canada Inc., Winnipeg, MB R3B 2L6, Canada
2
Department of Civil Engineering, University of Manitoba, Winnipeg, MB R3T 5V6, Canada
*
Author to whom correspondence should be addressed.
CivilEng 2022, 3(2), 165-183; https://doi.org/10.3390/civileng3020011
Submission received: 3 February 2022 / Revised: 17 March 2022 / Accepted: 17 March 2022 / Published: 22 March 2022
(This article belongs to the Special Issue Advances in Civil Engineering)

Abstract

:
A three-dimensional non-linear finite-element model (FEM) was constructed using a commercial software (ATENA-Studio) to investigate the transverse load distribution behavior of adjacent precast prestressed concrete box-girder bridges. An innovative connection between box girders was used, where transverse post-tensioning was applied at the top flanges only eliminating the need for intermediate transverse diaphragms. The FEM was validated in terms of deflections, strains, cracking and ultimate loads against experimental results previously reported by the authors. The validated FEM was then used to perform a parametric study investigating the influence of adding concrete topping, load location, and bridge width on the transverse load distribution behavior of the newly developed connection. The results of the FEM demonstrated the efficiency of concrete topping in limiting mid-span deflections up to 25%. Additionally, the maximum live load moment distribution factors (LLMDFs) for different load locations and bridge widths were evaluated.

1. Introduction

Adjacent precast, prestressed concrete box girders are of favorable choice for short- and medium-span bridges by virtue of their easy and fast construction [1,2]. Bridges of this type are typically composed of longitudinal precast members connected at their interface using partial- or full-depth grouted shear keys. In recent decades, transverse post-tensioning (TPT) has been introduced to promote the monolithic behavior of such bridges and control longitudinal cracking recurrently develops over shear keys [3,4]. Typically, TPT is applied at transverse solid diaphragms cast monolithically with the girders. Nevertheless, the presence of such diaphragms is associated with increased cost and time. Such an increase is more pronounced in skew bridges, where diaphragms need to be staggered or cast in stages. Additionally, the provision of diaphragms imparts complex formworks, and interruption of utility lines provided through the hollow portions of the girders [5]. Therefore, several studies have considered the elimination of transverse diaphragms from bridges of this type and proposed alternatives to applying TPT. Hansen et al. [5] introduced a diaphragm-free TPT connection incorporating sleeves above and below the bottom and top flanges, respectively, to house the TPT. Recently, Sun et al. [6] reported a novel transverse connection, implemented in the St. Clair Road Bridge, Michigan, where TPT was applied at both the top and bottom flanges. Nonetheless, placing TPT ducts in the bottom flanges might interfere with longitudinal prestressing, and eventually require increasing the thickness of the bottom flanges. Labib et al. [7] conducted a pioneer experimental study to investigate the feasibility of applying TPT at the top flanges only, eliminating the need for transverse diaphragms. The study investigated the efficiency of the proposed TPT technique in effectively distributing the applied load under simulated service and ultimate conditions. The studied parameters included the location of the applied load and the level and distribution of TPT along the longitudinal direction of the bridge. Nevertheless, the effect of several parameters still needs to be studied. Accordingly, it was decided to use non-linear finite-element analysis (FEA) to predict the behavior of the newly developed connection when several key parameters are altered.
Numerous studies have adopted FEA to investigate the behavior of adjacent box-girder bridges. These studies have assumed different modeling techniques when simulating different bridge components such as the interface among adjacent girders and the boundary conditions. Aktan et al. [8] evaluated the transverse stress among adjacent girders. The grout-to-girder interface was modeled as tightly bonded joints given that these joints were initially intended to ensure moisture seal and to be crack free. A similar approach was adopted by Semendary et al. [9], where a simpler model using a continuous deck instead of shear keys was able to capture overall bridge behavior. In that study, a single-span bridge consisting of seven adjacent girders, with a total length of 18,600 mm, and overall width of 8500 mm, was subjected to truckloads of 249.5 and 237.5 kN. Grace et al. [10] studied stress distribution and development due to the combined effect of traffic and thermal loads. In that study, the grout material was modeled as friction interface elements among the adjacent girders. A similar approach was assumed by Fu et al. [11], where a contact friction material of a specified coefficient of friction was employed between adjacent girders. Other studies have adopted surface-to-surface contact to model the grout-to-girder and girder-to-girder interface [9,12]. In those studies, a friction coefficient and critical shear values were assumed to characterize the tangential behavior of the interface between the shear key and girder surfaces. On the other hand, several assumptions have been suggested to simulate the bridge boundary conditions. Badwan and Liang [13] assumed restrained translational movements when modeling supports at interior piers and restrained translational movements, except the longitudinal direction, when modeling supports at end abutments. Semendary et al. [9] demonstrated that using a pin-roller with longitudinal stiffness resulted in a very similar behavior to a field-tested bridge. In that study, translational movements were restrained at one end, and allowed only in the longitudinal direction with a longitudinal stiffness of 2.6 kN/mm at the other end.
In this study, a three-dimensional (3D) non-linear finite-element model (FEM) is constructed using the ATENA-Studio software [14]. The interactive graphical user interface GiD program [15] was used to create the input data and to generate the mesh. The FEM was validated against the experimental results of a bridge model previously tested by the authors [7]. Consequently, the validated FEM was used to carry out an extensive parametric study investigating key parameters influencing the load distribution behavior of the bridge including the presence of concrete topping, load location, and bridge width.

2. Experimental Program

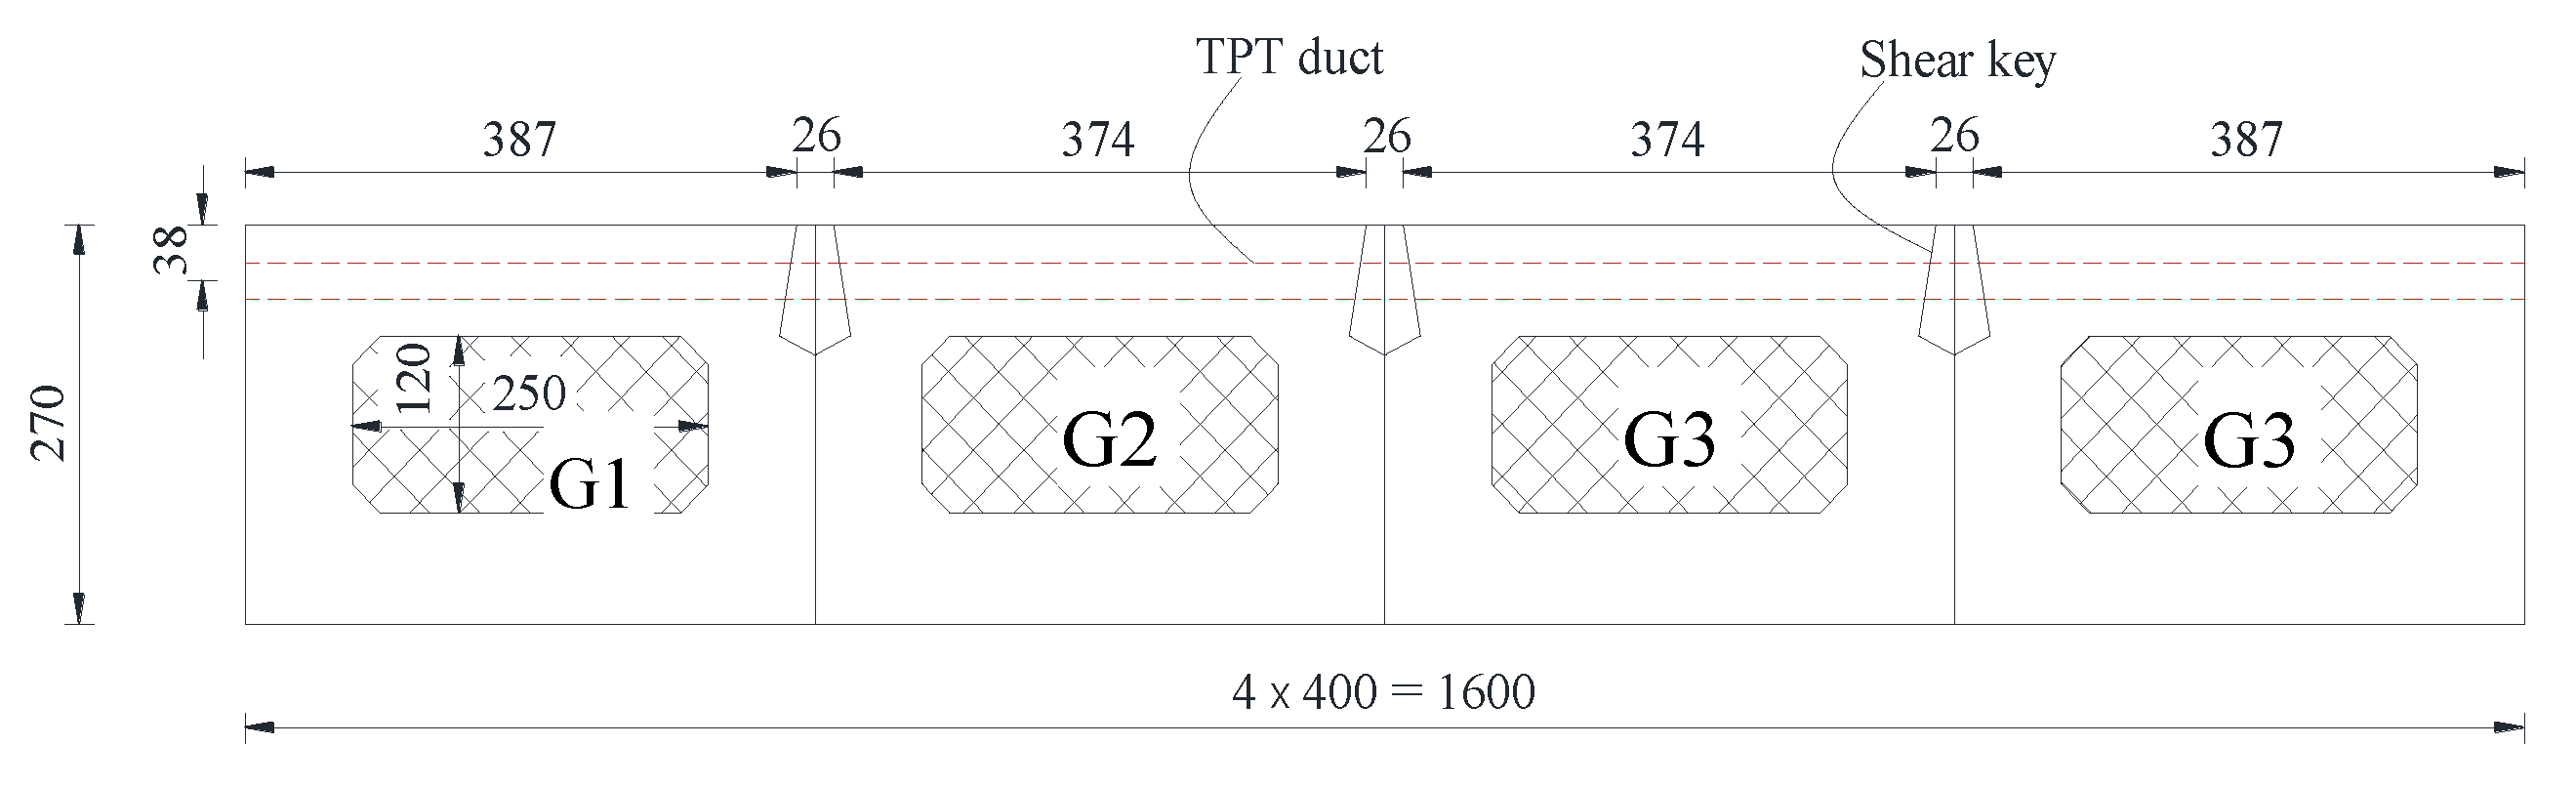
2.1. Details of Tested Bridge

A one-third-scale, single-span bridge was erected and tested. The bridge consisted of four adjacent precast box girders. As shown in Figure 1, each girder was 400 mm in width, 270 mm in height, and 6400 mm in length. The thickness of all flanges and webs was 75 mm. Partial-depth shear keys of 75 mm in depth, filled with gout, were used to connect the adjacent girders. A total of 9 25 mm-diameter PVC ducts were placed in the top flanges equally spaced at 750 mm to house the TPT. Two end blocks of 400 mm in length were provided near the supports. The reinforcement of the bridge model was calculated using the Canadian Highway Bridge Design Code (CHBDC), CSA S6-19 [16] to avoid cracking under simulated service load (a single concentrated vertical load of 80 kN) and to ultimately fail in a ductile flexural mode, when the ultimate load is applied. As shown in Figure 2, each box girder was reinforced with three size 13 prestressing steel strands (12.7 mm). In addition, five size 10 M non-prestressing steel bars, three at the bottom and two at the top, were used in the longitudinal direction. Shear reinforcement of each girder comprised size 10 M vertical stirrups spaced at 70 mm at end blocks and 140 mm in the mid-span region.

2.2. Material Properties

All box girders were constructed at a precast plant using concrete with a target 28-day compressive strength of 50 MPa. The mechanical properties of the used reinforcement are listed in Table 1. High-performance, non-shrink, bleed-resistant, sand-free, cementitious grout with a target 28-day compressive strength of 75 MPa was used to fill the shear keys [7].

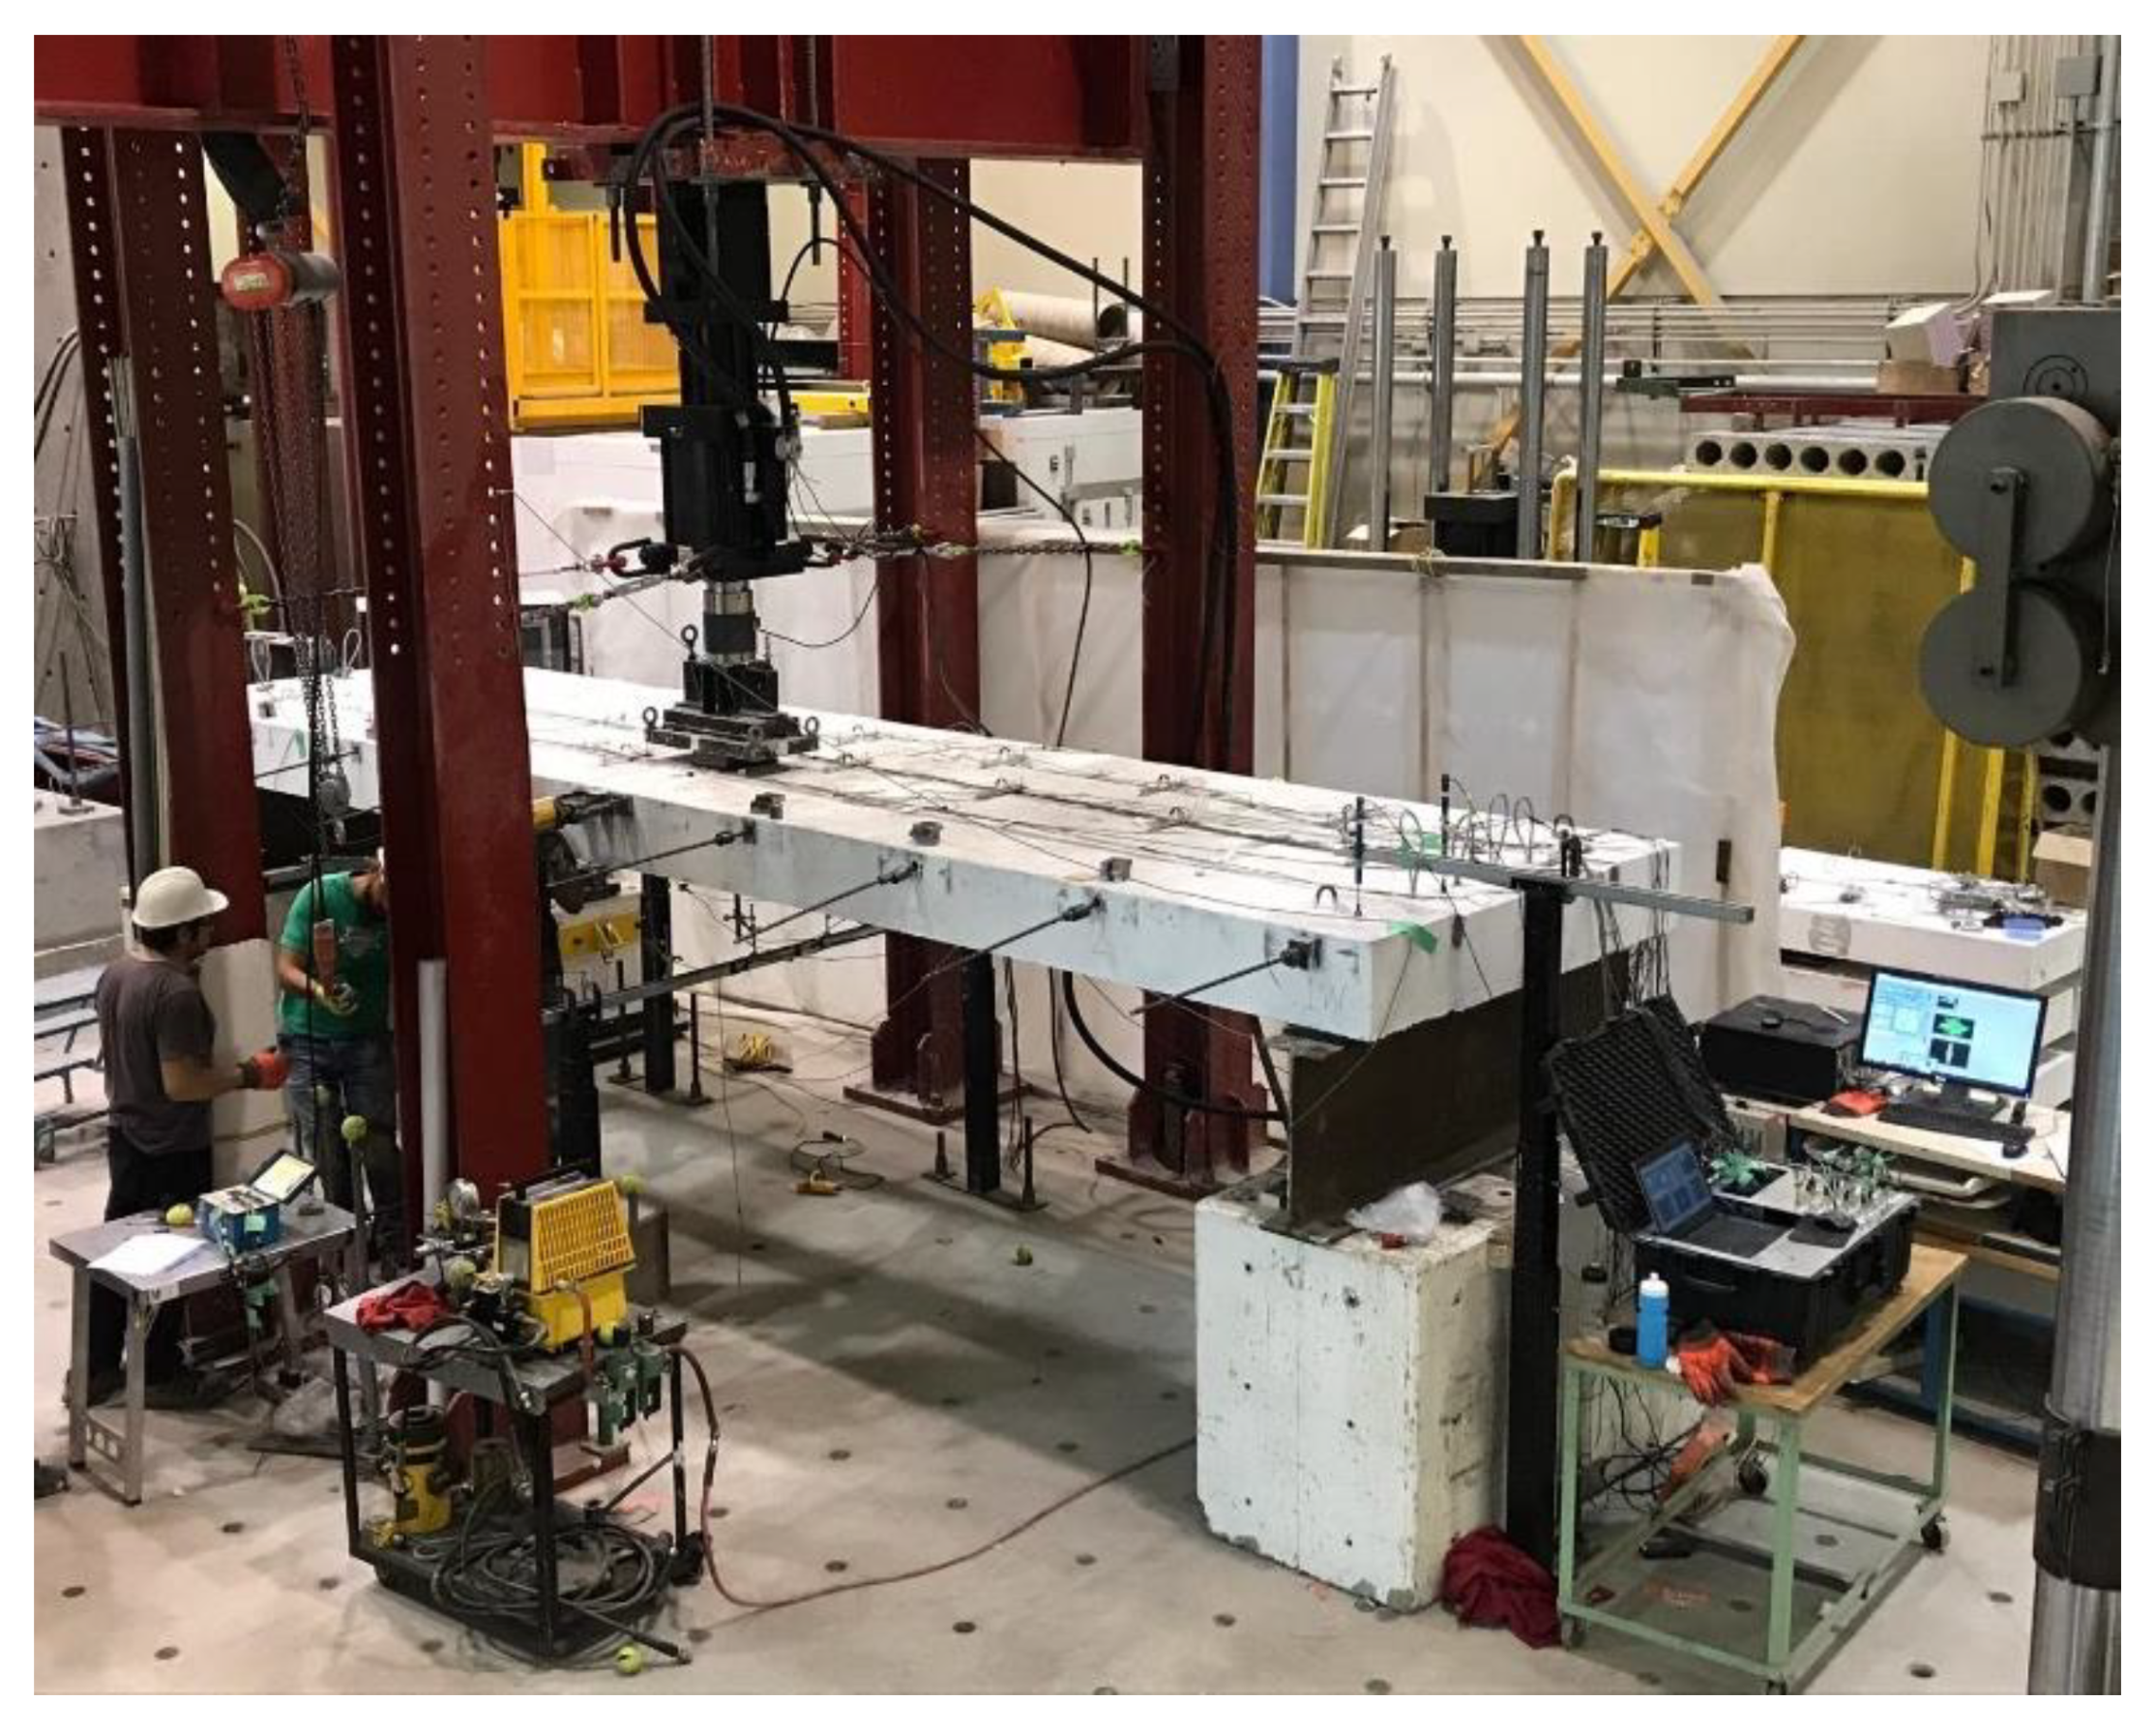
2.3. Loading and Instrumentation

The bridge was subjected to four different tests, (1) a strain distribution test—uncracked shear key, (2) a load distribution test—uncracked shear key, (3) a load distribution test—cracked shear key, and (4) an ultimate load test. The strain distribution test was conducted to determine the adequate level of TPT force to achieve the minimum required prestress of 1.70 MPa suggested by the current CHBDC, CSA S6-19 [16] and AASHTO specification LRFD-9 [17]. In this respect, different values of TPT forces (50, 70, 90 and 110 kN) were applied at different spacing utilizing either 3 ducts (spaced at 3000 mm), 5 ducts (spaced at 1500 mm) or 9 ducts (spaced at 750 mm). The load distribution tests (uncracked and cracked shear key conditions) and the ultimate load test were designed to investigate the efficiency of the proposed transverse connection in distributing live loads in the transverse direction under simulated service, and ultimate load conditions, respectively. The load distribution test was conducted by applying a single concentrated vertical load of 80 kN (below the cracking load of the assembled bridge) twice, once on exterior and once on interior girders, taking advantage of the symmetry about longitudinal axis. The load was applied using a rectangular steel plate (250 × 180 mm) that represents a one-third-scale footprint of the standard wheel load. The load distribution test was repeated after partially cracking the shear key joints simulating longitudinal cracking recurring during the bridge service time. Three different TPT levels of 50, 70 and 90 kN were applied at two TPT arrangements (5 ducts spaced at 1500, and 9 ducts spaced at 750 mm). For all TPT levels and arrangements, live load moment distribution factors (LLMDFs) were estimated by dividing the longitudinal concrete strain measured at the bottom of one girder to the summation of all measured strains for all girders [18]. In the ultimate load test, an exterior girder was loaded in several loading and unloading cycles up to failure when a TPT force of 70 kN was applied at each of the nine TPT locations equally spaced at 750 mm. Figure 3 shows the test setup used throughout the tests. More details about the instrumentation layout, results, and discussion can be found in Labib et al. [7].

3. Characteristics of Finite-Element Model

To extend the investigation of the behavior of the developed TPT connection, a series of FEMs were prepared using the software package ATENA-Studio to study the effect of key parameters on the transverse load distribution behavior. The following sections describe the basic characteristics of the constructed FEMs. Further details can be found elsewhere [14,15].

3.1. Geometry and Boundary Conditions

Figure 4 shows the FEM of the tested bridge. Taking advantage of the symmetry about the transverse axis, only half of the bridge model was constructed and analyzed. The concrete, grout, and steel elements were modeled using four-node tetrahedral elements. These elements can accommodate the geometrical irregularities associated with the hollow portions and indented edges of each box girder. A semi-structured mesh was employed in the GiD interface, where the mesh is only structured in the topologically prismatic direction of the volume, i.e., the longitudinal direction of the bridge model. In a preliminary study, a mesh sensitivity analysis was conducted, and it was demonstrated that further reduction in the average element size to less than 50 mm compromised the computing effort with inappreciable difference in the analysis results. Accordingly, a total of 122,444 tetrahedral elements of an average size of 50 mm were used to model the geometry of the bridge model. Figure 5 shows the properties of the used mesh. The monolithic behavior between the end blocks and the hollow portions of each girder was simulated using fixed contact boundary condition at the block-to-girder interface. Thus, deformation compatibility between end blocks and the remaining hollow portion of each girder was enforced. Boundary conditions were selected to have a hinge support at one end and a roller support at the other end of the bridge model, i.e., pin-roller condition. This was achieved by restraining the displacement perpendicular to the plane of cut (plane of symmetry) and allowing only longitudinal displacement at the other end. As such, the system forces were balanced, and the bridge model was kept in static equilibrium.

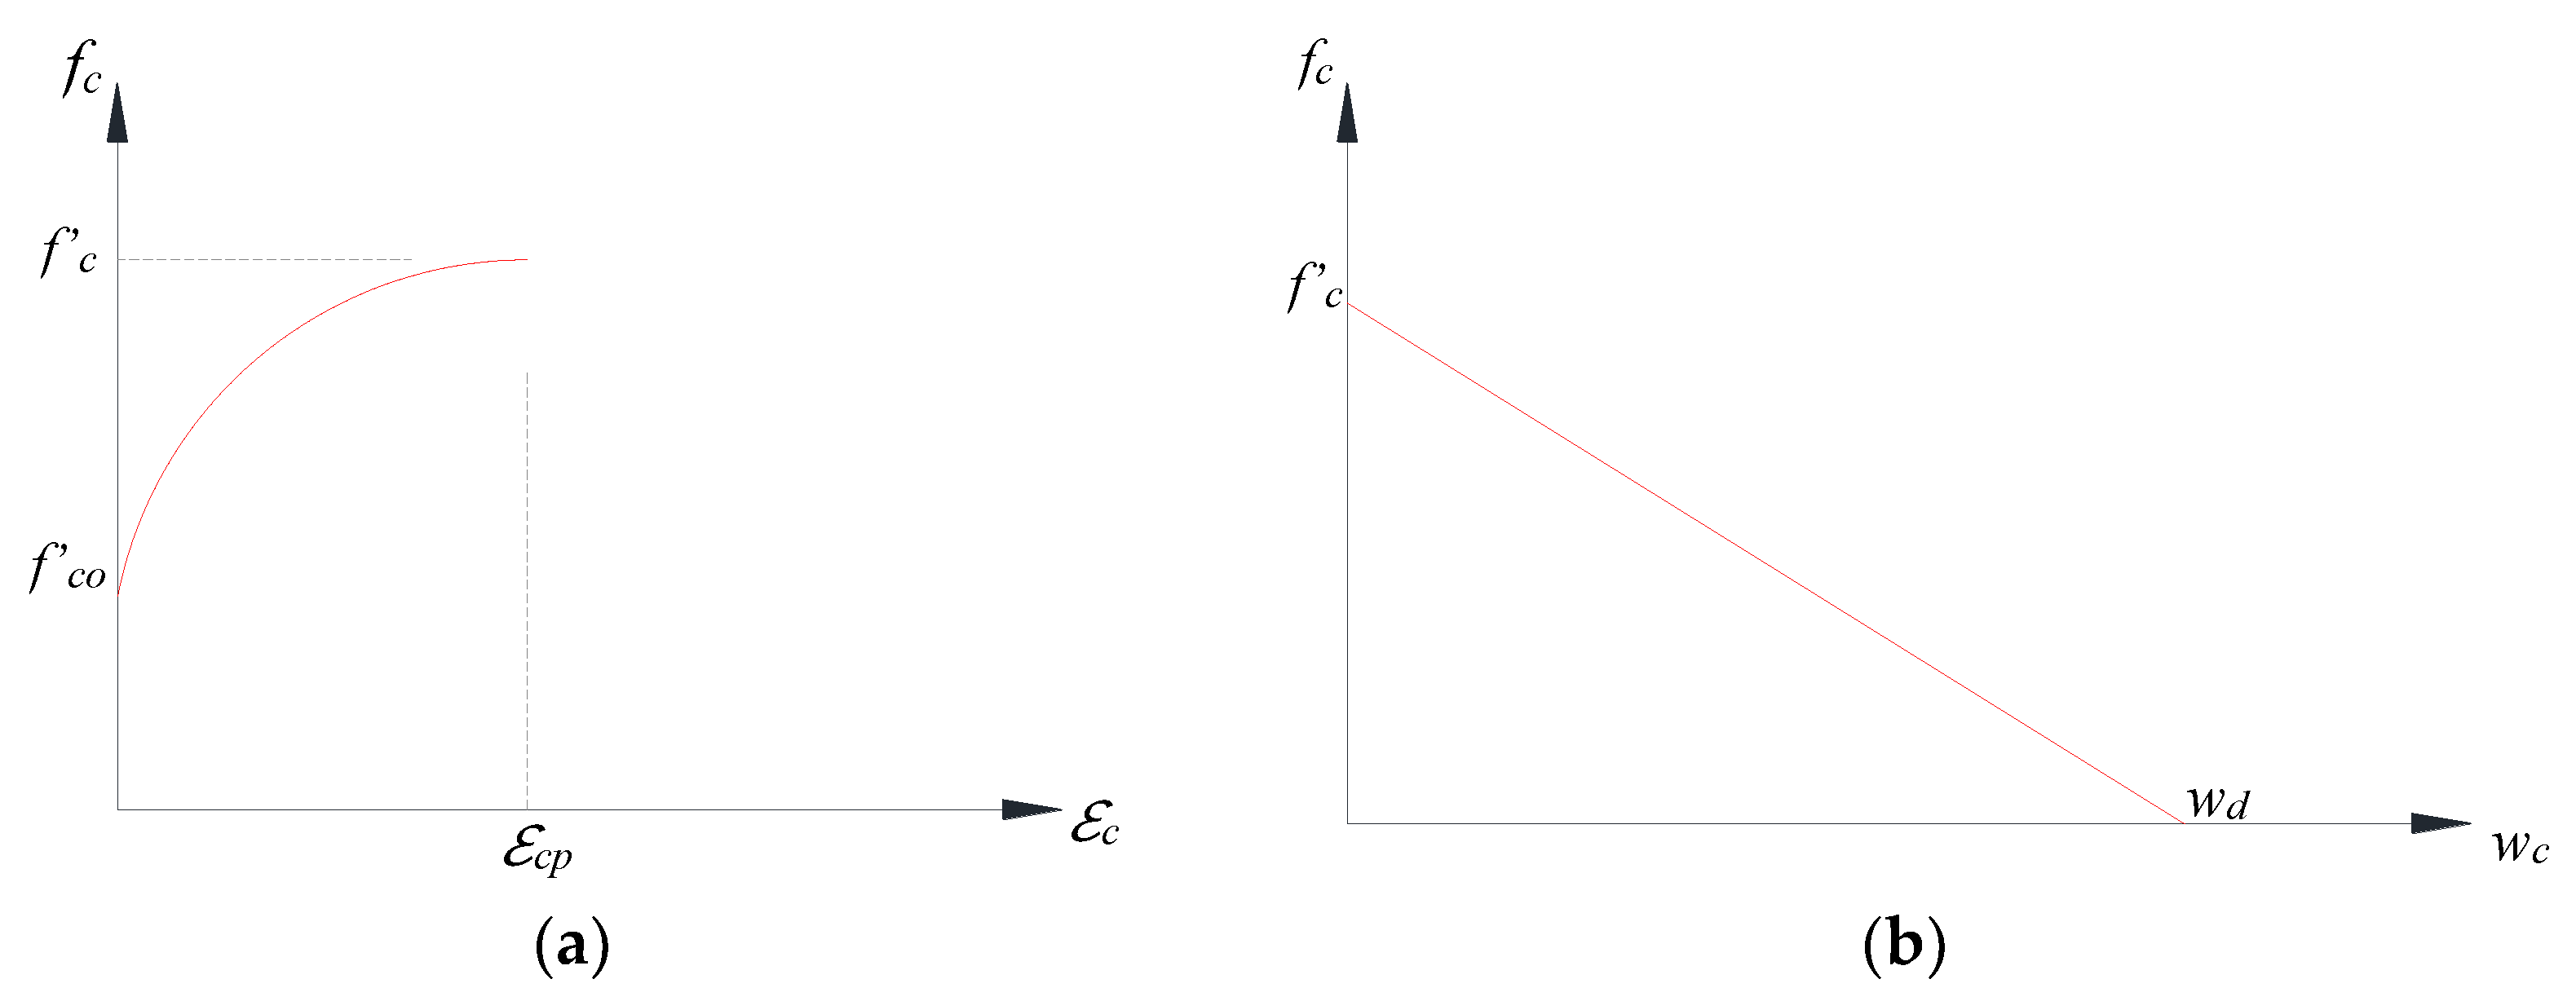
3.2. Concrete and Grout Material

In the ATENA–GiD interface, a fracture-plastic constitutive model was assigned to the geometrical entities. The fracture-plastic model combines two different constitutive models for tensile (fracture) and compressive (plastic) behavior [14]. The ATENA software adopts special algorithm to allow both models, i.e., fracture and plastic models, to be developed and formulated separately. This way, the cases when failure surfaces of both models are active, can be captured. In ATENA, this material model is formulated based upon the decomposition of the strain vector into elastic, plastic, and fracturing strains as follows:
ε i j = ε e i j + ε p i j + ε f i j
The new stress state (stress evolution) is given as follows:
σ i j ( n ) = σ i j ( n 1 ) + E i j k l ( Δ ε k l Δ ε p k l Δ ε f k l )
where E = the elastic stiffness tensor, Δε = the increment in elastic strain, Δεp = the increment in plastic strain, and Δεf = the increment in the fracturing strain.
The fracture model adopts the classical orthotropic smeared crack formulation and crack band model employing Rankine failure criterion and exponential softening. In ATENA, the Rankine criterion is employed as follows:
F f i = σ i i t f t i 0
where Ffi = the failure surface, σ′iit = the trial tensile strength in local axes of the element, and f′ti = the tensile strength in the material direction.
The smeared crack model can be either a rotated or fixed crack model. In both models, a crack is initiated when the principal stress exceeds the tensile strength of the material. In the fixed crack model, the crack direction is defined by the principal stress direction at crack initiation. During further loading steps, the principal stress direction is fixed, which represents the material orthotropic axis. In the rotated crack model, the direction of the principal stress coincides with the principal strain direction. Accordingly, no shear stresses are induced on the crack plane. In this study, the fixed crack model was adopted.
The effect of tension stiffening, i.e., the increase in the stiffness of a concrete section due to the transmission of stresses from a reinforcing bar to the surrounding concrete in the tension side between two adjacent cracks, was simulated by a tension-stiffening factor. This factor represents a limiting value of the tensile strength in the tension softening diagram. In this study, such factor was set to 0.4 as recommended by CEB-FIB Model Code [19]. This way, the tensile stress of cracked concrete cannot drop below 40% of the specified tensile strength.
The shear strength of the cracked concrete is simulated using the modified compression field theory introduced by Vecchio and Colins [20]. In this theory, the shear strength, converted into the material direction (principal directions in case of the rotated crack model and the principal directions at the onset of cracking in case of the fixed crack model) is given by:
σ i j = 0.18 f c 0.31 + 24 w a g + 16
where f c = the compressive strength in MPa, w is the maximum crack width in mm at the given location, and ag is the maximum aggregate size in mm. In this study, the maximum aggregate size ag was set to 20 mm otherwise, the shear stress on a crack surface is limited to the tensile strength [14].
Similarly, a reduction in the compressive strength after cracking in the direction parallel to the crack was accounted for by a factor representing the maximal strength reduction under the large transverse strain. In this study, this factor was set to 0.8, according to Dyngeland [21].
The compressive (plastic) model, on the other hand, adopts a softening/hardening plasticity model based on the Menétrey–Willam failure surface.
The position of failure surfaces is not fixed but is a function of the of strain hardening/softening behavior shown in Figure 5. The hardening/softening law is based on the uniaxial compressive test. The non-linear elliptic hardening branch is based on strains whereas the softening branch is based on displacements. As shown in Figure 6, the elliptical ascending part is a function of the onset of non-linear behavior f c 0 as well as the value of plastic strain at compressive strength ε c p . On the other hand, the end of the linear softening part is controlled by means of the plastic displacement w d . In this study, w d was set to 0.5 mm, according to Van Mier [22].
The parameters of the constitutive model, i.e., modulus of elasticity, fracture energy and tensile strength are dependent on of the concrete compressive strength [14], as illustrated in Equations (5)–(7). The values of the main parameters used for the concrete and grout materials are listed in Table 2.
f t = 0.27 f c
E c = ( 6500 19.8 f c ) f c
G F = 0.000025 f t

3.3. Reinforcement Material

All reinforcements (prestressing strands and regular non-prestressed steel) were modeled as discrete reinforcement using truss elements embedded in the solid elements (tetrahedral elements). A bi-linear material model with strain hardening was assigned to the reinforcement entities. The ascending line has a slope equal to the elastic modulus of reinforcement material. The second line represents the plasticity of the reinforcement material associated with hardening, and its slope is zero in case of perfect plasticity. Reinforcement properties listed in Table 1 were used for the FEM.

3.4. Loading and Bearing Plates

Elastic isotropic material was used to model the loading and bearing plates. This material was defined with a modulus of elasticity of 200 GPa and a Poisson ratio of 0.3.

3.5. Bond Model

ATENA introduces the bond slip of reinforcing bars in two predefined models in addition to a user-defined model. The two models are the CEB-FIB model code from 1990, the bond-slip law by Bigaj [19,23]. These models take into account the concrete compressive strength, and reinforcement diameter and type [14]. In this study, the bond-slip model proposed by Bigaj [23] was used to model prestressed and non-prestressed reinforcement. Such a model was reported to reduce the effect of mesh size associated with the full-bond model, where relatively large mesh size results in very limited slip values [24]. This bond model was successfully used to model the bond behavior of prestressed reinforcement [25]. On the other hand, an internal cable model with the coefficient of friction set to zero was used to simulate un-bonded TPT.

3.6. Interface and Bonding Materials

The interface between the adjacent girders was modeled using the interface material model implemented in ATENA. This material model was assigned to fictitious contact volumes drawn at the girder-to-girder interface. In this material model, the Mohr–Coulomb failure criterion was adopted, where the shear strength of the interface material, τ, is a function of the normal stress, σ, the angle of internal friction, ϕ, and the cohesion, C, as shown in Figure 7.
When the tension strength of the interface material, f t , was set to zero, no tension was permitted, and full compression was assumed. Similarly, this interface material was used to model the interface between the precast girders and the enclosed grouted-shear keys (girder-to-grout interface), with an adjusted coefficient of friction of C = 1.0 as per AASHTO LRFD-9 [17]. A further simplified model was constructed assuming fixed contacts at the girder-to-grout interface. This simplified model was reported as efficient in where there is no slippage between the girder-to-shear key interface [9]. In this study, such a model could capture the behavior of the modeled bridge.

3.7. Continuum-Based Governing Equation

The continuum-based governing equation utilized in ATENA is given by:
t M t 2 U ¯ ( i ) t + Δ t + ( K L t + K ( i 1 ) t + Δ t N L ) Δ U ¯ ( i ) t + Δ t = R ¯ t + Δ t F ¯ ( i 1 ) t + Δ t
where K L t = the linear strain incremental stiffness matrix, K ( i 1 ) t + Δ t N L = the non-linear strain incremental stiffness matrix, t M = the structural mass matrix, U ¯ ( i ) t + Δ t = the vector of nodal point displacements increments at time t + Δ, iteration, i, t 2 U ¯ ( i ) t + Δ t = vector of nodal accelerations, R ¯ t + Δ t = the vector of applied external forces, F ¯ ( i 1 ) t + Δ t = the vector of internal forces, and superscript i (i − 1) indicates iteration number.

3.8. Load Application and Solution Method

The loading process of the bridge model comprised four different loading cases. In the first loading case, the prestress was applied to the longitudinal prestressing tendons. The prestress was simulated by applying initial strain, calculated based on the elastic modulus of the prestressed material, to the end nodes of the strands. The second loading case simulated the casting of the precast elements in the precast plant. This was achieved by activating the self-weight of the concrete material. In the third loading case, TPT stress was applied at the top flanges of the girders only. The final loading case included the application of the external vertical load. For each load case, the applied load was divided into several sequential steps. The standard Newton–Raphson iterative solution method implemented in ATENA-Studio was employed in the analysis. In this method, a set of non-linear equations are solved for the vector of internal forces until four convergence criteria were satisfied. The first criterion checks the norm of relative deformation during the last iteration, the second criterion checks the norm of the out-of-balance forces, the third criterion checks out-of-balance energy, and the fourth criterion checks out-of-balanced forces in terms of maximum components [14]. A conditional break criterion was set to stop the analysis when the convergence errors are large at the end of a given step. The default convergence error tolerance for the first three criteria in ATENA-Studio was set to 1%. By setting the step stop multipliers at 10, the analysis is stopped if the convergence error at the end of a given step exceeds 10%.

4. Model Validation

The accuracy of the FEM was calibrated against the experimental results in a two-stage validation process. In the first stage, where shear keys were perfectly intact, mid-span deflections and strains measured at the mid-width of each individual girder were validated under a monotonically increased service load up to 80 kN (below the cracking load of the bridge model). In the second stage, where shear keys were partially cracked, the cracking and the ultimate load capacity of the bridge model were verified.

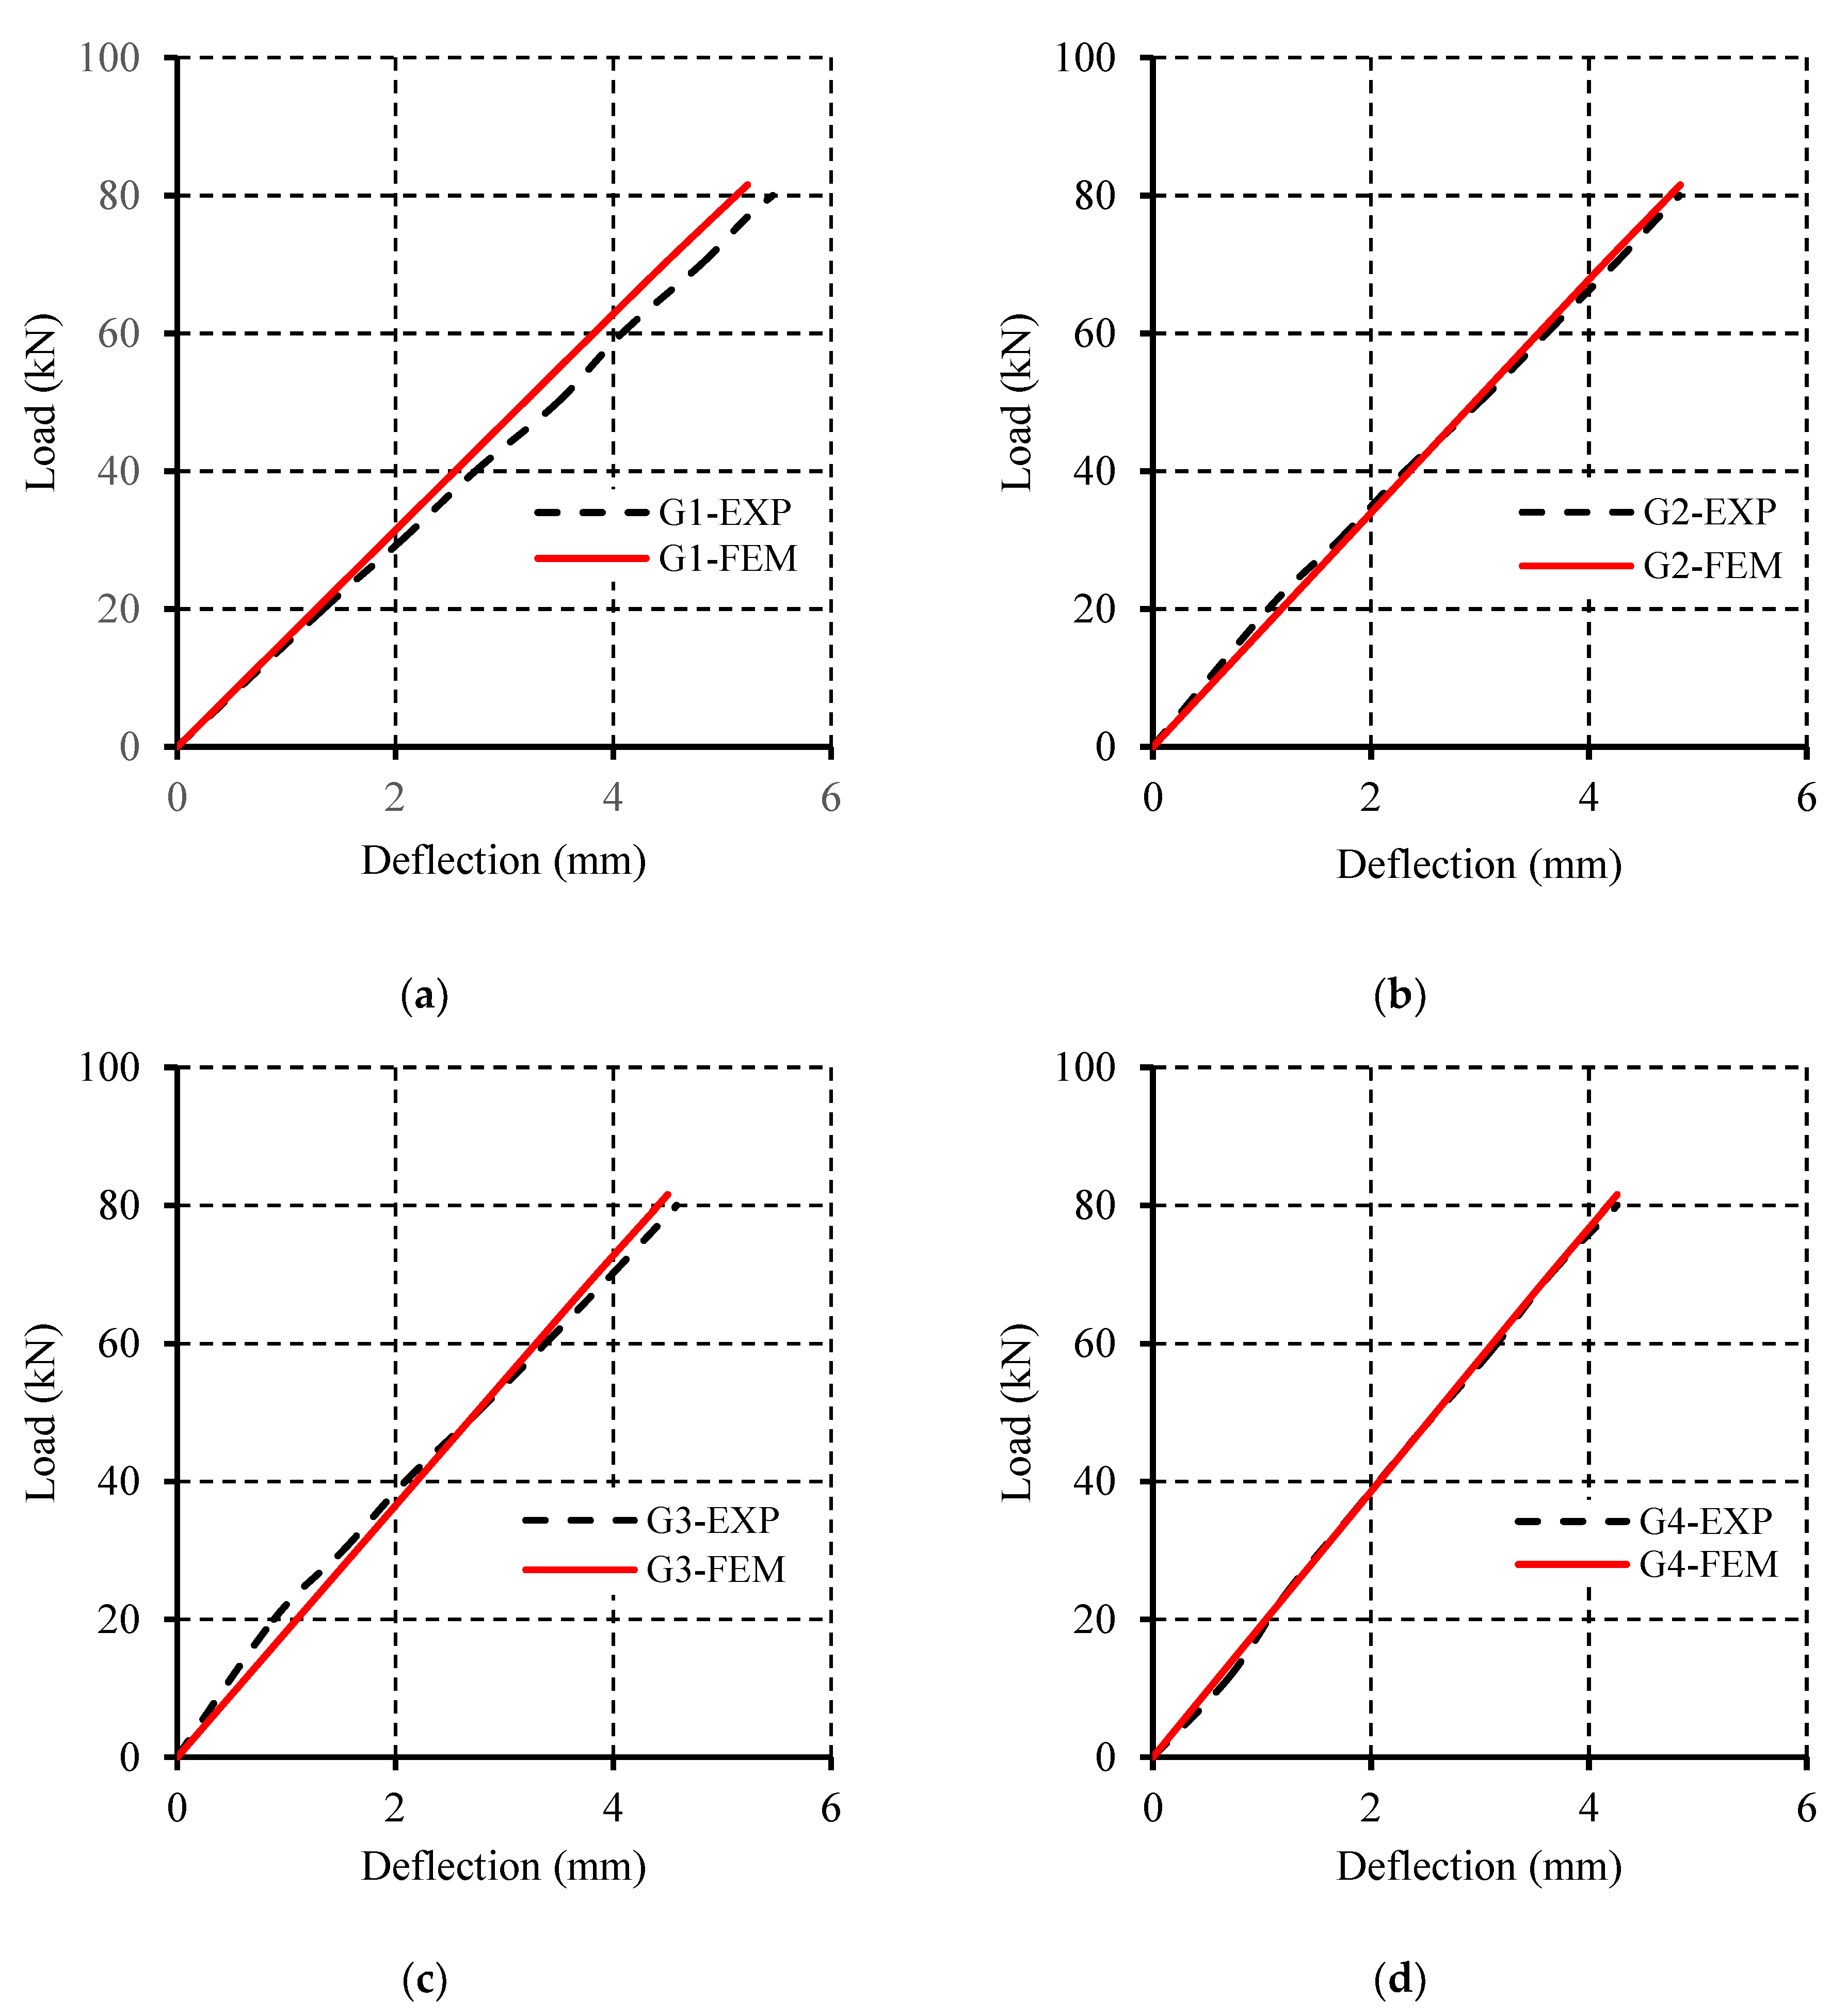
4.1. Service Load Validation

Figure 8 and Figure 9 show the load–deflection and the load–strain relationships, respectively, for the experimental and FEM results. According to these figures, when the exterior girder was loaded, and a TPT force of 70 kN was applied at all nine ducts, the numerical model agreed very well with the experimental results in terms of load–deflection and load–strain behavior (within 5% difference). A similar trend was observed for all TPT levels (50, 90 kN) and arrangements (5 ducts equally spaced at 1500 mm) used.

4.2. Ultimate Load Validation

Labib et al. [7] reported an unexpected scenario during the ultimate load test. During loading of the exterior girder G1 (loading and unloading cycles), a portion of the shear key connecting the loaded girder G1, and the adjacent girders was deboned, triggering TPT. When this occurred, TPT was the sole load transfer mechanism and maintained the integrity of the bridge. Despite TPT preventing a potential catastrophic failure, the transverse load-sharing mechanism was compromised. This eventually led to a sudden punching failure in the loaded girder G1. Accordingly, the constructed FEM was used to validate the cracking and ultimate load of the loaded girder G1. In the FEM, the analysis was terminated after reaching the ultimate load and softening began to take over. Figure 10 shows the load–deflection response of the exterior girder G1. The FEM cracking was approximately 1.5% higher than the corresponding experimental load. The ultimate capacity was 232.06 kN, which is 1.0% higher than the experimental ultimate load (229.8 kN). It is to be noted that Figure 10 does not reflect the stiffness degradation due to the application of the cyclic load and only the static ultimate load capacities were compared. Emphasis is placed on the elastic response of the bridge model (service load validation) to determine the LLMDFs to be compared to the AASHTO LRDF-9 requirements [17].

5. Parametric Study and Discussion

In this parametric study, the validated FEM was used to study the influence of key parameters on the transverse load distribution behavior of the tested bridge model in terms of mid-span deflections and tensile flexural strains. The parameters considered included the effect of adding a concrete topping of different thicknesses (75, 100 and 150 mm), the effect of wheel location (the wheel load was moved transversely every 200 mm), and the effect of the bridge width (2000, 2400 and 2800 mm). This parametric study was conducted considering a TPT level of 70 kN applied at all nine ducts equally spaced at 750 mm, which were selected based on the findings of the experimental study that such a combination could achieve the required prestress along the shear keys [7].

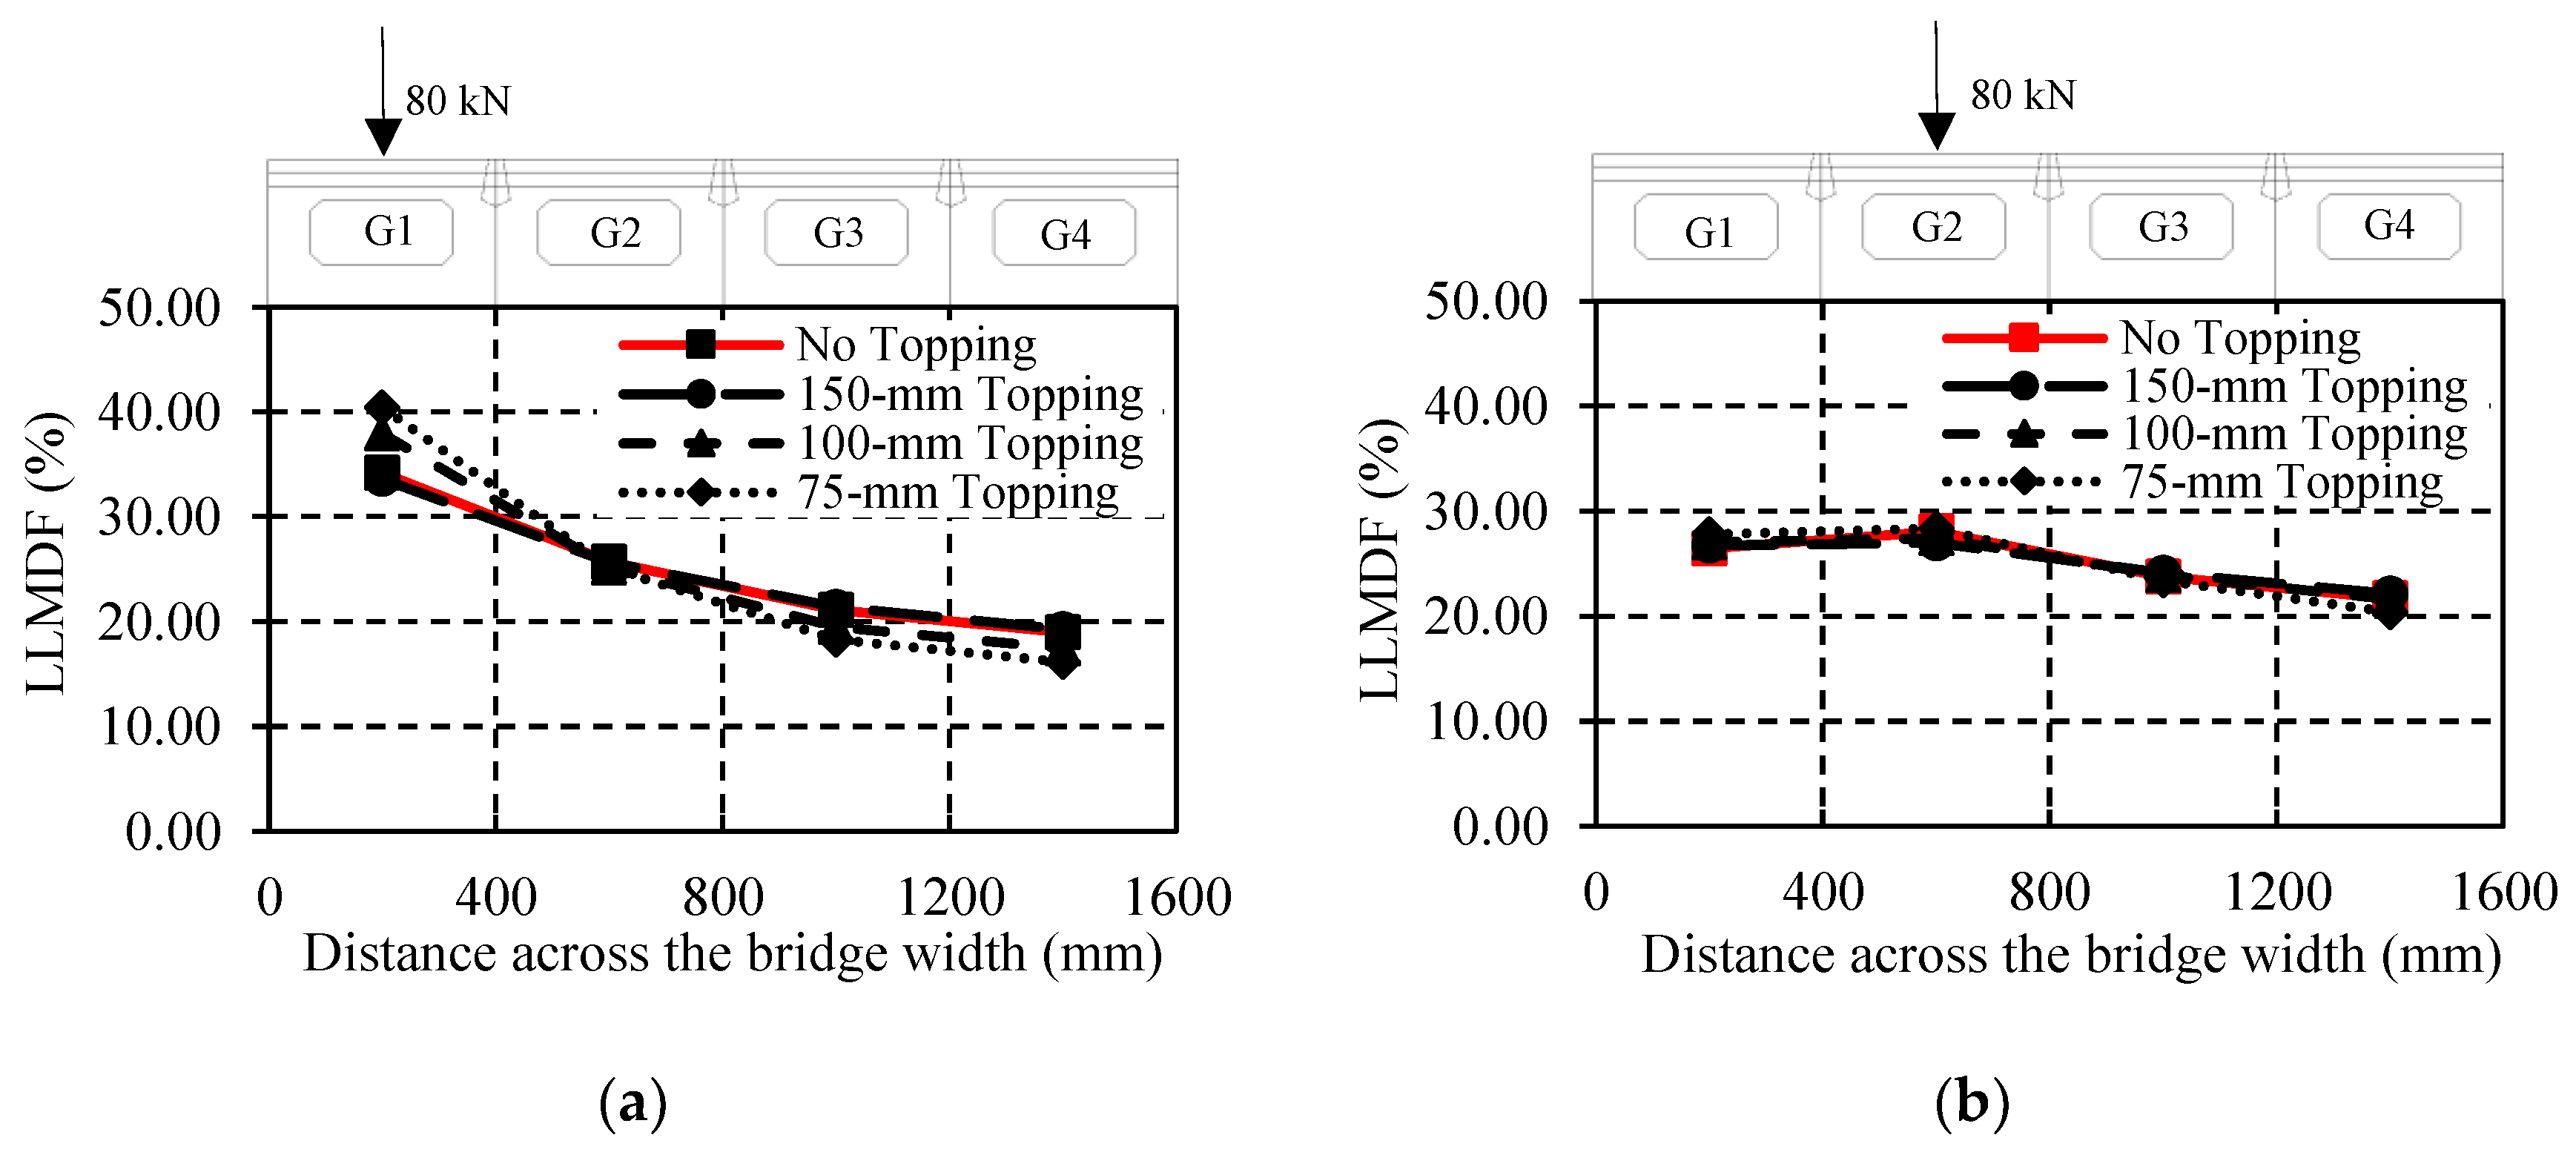
5.1. Effect of Adding Concrete Topping

The experimental program was conducted on box girders only without concrete topping. Such topping protects shear keys from cracking and promotes the uniform load distribution among adjacent girders. In this series of models, the effect of adding concrete topping was numerically investigated. Concrete topping of three different thicknesses (75, 100 and 150 mm) was considered. Figure 11 and Figure 12 show the mid-span deflection profiles and LLMDFs for different thicknesses of concrete topping. As expected, the presence of concrete topping enhanced the overall stiffness of the bridge model through limiting deflections and adding to the transverse load-sharing mechanism. For instance, when the exterior girder was loaded (80 kN), an overall reduction in mid-span deflections of 8% was recorded when using a concrete topping of 75 mm. A reduction of 17% and 25% was observed when using a concrete topping of 100 and 150 mm, respectively. A similar trend was observed when the interior girder was loaded. On the other hand, LLMDFs appeared to be insubstantially affected upon introducing concrete topping.

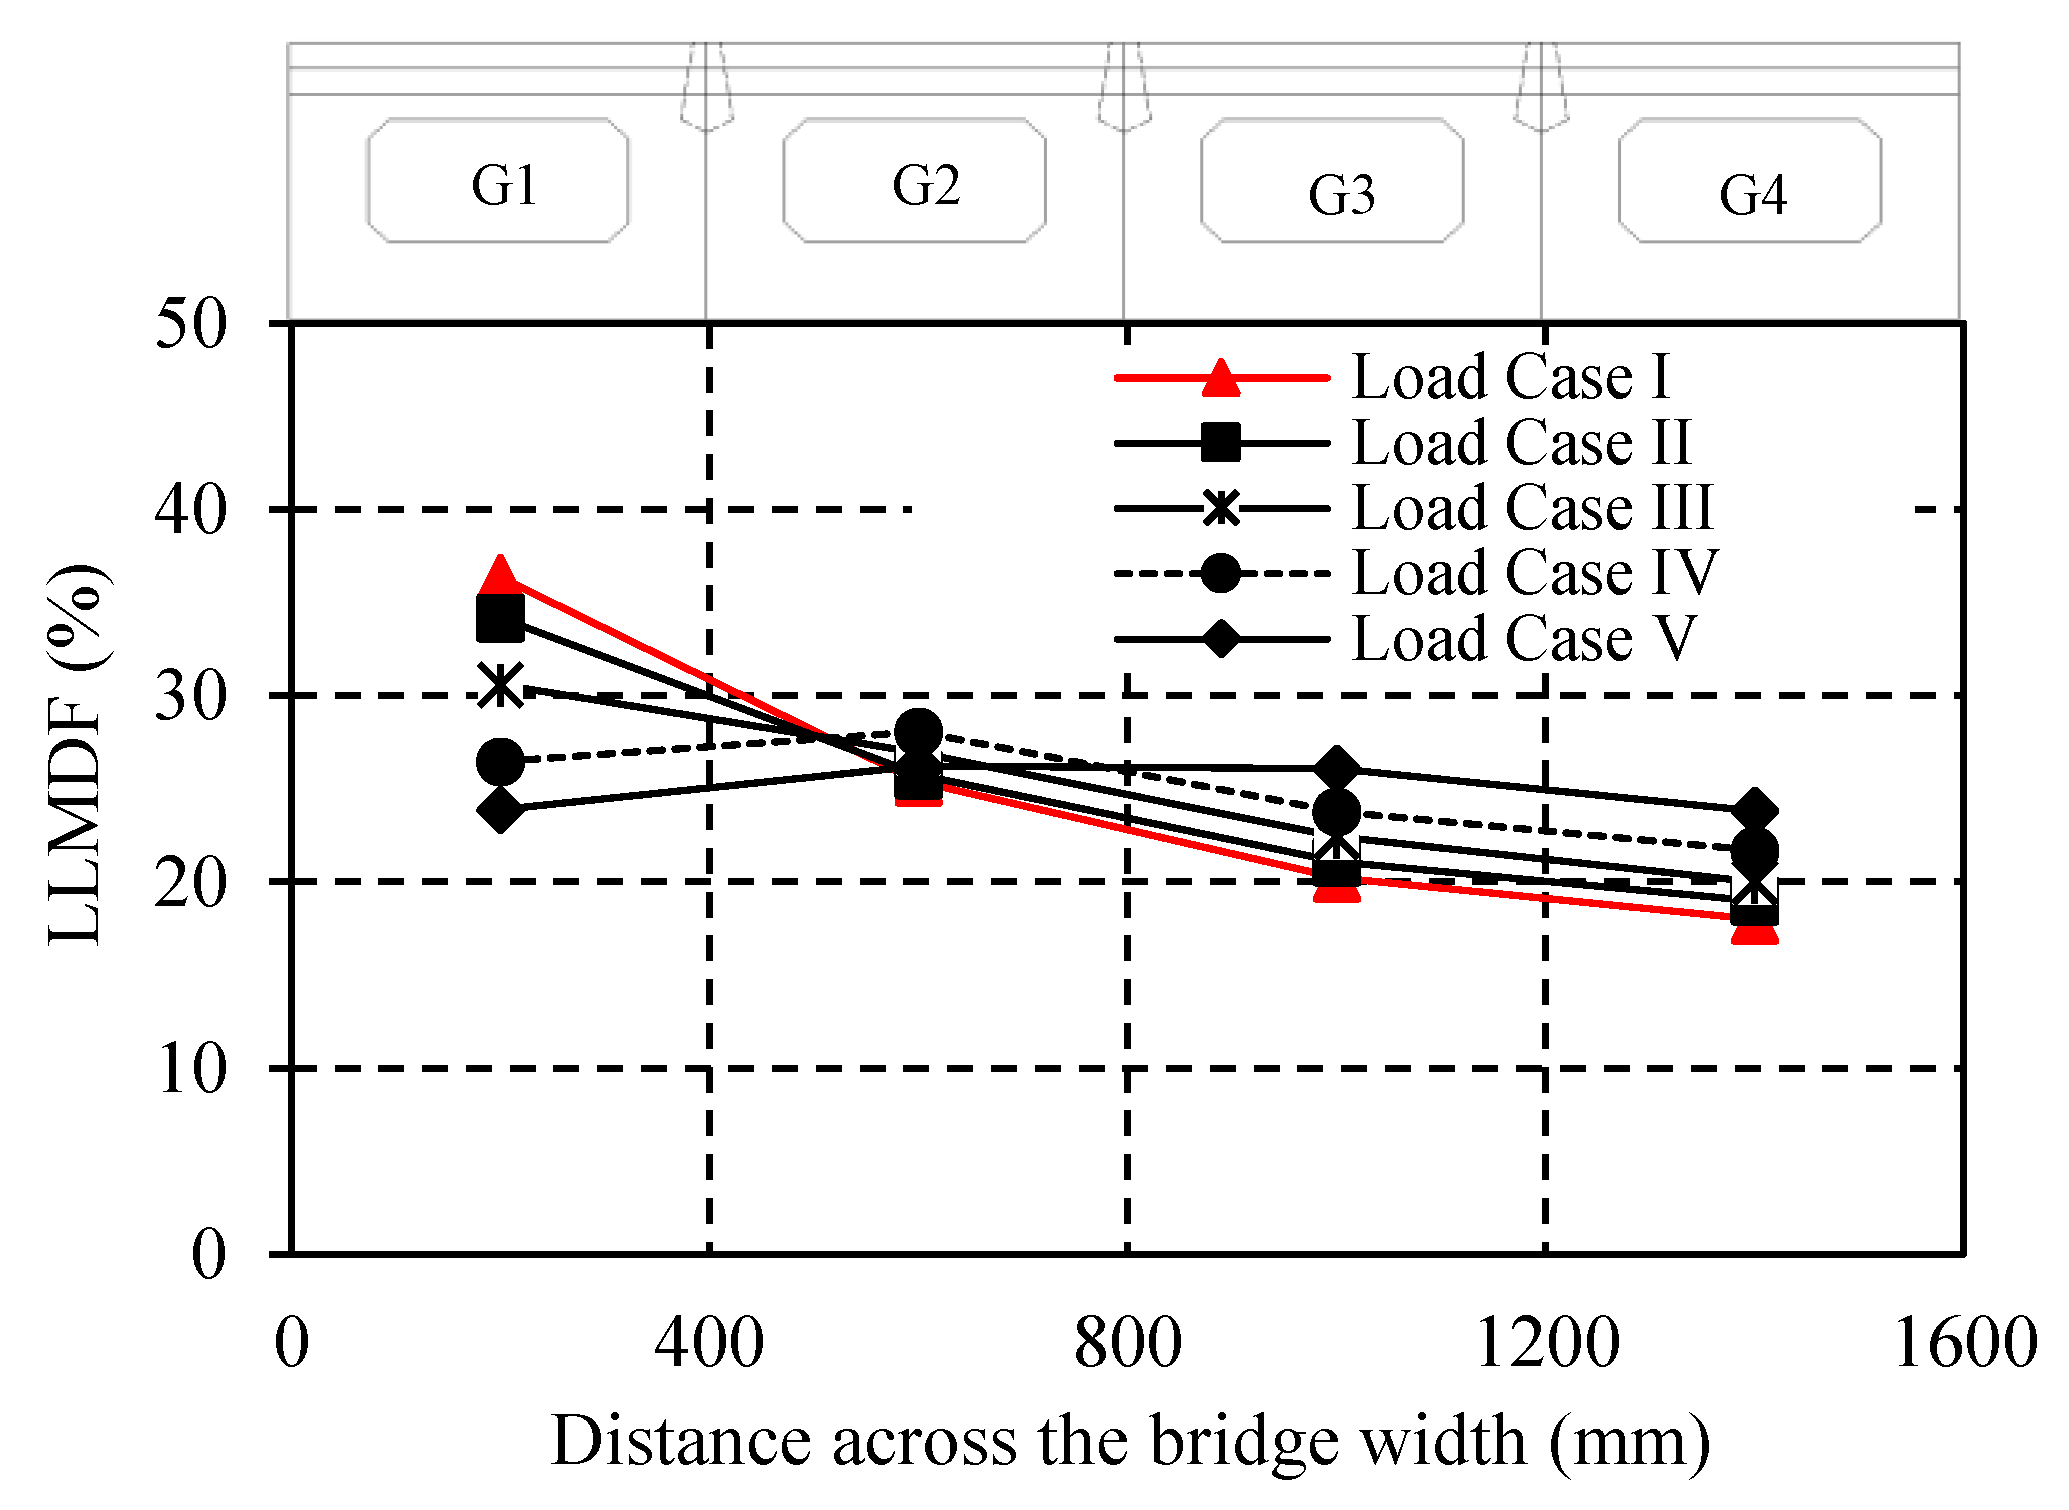
5.2. Effect of Load Location

In this series of models, the wheel load was placed transversely at different locations across the bridge width to determine the wheel location associated with the maximum load response (deflections and flexural tensile strains) for both the interior and exterior girders, respectively. In this respect, the bridge model was loaded with five static load cases, as shown in Figure 13. In these load cases, the wheel load was first placed at the edge of the bridge (Load Case I), and then transversely moved every 200 mm. Figure 14 and Figure 15 show the mid-span deflections and LLMDFs for different wheel load locations. The exterior girder experienced the highest deflections and LLMDFs when the wheel load was transversely placed at the edge of the bridge width (Load Case I). In this case, mid-span deflections of 5.24, 4.78, 4.41 and 4.16 mm were recorded at the mid-width of girders G1, G2, G3, and G4, respectively. These deflections are also higher than when the load is applied to the centerline of the external girder, i.e., Load Case II (5.12, 4.74, 4.40 and 4.17 mm). A similar trend was observed for the LLMDFs, where the exterior girder developed a maximum LLMDF of 36.4% under Load Case I, 6% higher than Load Case II (34.2%). Similar to the exterior girder, the interior girder developed a maximum deflection of 4.78 mm under Load Case I. This value is slightly higher than when the load is applied to the centerline of the interior girder, i.e., Load Case IV (2.0% higher). This observation agrees with the experimental results reported by Labib et al. [7], where the deflections of the interior and exterior girders were at a maximum when the load was placed towards the edge of the bridge width. Nonetheless, the interior girder developed a maximum LLMDF of 28.1% when the load was placed directly on the centerline (Load Case IV). This value is higher than when the load is directly applied to the shear keys, i.e., Load Case V (7.0% higher).

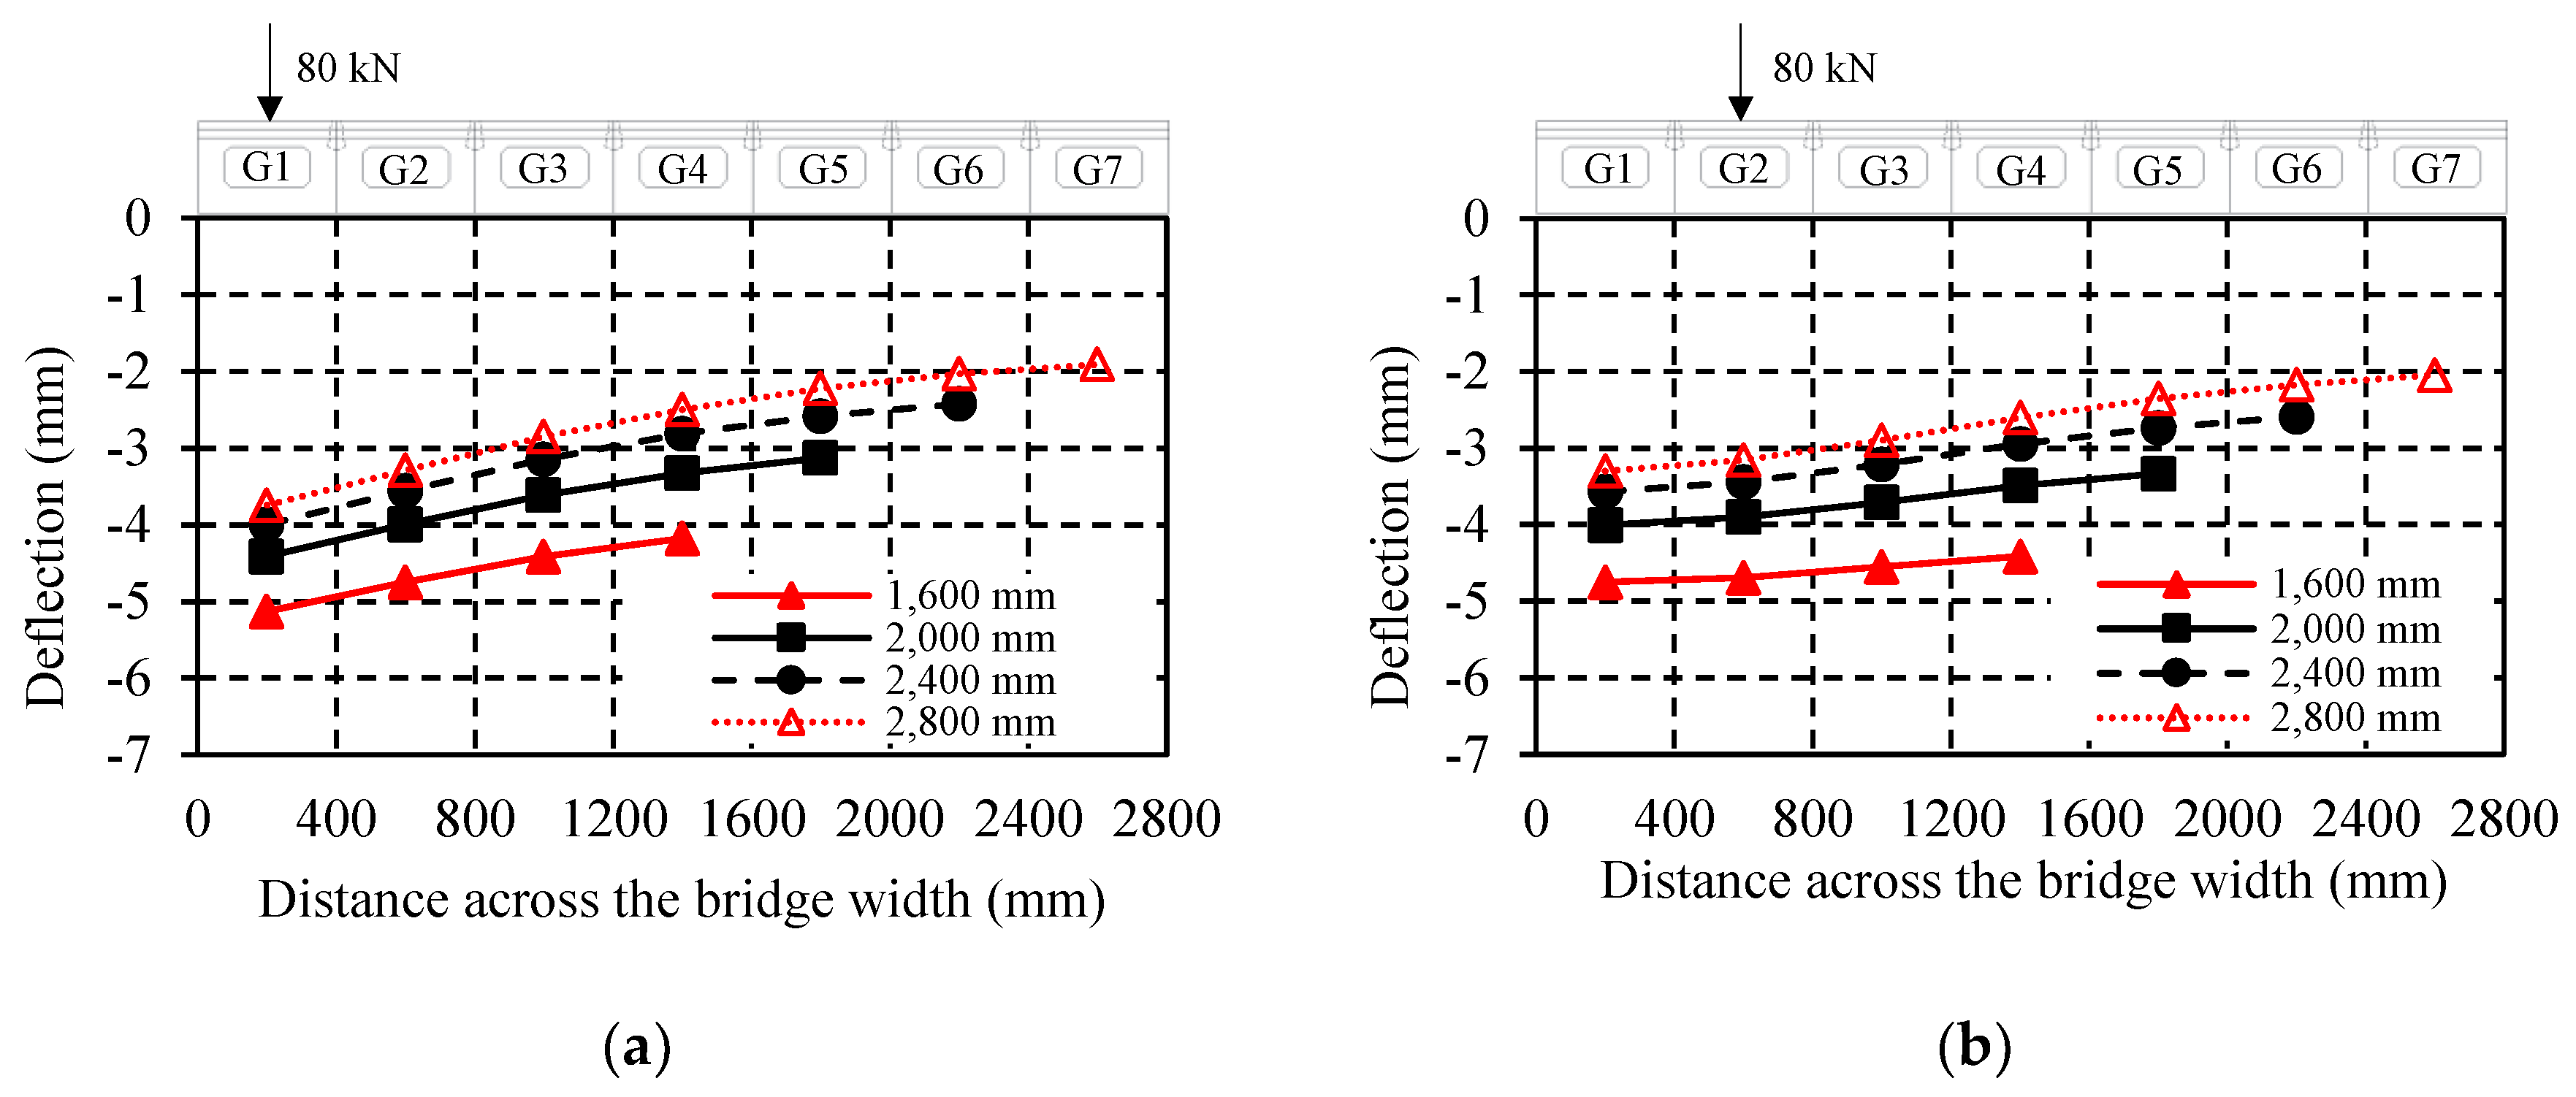
5.3. Effect of Bridge Width

Three different widths of 2000, 2400 and 2800 mm corresponding to five, six, and seven box girders, respectively, were considered in addition to the original bridge width of 1600 mm. For each bridge width, the wheel load was first positioned at the centerline of the exterior girder G1 and moved transversely every 400 mm such that the load was applied to the centerline of each girder. Figure 16 and Figure 17 show the mid-span deflections and LLMDFs when the exterior girder G1 and the interior girder G2 were loaded. As expected, increasing the bridge width resulted in increasing the overall bridge stiffness and eventually limited the overall mid-span deflections. For instance, when the exterior girder was loaded, the overall mid-span deflections were reduced by 15.0, 22.0 and 27.0% when the bridge width was increased from 1600 mm to 2000, 2400 and 2800 mm, respectively. A similar trend was observed when interior girders were loaded. On the other hand, the maximum LLMDF for both exterior and interior girders was reduced when the bridge width was increased. For instance, for a bridge width of 1600 mm, a maximum LLMDF of 34.2% was recorded for the exterior girder. Such LLMDFs dropped to 29.6, 27.1 and 25.6% when the bridge width was increased to 2000, 2400 and 2800 mm, respectively. Similar observations were recorded for the interior girders, where the maximum LLMDF of 28.1% was associated with the smallest bridge width of 1600 mm.

5.4. Evaluation of LLMDFs

The AASHTO LRFD-9 [17] specifies an approximate method to calculate the live load moment distribution factor (LLMDFs) using empirical formulas. The considered box girder in this study falls in category (g), which governs precast concrete box girders with or without transverse post-tensioning [17]. For this specific category, the LLMDFs for an interior girder were estimated using Equations (9) and (10) for one design lane, and two or more design lanes, respectively:
L L M D F int = k ( b 33.3 L ) 0.5 ( I J ) 0.25
L L M D F int = k ( b 305 ) 0.6 ( b 12.0 L ) 0.2 ( I J ) 0.06
and
k = 2.5 ( N b ) 0.2   1.5
where Nb = number of girders, b = width of a beam (in.), L = span of beam (ft), I = moment of inertia (in.4), and J = St. Venant’s torsional inertia for thin-walled closed sections (in.4).
For an exterior girder, LLMDF is estimated as follows:
L L M D F e x t = e × L L M D F int
where the correction factor e is calculated using Equations (13) and (14) for one design lane, and two or more design lanes, respectively:
e = 1.125 + d e 30 1.0
e = 1.04 + d e 25 1.0
and de is the distance from the centerline of the exterior web of exterior girder to the interior edge of curb or traffic barrier (in.) and shall be taken as positive if the exterior web is inboard of the interior face of the traffic railing and negative if it is outboard of the curb or traffic barrier.
The above Equations are only applicable to a specific range of parameters. For example, Equations (9) and (10) are only applicable to bridges consisting of at least five girders, with a minimum girder width of 35 in. and a minimum bridge span of 20 ft. Since the tested bridge model is a one-third-scale model of a real bridge with a limited number of girders (four girders), these formulas would not be applicable. Accordingly, for the sake of comparison, the actual dimensions of the one-third scale tested bridge model were used to evaluate such LLMDFs. By substitution, Nb = 5, b = 1200 mm (47.25 in.), L = 18,000 mm (59 ft.), I = 43.20 × 109 mm4 (103,788 in.4), and J = 84.25 × 109 mm9 (202,411 in.4); the aforementioned formulas will yield LLMDFs of 33.1% and 34.4% for the interior and the exterior girders, respectively. These LLMDF factors are conservatively higher than the maximum LLMDFs of 23.8%, and 29.6% obtained from the numerical study for both interior and exterior girders, respectively (refer to Figure 17).

6. Conclusions

A finite-element model was constructed and validated against experimental results previously reported by the authors. An extensive parametric study was conducted to evaluate the influence of key parameters on the transverse load distribution behavior of adjacent precast prestressed concrete box girders. Based on the numerical results presented in this paper, the following conclusions can be drawn:
  • The presence of concrete topping enhanced the overall stiffness of the bridge model by limiting mid-span deflections. Mid-span deflections were reduced by 8, 17, and 25% when concrete topping of 75, 100 and 150-mm thickness, respectively, were used. Nevertheless, the LLMDFs were found to be insignificantly altered when a concrete topping was incorporated.
  • The LLMDFs were evaluated for multiple wheel locations to determine the location associated with the maximum response. The exterior girder exhibited the maximum LLMDF when the load was placed at the farthest possible point across the bridge width. On the other hand, the interior girder G2 exhibited the maximum LLMDF when the wheel load was centered with the girder centerline (Load Case IV).
  • To satisfy the minimum number of girders required to utilize the LLMDFs proposed by the AASHTO-LRFFD, different bridge widths consisting of five, six and seven girders were investigated. For each bridge width, the wheel load was placed transversely at different locations to estimate the maximum LLMDFs. The LLMDFs were found to be reduced when the bridge width was increased. The maximum LLMDF for the exterior girder dropped by 25% when the bridge width was increased to seven girders (2800 mm). A similar trend was observed for the interior girders.
  • In lieu of size limitations dictated by the scaled bridge model, AASHTO LRFD-9 bridge design specifications were used to estimate the LLMDFs for both the exterior and the interior girders considering the actual dimensions of the one-third-scale bridge model. The obtained LLMDFs were found to be conservative by 39% and 16% for the interior and the exterior girders, respectively. This observation suggests that the existing LLMDFs proposed by AASHTO LRFD-9 could be used, as an initial step, to design the full-scale bridge structure of the tested bridge prototype.
Among future research needs is the investigation of field LLMDFs of a constructed full-scale bridge with the newly developed transverse connection. In addition, the combined effect of temperature gradients and structural loading needs to be investigated.

Author Contributions

Conceptualization, E.F.E.-S.; methodology, S.N.L.; validation, S.N.L.; formal analysis, S.N.L.; investigation, S.N.L.; resources, E.F.E.-S.; data curation, S.N.L.; writing—original draft preparation, S.N.L.; writing—review and editing, E.F.E.-S.; supervision, E.F.E.-S.; project administration, E.F.E.-S.; funding acquisition, E.F.E.-S. All authors have read and agreed to the published version of the manuscript.

Funding

Canadian Precast/Prestressed Institute (CPCI), the Natural Sciences and Engineering Research Council of Canada (NSERC), and the University of Manitoba Graduate Fellowship (UMGF).

Data Availability Statement

All data, models, and code generated or used during the study appear in the submitted article.

Acknowledgments

The authors wish to express their gratitude for the financial support received from the Canadian Precast/Prestressed Institute (CPCI), the Natural Sciences and Engineering Research Council of Canada (NSERC), and the University of Manitoba Graduate Fellowship (UMGF).

Conflicts of Interest

The authors declare no conflict of interest.

References

  1. Miller, R.; Hlavacs, G.; Long, T.; Greuel, A. Full-scale testing of shear keys for adjacent box girder bridges. PCI J. 1999, 44, 80–90. [Google Scholar] [CrossRef] [Green Version]
  2. Hanna, K.; Morcous, G.; Tadros, M. Design, detailing, and testing of non-post-tensioned transverse connections in adjacent box-girder bridges. PCI J. 2011, 56, 94–107. [Google Scholar]
  3. Lall, J.; Alampalli, S.; DiCocco, E. Performance of full-depth shear keys in adjacent prestressed box beam bridges. PCI J. 1998, 43, 72–79. [Google Scholar] [CrossRef]
  4. Hanna, K.; Morcous, G.; Tadros, M. Transverse post-tensioning design and detailing of precast, prestressed concrete adjacent-box-girder bridges. PCI J. 2009, 54, 159–174. [Google Scholar] [CrossRef] [Green Version]
  5. Hansen, J.; Hanna, K.; Tadros, M. Simplified transverse post-tensioning construction and maintenance of adjacent box girders. PCI J. 2012, 57, 64–79. [Google Scholar] [CrossRef]
  6. Sun, C.; Tadros, M.; Kopper, K.; Belill, T. Innovative precast concrete adjacent-box-beam system implemented in the St. Clair Road Bridge in Michigan. PCI J. 2018, 63, 41–50. [Google Scholar] [CrossRef]
  7. Labib, S.; El-Gendy, M.; El-Salakawy, E. Adjacent concrete box girders transversely post-tensioned at top flanges only: Experimental investigation. J. Bridge Eng. 2021, 26, 04021017. [Google Scholar] [CrossRef]
  8. Aktan, H.; Attanayake, U.; Ulku, E.; Ahlborn, T.; Deshpande, Y. Condition Assessment and Methods of Abatement of Prestressed Concrete Box-Beam Deterioration—Phase II; MDOT RC-1527; Michigan Department of Transportation: Detroit, MI, USA, 2007. [Google Scholar]
  9. Semendary, A.; Steinberg, E.; Walsh, K.; Barnard, E. Live-load moment-distribution factors for an adjacent precast prestressed concrete box beam bridge with reinforced UHPC shear key connections. J. Bridge Eng. 2017, 22, 04017088. [Google Scholar] [CrossRef]
  10. Grace, N.; Jensen, E.; Bebawy, M. Transverse post-tensioning arrangement for side-by-side box-beam bridges. PCI J. 2012, 57, 48–63. [Google Scholar] [CrossRef]
  11. Fu, C.; Pan, Z.; Ahmed, M. Transverse posttensioning design of adjacent precast solid multibeam bridges. J. Perform. Constr. Facil. 2011, 25, 223–230. [Google Scholar] [CrossRef]
  12. Hussein, H.; Sargand, S.; Al-Jhayyish, A.; Khoury, I. Contribution of transverse tie bars to load transfer in adjacent prestressed box-girder bridges with partial depth shear key. J. Perform. Constr. Facil. 2017, 31, 04016100. [Google Scholar] [CrossRef]
  13. Badwan, I.; Liang, R. Performance evaluation of precast posttensioned concrete multibeam deck. J. Perform. Constr. Facil. 2007, 21, 368–374. [Google Scholar] [CrossRef]
  14. Červenka, V.; Jendele, L.; Červenka, J. ATENA Program Documentation Part 1: Theory; Cevenka Consulting: Prague, Czech Republic, 2020. [Google Scholar]
  15. Coll, A.; Ribó, R.; Pasenau, M.; Escolano, E.; Perez, J.S.; Melendo, A.; Monros, A.; Gárate, J. GiD v.14 User Manual. 2018. Available online: www.gidhome.com (accessed on 25 January 2022).
  16. CSA. Canadian Highway Bridge Design Code (CHBDC), CSA S6-19; Canadian Standards Association (CSA): Toronto, ON, Canada, 2019. [Google Scholar]
  17. AASHTO. AASHTO LRFD Bridge Design Specifications, 9th ed.; VR: Washington, DC, USA, 2020. [Google Scholar]
  18. Ghosn, M.; Moses, F.; Gobieski, J. Evaluation of steel bridges using in-service testing. Transp. Res. Rec. 1986, 1072, 71–78. [Google Scholar]
  19. CEB-FIP Model Code. First Draft, Committee Euro-International du Beton. Bull. D’inform. 1990, 195, 196. [Google Scholar]
  20. Vecchio, F.; Collins, M. Modified compression-field theory for reinforced concrete beams subjected to shear. ACI J. 1986, 83, 219–231. [Google Scholar]
  21. Dyngeland, T. Behavior of Reinforced Concrete Panels. Ph.D. Thesis, Trondheim University, Trondheim, Norway, 1989. [Google Scholar]
  22. Van Mier, J. Multiaxial strain-softening of concrete. Mater. Struct. 1986, 19, 179–190. [Google Scholar] [CrossRef]
  23. Bigaj, A. Structural Dependence of Rotation Capacity of Plastic Hinges. Ph.D. Thesis, TU Delft, Delft, The Netherlands, 1999. [Google Scholar]
  24. Jendele, L.; Cervenka, J. Finite element modelling of reinforcement with bond. Comput. Struct. 2006, 84, 1780–1791. [Google Scholar] [CrossRef]
  25. Mahmoud, K.; Anand, P.; El-Salakawy, E. 3-D Finite element modeling of prestressed hollow-core slabs strengthened with near surface mounted CFRP strips. Comput. Concr. 2018, 21, 607–622. [Google Scholar] [CrossRef]
Figure 1. Geometry of bridge model (dimensions in mm).
Civileng 03 00011 g001
Figure 2. Reinforcement details of an interior girder (dimensions in mm).
Civileng 03 00011 g002
Figure 3. Load distribution test setup (vertical load applied at an interior girder).
Civileng 03 00011 g003
Figure 4. FEM and reinforcement configuration of the bridge model): (a) discrete reinforcement, (b) mesh discretization in longitudinal direction, and (c) mesh discretization in transverse direction.
Civileng 03 00011 g004
Figure 5. Properties of the used mesh: (a) minimum dihedral angle, (b) maximum dihedral angle, (c) element volume, and (d) minimum Jacobian.
Civileng 03 00011 g005
Figure 6. The softening/hardening plasticity constitutive model: (a) hardening law, and (b) softening law [14].
Civileng 03 00011 g006
Figure 7. Mohr–Columb failure surface for the interface material.
Civileng 03 00011 g007
Figure 8. Validated load–deflection response of individual adjacent girders; (a) load–deflection response of girder G1, (b) load–deflection response of girder G2, (c) load–deflection response of girder G3, and (d) load–deflection response of girder G4.
Civileng 03 00011 g008
Figure 9. Validated load–strain response of individual adjacent girders: (a) load–strain response of girder G1, (b) load–strain response of girder G2, (c) load–strain response of girder G3, and (d) load–strain response of girder G4.
Civileng 03 00011 g009
Figure 10. Validated ultimate load for the loaded girder G1.
Civileng 03 00011 g010
Figure 11. Mid-span deflection profile for different thicknesses of concrete topping: (a) external girder G1 loaded and (b) interior girder G2 loaded.
Civileng 03 00011 g011
Figure 12. Mid-span LLMDFs for different thicknesses of concrete topping: (a) External girder G1 loaded and (b) interior girder G2 loaded.
Civileng 03 00011 g012
Figure 13. Schematic for different wheel load locations.
Civileng 03 00011 g013
Figure 14. Mid-span deflection profile for different wheel locations.
Civileng 03 00011 g014
Figure 15. Mid-span LLMDFs for different wheel locations.
Civileng 03 00011 g015
Figure 16. Mid-span deflection profile for different bridge widths: (a) exterior girder G1 loaded and (b) interior girder G2 loaded.
Civileng 03 00011 g016
Figure 17. Mid-span LLMDFs for different bridge widths: (a) exterior girder G1 loaded and (b) interior girder G2 loaded.
Civileng 03 00011 g017
Table 1. Mechanical properties of used reinforcement.
Bar TypeBar SizeDiameter (mm)Area (mm2)Tensile Strength (MPa) Elastic Modulus (GPa)
Non-prestressing bars10 M11.3100400 *200
Prestressing strands1312.798.71860202
* Yield strength.
Table 2. Main parameters of concrete and grout constitutive models.
ParameterConcreteGrout
Compressive strength, f c (MPa)5585
Modulus of elasticity, Ec (MPa)40,12944,410
Poisson’s ratio, µ0.20.2
Fracture energy, Gf (N/m)97.5130
Tensile strength, ft (MPa)3.95.2
Critical compressive displacement, wd (mm)0.50.5
Crack modelFixedFixed
Reduction in compressive strength factor, rc lim0.80.8
Publisher’s Note: MDPI stays neutral with regard to jurisdictional claims in published maps and institutional affiliations.

