
Concrete Overstrength: Assessment of Field Strength Seeking Insights for Overdesign Optimization


Department of Civil and Coastal Engineering, University of Florida, Gainesville, FL 32611, USA
CivilEng 2022, 3(1), 51-65; https://doi.org/10.3390/civileng3010004
Submission received: 5 December 2021
/
Revised: 2 January 2022
/
Accepted: 4 January 2022
/
Published: 10 January 2022
(This article belongs to the Special Issue Connections in Concrete Volume 2)
Abstract
:This study investigates the high contents of cementitious materials in Portland cement concrete and assesses the required (f’cr) and actual (σ) compressive strength of concrete specimens. A linear optimization technique identifies the required binder content to reach f’cr. Standard specifications have required concrete overdesign (OD) for decades, but few studies have evaluated the actual magnitude of OD from field data. The compressive strength of 958 cylinders prepared in the field represented 8200 m3 of ready-mixed concrete with 300 and 450 kg/m3 of cementitious are analyzed. The actual OD appears to be 7 to 21% higher than required. The required 28-day compressive strength of concrete was achieved in less than seven days. Therefore, the content of the cementitious materials could be reduced by 6 and 17% so that concrete could reach f’cr without cementitious overconsumption. Reducing cementitious content is recommended to improve construction quality and optimize resource utilization. Among the main reasons for this recommendation are the estimated substantial long-term savings, increased concrete durability and more rational use of natural resources required to build the structures.
1. Introduction
Despite widespread belief, increasing cement content may not result in higher quality or faster construction schedules. However, concrete with lower cementitious content and more substitution of cementitious materials can decrease environmental impact while still reaching sufficient strength on time to avoid construction delays and last longer [1,2,3,4,5].
Overstrength caused by high cementitious content may induce concrete cracking. This occurs because (1) higher concrete temperature can increase the temperature differential between core and surface and induce thermal contraction cracks; (2) the higher the cementitious content, the higher the heat of hydration, which may increase the concrete porosity and engender the delayed ettringite formation (DEF) depending on the water availability and internal sulfate release; and (3) high cementitious contents can require higher water contents, which may bleed, evaporate and increase concrete permeability, hence the ingress of external agents causing internal expansions in concrete [2,3,4,5]. Pathologies can occur in a few pours, during the construction phase, or even many years after construction. When deficiencies in concrete are identified before the end of the construction phase, contractors often need to perform repairs. Such repairs usually are time-consuming, delaying construction completion and increasing costs.
Many contract terms have also induced the increase in f’cr to become the norm in construction by offering bonuses to contractors to expedite construction. For example, the “No Excuse Bonus” terms have encouraged builders to work more quickly, fit fast-track schedules and minimize inconvenience during construction (e.g., traffic delays). This incentive, very common in building contracts, bonds and rewards a contractor for early completion but may affect the quality and durability of the constructed element. For example, using admixtures to accelerate setting time associated with high contents of fast-reacting cement can induce concrete pathologies [5]. However, both contractors and owners may fail when bonuses reward fast but deficient construction. Contractors can end the contract even by using bonuses to offset extra construction costs. Owners can receive lower-quality assets with potential maintenance costs down the line.
The article is organized as follows. In the section that follows, an overview of cement production and strategies that have been developed to reduce the environmental impact of the cement industry are provided. Additionally, the case of limestone mining in Florida is discussed to provide context and motivation for the study. Following this, the materials and methods are considered. Next, findings from the three concrete mixtures studied are presented. Finally, the strategies to mitigate additional overdesign (AOD) to improve the quality of the structures are presented, after which a brief conclusion ends the paper.
2. Literature Review
Concrete mixtures are typically proportioned following the American Concrete Institute (ACI) standard 211-1 [6] or similar. The ACI 318 [4] specifies that concrete should reach a minimum required compressive strength, f’cr, higher than the specified design compressive strength f’c. The ACI 214R [7] defines the f’cr as the average compressive strength guaranteeing that only one percent of measurements fall below the f’c. The difference between f’cr and f’c is defined as overdesign (OD).
The OD calculation is based on the availability of relevant data for similar concrete mixtures. ACI 214R [7] recommends modification factors for standard deviation (S) from 1.16 when 15 tests are available to 1.0 when 30 or more compressive strength (σ) tests are available. When a concrete mix design has a normal distribution of σ test results, Equation (1) can be used:
where f’cr is the required compressive strength of concrete, f’c is the specified compressive strength of concrete, z is the reliability factor (typically 2.33 in the U.S. for acceptance of the 1% failure rate), and S is the standard deviation of a concrete series.
When fewer than 15 compressive strength tests are available, the overdesign determination relies upon the f’c level. In such a case, 7 MPa is added to f’c when f’c is less than 21 MPa, 8 MPa is added to f’c when f’c is greater or equal to 21 MPa and less than or equal to 35 MPa, and Equation (2) should be used when f’c is greater than 35 MPa:
where f’cr is the required compressive strength of concrete and f’c is the specified compressive strength of concrete.
During construction, concrete specimens are cured in moisture rooms or curing tanks with lime water. Typically, after 7 and 28 days of curing, σ is tested and compared to f’c [5,8,9]. Ultimately, concrete is considered adequate if σ falls above f’c. Such evaluations are specified in contracts that hold builders and concrete producers liable for concrete failures, and therefore efforts are made to keep σ higher than the minimum. To accomplish this, producers tend to increase the cementitious content in concrete. However, it is widely known that the water-to-cementitious ratio (w/cm) is the primary factor that affects concrete strength [5], not the amount of cementitious materials. The prevailing, yet flawed, logic behind this is that the higher the OD, the lower the risk of obtaining strength results below f’c.
The construction materials industry is a significant user of the world’s natural resources. Current practices and research in this field focus on developing sustainable structural materials and long-lasting infrastructure. This research agenda is timely and influential because, despite the advances in concrete technology and materials engineering in the last decades, concrete has presented severe durability problems in the U.S., requiring large amounts of money to repair and replace concrete structures. This occurs primarily due to failures in the design and execution of structures and the specification of materials in building codes [5,10]. For those reasons, this study investigates the actual cementitious materials content in concrete required to meet the OD. Although standard guidelines require concrete OD for decades, such a threshold can be abused to avoid results below the f’c. The present study is a first-of-its-kind (based on field data) and will be helpful for the development of concrete technology. Having consistent findings obtained from different data (field and laboratory-based) contributes to expanding and deepening one’s knowledge of concrete durability and OD.
2.1. Portland Cement Production
Portland cement (PC) is the most used construction material on Earth because it is adaptable, reliable, accessible and affordable. Over 159 countries manufacture clinker, the primary ingredient in cement [11]. Four billion tons of cement are manufactured each year worldwide. In 2020, the United States (U.S.) was the world’s fourth-largest producer of cement (90 million metric tons), behind China (2.2 billion metric tons), India (340 million metric tons) and Vietnam (96 million metric tons). In the U.S., cement is produced at 98 plants in 34 states and two in Puerto Rico. Florida alone has eight large cement plants producing 6 million metric tons of PC and 8 million metric tons of clinker per year [12].
The production process for Portland cement is energy—and pollution-intensive. Due to its substantial environmental impact, the cement industry has focused on reducing carbon dioxide (CO2) emissions, accounting for 5–10% globally [5,10,13,14,15]. Therefore, reducing the cementitious materials in concrete can substantially reduce the environmental impact of Portland cement production.
For PC production, limestone, aluminum, iron and silica are blended into a raw meal that passes throughout the process. Next, the raw meal is pre-heated as it flows down into towers with gasses heated by outlet heat from kilns. Finally, pre-heated meals are burnt in kilns at approximately 1500 °C, which is the required temperature to generate the chemical reactions needed to form the clinker. Pre-heating towers have been incorporated into the system to optimize energy consumption because the raw meal arrives at higher temperatures at kilns, and less burning is needed to reach the required temperatures. Raw materials take about 10 s from top to bottom of pre-heating towers, increasing its temperature from 100 to 870 °C [16].
Efforts to reduce the environmental footprint of the cement industry include replacing inefficient equipment with more environmentally friendly versions, using alternative fuels, clean energy systems, innovative technologies for CO2 capture and storage and the production of blended cement. Cement can be replaced with alternative raw materials such as coarse aggregates (e.g., industrial waste products) [17,18,19,20] and supplementary cementitious materials (SCM) like ground granulated blast furnace slag (GGBFS, Slag cement) and fly ash [21]. With these substitutions, U.S. producers decreased their use of fossil fuels by over 15% and the total energy required to produce a ton of cement by approximately 40%.
2.2. Portland Limestone Cement (PLC) Production
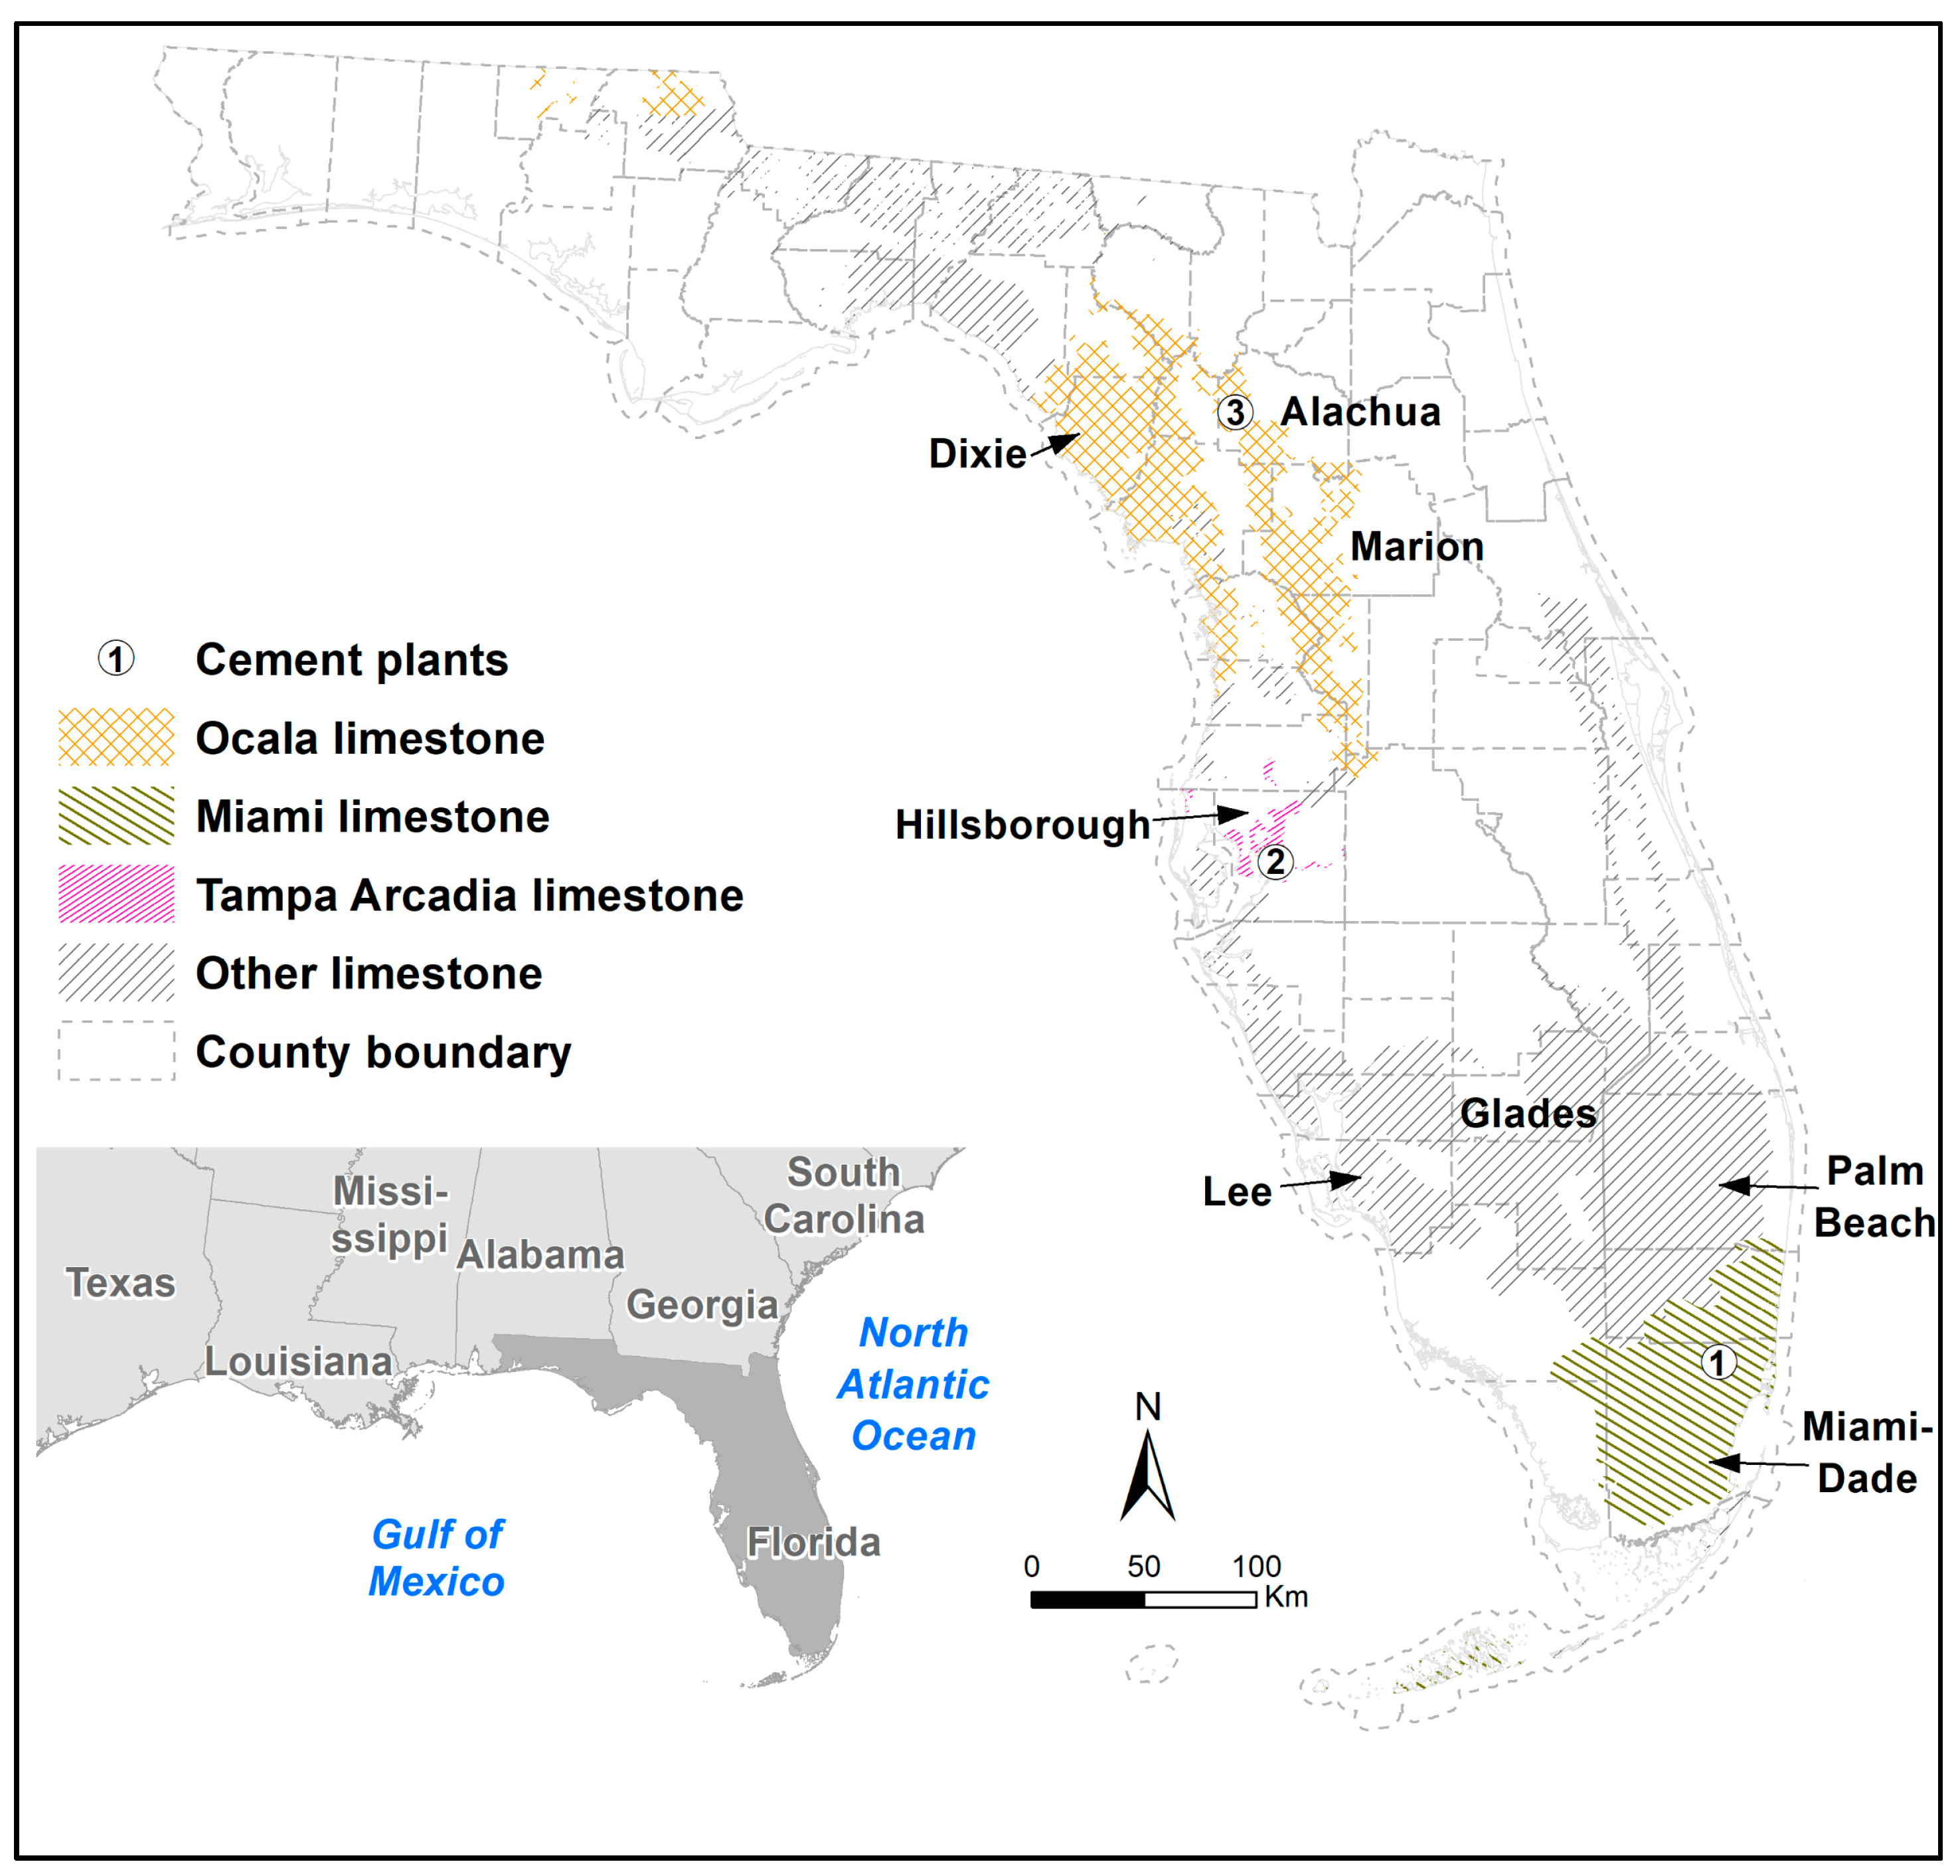
Portland limestone cement (PLC) is a blended cement that requires reduced limestone burned in kilns, decreasing CO2 emissions and the total amount of mined limestone. Due to its lower clinker-to-cement ratio, PLC is considered an eco-friendly cement, which has become widely used [22,23,24]. The creation of Portland limestone cement (PLC), dubbed Type IL cement, is also part of the industry effort to reduce greenhouse gas (GHG) emissions. PLC production represents an effort to reduce the environmental impact of cement production; however, cement consumption in concrete remains a problem that can be particularly acute in some regions. For example, South Florida in the U.S. is an intensive producer of cement, limestone aggregates and concrete. The high-quality limestone produced in the region is used in cement and most concrete production because of its suitable hardness. Thus, although PLC can reduce some of the limestone demand, the potential production of concrete with high cement contents can increase pressure on the local deposits and challenge the long-term availability of limestone.
Currently, PCL is produced at three plants in Florida. Figure 1 illustrates the locations of the limestone formations and PLC plants used in this study.
Mill certificates from these plants show that the Blaine fineness is 51% higher than the standard fineness of Type I/II cement. Although finer than Type I/II, PLC is expected to produce similar heat during hydration because the Calcium Oxide (CaO) contents are comparable in both cement types.
PC is produced by heating limestone, silica, alumina and iron in kilns at approximately 1500 °C to produce clinker. The clinker passes through ball mills to achieve the target particle size distribution (PSD) and fineness. Afterward, up to 5% of gypsum is blended to control the setting properties, adding sulfate to the cement’s chemical composition [5,10,16,18,25]. The cement used in commercial construction in the U.S. must be produced conforming to either ASTM C150 [26] or C595 [27], besides AASHTO M85 [28] for PC and M240 [29] for blended cement for road construction.
PLC differs from PC in its manufacturing process. Although both cement types use similar clinker, PLC can receive up to 15% ground limestone in the finishing mill. Manufacturers claim that this reduces their CO2 emission rates without increasing cost or reducing performance. The PSD of PLC is also enhanced and often achieves higher cementitious efficiency [11,30,31].
2.3. Limestone Mining
Limestone is a sedimentary rock composed of over 50% of carbonate minerals, primarily calcium carbonate (CaCO3). The limestone content in cement is determined by its chemical composition, which varies in purity, consistency and hardness based on location. PC is one of the most important products made from limestone, comprising at least 70% of CaCO3 by mass in cement production composition [11,32].
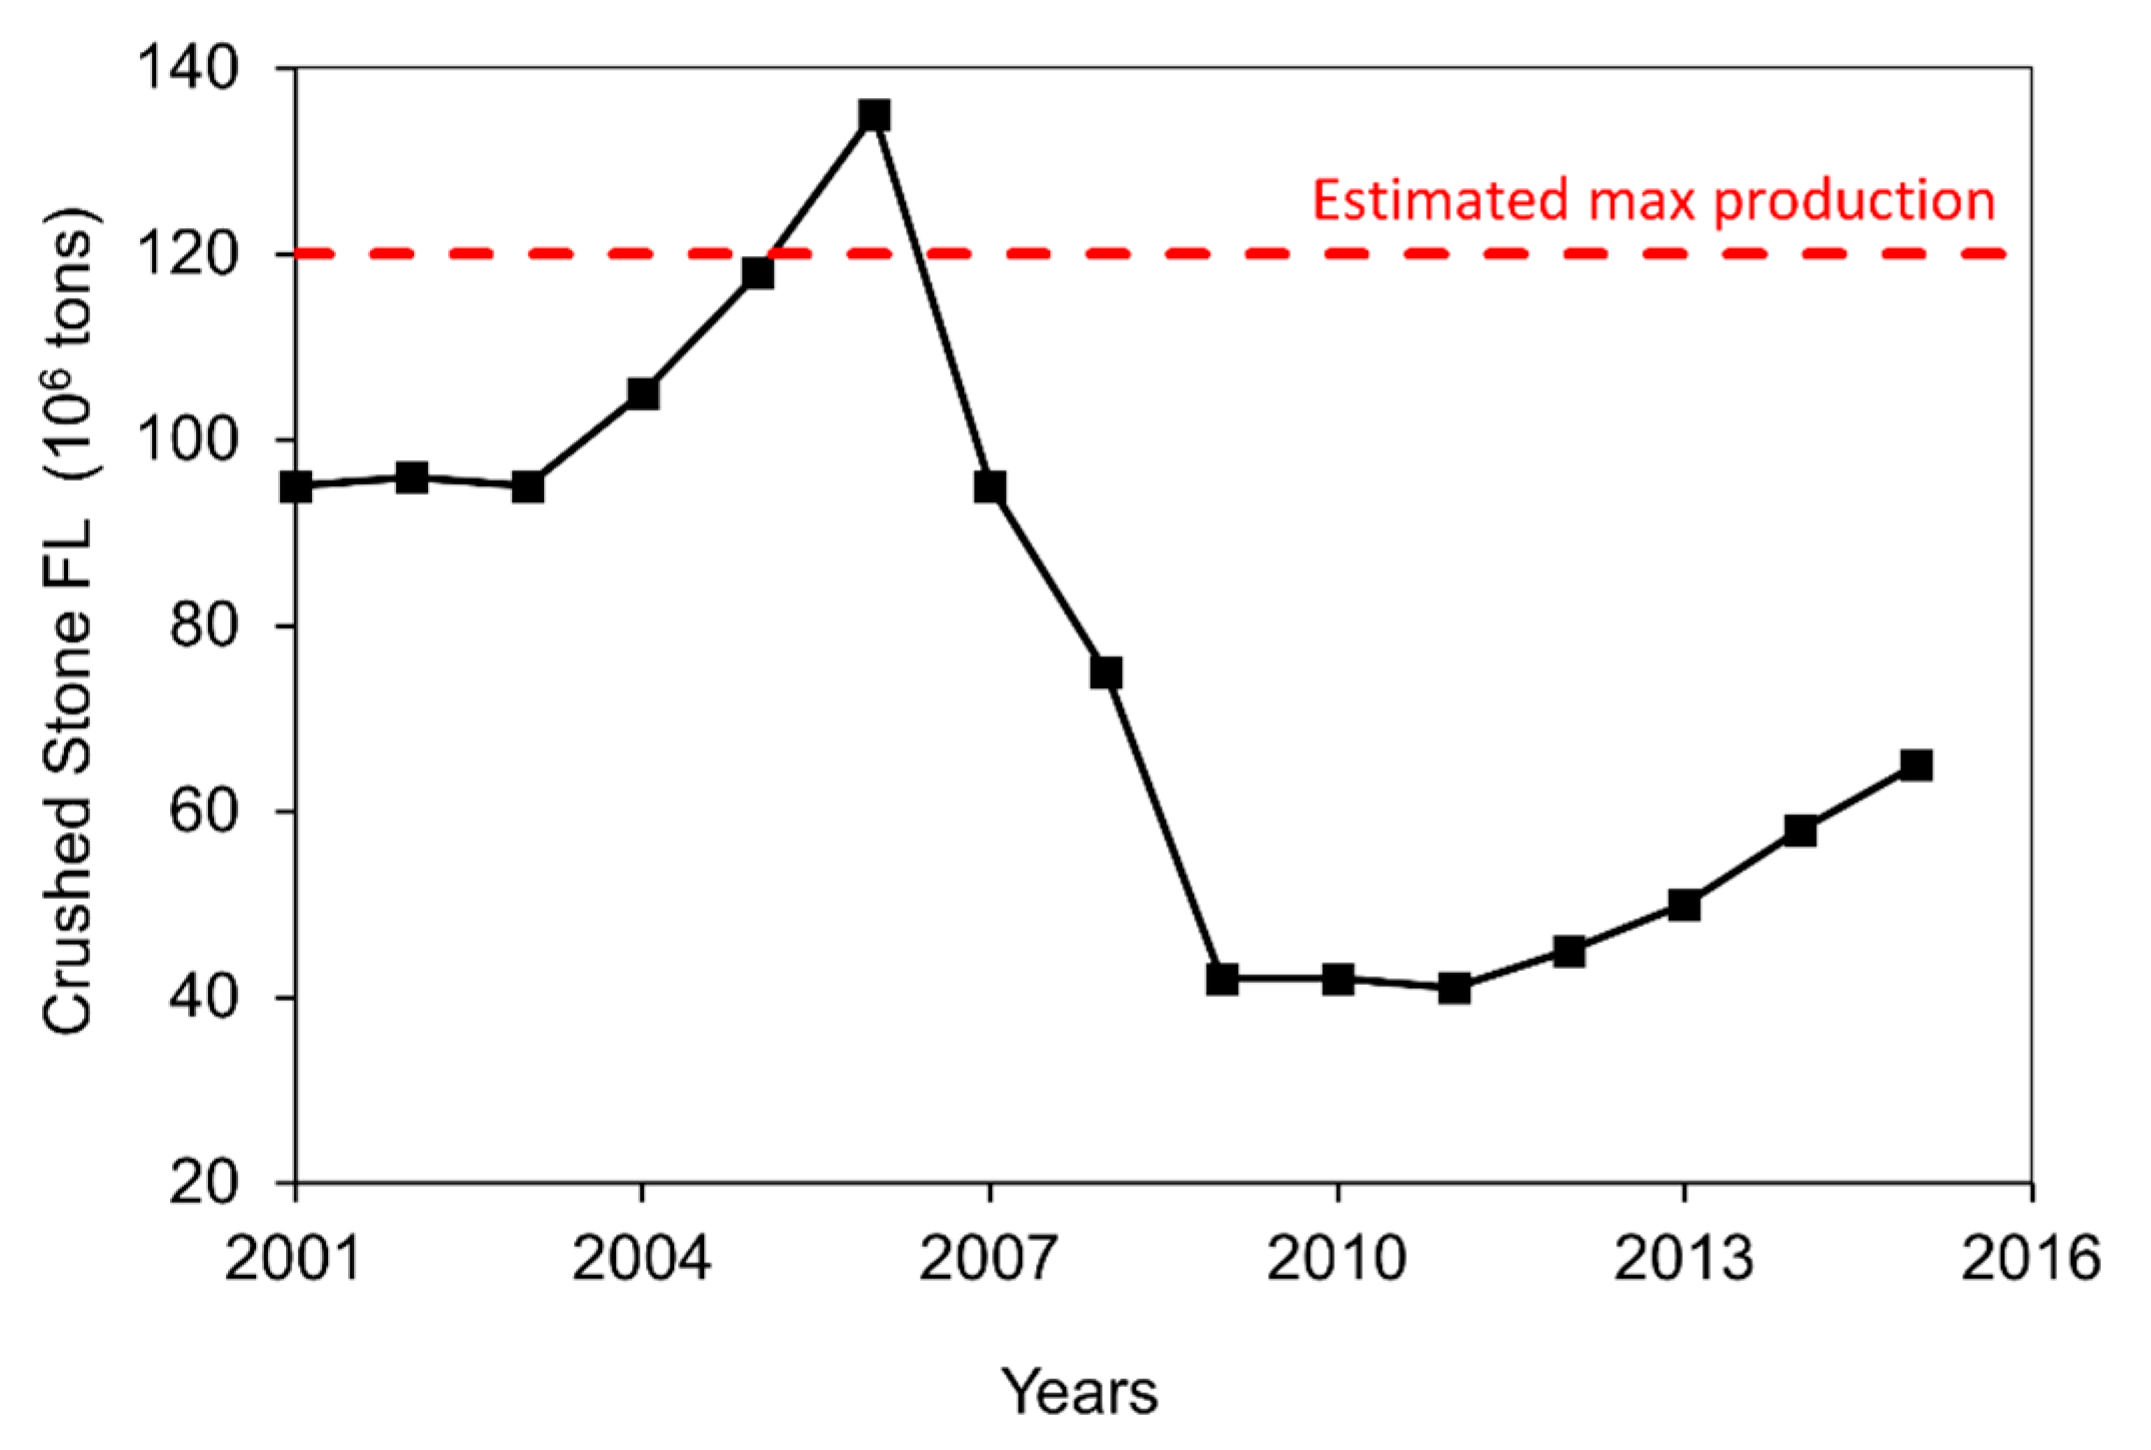
Florida produces 92% of the in-state demand for limestone. The hardest limestone for aggregate materials occurs in small areas on the Southeast coast (Lake-Belt), which is the source of 95% of the crushed limestone used in concrete statewide. In addition, the state has an abundance of soft limestone, typically unsuitable for structural concrete. Figure 2 shows the crushed-stone production in Florida between 2001 and 2015. Limestone mining has increased steadily after the 2008 national economic crisis [11].
2.4. Structural Resilience
Structural safety is paramount. Işık et al. [33] reported that low concrete strength is the primary cause of reinforced concrete structure failures under significant loadings, such as earthquakes. The study suggests that increasing the concrete strength could optimize structural resilience.
Danesh et al. [34] found that the optimization of reinforced concrete structures appears to be challenging due to the variety of potential structural solutions and element dimensions with related reinforcement configurations. In addition, some of the current design codes for seismic design of structures frequently generate overdesigned solutions. Such findings emphasize the need to investigate material overstrength toward optimal concrete properties.
Işık et al. [35] also published that concrete minimum cover should be prioritized due to the critical role in protecting steel from environmental effects. Inadequate concrete cover thickness can increase the base shear force, weaken reinforcement strength over time, and negatively affect the structural performance to withstand earthquakes and other demanding loads. Antunes [36] studied the temperatures developed in several massive elements and concluded that the dimensions are the most relevant parameter to control the peak temperatures in elements, followed by the concrete temperature at placement.
It appears that concrete strength, cross-section dimensions influenced by the concrete cover and structural design considerations, volumes of the concrete pour and concrete temperatures can be affected by the cementitious contents in concrete. Therefore, optimizing concrete composition can help design more resilient structures.
3. Problem Statement
The motivation for this study was that it appeared achievable, although challenging, to optimize the cementitious content in concrete and obtain similar field performance. More cement does not necessarily make better concrete or expedite construction schedules. Really, concrete with lower cementitious content and more cement substitution can drive lower environmental impact, reach sufficient strength on time to avoid construction delays, and last longer. This study provides engineers and researchers with currently unavailable information in national standards.
4. Materials and Methods
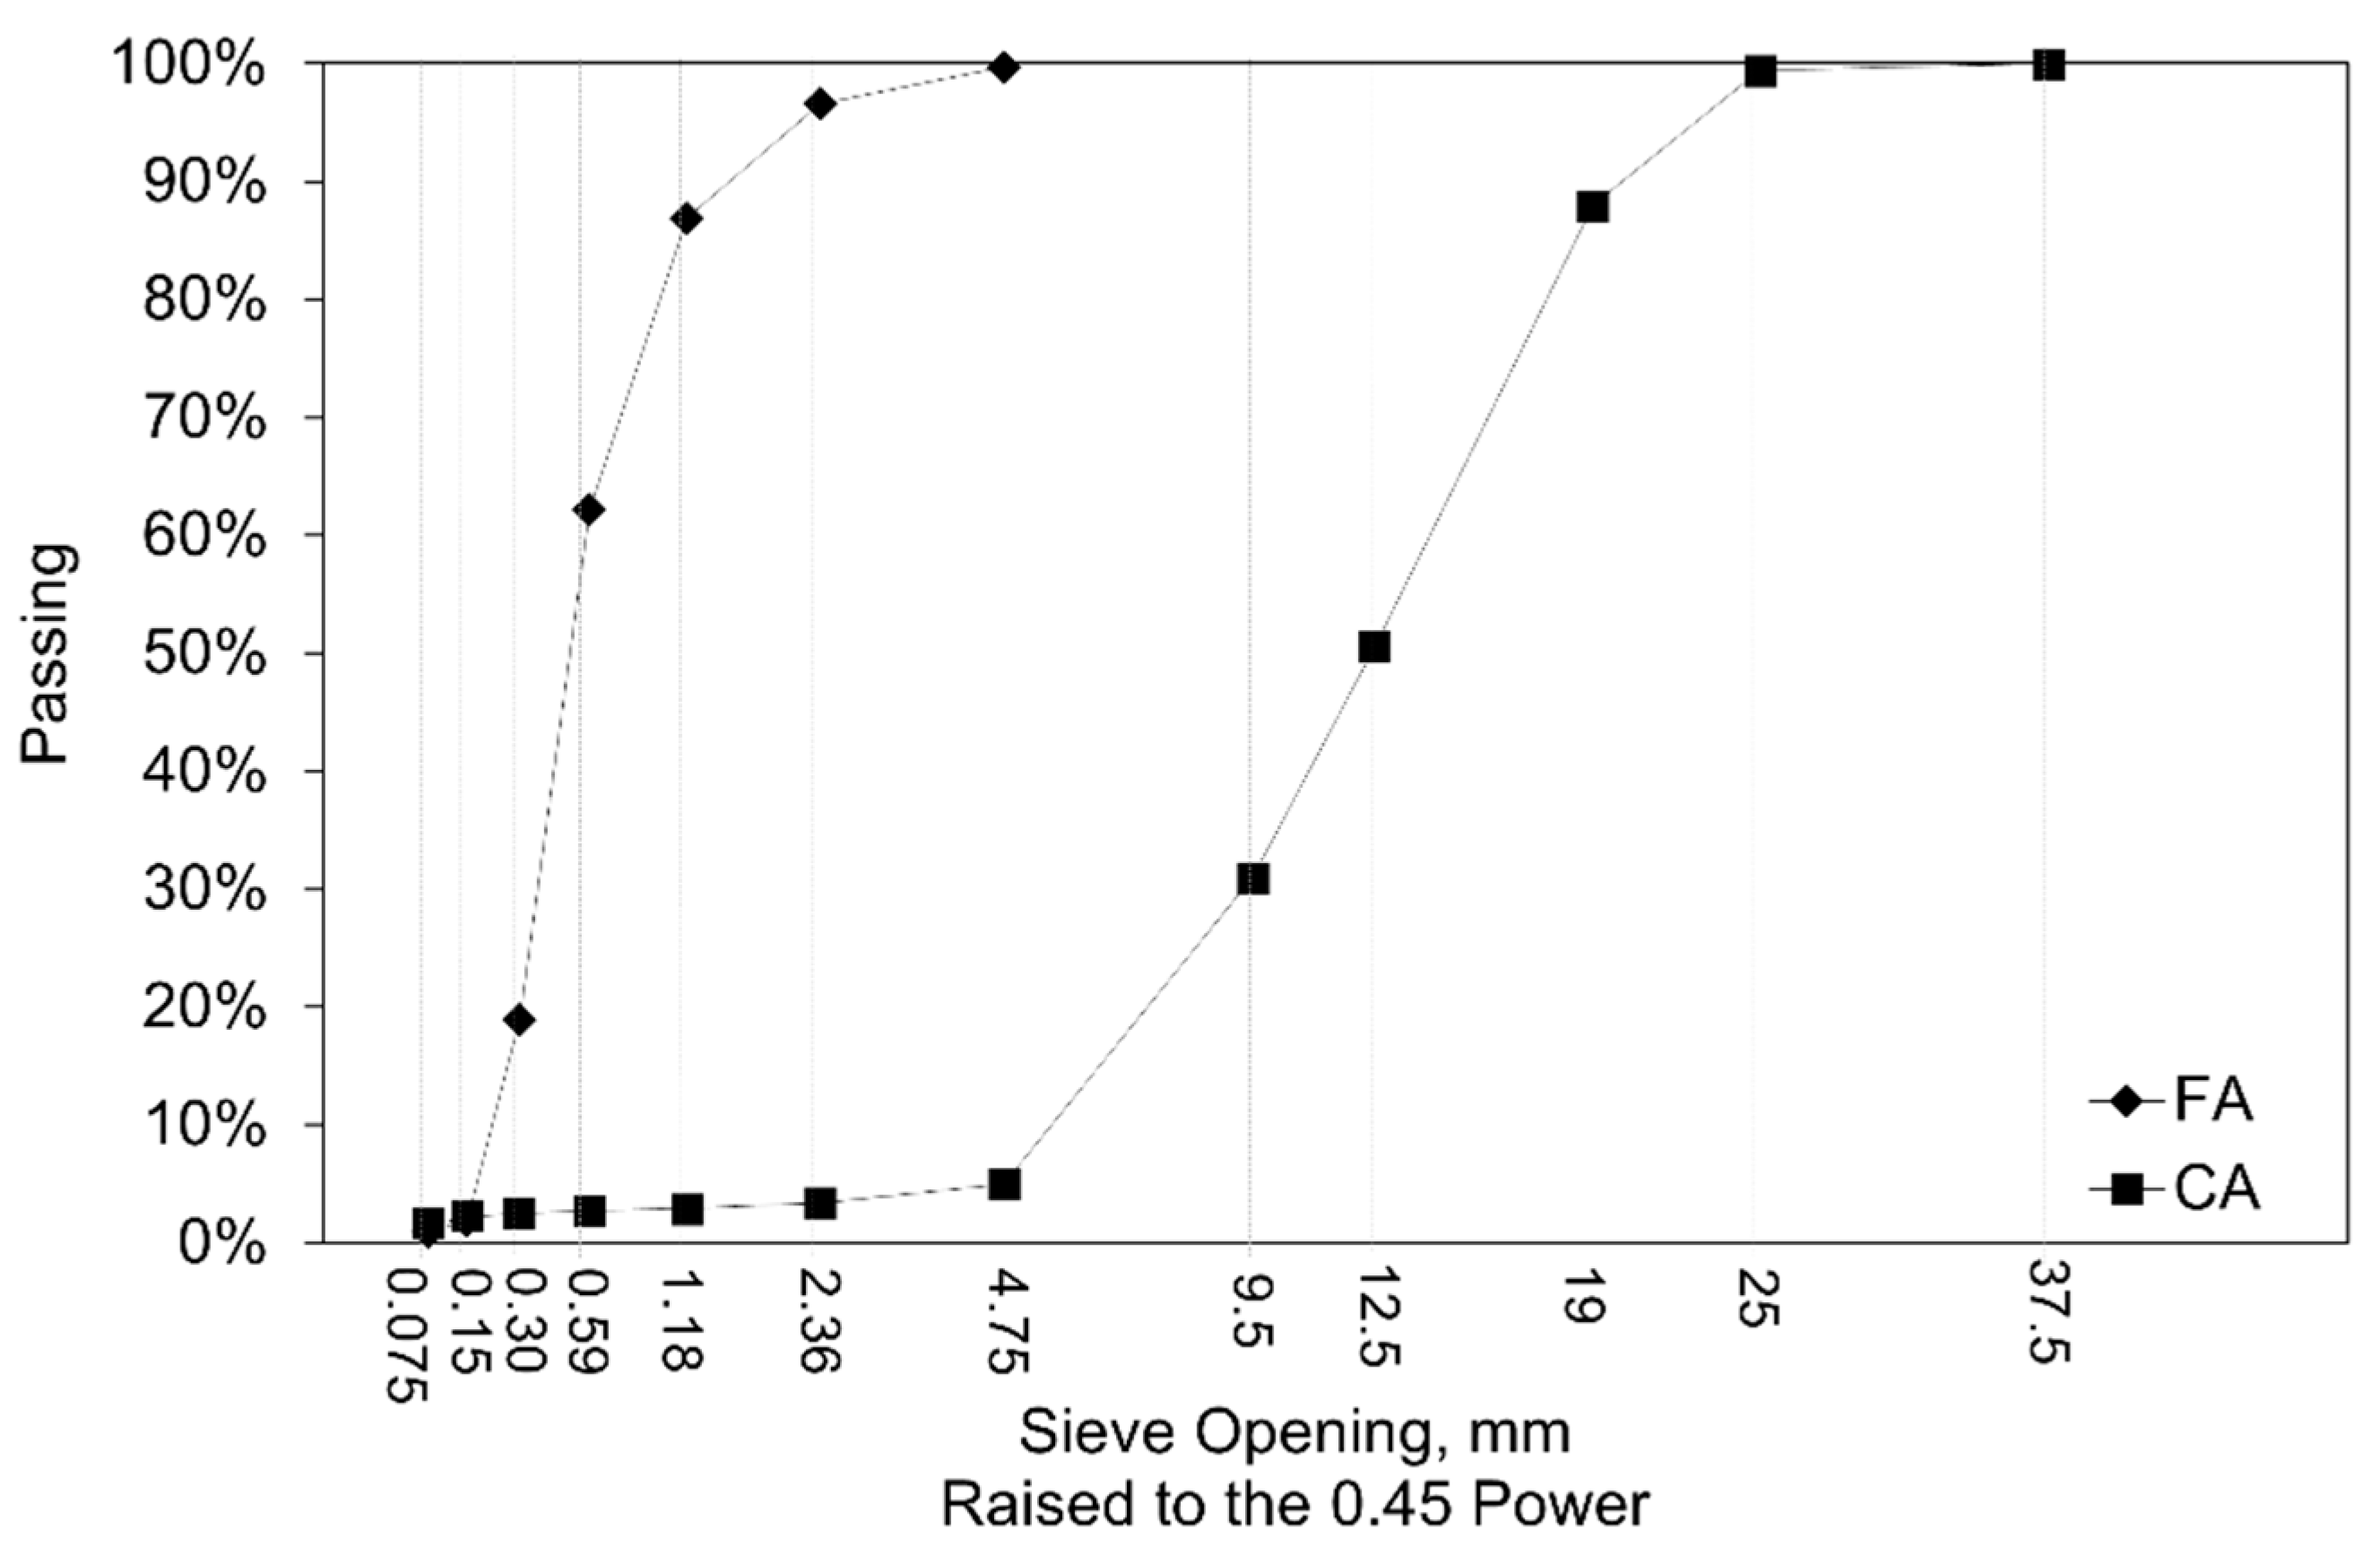
Silica sand will be used as fine aggregate (FA) and limestone grade 57 as coarse aggregate (CA). Table 1 lists the physical properties of the aggregates tested per C127 [35], C128 [36], and C136 [34]. Type IL-10 PLC per ASTM C595 [27] was used in this study. The slag cement conformed to ASTM C989 [37]. The slag replacement for 28 MPa is 50%. The slag replacement for 38 MPa is 70%. Figure 3 shows the gradation curve of each aggregate per ASTM C136 [34]. The concrete mix proportions used in this study are presented in Table 2.
Concrete samples from construction sites for threshold buildings throughout Florida were obtained per ASTM C172 [38] between May and September 2018. The concrete was dumped on wheelbarrows after one-third of the loaded volume was unloaded. A total of 958 concrete cylinders of 100 by 200 mm were molded and cured per ASTM C31 [39]. The specimens were tested for σ at 7 and 28 days following the C39 [40].
To determine the required cementitious content (RCC) for each concrete mixture, the f’cr for each concrete class will be calculated using Equation (1) based on the actual S for each mixture and the reliability factor z (2.33) for a confidence interval of 99% per ACI standards. The difference between the σ values for each concrete mixture and the f’cr is deemed additional overdesign (AOD). The AOD will be calculated and multiplied by the cementitious content ratios (CCR) to obtain the additional cementitious used in the mixtures. The CCR will be calculated by dividing the cementitious content (CC) of each concrete mixture into the respective σ. Thus, the required cementitious content (RCC) is defined as the difference between CC and the additional cementitious.
5. Results and Discussion
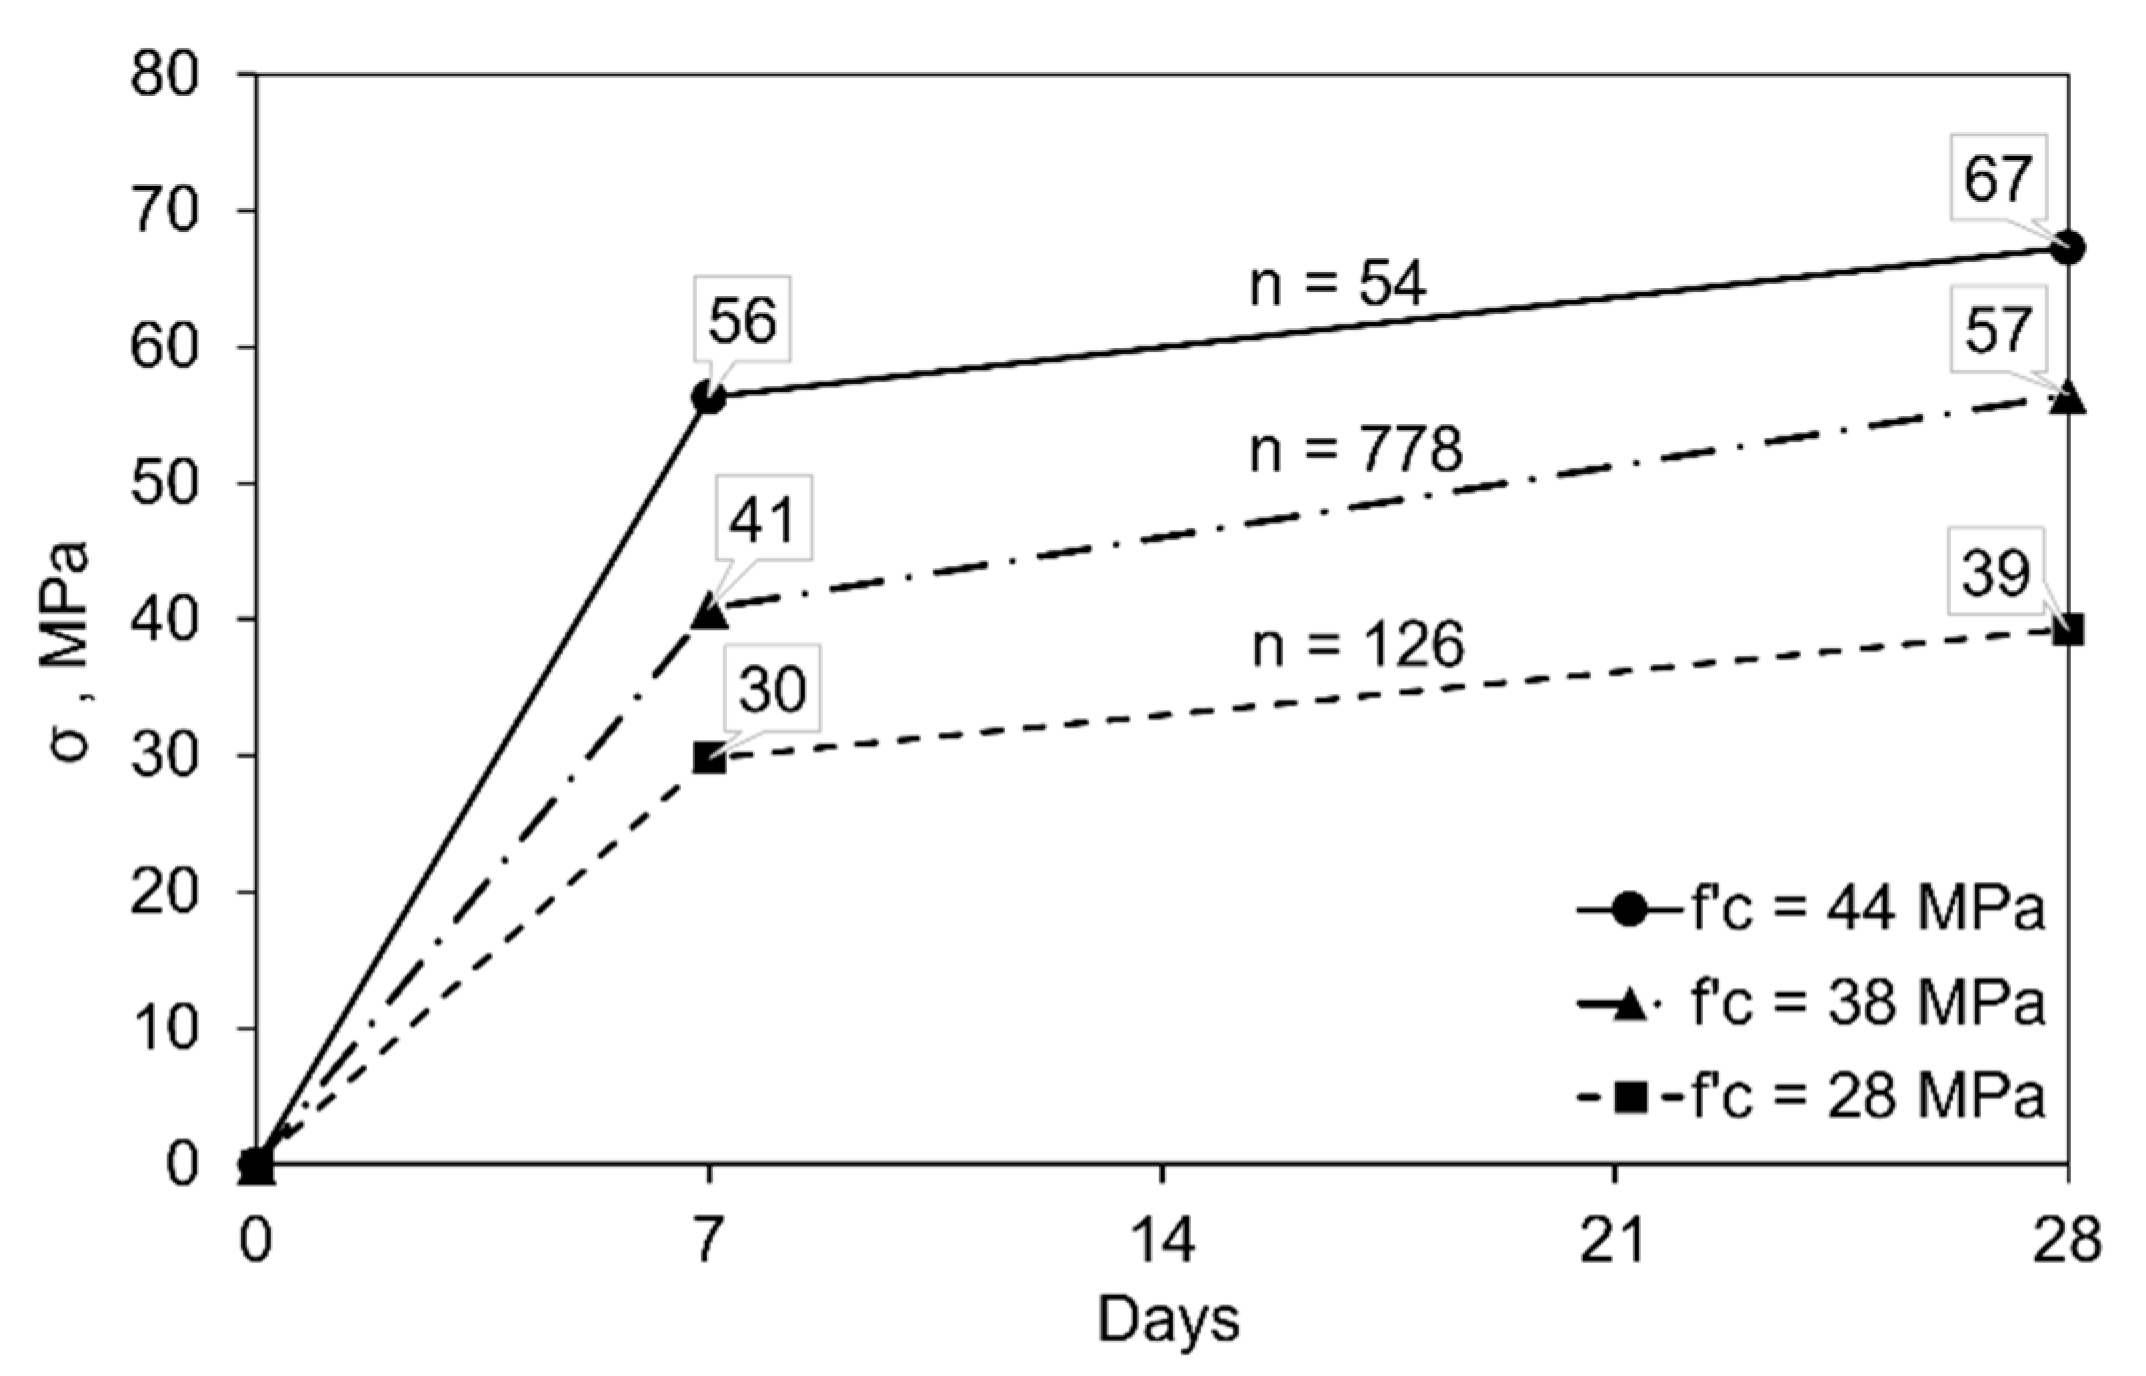
Figure 4 shows the σ results for the three concrete mixtures studied. Three specimens were prepared for testing at 7 days and three at 28 days for every 40 m3 of concrete delivered in most job sites, while some only cast specimens for 28 days for contractual reasons. Two specimens were discarded due to damage during transport to the laboratory. A total of 345 specimens were tested for σ at 7 days and 613 at 28 days. The sets investigated represented 8200 m3 of placed concrete. The f’c of the three mixtures was exceeded within 7 days, which is common in today’s construction. Contractors may reduce construction time by removing forms earlier so that the next group of elements can be built and buildings can be completed quickly.
The σ test results from different batch plants can vary. According to ACI 214R [7], these variations typically originate from two sets of conditions: (1) Batch-to-batch due to ingredients or proportions of ingredients, mixing, transporting, placing, sampling, consolidating and curing; and (2) Within-batch due to differences in sampling, specimen preparation, curing and testing procedures.
The primary source of σ variation in this study should be batch-to-batch because of the different ready-mixed concrete plants that produced the concrete. The data were statistically evaluated based on S, which is the criterion in ACI 214R to classify the quality control of concrete production per concrete strength. For general construction and f’c less than 35 MPa, the batch-to-batch control is considered excellent when S is below 2.8 MPa, very good when S is between 2.8 and 3.4 MPa, good for S between 3.4 and 4.1 MPa, fair for S between 4.1 and 4.8 MPa, or poor for S above 4.8 MPa. For general construction and f’c greater or equal to 35 MPa, the batch-to-batch control is considered excellent when S is below 7 MPa, very good when S is between 7 and 9 MPa, good for S between 9 and 11 MPa, fair for S between 11 and 14 MPa, or poor for S above 14 MPa. At 28 days, two cylinders presented σ lower than the f’c of 41 MPa, representing 0.4%. None of the cylinders for 28 and 44 MPa tested below the f’c. Table 3 shows that the data analyzed in this study were classified between good and excellent, which indicates that the entire operational chain, including ingredients, mixing, transporting, placing, sampling, consolidating and curing, was developed according to the standard procedures. The complete σ data set can be found in Appendix A.
The concrete production has yielded relatively low S because the ingredients are produced under rigorous quality standards. For example, cement production has adopted several technological measures to control raw materials’ physical and chemical properties. Typically, from the limestone quarry until the raw materials are fed into kilns, sensors measure PSD, relative humidity and samples are taken for microscopical determination of the chemical composition. Cement quality is highly controlled during construction, where fresh and hardened properties are verified. If anomalies are detected, the entire production and logistics chain can be broken down to identify the points of failure. For those reasons, it is customary to observe rigorous quality control in concrete construction because all players need to work according to the standards [5].
The test results presented were used to determine RCC for each concrete mixture, as shown in Table 4. The f’cr values were calculated using Equation (1) based on the S for each mixture using a value of z = 2.33. The difference between the σ reached by each concrete mixture and the f’cr, the AOD, was calculated and multiplied by CCR to obtain the additional cementitious used in the mixtures. The CCR was calculated by dividing the CC of the mixtures by the σ achieved. The RCC is the difference between the CC and the additional cementitious. The mixture f’c = 28 MPa used 300 kg/m3 of cementitious, and its RCC was 282 kg/m3. The mixture f’c = 38 MPa used 395 kg/m3 of cementitious, and its RCC was 350 kg/m3. The mixture f’c = 44 MPa used 450 kg/m3 of cementitious, and its RCC was 372 kg/m3. The RCC calculations are aligned with the recently developed research. To illustrate the extent to which cementitious content can be decreased, it was found that it can be reduced by 25% without compromising the compressive strength and consistency. Such reductions can be achieved by optimizing binary and ternary aggregate systems [16,17,18,19,25,41,42].
Although concrete should meet the f’cr to mitigate σ results below the f’c, it appears that strategies to mitigate AOD should be pursued to improve the quality of the structures. How much time is saved by increasing the cementitious content in concrete? Based on the strength developments of the three types of concrete, one can observe that all mixtures reached the 28-day required strength between 5.5 and 6.5 days of the pour. However, ACI 318 [4] recommends that forms should be removed when the removal will not affect the serviceability of the structure. It appears that the strength reached the targets three weeks earlier, indicating that both AOD and OD can be reduced so that the f’cr is achieved later.
That leads to the second strategy: reducing the confidence interval (CI) from 99 to 95%. Confidence intervals between 95 to 92.5% have been successfully used to design and control the compressive strength of concrete in Spain, Belgium and Brazil, for example [43,44,45,46,47,48,49,50]. Per ACI 214.R [7], the z would decrease from 2.33 to 1.65 by narrowing the CI. Such a reduction can diminish the OD, leading to lower cementitious contents in concrete and slower strength development. It is important to note that the reduction of the CI is positive statistically because the failure threshold is 5%, that is, the acceptance range is narrower. Hence, high-quality concrete can be produced with lower strength.
The third strategy relates to the misconception that strength development requires long curing times, leading to construction delays. The structure will be subjected to service loads several months or years after construction, but the strength was reached in less than one week. Such a gap between strength achievement and service can be addressed by designing concrete mixtures to reach the f’cr at 28 days or later if agreed in special provisions.
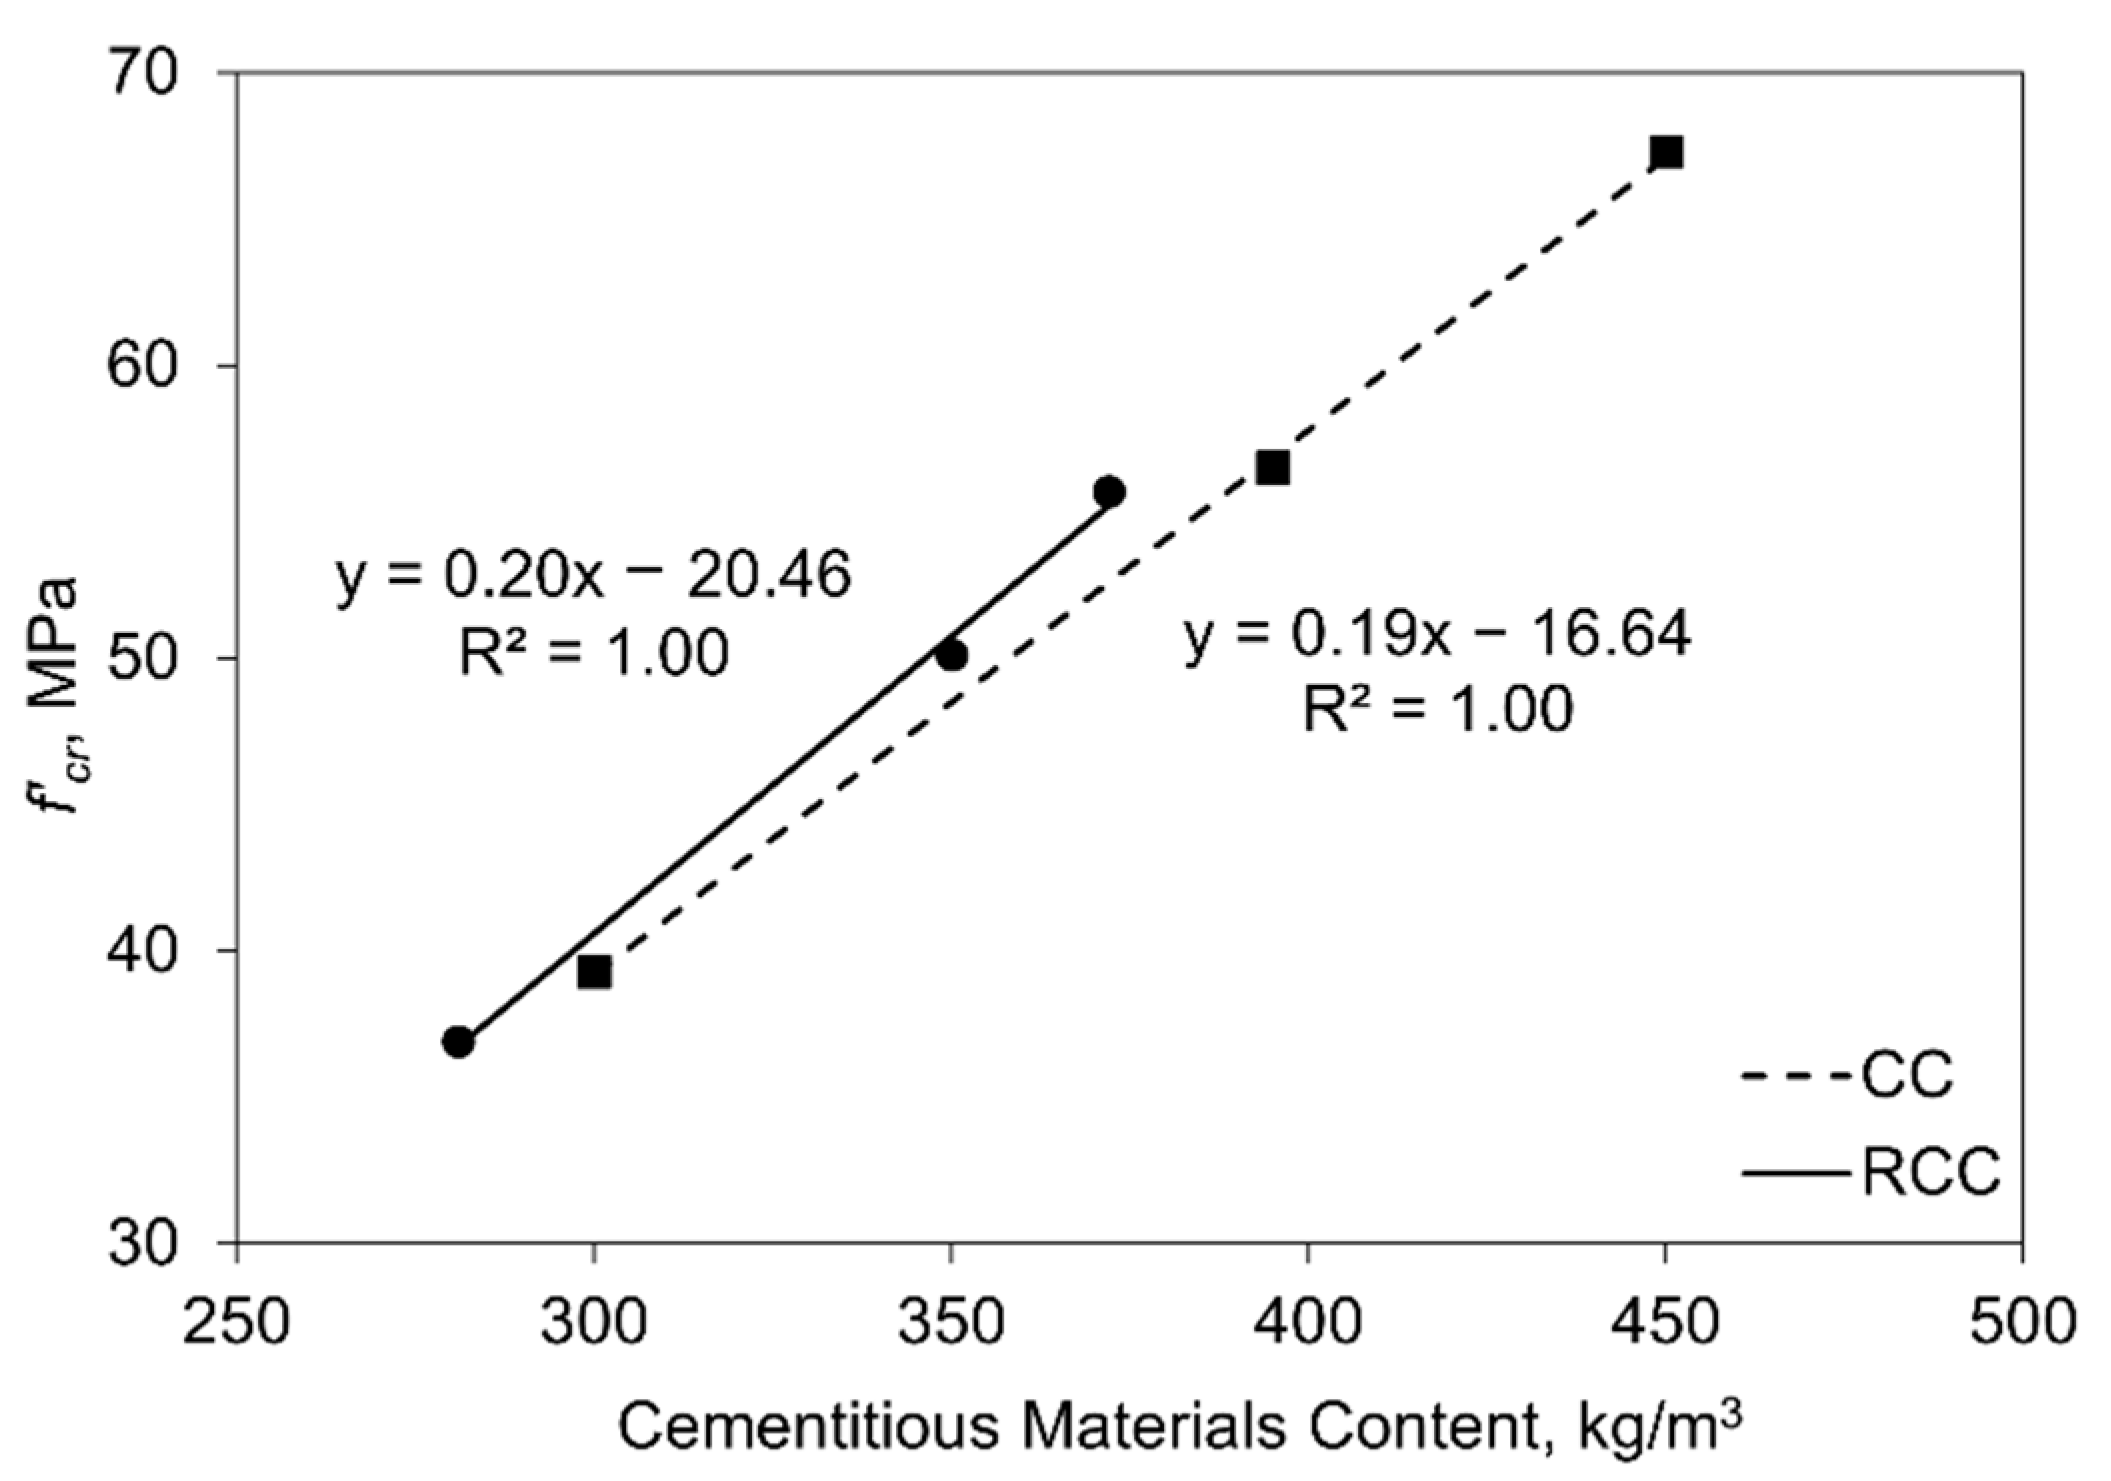
The first step to lowering the cementitious content in concrete should be to optimize the AOD because it can be accomplished based on the current specifications. Figure 5 demonstrates the difference in cementitious content needed to produce concrete with a target strength. The curve from the trial batches shows a range of cementitious content (CC) between 300 and 450 kg/m3 materials to produce concrete between 28 and 44 MPa. The optimized (RCC) curve shows the range of cementitious content between 282 and 372 kg/m3 of cementitious materials to produce concrete between 28 and 44 MPa. Hence, concrete with similar strength could be obtained with a lower cementitious content.
6. Conclusions
Although decades-old standard guidelines require concrete overdesign, these standards can be abused, leading to environmental damage. This investigation was carried for the first time and will be particularly useful to concrete technology. Studies assessing the actual overdesign (OD) magnitudes with field data are rare.
This study aimed to assess the high current contents of combined Portland cement and slag cement in concrete and the compressive strengths obtained versus the strength (σ) required in project plans. The required cementitious materials content (RCC) to meet the OD was determined based on 958 compressive strength tests (σ) representing 8200 m3 of ready-mixed concrete for threshold buildings. The following conclusions can be drawn from the results regarding the tested concrete:
- The actual OD in the concrete mixtures was 7 to 21% higher than required.
- The cementitious materials content should be reduced between 6 and 17% so that concrete can reach the required compressive strength (f’cr) without cement overconsumption.
The overall reduction of cementitious content in concrete can increase the quality of the built elements and reduce the use of natural resources required to build. However, the implementation still presents challenges in reducing the CI from 99 to 95% and breaking the misconception that cement excess in concrete does not accelerate construction. The main reasons for these recommendations are the estimate of substantial savings in the long term and an increase in concrete durability, and more rational use of natural resources.
The novel and rare assessment presented in this article should be contrasted to recent and relevant publications. For example, recent studies have investigated the effects of lower cementitious paste volume in concrete, mainly in the laboratory, and found that it could be reduced without affecting concrete strength and durability evaluated through rapid chloride penetrability testing (RCPT) and surface resistivity (SR) tests [51,52]. The consistency and similarity in findings in this article to such published research indicate that research predominantly developed with field-prepared concrete and specimens can provide accurate outcomes that can be compared to those of laboratory-based experiments, enabling cross verification and triangulation of results.
Concrete and cement demand is expected to increase in the near future. It is in the construction industry’s interest to consider reducing cementitious content in concrete as the trend towards more environmentally friendly building materials continues.
Funding
This research received no external funding.
Data Availability Statement
The data presented in this study are available in Appendix A.
Acknowledgments
I would like to warmly thank Aghane Antunes and Yin-Hsuen Chen (University of Florida—Department of Geography) for preparing the limestone and cement plants map. I am also grateful to Alberto Agnelo de Carvalho (in memoriam), who tabulated the 958 sample certificates used in this study and was an essential supporter of my career as a researcher. Finally, anonymous reviewers contributed to improving the quality of this paper, although I remain responsible for the remaining errors.
Conflicts of Interest
The author has no conflict of interest to declare.
Appendix A
The complete data set comprised of 958 compressive strength (σ) tests is provided below for a consultation.

Table A1.
Compressive strength of the concrete mixture f’c = 28 MPa.
| Days | σ, MPa | Days | σ, MPa | Days | σ, MPa | Days | σ, MPa | Days | σ, MPa |
|---|---|---|---|---|---|---|---|---|---|
| 7 | 30 | 7 | 28 | 28 | 38 | 28 | 30 | 28 | 36 |
| 7 | 28 | 7 | 26 | 28 | 35 | 28 | 35 | 28 | 36 |
| 7 | 31 | 7 | 32 | 28 | 36 | 28 | 33 | 28 | 36 |
| 7 | 29 | 7 | 28 | 28 | 37 | 28 | 43 | 28 | 37 |
| 7 | 31 | 7 | 32 | 28 | 37 | 28 | 40 | 28 | 36 |
| 7 | 28 | 7 | 31 | 28 | 36 | 28 | 42 | 28 | 36 |
| 7 | 25 | 28 | 39 | 28 | 35 | 28 | 43 | 28 | 41 |
| 7 | 34 | 28 | 39 | 28 | 35 | 28 | 44 | 28 | 41 |
| 7 | 31 | 28 | 38 | 28 | 34 | 28 | 46 | 28 | 41 |
| 7 | 31 | 28 | 39 | 28 | 42 | 28 | 44 | 28 | 34 |
| 7 | 31 | 28 | 39 | 28 | 39 | 28 | 42 | 28 | 34 |
| 7 | 31 | 28 | 39 | 28 | 40 | 28 | 40 | 28 | 34 |
| 7 | 28 | 28 | 43 | 28 | 42 | 28 | 36 | 28 | 38 |
| 7 | 27 | 28 | 42 | 28 | 39 | 28 | 35 | 28 | 40 |
| 7 | 29 | 28 | 42 | 28 | 37 | 28 | 33 | 28 | 40 |
| 7 | 29 | 28 | 40 | 28 | 44 | 28 | 34 | 28 | 42 |
| 7 | 38 | 28 | 40 | 28 | 44 | 28 | 38 | 28 | 42 |
| 7 | 31 | 28 | 40 | 28 | 47 | 28 | 37 | 28 | 42 |
| 7 | 33 | 28 | 43 | 28 | 43 | 28 | 37 | - | - |
| 7 | 32 | 28 | 42 | 28 | 40 | 28 | 35 | - | - |
| 7 | 30 | 28 | 42 | 28 | 43 | 28 | 39 | - | - |
| 7 | 23 | 28 | 35 | 28 | 40 | 28 | 44 | - | - |
| 7 | 24 | 28 | 36 | 28 | 42 | 28 | 44 | - | - |
| 7 | 30 | 28 | 36 | 28 | 41 | 28 | 39 | - | - |
| 7 | 33 | 28 | 38 | 28 | 49 | 28 | 39 | - | - |
| 7 | 32 | 28 | 35 | 28 | 48 | 28 | 37 | - | - |
| 7 | 25 | 28 | 37 | 28 | 49 | 28 | 39 | - | - |
Table A2.
Compressive strength of the concrete mixture f’c = 38 MPa.
| Days | σ, MPa | Days | σ, MPa | Days | σ, MPa | Days | σ, MPa | Days | σ, MPa | Days | σ, MPa |
|---|---|---|---|---|---|---|---|---|---|---|---|
| 7 | 46 | 7 | 49 | 7 | 34 | 7 | 45 | 7 | 46 | 7 | 31 |
| 7 | 46 | 7 | 35 | 7 | 47 | 7 | 37 | 7 | 50 | 7 | 40 |
| 7 | 46 | 7 | 49 | 7 | 38 | 7 | 57 | 7 | 37 | 7 | 31 |
| 7 | 48 | 7 | 35 | 7 | 47 | 7 | 25 | 7 | 48 | 7 | 42 |
| 7 | 43 | 7 | 49 | 7 | 38 | 7 | 34 | 7 | 43 | 7 | 38 |
| 7 | 47 | 7 | 36 | 7 | 51 | 7 | 36 | 7 | 32 | 7 | 52 |
| 7 | 42 | 7 | 49 | 7 | 33 | 7 | 25 | 7 | 44 | 7 | 30 |
| 7 | 45 | 7 | 34 | 7 | 47 | 7 | 36 | 7 | 48 | 7 | 40 |
| 7 | 60 | 7 | 52 | 7 | 30 | 7 | 28 | 7 | 37 | 7 | 33 |
| 7 | 63 | 7 | 36 | 7 | 39 | 7 | 45 | 7 | 47 | 7 | 48 |
| 7 | 58 | 7 | 51 | 7 | 30 | 7 | 49 | 7 | 42 | 7 | 31 |
| 7 | 58 | 7 | 42 | 7 | 39 | 7 | 45 | 7 | 51 | 7 | 43 |
| 7 | 61 | 7 | 54 | 7 | 33 | 7 | 39 | 7 | 43 | 7 | 30 |
| 7 | 46 | 7 | 40 | 7 | 40 | 7 | 52 | 7 | 48 | 7 | 44 |
| 7 | 47 | 7 | 53 | 7 | 34 | 7 | 56 | 7 | 47 | 7 | 55 |
| 7 | 41 | 7 | 39 | 7 | 45 | 7 | 31 | 7 | 44 | 7 | 5 |
| 7 | 46 | 7 | 47 | 7 | 36 | 7 | 44 | 7 | 45 | 7 | 27 |
| 7 | 50 | 7 | 36 | 7 | 46 | 7 | 47 | 7 | 34 | 7 | 47 |
| 7 | 52 | 7 | 51 | 7 | 36 | 7 | 41 | 7 | 46 | 7 | 24 |
| 7 | 63 | 7 | 39 | 7 | 52 | 7 | 55 | 7 | 29 | 7 | 41 |
| 7 | 52 | 7 | 50 | 7 | 36 | 7 | 49 | 7 | 42 | 7 | 17 |
| 7 | 61 | 7 | 30 | 7 | 42 | 7 | 38 | 7 | 34 | 7 | 45 |
| 7 | 58 | 7 | 43 | 7 | 32 | 7 | 44 | 7 | 48 | 7 | 24 |
| 7 | 60 | 7 | 40 | 7 | 43 | 7 | 44 | 7 | 32 | 7 | 46 |
| 7 | 57 | 7 | 55 | 7 | 36 | 7 | 37 | 7 | 45 | 7 | 29 |
| 7 | 57 | 7 | 40 | 7 | 44 | 7 | 44 | 7 | 31 | 7 | 48 |
| 7 | 57 | 7 | 53 | 7 | 32 | 7 | 50 | 7 | 46 | 7 | 44 |
| 7 | 57 | 7 | 39 | 7 | 45 | 7 | 41 | 7 | 33 | 7 | 27 |
| 7 | 35 | 7 | 51 | 7 | 30 | 7 | 41 | 7 | 44 | 7 | 44 |
| 7 | 45 | 7 | 43 | 7 | 31 | 7 | 36 | 7 | 27 | 7 | 55 |
| 7 | 48 | 7 | 54 | 7 | 48 | 7 | 43 | 7 | 46 | 7 | 28 |
| 7 | 54 | 7 | 33 | 7 | 42 | 7 | 47 | 7 | 31 | 7 | 47 |
| 7 | 38 | 7 | 49 | 7 | 40 | 7 | 49 | 7 | 44 | 7 | 24 |
| 7 | 44 | 7 | 48 | 7 | 31 | 28 | 54 | 28 | 71 | 28 | 66 |
| 7 | 39 | 7 | 32 | 7 | 44 | 28 | 54 | 28 | 68 | 28 | 59 |
| 7 | 51 | 7 | 50 | 7 | 27 | 28 | 54 | 28 | 69 | 28 | 60 |
| 7 | 26 | 7 | 28 | 7 | 44 | 28 | 51 | 28 | 61 | 28 | 59 |
| 7 | 44 | 7 | 46 | 7 | 27 | 28 | 53 | 28 | 62 | 28 | 61 |
| 7 | 31 | 7 | 39 | 7 | 44 | 28 | 52 | 28 | 61 | 28 | 60 |
| 7 | 49 | 7 | 49 | 7 | 26 | 28 | 48 | 28 | 57 | 28 | 58 |
| 7 | 50 | 7 | 19 | 7 | 47 | 28 | 48 | 28 | 60 | 28 | 63 |
| 7 | 36 | 7 | 24 | 7 | 23 | 28 | 48 | 28 | 58 | 28 | 60 |
| 7 | 51 | 7 | 40 | 7 | 42 | 28 | 65 | 28 | 55 | 28 | 57 |
| 7 | 34 | 7 | 27 | 7 | 42 | 28 | 65 | 28 | 54 | 28 | 59 |
| 7 | 52 | 7 | 45 | 7 | 53 | 28 | 65 | 28 | 54 | 28 | 53 |
| 7 | 32 | 7 | 26 | 7 | 43 | 28 | 60 | 28 | 57 | 28 | 52 |
| 7 | 49 | 7 | 41 | 7 | 31 | 28 | 60 | 28 | 62 | 28 | 48 |
| 7 | 46 | 7 | 26 | 7 | 36 | 28 | 59 | 28 | 60 | 28 | 52 |
| 7 | 34 | 7 | 42 | 7 | 38 | 28 | 47 | 28 | 50 | 28 | 52 |
| 7 | 37 | 7 | 29 | 7 | 37 | 28 | 49 | 28 | 50 | 28 | 48 |
| 7 | 49 | 7 | 43 | 7 | 33 | 28 | 48 | 28 | 50 | 28 | 52 |
| 7 | 27 | 7 | 25 | 7 | 35 | 28 | 58 | 28 | 61 | 28 | 50 |
| 7 | 44 | 7 | 44 | 7 | 36 | 28 | 60 | 28 | 63 | 28 | 52 |
| 7 | 33 | 7 | 27 | 7 | 33 | 28 | 59 | 28 | 62 | 28 | 53 |
| 7 | 50 | 7 | 49 | 7 | 31 | 28 | 58 | 28 | 68 | 28 | 53 |
| 7 | 27 | 7 | 24 | 7 | 23 | 28 | 60 | 28 | 67 | 28 | 51 |
| 7 | 43 | 7 | 39 | 7 | 39 | 28 | 59 | 28 | 67 | 28 | 55 |
| 7 | 28 | 7 | 24 | 7 | 36 | 28 | 57 | 28 | 63 | 28 | 57 |
| 7 | 44 | 7 | 39 | 7 | 49 | 28 | 57 | 28 | 57 | 28 | 57 |
| 7 | 31 | 7 | 21 | 7 | 47 | 28 | 56 | 28 | 60 | 28 | 54 |
| 7 | 45 | 7 | 22 | 28 | 54 | 28 | 60 | 28 | 64 | 28 | 58 |
| 7 | 31 | 7 | 41 | 28 | 53 | 28 | 61 | 28 | 70 | 28 | 53 |
| 7 | 46 | 7 | 26 | 28 | 53 | 28 | 60 | 28 | 66 | 28 | 52 |
| 7 | 31 | 7 | 43 | 28 | 54 | 28 | 58 | 28 | 56 | 28 | 53 |
| 7 | 47 | 7 | 25 | 28 | 56 | 28 | 60 | 28 | 58 | 28 | 57 |
| 7 | 29 | 7 | 44 | 28 | 56 | 28 | 59 | 28 | 57 | 28 | 55 |
| 28 | 54 | 28 | 44 | 28 | 58 | 28 | 55 | 28 | 61 | 28 | 53 |
| 28 | 56 | 28 | 47 | 28 | 46 | 28 | 52 | 28 | 60 | 28 | 55 |
| 28 | 54 | 28 | 45 | 28 | 57 | 28 | 56 | 28 | 58 | 28 | 57 |
| 28 | 58 | 28 | 45 | 28 | 55 | 28 | 55 | 28 | 57 | 28 | 57 |
| 28 | 56 | 28 | 46 | 28 | 54 | 28 | 56 | 28 | 62 | 28 | 56 |
| 28 | 57 | 28 | 45 | 28 | 56 | 28 | 56 | 28 | 55 | 28 | 55 |
| 28 | 52 | 28 | 54 | 28 | 59 | 28 | 58 | 28 | 56 | 28 | 59 |
| 28 | 54 | 28 | 52 | 28 | 60 | 28 | 60 | 28 | 61 | 28 | 56 |
| 28 | 55 | 28 | 56 | 28 | 50 | 28 | 59 | 28 | 58 | 28 | 57 |
| 28 | 54 | 28 | 56 | 28 | 57 | 28 | 58 | 28 | 55 | 28 | 57 |
| 28 | 55 | 28 | 54 | 28 | 56 | 28 | 57 | 28 | 55 | 28 | 56 |
| 28 | 52 | 28 | 56 | 28 | 56 | 28 | 55 | 28 | 57 | 28 | 65 |
| 28 | 53 | 28 | 54 | 28 | 62 | 28 | 59 | 28 | 56 | 28 | 69 |
| 28 | 53 | 28 | 60 | 28 | 67 | 28 | 61 | 28 | 57 | 28 | 66 |
| 28 | 52 | 28 | 60 | 28 | 61 | 28 | 59 | 28 | 58 | 28 | 60 |
| 28 | 52 | 28 | 56 | 28 | 55 | 28 | 65 | 28 | 61 | 28 | 59 |
| 28 | 52 | 28 | 57 | 28 | 51 | 28 | 64 | 28 | 61 | 28 | 59 |
| 28 | 53 | 28 | 54 | 28 | 53 | 28 | 63 | 28 | 61 | 28 | 60 |
| 28 | 36 | 28 | 50 | 28 | 58 | 28 | 52 | 28 | 60 | 28 | 59 |
| 28 | 36 | 28 | 63 | 28 | 57 | 28 | 54 | 28 | 61 | 28 | 58 |
| 28 | 50 | 28 | 62 | 28 | 58 | 28 | 54 | 28 | 61 | 28 | 54 |
| 28 | 55 | 28 | 56 | 28 | 51 | 28 | 62 | 28 | 60 | 28 | 52 |
| 28 | 57 | 28 | 54 | 28 | 52 | 28 | 48 | 28 | 58 | 28 | 53 |
| 28 | 57 | 28 | 55 | 28 | 53 | 28 | 47 | 28 | 52 | 28 | 58 |
| 28 | 54 | 28 | 53 | 28 | 57 | 28 | 65 | 28 | 56 | 28 | 64 |
| 28 | 54 | 28 | 59 | 28 | 56 | 28 | 62 | 28 | 58 | 28 | 61 |
| 28 | 55 | 28 | 65 | 28 | 59 | 28 | 64 | 28 | 58 | 28 | 56 |
| 28 | 52 | 28 | 63 | 28 | 54 | 28 | 57 | 28 | 63 | 28 | 57 |
| 28 | 54 | 28 | 63 | 28 | 54 | 28 | 56 | 28 | 59 | 28 | 60 |
| 28 | 54 | 28 | 61 | 28 | 54 | 28 | 56 | 28 | 56 | 28 | 60 |
| 28 | 65 | 28 | 63 | 28 | 63 | 28 | 59 | 28 | 58 | 28 | 62 |
| 28 | 65 | 28 | 61 | 28 | 63 | 28 | 59 | 28 | 55 | 28 | 59 |
| 28 | 65 | 28 | 61 | 28 | 65 | 28 | 57 | 28 | 53 | 28 | 54 |
| 28 | 58 | 28 | 59 | 28 | 56 | 28 | 54 | 28 | 54 | 28 | 53 |
| 28 | 60 | 28 | 60 | 28 | 60 | 28 | 66 | 28 | 53 | 28 | 47 |
| 28 | 58 | 28 | 57 | 28 | 63 | 28 | 62 | 28 | 53 | 28 | 48 |
| 28 | 58 | 28 | 55 | 28 | 61 | 28 | 63 | 28 | 54 | 28 | 49 |
| 28 | 57 | 28 | 50 | 28 | 59 | 28 | 51 | 28 | 60 | 28 | 48 |
| 28 | 63 | 28 | 50 | 28 | 58 | 28 | 52 | 28 | 63 | 28 | 50 |
| 28 | 65 | 28 | 50 | 28 | 56 | 28 | 52 | 28 | 62 | 28 | 49 |
| 28 | 67 | 28 | 43 | 28 | 53 | 28 | 56 | 28 | 58 | 28 | 58 |
| 28 | 60 | 28 | 41 | 28 | 54 | 28 | 55 | 28 | 57 | 28 | 47 |
| 28 | 59 | 28 | 46 | 28 | 52 | 28 | 54 | 28 | 61 | 28 | 50 |
| 28 | 57 | 28 | 58 | 28 | 50 | 28 | 54 | 28 | 47 | 28 | 49 |
| 28 | 59 | 28 | 56 | 28 | 50 | 28 | 52 | 28 | 49 | 28 | 50 |
| 28 | 58 | 28 | 60 | 28 | 50 | 28 | 52 | 28 | 48 | 28 | 50 |
| 28 | 57 | 28 | 54 | 28 | 60 | 28 | 56 | 28 | 47 | 28 | 59 |
| 28 | 64 | 28 | 54 | 28 | 60 | 28 | 54 | 28 | 51 | 28 | 60 |
| 28 | 64 | 28 | 50 | 28 | 62 | 28 | 55 | 28 | 50 | 28 | 62 |
| 28 | 64 | 28 | 62 | 28 | 60 | 28 | 56 | 28 | 57 | 28 | 60 |
| 28 | 56 | 28 | 61 | 28 | 62 | 28 | 59 | 28 | 53 | 28 | 60 |
| 28 | 54 | 28 | 61 | 28 | 57 | 28 | 60 | 28 | 55 | 28 | 60 |
| 28 | 58 | 28 | 55 | 28 | 58 | 28 | 62 | 28 | 44 | - | - |
| 28 | 60 | 28 | 55 | 28 | 55 | 28 | 59 | 28 | 45 | - | - |
| 28 | 58 | 28 | 47 | 28 | 60 | 28 | 61 | 28 | 43 | - | - |
| 28 | 64 | 28 | 55 | 28 | 52 | 28 | 56 | 28 | 50 | - | - |
| 28 | 63 | 28 | 55 | 28 | 50 | 28 | 57 | 28 | 51 | - | - |
| 28 | 64 | 28 | 55 | 28 | 51 | 28 | 57 | 28 | 50 | - | - |
| 28 | 62 | 28 | 57 | 28 | 53 | 28 | 53 | 28 | 58 | - | - |
| 28 | 64 | 28 | 57 | 28 | 53 | 28 | 56 | 28 | 49 | - | - |
| 28 | 65 | 28 | 60 | 28 | 55 | 28 | 56 | 28 | 48 | - | - |
| 28 | 65 | 28 | 55 | 28 | 56 | 28 | 68 | 28 | 52 | - | - |
| 28 | 63 | 28 | 58 | 28 | 57 | 28 | 58 | 28 | 51 | - | - |
| 28 | 63 | 28 | 60 | 28 | 59 | 28 | 64 | 28 | 50 | - | - |
| 28 | 65 | 28 | 54 | 28 | 55 | 28 | 52 | 28 | 56 | - | - |
| 28 | 59 | 28 | 57 | 28 | 55 | 28 | 50 | 28 | 51 | - | - |
Table A3.
Compressive strength of the concrete mixture f’c = 44 MPa.
| Days | σ, MPa | Days | σ, MPa |
|---|---|---|---|
| 7 | 63 | 28 | 67 |
| 7 | 44 | 28 | 67 |
| 7 | 64 | 28 | 68 |
| 7 | 61 | 28 | 67 |
| 7 | 67 | 28 | 66 |
| 7 | 68 | 28 | 67 |
| 7 | 68 | 28 | 68 |
| 7 | 50 | 28 | 63 |
| 7 | 44 | 28 | 66 |
| 7 | 60 | 28 | 67 |
| 7 | 58 | 28 | 71 |
| 7 | 65 | 28 | 69 |
| 7 | 55 | 28 | 70 |
| 7 | 59 | 28 | 69 |
| 7 | 63 | 28 | 68 |
| 7 | 33 | 28 | 75 |
| 7 | 56 | 28 | 74 |
| 7 | 35 | 28 | 73 |
| 7 | 63 | 28 | 78 |
| 7 | 35 | 28 | 74 |
| 7 | 71 | 28 | 71 |
| 28 | 68 | - | - |
| 28 | 66 | - | - |
| 28 | 67 | - | - |
| 28 | 66 | - | - |
| 28 | 67 | - | - |
| 28 | 66 | - | - |
| 28 | 64 | - | - |
| 28 | 66 | - | - |
| 28 | 65 | - | - |
| 28 | 57 | - | - |
| 28 | 55 | - | - |
| 28 | 56 | - | - |
References
- ACI 207.1R; Guide to Mass Concrete. American Concrete Institute: Farmington Hills, MI, USA, 2005.
- ACI 207.2R; Report on Thermal and Volume Change Effects on Cracking of Mass Concrete. American Concrete Institute: Farmington Hills, MI, USA, 2007.
- ACI 301; Specifications for Structural Concrete. American Concrete Institute: Farmington Hills, MI, USA, 2016.
- ACI 318; Building Code Requirements for Structural Concrete. American Concrete Institute: Farmington Hills, MI, USA, 2019.
- Mehta, P.K.; Monteiro, P.J.M. Concrete: Microstructure, Properties, and Materials, 4th ed.; Mc Graw Hill: New York, NY, USA, 2013; ISBN 978-9339204761. [Google Scholar]
- ACI 211.1; Standard Practice for Selecting Proportions for Normal, Heavyweight, and Mass Concrete. American Concrete Institute: Farmington Hills, MI, USA, 2009.
- ACI 214R; Guide to Evaluation of Strength Test Results of Concrete. American Concrete Institute: Farmington Hills, MI, USA, 2019.
- Florida Department of Transportation (FDOT). Standard Specification for Road and Bridge Construction; Florida Department of Transportation (FDOT): Tallahassee, FL, USA, 2020.
- Florida Department of Transportation (FDOT). Standard Specification for Road and Bridge Construction; Florida Department of Transportation (FDOT): Tallahassee, FL, USA, 2021.
- Agopyan, V.; John, V. Desafio da Sustentabilidade na Construção Civil; Edgard Blucher: São Paulo, Brazil, 2011; ISBN 978-8521206101. [Google Scholar]
- Lampl Herbert Consultants. Strategic Aggregates Study: Sources, Constraints, and Economic Value of Limestone and Sand in Florida; Florida Department of Transportation: Gainesville, FL, USA, 2007.
- United States Geological Survey (USGS). Mineral Commodity Summaries. 2021. Available online: https://pubs.er.usgs.gov/publication/mcs2021 (accessed on 8 January 2022).
- Khatibmasjedi, S.; de Caso, F.; Nanni, A. SEACON: Redefining sustainable concrete. In Proceedings of the Fourth International Conference on Sustainable Construction Materials and Technologies, Las Vegas, NV, USA, 7–11 August 2016. [Google Scholar]
- Le Quéré, C. Global Carbon Budget 2015. Earth Syst. Sci. Data 2015, 7, 349–396. [Google Scholar] [CrossRef] [Green Version]
- IEA. Technology Roadmap—Low-Carbon Transition in the Cement Industry; International Energy Agency: Paris, France, 2018. [Google Scholar]
- Antunes, R.; Tia, M. Cement Content Reduction in Concrete Through Aggregate Optimization and Packing: A Sustainable Practice for Pavement and Seaport Construction. Mix Sustent. 2018, 4, 25–32. [Google Scholar] [CrossRef]
- Antunes, R.; Tia, M. Effects of Aggregate Packing on Concrete Strength and Consistency. ASTM Int. Adv. Civ. Eng. Mater. 2018, 7, 479–495. [Google Scholar] [CrossRef]
- Antunes, R. Effects of Aggregate Gradation on Aggregate Packing. Ph.D. Thesis, University of Florida, Gainesville, FL, USA, 2018. [Google Scholar]
- Antunes, R. High Temperature and Cracking: Equations to Avoid High-Heat Concrete Mixtures in Massive Bridge Footings. ASCE J. Mater. Civ. Eng. 2021, 33, 04021354. [Google Scholar] [CrossRef]
- Antunes, R.; Tia, M. Mitigation of Early Thermal Contraction Cracks in Massive Footings. ACI Struct. J. 2021, 118, 193–202. [Google Scholar] [CrossRef]
- Winter, N. Low Concrete Strength? Ten Potential Cement-Related Causes. Available online: https://www.understanding-cement.com/support-files/10causes.pdf (accessed on 8 January 2022).
- Andrew, R. Global CO2 emissions from cement production. Earth Syst. Sci. Data 2018, 10, 195–217. [Google Scholar] [CrossRef] [Green Version]
- Noël, M.; Sanchez, L.; Fathifazl, G. Recent advances in sustainable concrete for structural applications. In Proceedings of the Sustainable Construction Materials and Technologies, International Committee of the Sustainable Construction Materials and Technologies Conference, Las Vegas, NV, USA, 7–11 August 2016. [Google Scholar] [CrossRef]
- Wassermann, R.; Katz, A.; Bentur, A. Minimum cement content requirements: A must or a myth? Mater. Struct. 2009, 42, 973–982. [Google Scholar] [CrossRef]
- Antunes, R.; Tia, M. Influence of Intermediate-Sized Particle Content on Traditional Dry-Rodded and Vibrated Aggregate Packing. Int. J. End. Res. Appl. 2018, 8, 21–27. [Google Scholar] [CrossRef]
- ASTM C150; Standard Specification for Portland Cement. ASTM International: West Conshohocken, PA, USA, 2020.
- ASTM C595; Standard Specification for Blended Hydraulic Cements. ASTM International: West Conshohocken, PA, USA, 2020.
- AASHTO M 85; Standard Specification for Portland Cement. American Association of State Highway and Transportation Officials: Washington, DC, USA, 2020.
- AASHTO M 240; Standard Specification for Blended Hydraulic Cement. American Association of State Highway and Transportation Officials: Washington, DC, USA, 2020.
- Cost, T. Update-Performance of C595 / M 240 Type IL Portland-Limestone Cement. Available online: https://intrans.iastate.edu/app/uploads/2018/08/Tues07-Cost-C595.pdf (accessed on 8 January 2022).
- Jin, R.; Chen, Q.; Soboyejo, A.B.O. Non-linear and mixed regression models in predicting sustainable concrete strength. Constr. Build. Mater. 2018, 170, 142–152. [Google Scholar] [CrossRef]
- United States Geological Survey (USGS). Mineral Commodity Summaries. Available online: https://pubs.er.usgs.gov/publication/70194932 (accessed on 8 January 2022). [CrossRef]
- Işık, E.; Harirchian, E.; Bilgin, H.; Jadhav, K. The effect of material strength and discontinuity in RC structures according to different site-specific design spectra. Res. Eng. Struct. Mater. 2021, 7, 413–430. [Google Scholar] [CrossRef]
- Danesh, M.; Iraji, A.; Jaafari, S. Evaluating Seismic Resistance Parameters of Optimized Reinforced Concrete Moment Frames Using and Initial Cost Objective Function. Int. J. Optim. Civil Eng. 2021, 11, 611–630. [Google Scholar]
- Işık, E.; Harirchian, E.; Bilgin, H.; Kaya, B.; Karaşin, İ. The Effect of Insufficient Cover Thickness on Structural Performance of Reinforced Concrete Buildings; International Conference on Organization and Technology of Maintenance: Osijek, Croatia, 2021. [Google Scholar] [CrossRef]
- Antunes, R. Multivariate regression model for peak temperatures in massive elements statistically verified by artificial neural networks. Constr. Build. Mater. 2022, 316, 1–14. [Google Scholar] [CrossRef]
- ASTM C136; Standard Test Method for Sieve Analysis of Fine and Coarse Aggregates. ASTM International: West Conshohocken, PA, USA, 2019.
- ASTM C127; Standard Test Method for Density, Relative Density (Specific Gravity), and Absorption of Coarse Aggregate. ASTM International: West Conshohocken, PA, USA, 2015.
- ASTM C128; Standard Test Method for Relative Density (Specific Gravity) and Absorption of Fine Aggregate. ASTM International: West Conshohocken, PA, USA, 2015.
- ASTM C989; Standard Specification for Slag Cement for Use in Concrete and Mortars. ASTM International: West Conshohocken, PA, USA, 2018.
- ASTM C172; Standard Practice for Sampling Freshly Mixed Concrete. ASTM International: West Conshohocken, PA, USA, 2017.
- ASTM C31; Standard Practice for Making and Curing Concrete Test Specimens in the Field. ASTM International: West Conshohocken, PA, USA, 2021.
- ASTM C39; Standard Test Method for Compressive Strength of Cylindrical Concrete Specimens. ASTM International: West Conshohocken, PA, USA, 2021.
- Chung, H.-W.; Tia, M. Effects of Minimum Cementitious Paste Volume and Blended Aggregates on Compressive Strength and Surface Resistivity of Portland Limestone Cement Concrete. J. Mater. Civ. Eng. 2021, 33, 04021080. [Google Scholar] [CrossRef]
- Chung, H.W.; Subgranon, T.; Tia, M. Reducing cementitious paste volume of slipformed pavement concrete by blending aggregates. Int. J. Pavement Res. Technol. 2020, 13, 679–685. [Google Scholar] [CrossRef]
- De Brito, J.; Kurda, R.; da Silva, P.R. Can we truly predict the compressive strength of concrete without knowing the properties of aggregates? Appl. Sci. 2018, 8, 1095. [Google Scholar] [CrossRef] [Green Version]
- Ministerio de Fomento—Spain, EHE-08. Structural Concrete. Available online: http://asidac.es/asidac-en/wp-content/uploads/2016/07/EHE-ENG.pdf (accessed on 8 January 2022).
- European Committee for Standardization. Design of Concrete Structures—Part 1-1: General Rules and Rules for Buildings. Available online: https://www.phd.eng.br/wp-content/uploads/2015/12/en.1992.1.1.2004.pdf (accessed on 8 January 2022).
- Revilla-Cuesta, V.; Skaf, M.; Espinosa, A.B.; Santamaría, A.; Ortega-López, V. Statistical approach for the design of structural self-compacting concrete with fine recycled concrete aggregate. Mathematics 2020, 8, 2190. [Google Scholar] [CrossRef]
- ABNT NBR-12655. Concreto de cimento Portland—Preparo, Controle, e Recebimento; Associacao Brasileira de Normas Tecnicas: São Paulo, Brazil, 2006. [Google Scholar]
- Chung, H.W.; Subgranon, T.; Wang, Y.; DeFord, H.; Tia, M. Evaluation of pavement concrete with low paste volume using portland limestone cement. ACI Mater. J. 2020, 117, 181–192. [Google Scholar] [CrossRef]
- Chung, H.-W.; Subgranon, T.; Tia, M.; DeFord, H.; Armenteros, J. The effects of reduced paste volume in Portland limestone cement concrete. Mag. Concr. Res. 2021, 73, 958–972. [Google Scholar] [CrossRef]
Figure 1.
Location of limestone formations and cement plants considered in this study.

Figure 2.
Crushed-stone production in Florida.

Figure 3.
Gradation of aggregates.

Figure 4.
Compressive strength development of the concrete.

Figure 5.
Cementitious content and required compressive strength.

Table 1.
Physical properties of aggregates.
| Property 1 | FA | CA |
|---|---|---|
| Materials < 75 µm (%) | 0.2 | 1.5 |
| Fineness Modulus | 2.34 | – |
| SSD Specific Gravity (g/cm3) | 2.69 | 2.42 |
| Absorption (%) | 0.3 | 3.9 |
| Nominal Maximum Size (mm) | – | 19 |
1 SSD is the Saturated-Surface Dry condition of aggregates; FA is the fine aggregate; CA is the coarse aggregate.
Table 2.
Concrete mixtures 1.
| f’c | CC | w/cm | CA | FA |
|---|---|---|---|---|
| 28 MPa | 300 | 0.56 | 980 | 690 |
| 38 MPa | 395 | 0.41 | 980 | 700 |
| 44 MPa | 450 | 0.37 | 980 | 640 |
1 Quantities in kg/m3; f’c is the specified compressive strength of concrete; CC is the cementitious content; Cement is the Type IL-10 or PLC; Slag is the slag cement grade 120; CA is the coarse aggregate; FA is the fine aggregate; w/cm is the water to cementitious content ratio.
Table 3.
Batch-to-batch control classification 1.
| f’c | S7 Days Control | S28 Days Control | ||
|---|---|---|---|---|
| 28 | 3.1 | Very good | 3.8 | Good |
| 38 | 9.5 | Good | 5.2 | Excellent |
| 44 | 11.0 | Good | 5.0 | Excellent |
1 Quantities in MPa; Classification of batch control per ACI 214R-11, based on the standard deviation (S) of general construction testing.
Table 4.
Required cementitious content in concrete 1.
| f’c | f’cr | σ | AOD | CCR | RCC |
|---|---|---|---|---|---|
| MPa | kg/m3/MPa | % | |||
| 28 | 36.9 | 39.3 | 2.4 | 7.6 | 282 |
| 38 | 50.1 | 56.5 | 6.4 | 7.0 | 350 |
| 44 | 55.7 | 67.3 | 11.6 | 6.7 | 372 |
1 f’c is the specified compressive strength at 28 days; f’cr is the required compressive strength at 28 days; σ is the compressive strength at 28 days; AOD is the additional overdesign; CCR is the cementitious content ratio; RCC is the required cementitious content.
Publisher’s Note: MDPI stays neutral with regard to jurisdictional claims in published maps and institutional affiliations. |
© 2022 by the author. Licensee MDPI, Basel, Switzerland. This article is an open access article distributed under the terms and conditions of the Creative Commons Attribution (CC BY) license (https://creativecommons.org/licenses/by/4.0/).
Share and Cite
MDPI and ACS Style
Antunes, R. Concrete Overstrength: Assessment of Field Strength Seeking Insights for Overdesign Optimization. CivilEng 2022, 3, 51-65. https://doi.org/10.3390/civileng3010004
AMA Style
Antunes R. Concrete Overstrength: Assessment of Field Strength Seeking Insights for Overdesign Optimization. CivilEng. 2022; 3(1):51-65. https://doi.org/10.3390/civileng3010004
Chicago/Turabian StyleAntunes, Rodrigo. 2022. "Concrete Overstrength: Assessment of Field Strength Seeking Insights for Overdesign Optimization" CivilEng 3, no. 1: 51-65. https://doi.org/10.3390/civileng3010004