
Numerical Analysis of an Earthen Masonry Structure Subjected to Blast Loading


Abstract
:1. Introduction
2. Blast Loading Definition and FEM Modeling
3. Effects of Blast Loading on the Torre de la Vela
3.1. Exterior Blast
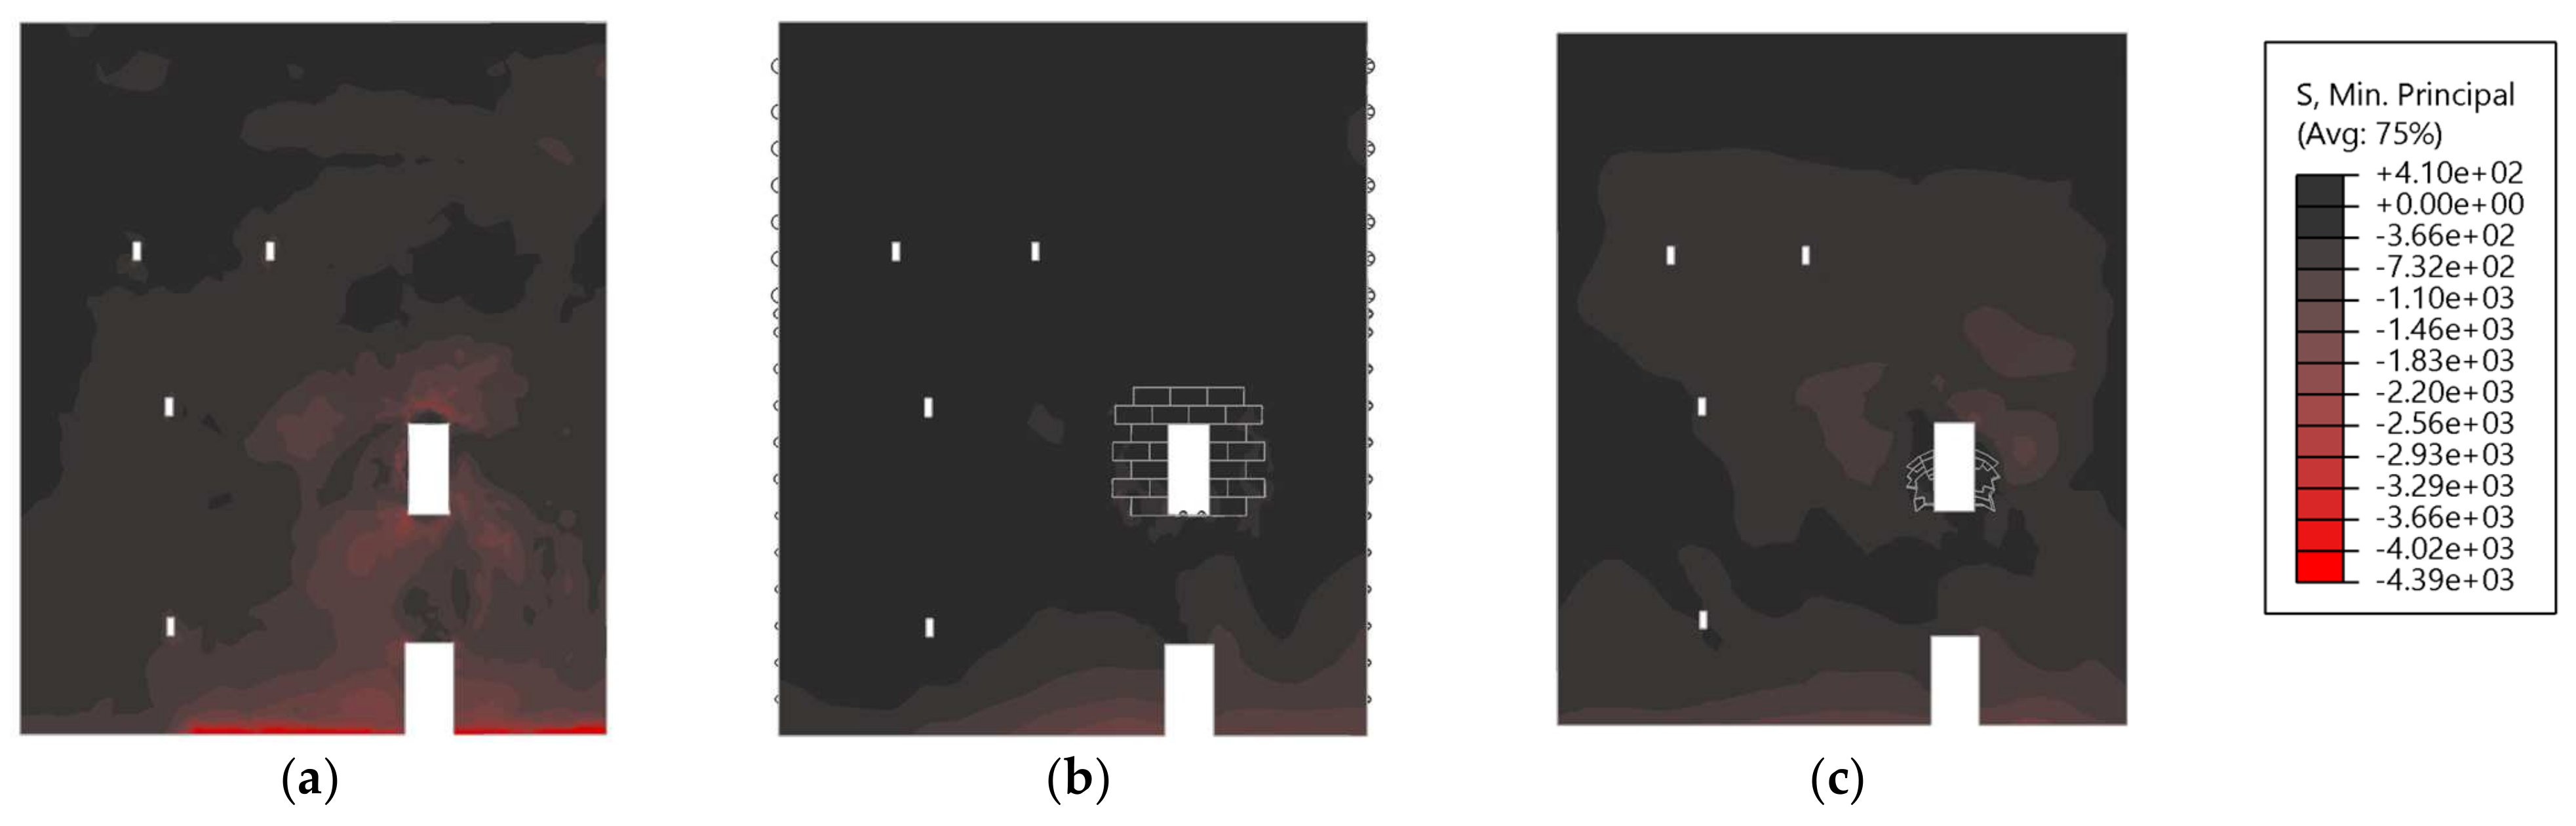
3.2. Interior Blast
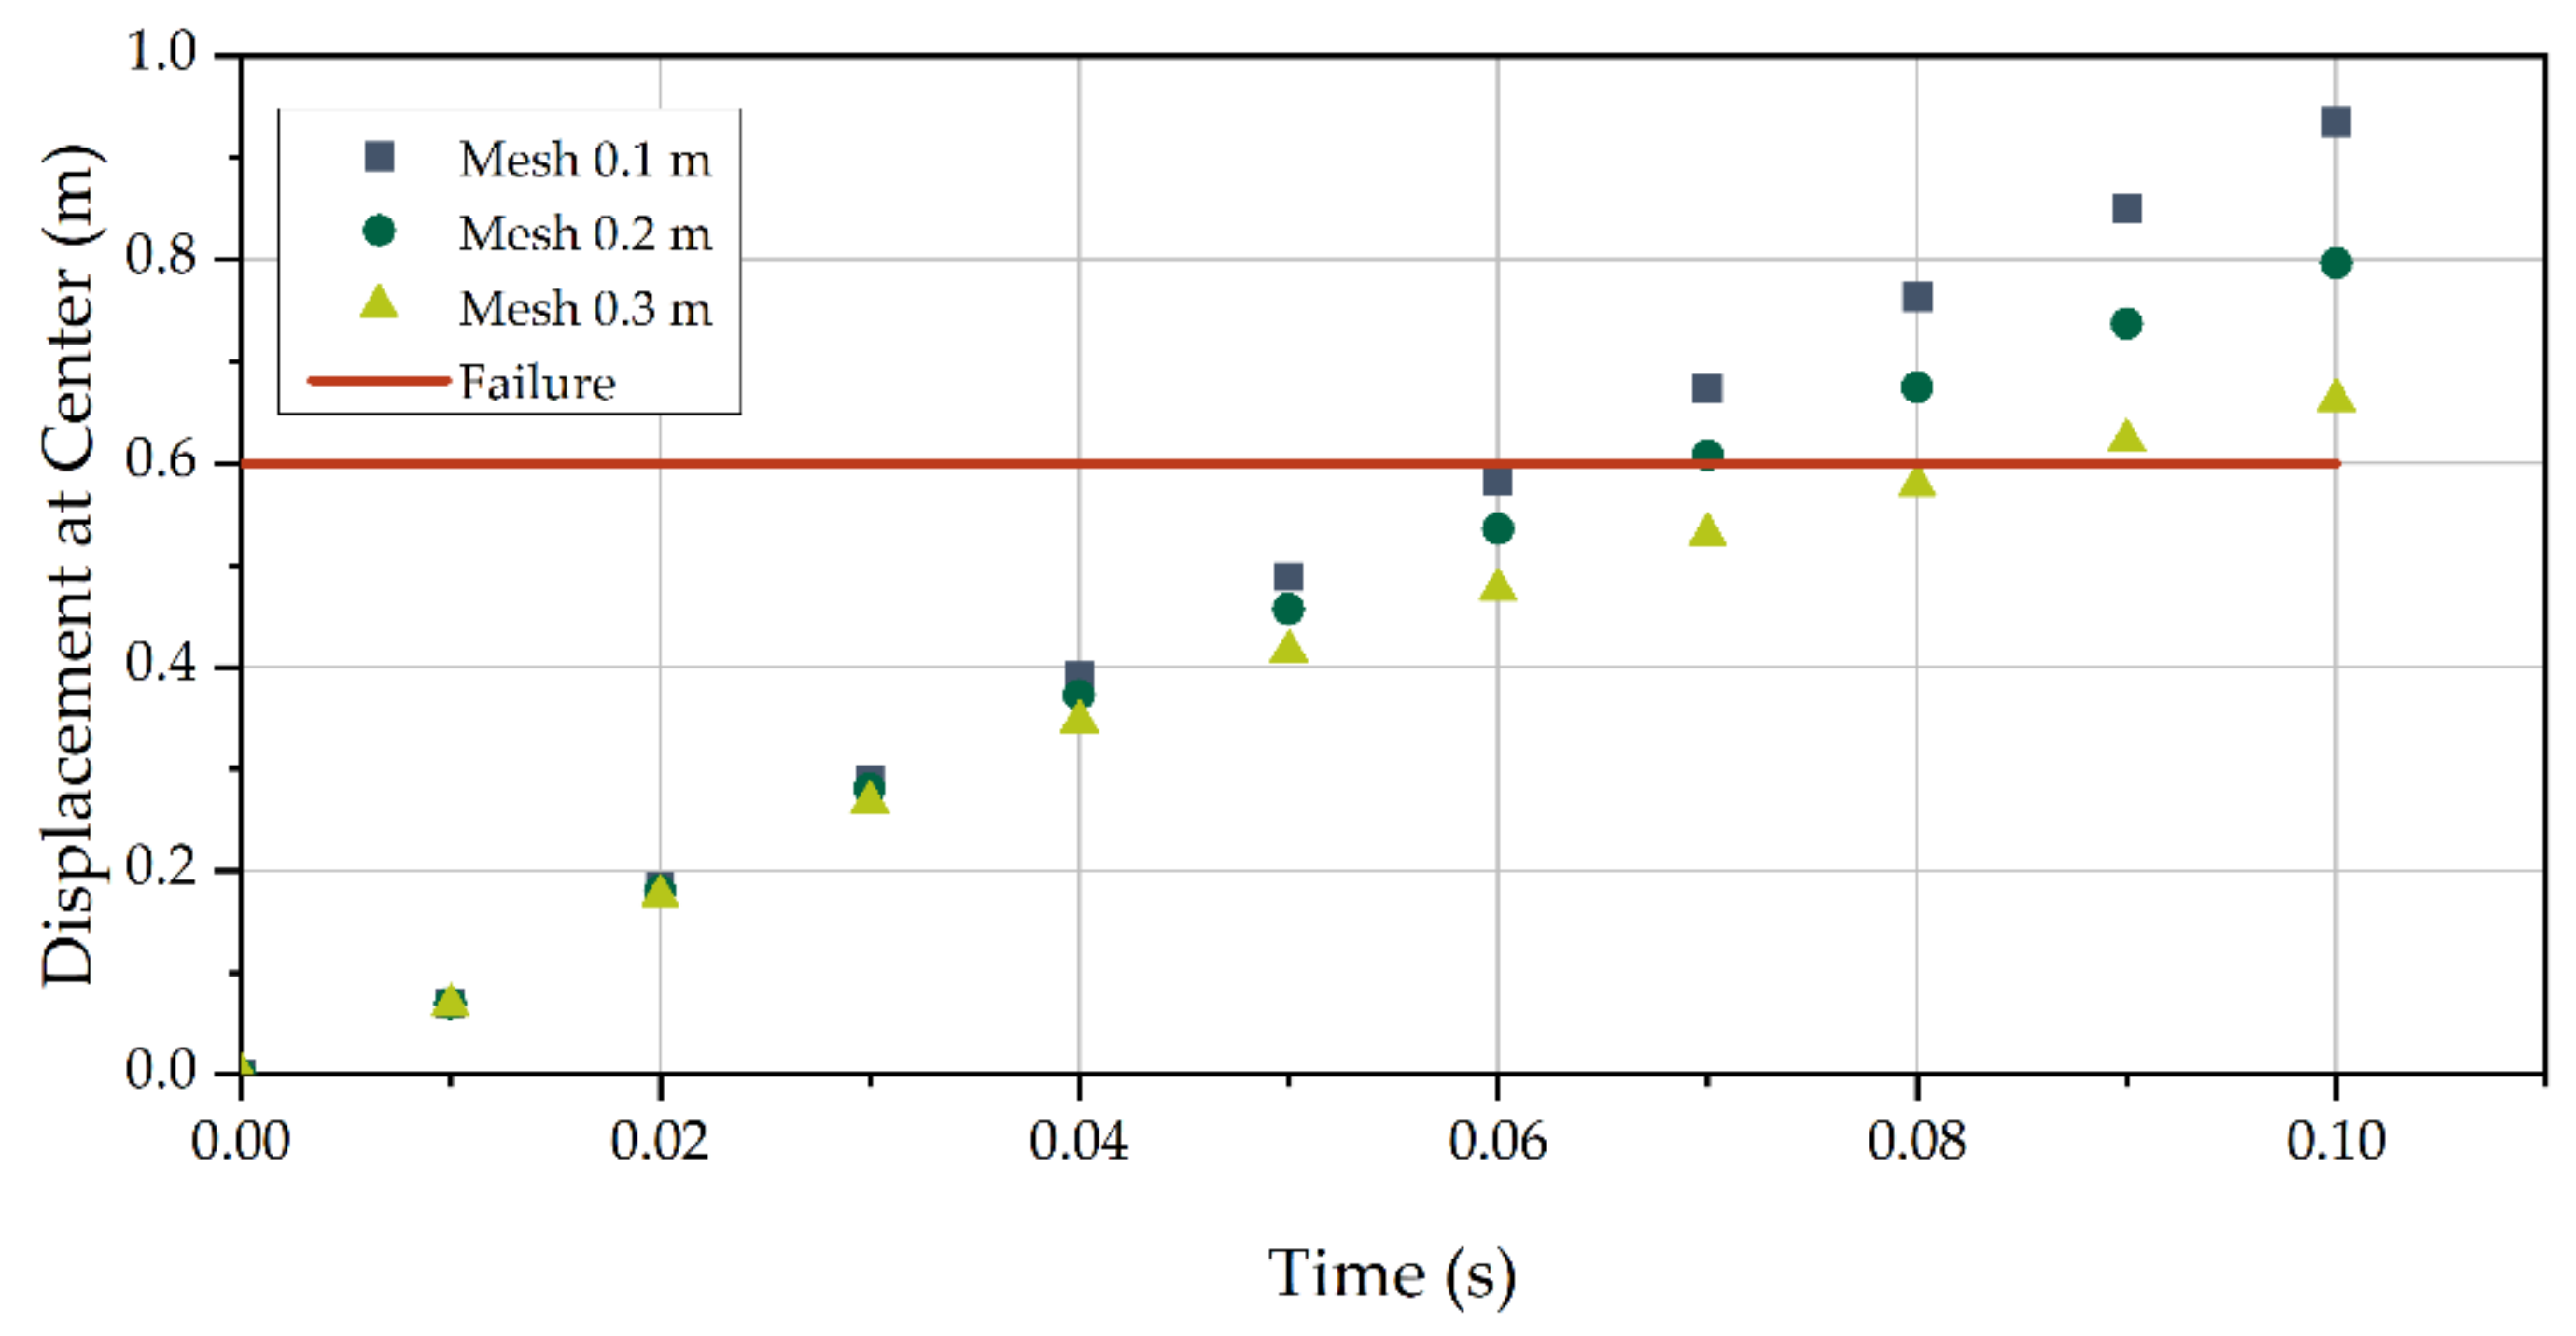
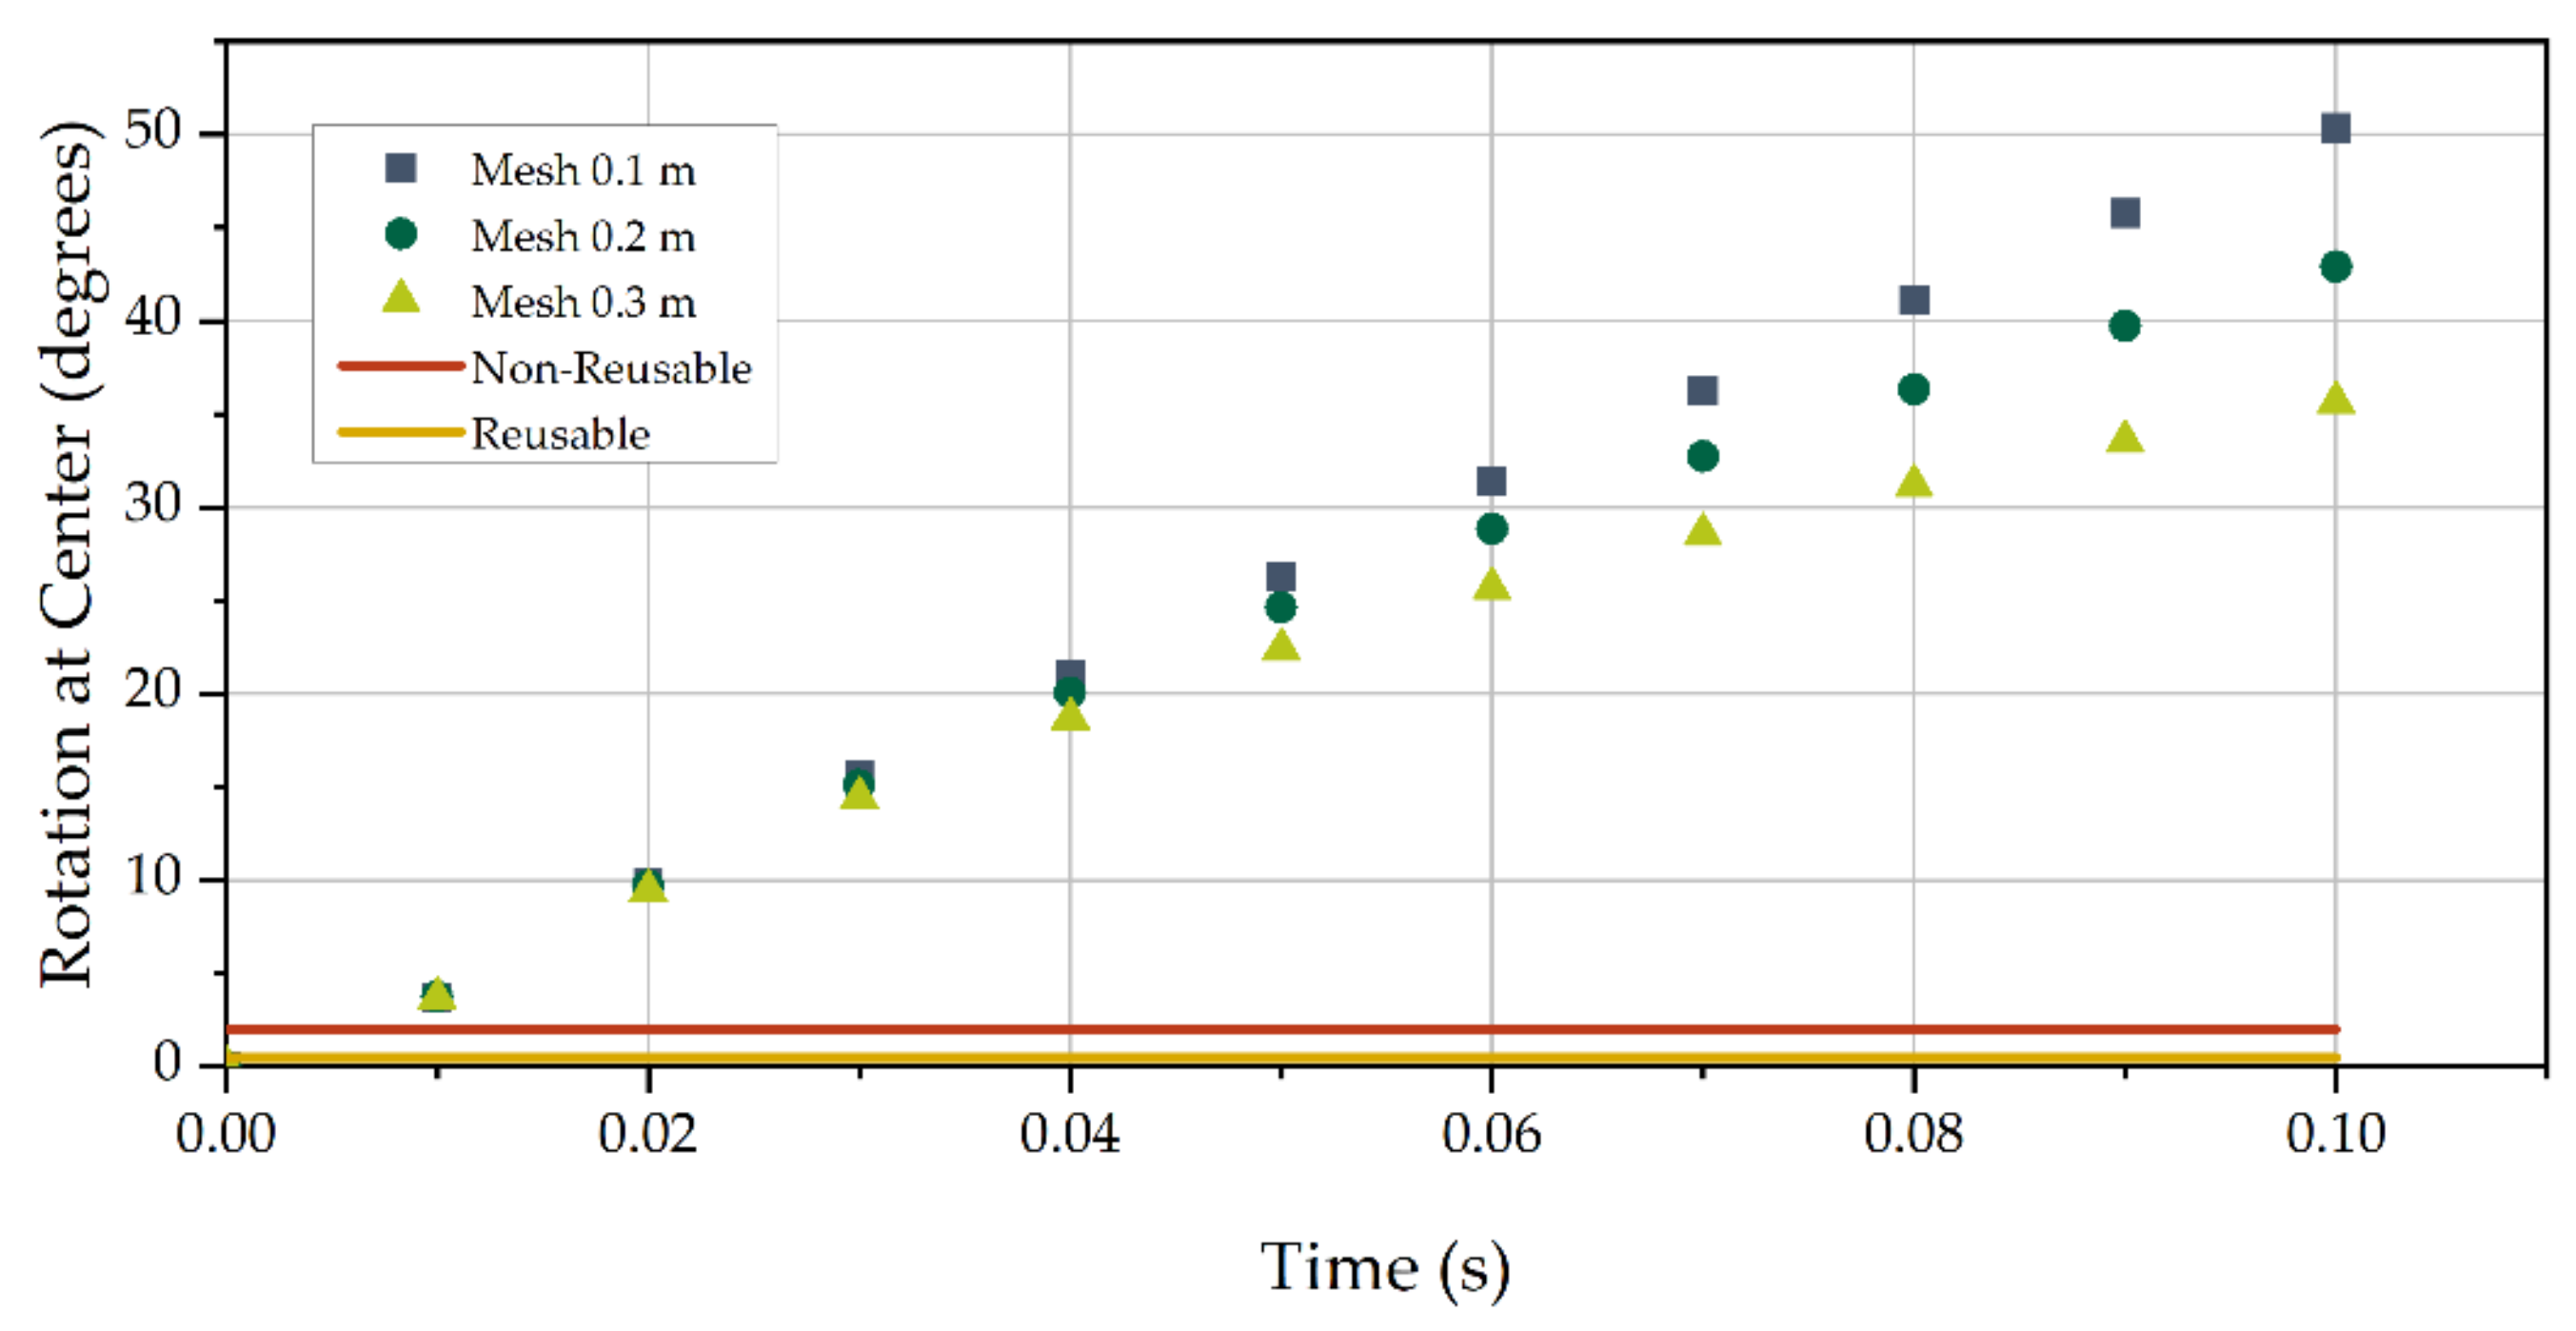
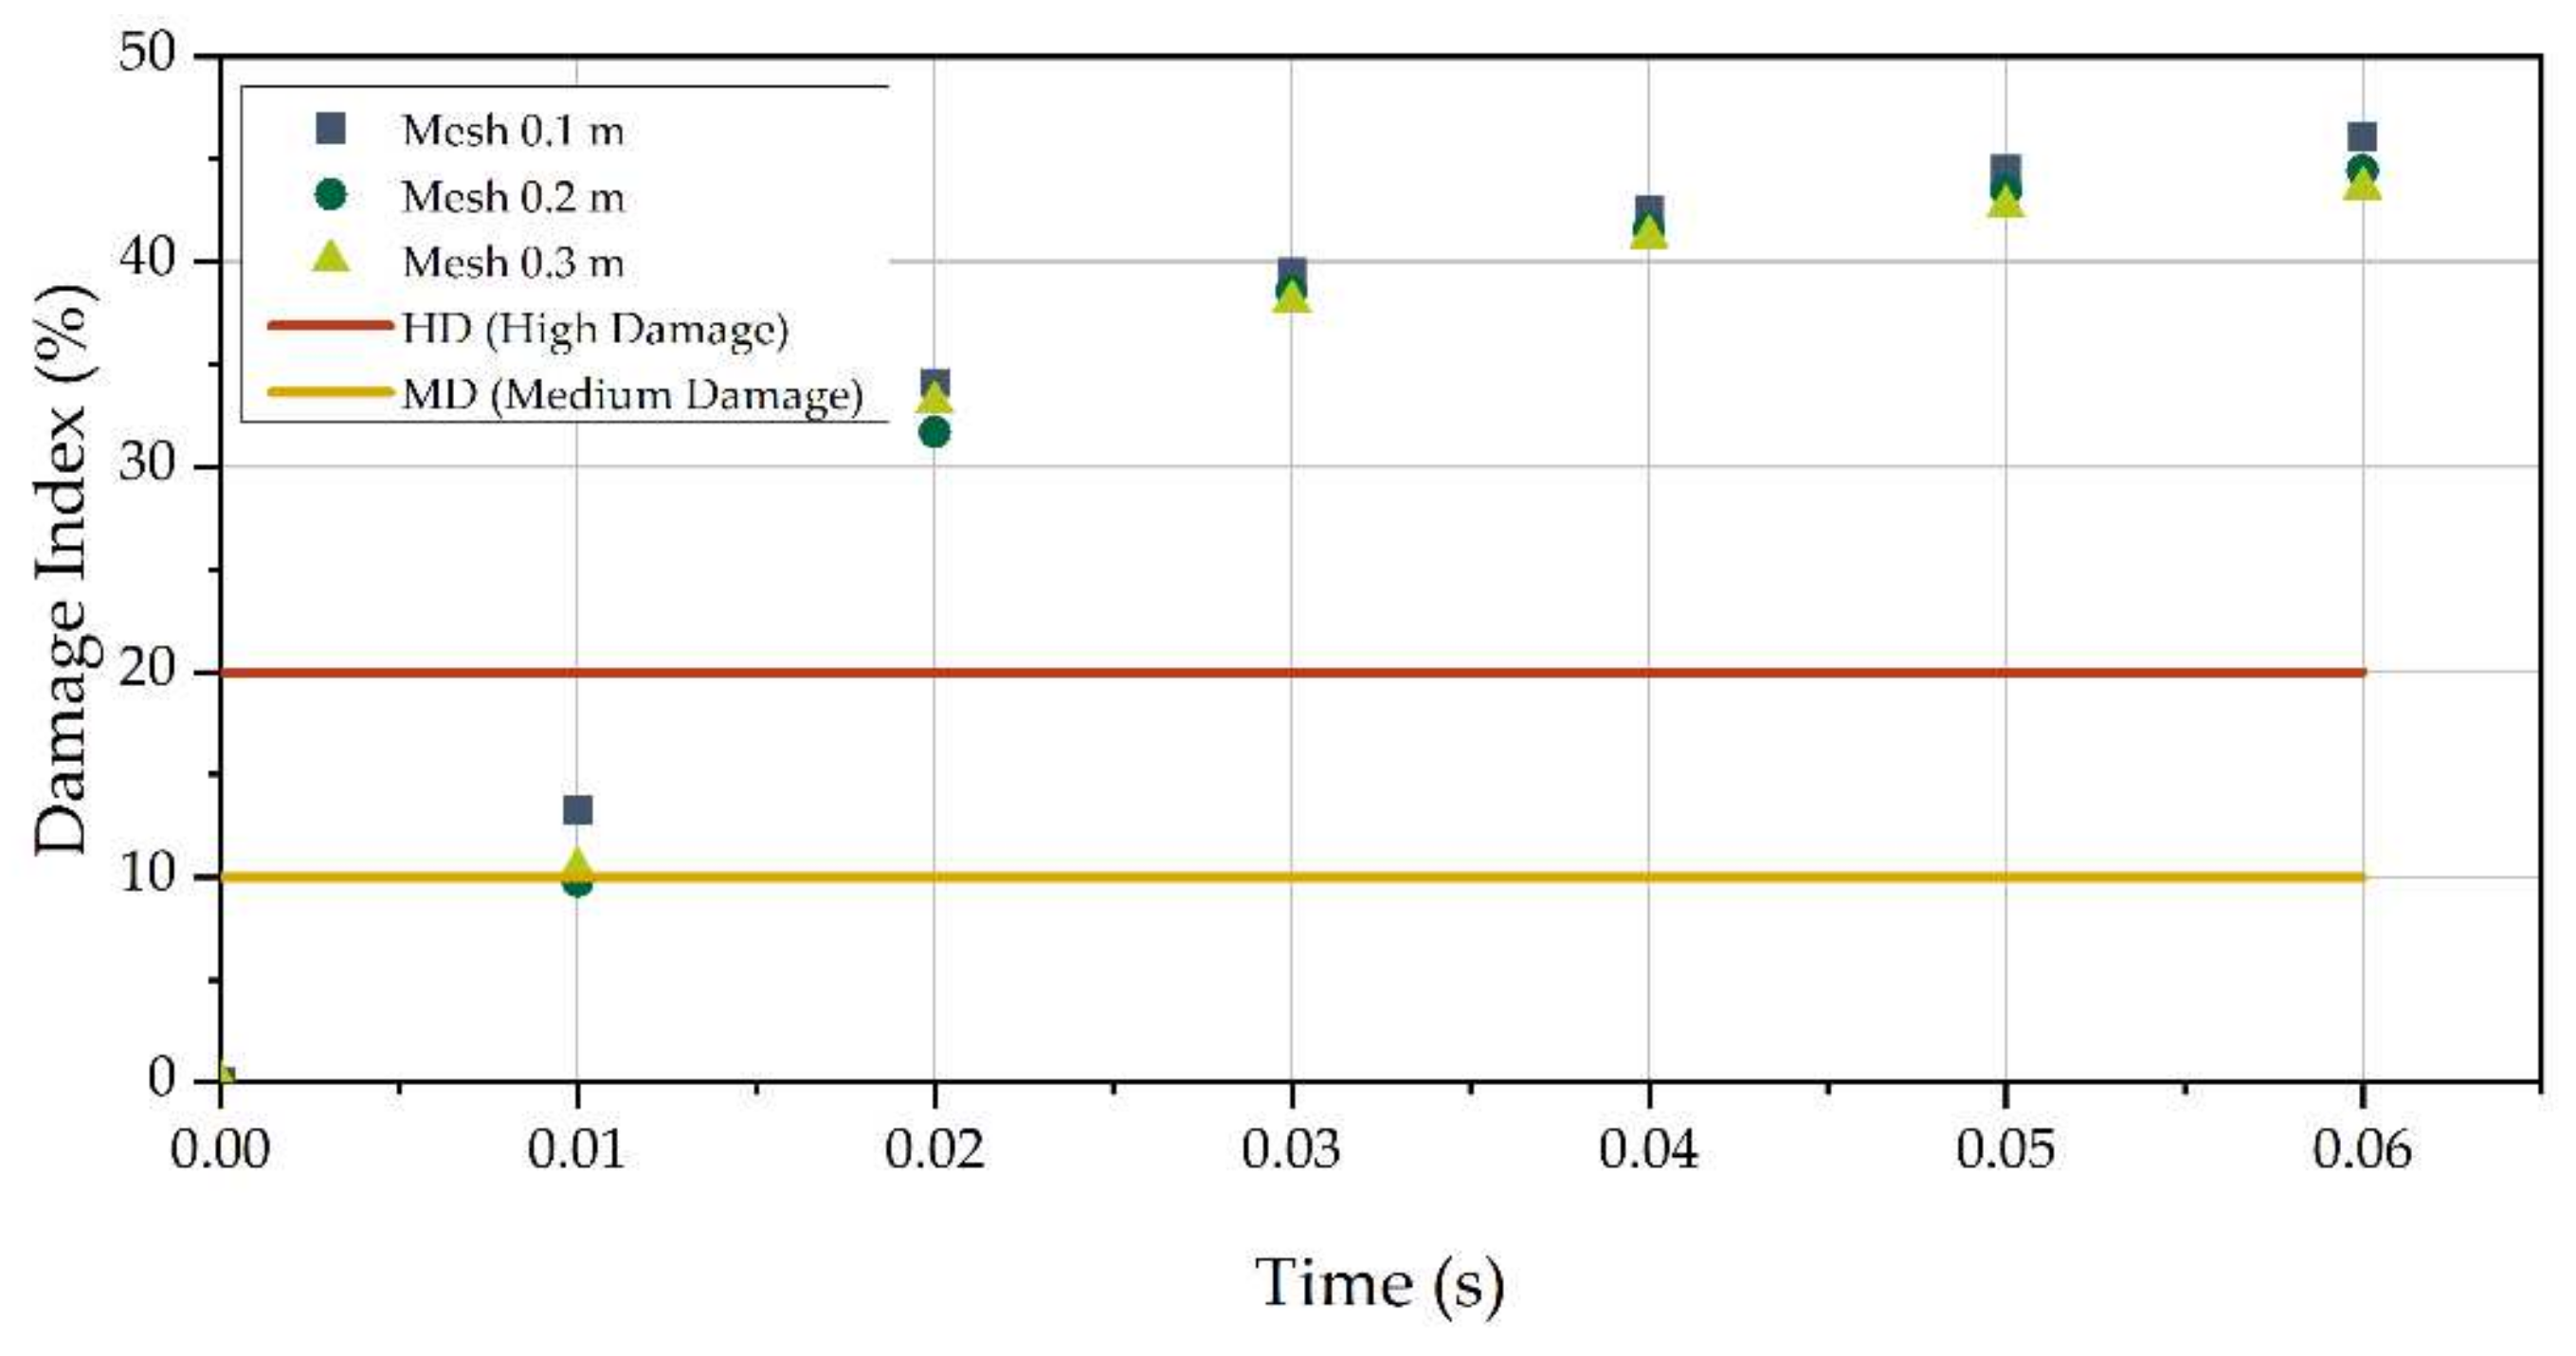
4. Damage Quantification and Comparison
5. Conclusions
Author Contributions
Funding
Data Availability Statement
Acknowledgments
Conflicts of Interest
References
- Vuoto, A. Numerical Safety Assessment of Earthen Structures in La Alhambra, Granada, Spain. Ph.D. Thesis, Universidade do Minho, Guimaraes, Portugal, 2020. [Google Scholar]
- Pereira, J.M.; Lourenço, P.B. Experimental Characterization of Masonry and Masonry Components at High Strain Rates. J. Mater. Civ. Eng. 2017, 29, 04016223. [Google Scholar] [CrossRef] [Green Version]
- Hao, H.; Tarasov, B. Experimental Study of Dynamic Material Properties of Clay Brick and Mortar at Different Strain Rates. Aust. J. Struct. Eng. 2008, 8, 117–132. [Google Scholar] [CrossRef]
- Burnett, S.; Gilbert, M.; Molyneaux, T.; Tyas, A.; Hobbs, B.; Beattie, G. The response of masonry joints to dynamic tensile loading. Mater. Struct. 2007, 40, 517–527. [Google Scholar] [CrossRef]
- Asprone, D.; Cadoni, E.; Prota, A.; Manfredi, G. Dynamic behavior of a Mediterranean natural stone under tensile loading. Int. J. Rock Mech. Min. Sci. 2009, 46, 514–520. [Google Scholar] [CrossRef]
- Baylot, J.T.; Bullock, B.; Slawson, T.R.; Woodson, S.C. Blast Response of Lightly Attached Concrete Masonry Unit Walls. J. Struct. Eng. 2005, 131, 1186–1193. [Google Scholar] [CrossRef]
- Moreland, C.; Hao, H.; Wu, C. Response of retrofitted masonry walls to blast loading. In Proceedings of the 6th Asia-Pacific Conference on Shock and Impact Load Structures; CI-Premier: Singapore, 2005; pp. 405–412. [Google Scholar]
- Ullah, A.; Ahmad, F.; Jang, H.-W.; Kim, S.-W.; Hong, J.-W. Review of analytical and empirical estimations for incident blast pressure. KSCE J. Civ. Eng. 2017, 21, 2211–2225. [Google Scholar] [CrossRef]
- U.S. Army Corps of Engineers, Naval Facilities Engineering Command. Structures to Resist the Effects of Accidental Explosions, Air Force Civil Engineer Support Agency; UFC 3-340-02; U.S. Department of Defense: Washington, DC, USA, 2008. [Google Scholar]
- Wu, C.; Hao, H. Modeling of simultaneous ground shock and airblast pressure on nearby structures from surface explosions. Int. J. Impact Eng. 2005, 31, 699–717. [Google Scholar] [CrossRef]
- Sadovskiy, M.A. Mechanical Effects of Air Shock Waves from Explosions According to Experiments, Selected Works: Geophysics and Physics of Explosion; Nauka Press: Moscow, Russia, 1952. [Google Scholar]
- Newmark, N.M.; Hansen, R.J. Design of blast resistant structures. In Shock and Vibration Handbook; Harris, C.M., Crede, C.E., Eds.; McGraw-Hill: New York, NY, USA, 1961. [Google Scholar]
- Cormie, D.; Mays, G.; Smith, P. Blast Effects on Buildings; Thomas Telford Ltd: London, UK, 2011; Available online: http://app.knovel.com/hotlink/toc/id:kpBEBE0001/blast-effects-on (accessed on 17 January 2021).
- Baker, W.E.; Kulesz, J.J.; Westine, P.S.; Cox, P.A.; Wilbeck, J.S. A Manual for the Prediction of Blast and Fragment Loadings on Structures; DOE/TIC-11268; U.S. Department of Energy: Washington, DC, USA, 1980. [Google Scholar]
- Hoveidae, N.; Fathi, A.; Karimzadeh, S. Seismic damage assessment of a historic masonry building under simulated scenario earthquakes: A case study for Arge-Tabriz. Soil Dyn. Earthq. Eng. 2021, 147, 106732. [Google Scholar] [CrossRef]
- Asteris, P.; Chronopoulos, M.; Chrysostomou, C.; Varum, H.; Plevris, V.; Kyriakides, N.; Silva, V. Seismic vulnerability assessment of historical masonry structural systems. Eng. Struct. 2014, 62–63, 118–134. [Google Scholar] [CrossRef]
- Ngo, T.; Mendis, P.; Gupta, A.; Ramsay, J. Blast Loading and Blast Effects on Structures—An Overview. Electron. J. Struct. Eng. 2007, 7, 76–91. [Google Scholar]
- Masi, F. Fast-Dynamic Response and Failure of Masonry Structures of Non-Standard Geometry Subjected to Blast Loads. Ph.D. Thesis, École Centrale de Nantes, Nantes, France, 2020. [Google Scholar]
- Bangash, M.Y.H.; Bangash, T. Explosion-Resistant Buildings: Design, Analysis and Case Studies; Springer: Berlin, Germany; New York, NY, USA, 2006. [Google Scholar]
- Encyclopedia Britannica. Alhambra. 19 December 2019. Available online: https://www.britannica.com/topic/Alhambra-fortress-Granada-Spain (accessed on 30 March 2021).
- Jaquin, P.A. Analysis of Historic Rammed Earth Construction. Ph.D. Thesis, Durham University, Durham, UK, 2008. Available online: http://etheses.dur.ac.uk/2169/ (accessed on 22 March 2021).
- Reza, A.; Ibrahim, Z.; Vaitekunas, T. Investigation and analysis of an explosion at the goex black powder manufacturing facility. Chem. Eng. Trans. 2013, 31, 475–480. [Google Scholar] [CrossRef]
- Griffiths, F.A. The Artillerist’s Manual and British Soldier’s Compendium; W.H. Allen: London, UK, 1856. [Google Scholar]
- Brode, H.L. Numerical Solutions of Spherical Blast Waves. J. Appl. Phys. 1955, 26, 766–775. [Google Scholar] [CrossRef]
- Pereira, J.M. Security Evaluation and Design of Structures Subjected to Blast Loading. Ph.D. Thesis, Universidade do Minho, Guimaraes, Portugal, 2014. [Google Scholar]
- Masi, F.; Stefanou, I.; Vannucci, P.; Maffi-Berthier, V. Rocking response of inverted pendulum structures under blast loading. Int. J. Mech. Sci. 2019, 157–158, 833–848. [Google Scholar] [CrossRef] [Green Version]
- Rigby, S.E.; Tyas, A.; Bennett, T.; Clarke, S.; Fay, S.D. The Negative Phase of the Blast Load. Int. J. Prot. Struct. 2014, 5, 1–19. [Google Scholar] [CrossRef]
- Remennikov, A.; Rose, T.A. Modelling blast loads on buildings in complex city geometries. Comput. Struct. 2005, 83, 2197–2205. [Google Scholar] [CrossRef] [Green Version]
- Liu, J.; Yan, Q.; Wu, J. Analysis of blast wave propagation inside tunnel. Trans. Tianjin Univ. 2008, 14, 358–362. [Google Scholar] [CrossRef]
- Shi, Y.; Li, Z.-X.; Hao, H. Numerical investigation of blast loads on RC slabs from internal explosion. In International Workshop on Structures Response to Impact and Blast, [CD-ROM]; Israel Institute of Technology: Haifa, Israel, 2009. [Google Scholar]
- Feldgun, V.; Karinski, Y.; Edri, I.; Yankelevsky, D. Prediction of the quasi-static pressure in confined and partially confined explosions and its application to blast response simulation of flexible structures. Int. J. Impact Eng. 2016, 90, 46–60. [Google Scholar] [CrossRef]
- Pereira, J.; Campos, J.; Lourenco, P. Masonry infill walls under blast loading using confined underwater blast wave generators (WBWG). Eng. Struct. 2015, 92, 69–83. [Google Scholar] [CrossRef] [Green Version]
- Pereira, J.; Lourenco, P. Risk Assessment Due to Terrorist Actions on Public Transportation Networks: A Case Study in Portugal. Int. J. Prot. Struct. 2014, 5, 391–415. [Google Scholar] [CrossRef] [Green Version]
- Jablonski, J.; Carlucci, P.; Thyagarajan, R.; Nandi, B.; Arata, J. Simulating Underbelly Blast Events using Abaqus/Explicit—CEL. In Proceedings of the SIMULIA Customer Conference, Providence, RI, USA, 15–17 May 2012. [Google Scholar]
- Zakrisson, B.; Wikman, B.; Häggblad, H.Å. Numerical simulations of blast loads and structural deformation from near-field explosions in air. Int. J. Impact Eng. 2011, 38, 597–612. [Google Scholar] [CrossRef] [Green Version]
- Meyer, C.S. Numerical Simulations of the Mechanical Behaviour of Adobe. In Dynamic Behavior of Materials, Volume 1: Proceedings of the 2012 Annual Conference on Experimental and Applied Mechanics; Springer: New York, NY, USA, 2013. [Google Scholar] [CrossRef]
- Lubliner, J.; Oliver, J.; Oller, S.; Onate, E. A plastic-damage model for concrete. Int. J. Solids Struct. 1989, 25, 299–326. [Google Scholar] [CrossRef]
- Lee, J.; Fenves, G.L. Plastic-Damage Model for Cyclic Loading of Concrete Structures. J. Eng. Mech. 1998, 124, 892–900. [Google Scholar] [CrossRef]
- Altaee, M.; Kadhim, M.; Altayee, S.; Adheem, A. Employment of damage plasticity constitutive model for concrete members subjected to high strain-rate. In Proceedings of the 1st International Multi-Disciplinary Conference Theme: Sustainable Development and Smart Planning, IMDC-SDSP 2020, Cyperspace, 28–30 June 2020. [Google Scholar] [CrossRef]
- Bui, Q.-B.; Bui, T.-T.; Tran, M.-P.; Bui, T.-L.; Le, H.-A. Assessing the Seismic Behavior of Rammed Earth Walls with an L-Form Cross-Section. Sustainability 2019, 11, 1296. [Google Scholar] [CrossRef] [Green Version]
- Mohamad, A.-B.A.E.; Chen, Z. Experimental and Numerical Analysis of the Compressive and Shear Behavior for a New Type of Self-Insulating Concrete Masonry System. Appl. Sci. 2016, 6, 245. [Google Scholar] [CrossRef] [Green Version]
- Lourenço, P.B. Structural masonry analysis: Recent developments and prospects. In Proceedings of the 14th International Brick/Block Masonry Conference, Sydney, Australia, 13–20 February 2008. [Google Scholar]
- Shrestha, K.C.; Aoki, T.; Miyamoto, M.; Wangmo, P. Pema In-Plane Shear Resistance between the Rammed Earth Blocks with Simple Interventions: Experimentation and Finite Element Study. Buildings 2020, 10, 57. [Google Scholar] [CrossRef] [Green Version]
- Lourenco, P.; Ramos, L. Characterization of Cyclic Behavior of Dry Masonry Joints. J. Struct. Eng. 2004, 130, 779–786. [Google Scholar] [CrossRef]
- Lourenco, P.; Oliveira, D.; Roca, P.; Orduña, A. Dry Joint Stone Masonry Walls Subjected to In-Plane Combined Loading. J. Struct. Eng. 2005, 131, 1665–1673. [Google Scholar] [CrossRef] [Green Version]
- Bui, T.-L.; Bui, T.-T.; Bui, Q.-B.; Nguyen, X.-H.; Limam, A. Out-of-plane behavior of rammed earth walls under seismic loading: Finite element simulation. Structures 2020, 24, 191–208. [Google Scholar] [CrossRef]
- Wangmo, M.P.; Shrestha, K.C.; Miyamoto, M.; Aoki, T. Assessment of out-of-plane behavior of rammed earth walls by pull-down tests. Int. J. Arch. Heritage 2019, 13, 273–287. [Google Scholar] [CrossRef]
- El-Nabouch, R.; Bui, Q.-B.; Plé, O.; Perrotin, P. Characterizing the shear parameters of rammed earth material by using a full-scale direct shear box. Constr. Build. Mater. 2018, 171, 414–420. [Google Scholar] [CrossRef]
- ABAQUS. ABAQUS User’s Manual; Version 2019; Dassault Systèmes: Waltham, MA, USA, 2010. [Google Scholar]
- Doherty, K.; Griffith, M.C.; Lam, N.; Wilson, J. Displacement-based seismic analysis for out-of-plane bending of unreinforced masonry walls. Earthq. Eng. Struct. Dyn. 2002, 31, 833–850. [Google Scholar] [CrossRef]
- Zapata, B.J.; Weggel, D.C. Collapse Study of an Unreinforced Masonry Bearing Wall Building Subjected to Internal Blast Loading. J. Perform. Constr. Facil. 2008, 22, 92–100. [Google Scholar] [CrossRef]


| Material Property | DIF | |
|---|---|---|
| Brick Masonry | Rammed Earth and Infill | |
| 1.98 | 2.65 | |
| 1.97 | 1.76 | |
| 1.97 | 1.76 | |
| Material | ||||||||
|---|---|---|---|---|---|---|---|---|
| Rammed Earth | Brick Masonry | Infill | ||||||
| Properties | Level 1 | Other Floors | ||||||
| Original | DIF | Original | DIF | Original | DIF | Original | DIF | |
| (kN/m2) | 5.90 × 10⁶ | 1.57 × 10⁷ | 1.10 × 10⁶ | 2.92 × 10⁶ | 1.60 × 10⁶ | 4.25 × 10⁶ | 0.60 × 10⁶ | 1.59 × 10⁶ |
| (−) | 0.30 | 0.30 | 0.30 | 0.30 | 0.25 | 0.25 | 0.30 | 0.30 |
| (t/m3) | 2.25 | 2.25 | 2.25 | 2.25 | 1.60 | 1.60 | 2.25 | 2.25 |
| (kN/m2) | 2500 | 4390 | 2500 | 4390 | 4000 | 7020 | 2500 | 4390 |
| (kN/m) | 4.00 | 7.02 | 4.00 | 7.02 | 6.40 | 11.24 | 4.00 | 7.02 |
| (kN/m2) | 300 | 527 | 300 | 527 | 200 | 351 | 300 | 527 |
| (kN/m) | 0.017 | 0.026 | 0.017 | 0.026 | 0.013 | 0.019 | 0.017 | 0.026 |
| Friction Coefficient | ||
|---|---|---|
| 0.73 | 1.50 × 10⁸ kN/m3 | 7.50 × 10⁷ kN/m3 |
| Damage Level | Damage Index | ||
|---|---|---|---|
| SD | 1.51% | 76.8 | 5087.7 |
| Volume (m3) | Damaged Volume (D > 0.77) (m3) | Damage Index | Damage Level | |
|---|---|---|---|---|
| Wall Z1-S | 1430.65 | 33.39 | 53.14% | HD |
| Zone 1 Wall Left | 42.57 | 0.52 | 2.29% | SD |
| Zone 1 Wall Right | 12.21 | 6.49 | 0.00% | SD |
| Zone 2 3 Wall Left | 3.02 | 0.07 | 0.00% | SD |
| Zone 2 3 Inner Walls | 3.02 | 0.00 | 1.61% | SD |
| Vaults Zones 1 2 3 | 8.88 | 0.00 | 9.04% | SD |
| Outer Wall near Blast | 27.64 | 0.45 | 7.98% | SD |
| Whole Level 2 | 822.48 | 13.69 | 2.33% | SD |
Publisher’s Note: MDPI stays neutral with regard to jurisdictional claims in published maps and institutional affiliations. |
© 2021 by the authors. Licensee MDPI, Basel, Switzerland. This article is an open access article distributed under the terms and conditions of the Creative Commons Attribution (CC BY) license (https://creativecommons.org/licenses/by/4.0/).
Share and Cite
Tse, D.; Pereira, J.M.; Lourenço, P.B. Numerical Analysis of an Earthen Masonry Structure Subjected to Blast Loading. CivilEng 2021, 2, 969-985. https://doi.org/10.3390/civileng2040052
Tse D, Pereira JM, Lourenço PB. Numerical Analysis of an Earthen Masonry Structure Subjected to Blast Loading. CivilEng. 2021; 2(4):969-985. https://doi.org/10.3390/civileng2040052
Chicago/Turabian StyleTse, Demiana, João M. Pereira, and Paulo B. Lourenço. 2021. "Numerical Analysis of an Earthen Masonry Structure Subjected to Blast Loading" CivilEng 2, no. 4: 969-985. https://doi.org/10.3390/civileng2040052