Review

Urban Heat Island: Causes, Consequences, and Mitigation Measures with Emphasis on Reflective and Permeable Pavements

1
ESITC Paris, 94110 Arcueil, France
2
Laboratoire Recherche ESITC Caen, COMUE Normandie Université, 14610 Epron, France
*
Author to whom correspondence should be addressed.
CivilEng 2021, 2(2), 459-484; https://doi.org/10.3390/civileng2020026
Submission received: 17 May 2021 / Revised: 4 June 2021 / Accepted: 4 June 2021 / Published: 9 June 2021
(This article belongs to the Special Issue Advances in Civil Engineering)

Abstract

:
Economic and social development of urban and rural areas continues in parallel with the increase of the human population, especially in developing countries, which leads to sustained expansion of impervious surface areas, particularly paved surfaces. The conversion of pervious surfaces to impervious surfaces significantly modifies local energy balance in urban areas and contributes to urban heat island (UHI) formation, mainly in densely developed cities. This paper represents a literature review on the causes and consequences of the UHI and potential measures that could be adopted to improve the urban microclimate. The primary focus is to discuss and summarise significant findings on the UHI phenomenon and its consequences, such as the impact on human thermal comfort and health, energy consumption, air pollution, and surface water quality deterioration. Regarding the measures to mitigate UHI, particular emphasis is given to the reflective and permeable pavements.

1. Introduction

Although urbanisation has many benefits, it can be considered a significant driver of environmental problems [1]. The urban areas occupy around 3% of the total Earth’s land [2], with 55% of the world’s population in 2018. This number is expected to increase to 68% by 2050 [3], mainly in developing countries. India, China, and Nigeria are together expected to account for 35% of the projected population growth. Approximately 73% of the European population lives in cities, and by 2050 it will reach 82% [4].
Along with the increase of population, rapid urban growth has resulted in land-use changes and expansion of built-up areas [5,6], which is even faster than urban population growth [7]. Urbanisation affects the microclimate and forms a unique urban climate environment such as the Urban Heat Island (UHI), referring to the phenomenon that urban areas are often several degrees warmer than the surrounding rural areas [8]. The land surface temperatures or near-surface air temperatures over urban regions are higher than those over surrounding rural areas [6] and may contribute to the extra warming in addition to the warming already caused by climate change [8]. Oke [9] proposed four significant control factors of urban climate such as urban structure (e.g., dimensions of the buildings and the spaces between them, street widths and street spacing), urban cover (e.g., fractions of built-up, paved, vegetated, bare soil, water), urban fabric (e.g., construction and natural materials), and urban metabolism (e.g., heat, water, and pollutants due to human activity). All these factors can be modified by urban expansion [6].
Urban expansion may significantly affect the surface energy balance, resulting in increased sensible heat flux and decreased latent heat flux [10,11]. The development of urban areas causes landscape changes due to the replacement of pervious and semi-pervious surfaces with impervious surfaces [12]. These modifications directly impact watershed hydrology (e.g., decreasing infiltration capacity, increasing surface runoff, shorter time of concentration, decreasing recharge of groundwater, decreasing the rate of evapotranspiration) [13], and impact the natural path of energy through the atmospheric, land, and water systems [14]. As the surface runoff drains quickly, less water is available for evapotranspiration, affecting the urban surface energy balance [15]. An increase in impervious surfaces, such as asphalt and concrete pavements, results in increased land surface temperature [12,13,14,15,16] due to the modification of local energy balance through the changes of materials thermal properties (e.g., albedo, specific heat capacity, thermal conductivity) [17]. The results of a 20-year study conducted by Xu et al. [18] revealed a significant positive exponential relationship between impervious surface and land surface temperature. They stated that an increase of imperviousness by 10%, where the impervious surface already occupies more than 70%, could increase the land surface temperature by more than 3.3 °C.
Globally, it has been predicted that by 2050 urban land expansion will be increased between 78–171%. Such changes will increase the average summer daytime and night-time air temperature of 0.5 °C–0.7 °C, up to nearly 3 °C. Besides, more than two-thirds of the urban expansion will occur in Asia (46–49%) and Africa (16–25%) [8]. According to Perpiña et al. [5], by 2030, built-up areas in EU countries will proportionally expand. The largest absolute increase is expected in Italy, followed by Germany and Poland.
Seoul metropolitan area, Korea, is a unique example of the impact of urbanisation on local climate trends. The observation data over the 56 years (1962–2017) have shown that the air temperature has increased by about 1.7 °C and that urbanisation contributes to 43% of the urban warming trend [19]. Another example is the city of Nanjing, China. The urban expansion between 2000 and 2012 increased from 15.4% to 39.2%, followed by increased UHI intensity [6]. The research conducted by Imran et al. [10] indicated that urbanisation has a significant impact on urban meteorology during heatwave events in Melbourne, Australia. Simulation results showed that urban expansion could increase urban air temperature and the surface temperatures by 0.75–2.80 °C and by 1.9–5.4 °C, respectively [10].
Increased air temperatures harm the environment and the quality of life in urban areas. Elevated air temperatures lead to increased demand for air conditioning and, therefore, increased electricity generation by the power plant, which further intensifies air pollution problems and greenhouse gas (GHG) emissions [20]. Elevated air temperatures directly affect human health by creating heat waves and heat stress and raising acute and chronic exposure to air pollutants [21]. Impervious surfaces can transfer heat to the surface runoff and cause thermal pollution of recipient water bodies [22,23]. Climate change, urban population growth, and urban land expansion will probably increase temperatures in urban areas and make the UHI effect more prominent. Due to the rapid urbanisation, an increase of impervious surfaces is expected, particularly paved surfaces where radiative, thermal, and hydraulic properties differ significantly from bare rock, soil, and vegetation. Therefore, using appropriate measures to ameliorate urban microclimate becomes increasingly important.
This paper presents a literature review on the causes and consequences of the UHI and potential measures that could be adopted to ameliorate urban microclimate. It discusses the major findings on the UHI phenomenon, its causes and consequences, such as the impact on human thermal comfort and health, energy consumption, air pollution, and surface water quality deterioration. Regarding the measures to mitigate UHI, particular emphasis is given to the reflective and permeable pavements.

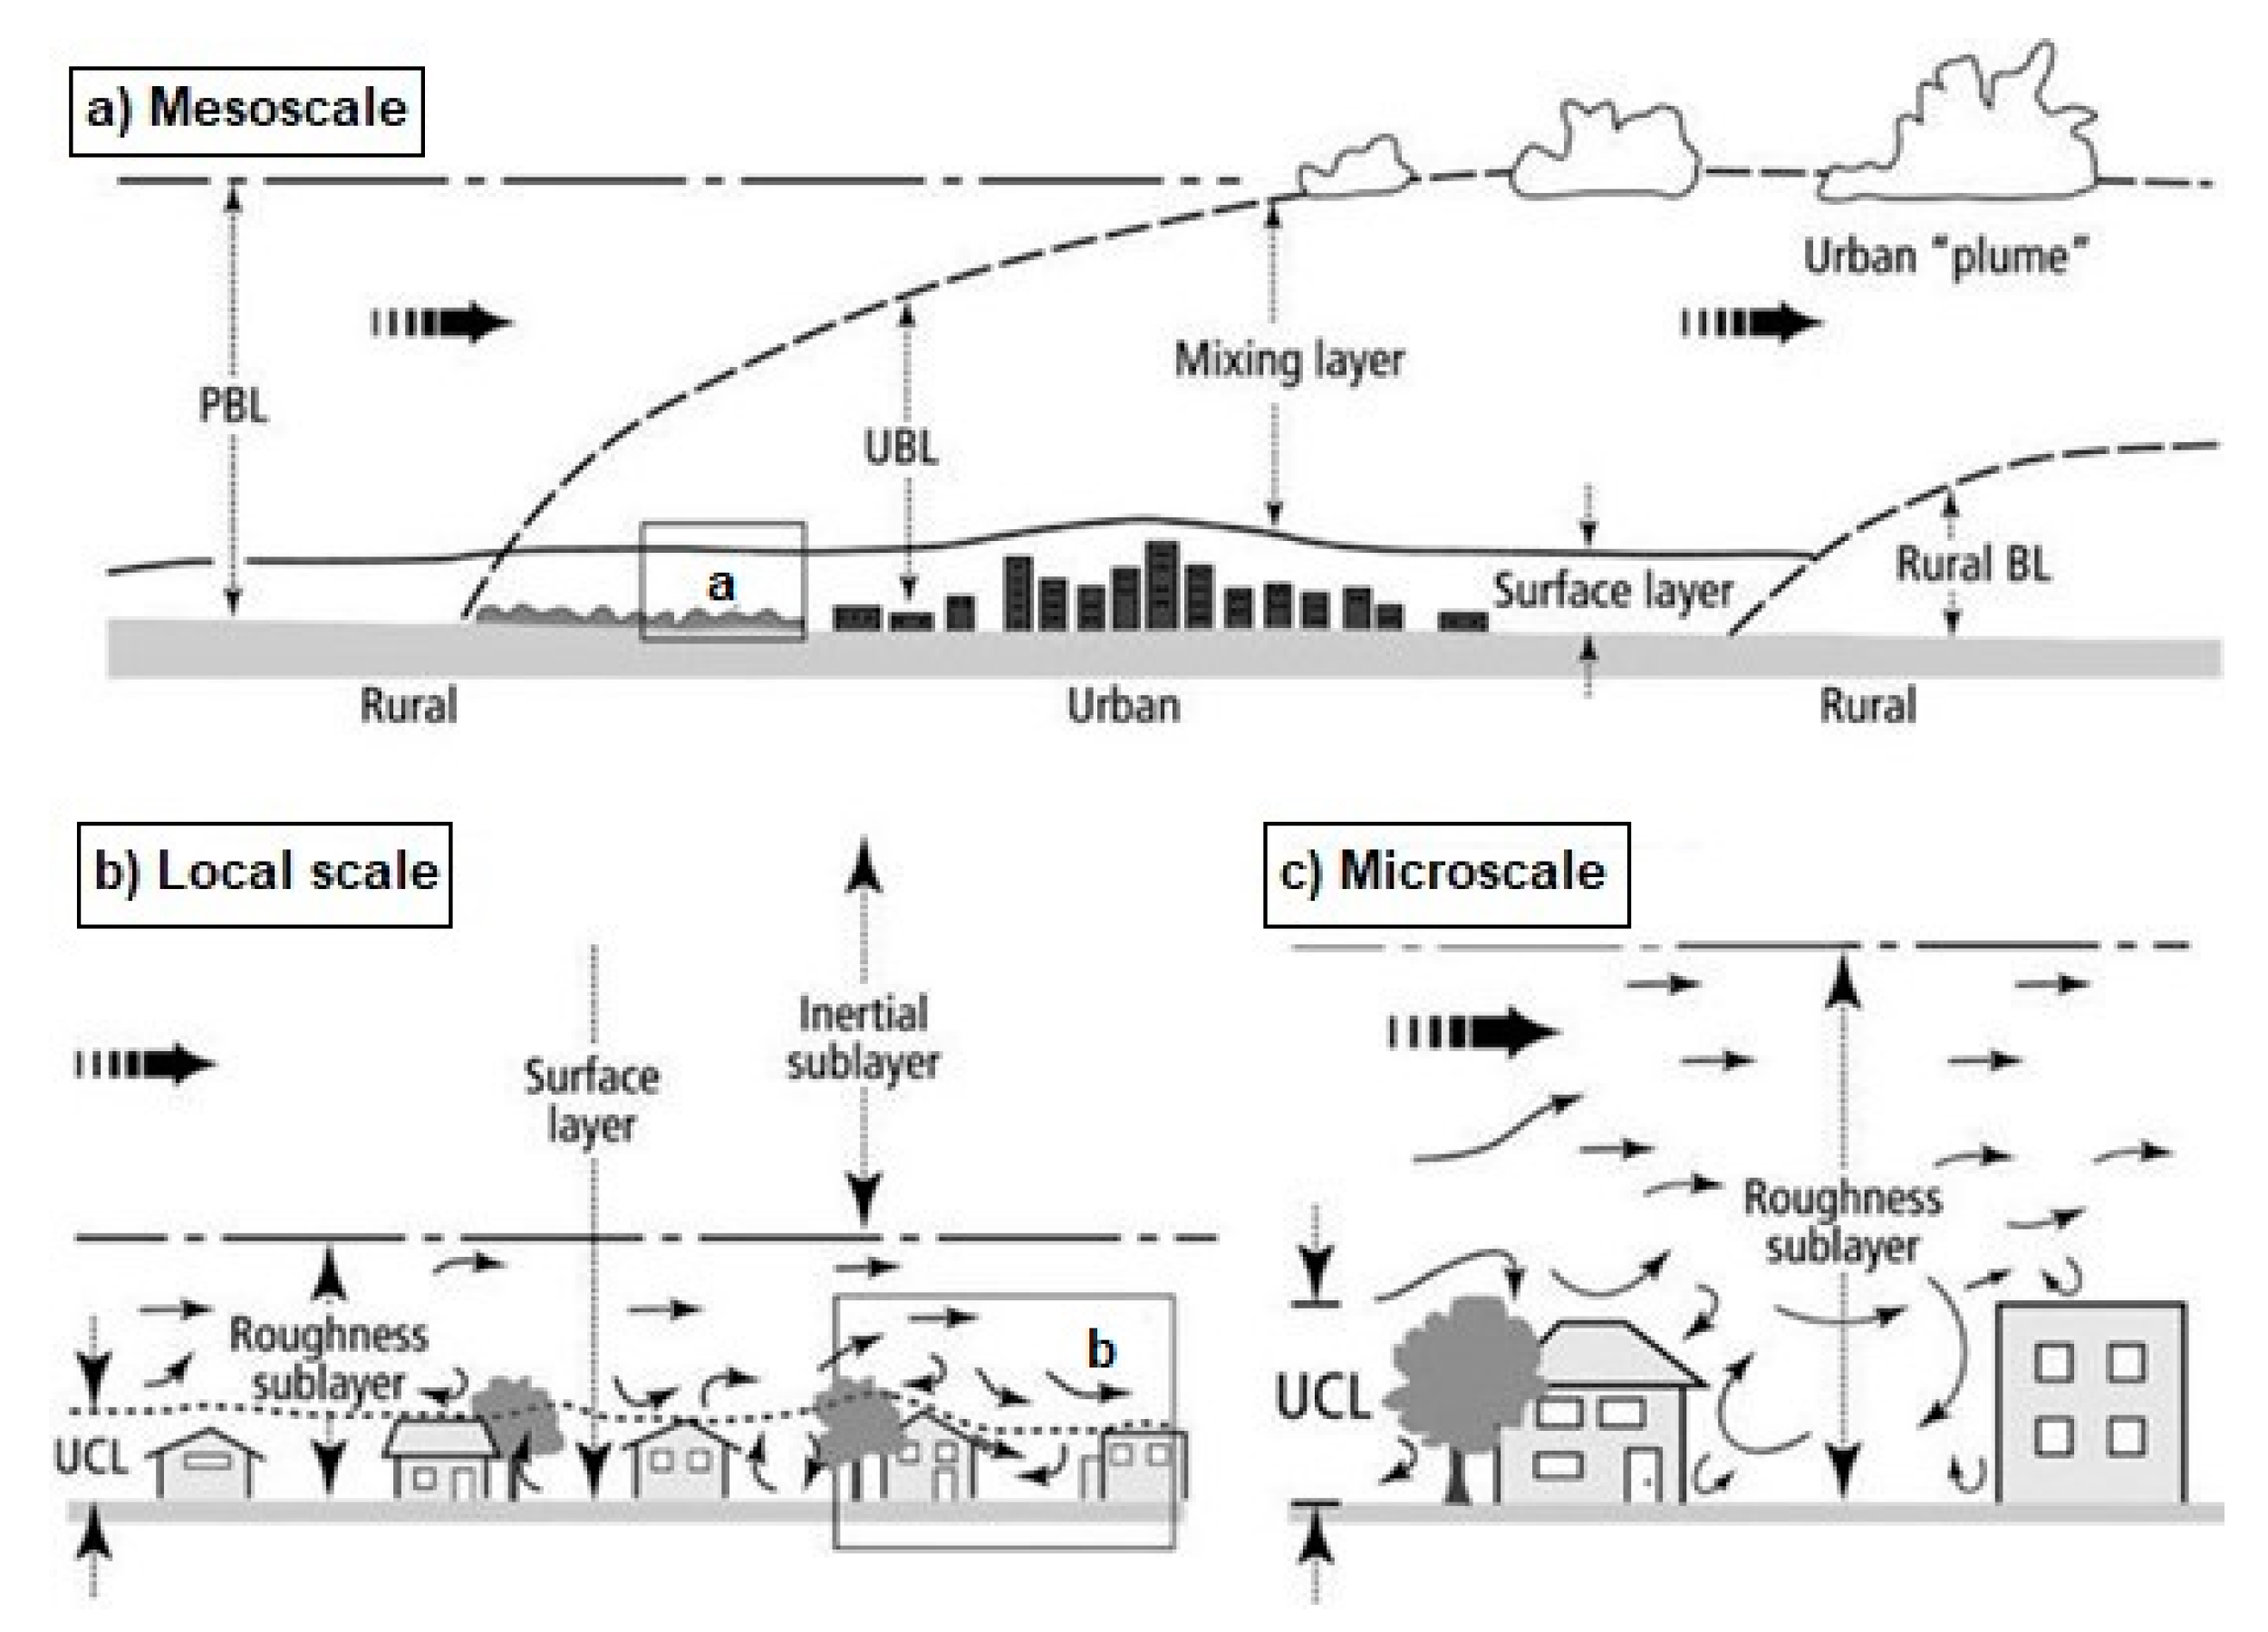
2. Urban Heat Island Phenomenon

Higher heat storage of urban surfaces compared to the rural areas contributes to UHI formation [2], where the air temperature can be higher from about 1 °C to over 10 °C than nearby rural areas [17,24,25]. The UHI is one of the most striking alterations of the atmosphere attributed to urbanisation that is identified nearly 200 years ago by Luke Howard and represents one of the most investigated climate effects in cities around the world [2,25,26]. The urban–rural temperature difference is usually higher at night than during the day and is most evident when winds are weak [27]. The form and size of UHI vary in time and space and depends on meteorological features (e.g., cloud cover, wind speed, and humidity) and regional and urban structure characteristics (e.g., ventilation, surface waterproofing, thermal properties of the fabric, surface geometry) [28,29]. The development of UHI and the city’s thermal regime depends on solar radiation interaction with the urban atmosphere. Due to the complexity of the urban system, several levels of interaction may contribute to UHI formation. The first interaction occurs in the urban surface layer, where urban materials interact directly with the incoming radiation. At this level, the optical and thermal properties of the surface are dominant. The second level of interaction occurs in the complex airflow above the built environment. At this level, the physical processes are guided by surface properties and by local aerodynamics generated by canopy characteristics. The last is the interaction between the main physical flows and the whole city [30].
There are two broad types of UHI, namely Surface Urban Heat Island (SUHI) and Atmospheric Urban Heat Island (AUHI). The differences within these types have to do with how they are formed, their impacts, and techniques used for identification and quantification [31]. An increase in urban surface temperatures creates the SUHI that is present all day and night and is most intense during the summer. During the day, temperatures vary from 10 °C to 15 °C, while during the night-time, it may vary from 5 °C to 10 °C [32]. Regarding AUHI, two different layers can be distinguished, such as the urban canopy layer (UCL) and the urban boundary layer (UBL). Former is a near-surface air layer that extends from the ground to the mean buildings high, above which is a second layer formed due to emitted heat from the urban surface. Under the influence of air turbulence, the second layer shapes an urban heat “dome” of warm air over the urban area [33,34]. An urban heat “dome” progresses vertically and then is transferred to the region beyond as a “plume” of unstable air [35]. The UCL is present mainly in areas of high building density. In less developed suburban areas, it may be discontinuous or absent [36]. The UCL is particularly significant as it refers to the air temperature difference 2 m above the ground where most outdoor activities occur [17]. AUHI is typical and more intense during the night when temperatures can vary from −1 °C to 3 °C, while during the day, it is small or does not exist [37]. Air temperatures can be calculated from weather station networks, while urban surface temperature calculation can be made using thermal infrared remote sensing techniques [32].
Atmospheric processes in an urban area is studied within the defined climatic scales and vertical layers (Figure 1). On the horizontal scale, we can distinguish microscale or street canyon scale, local scale or neighborhood scale, mesoscale or city-scale [31,38]. Due to the air turbulence, an increase in spatial scale decreases the temperature difference between UCL and UBL layers [34].
The temperature difference between representative urban and rural weather stations defines UHI intensity [29]. The UHI intensity varies within the city, where the maximum value usually occurs in the city centre [40]. Ziter et al. [41] demonstrated that the variation in daytime air temperature within Madison, United States, was comparable in magnitude to the temperature difference between the city centre and the surrounding rural landscape. Besides, the temperature variation in the city was most significant during high-heat events. The impact of the UHI may extend beyond the local urbanized area. For example, the study conducted by Cosgrove and Berkelhammer [42] showed that heat in the Chicago urban atmosphere could be transferred overland for up to nearly 70 km and up to about 40 km over Lake Michigan.

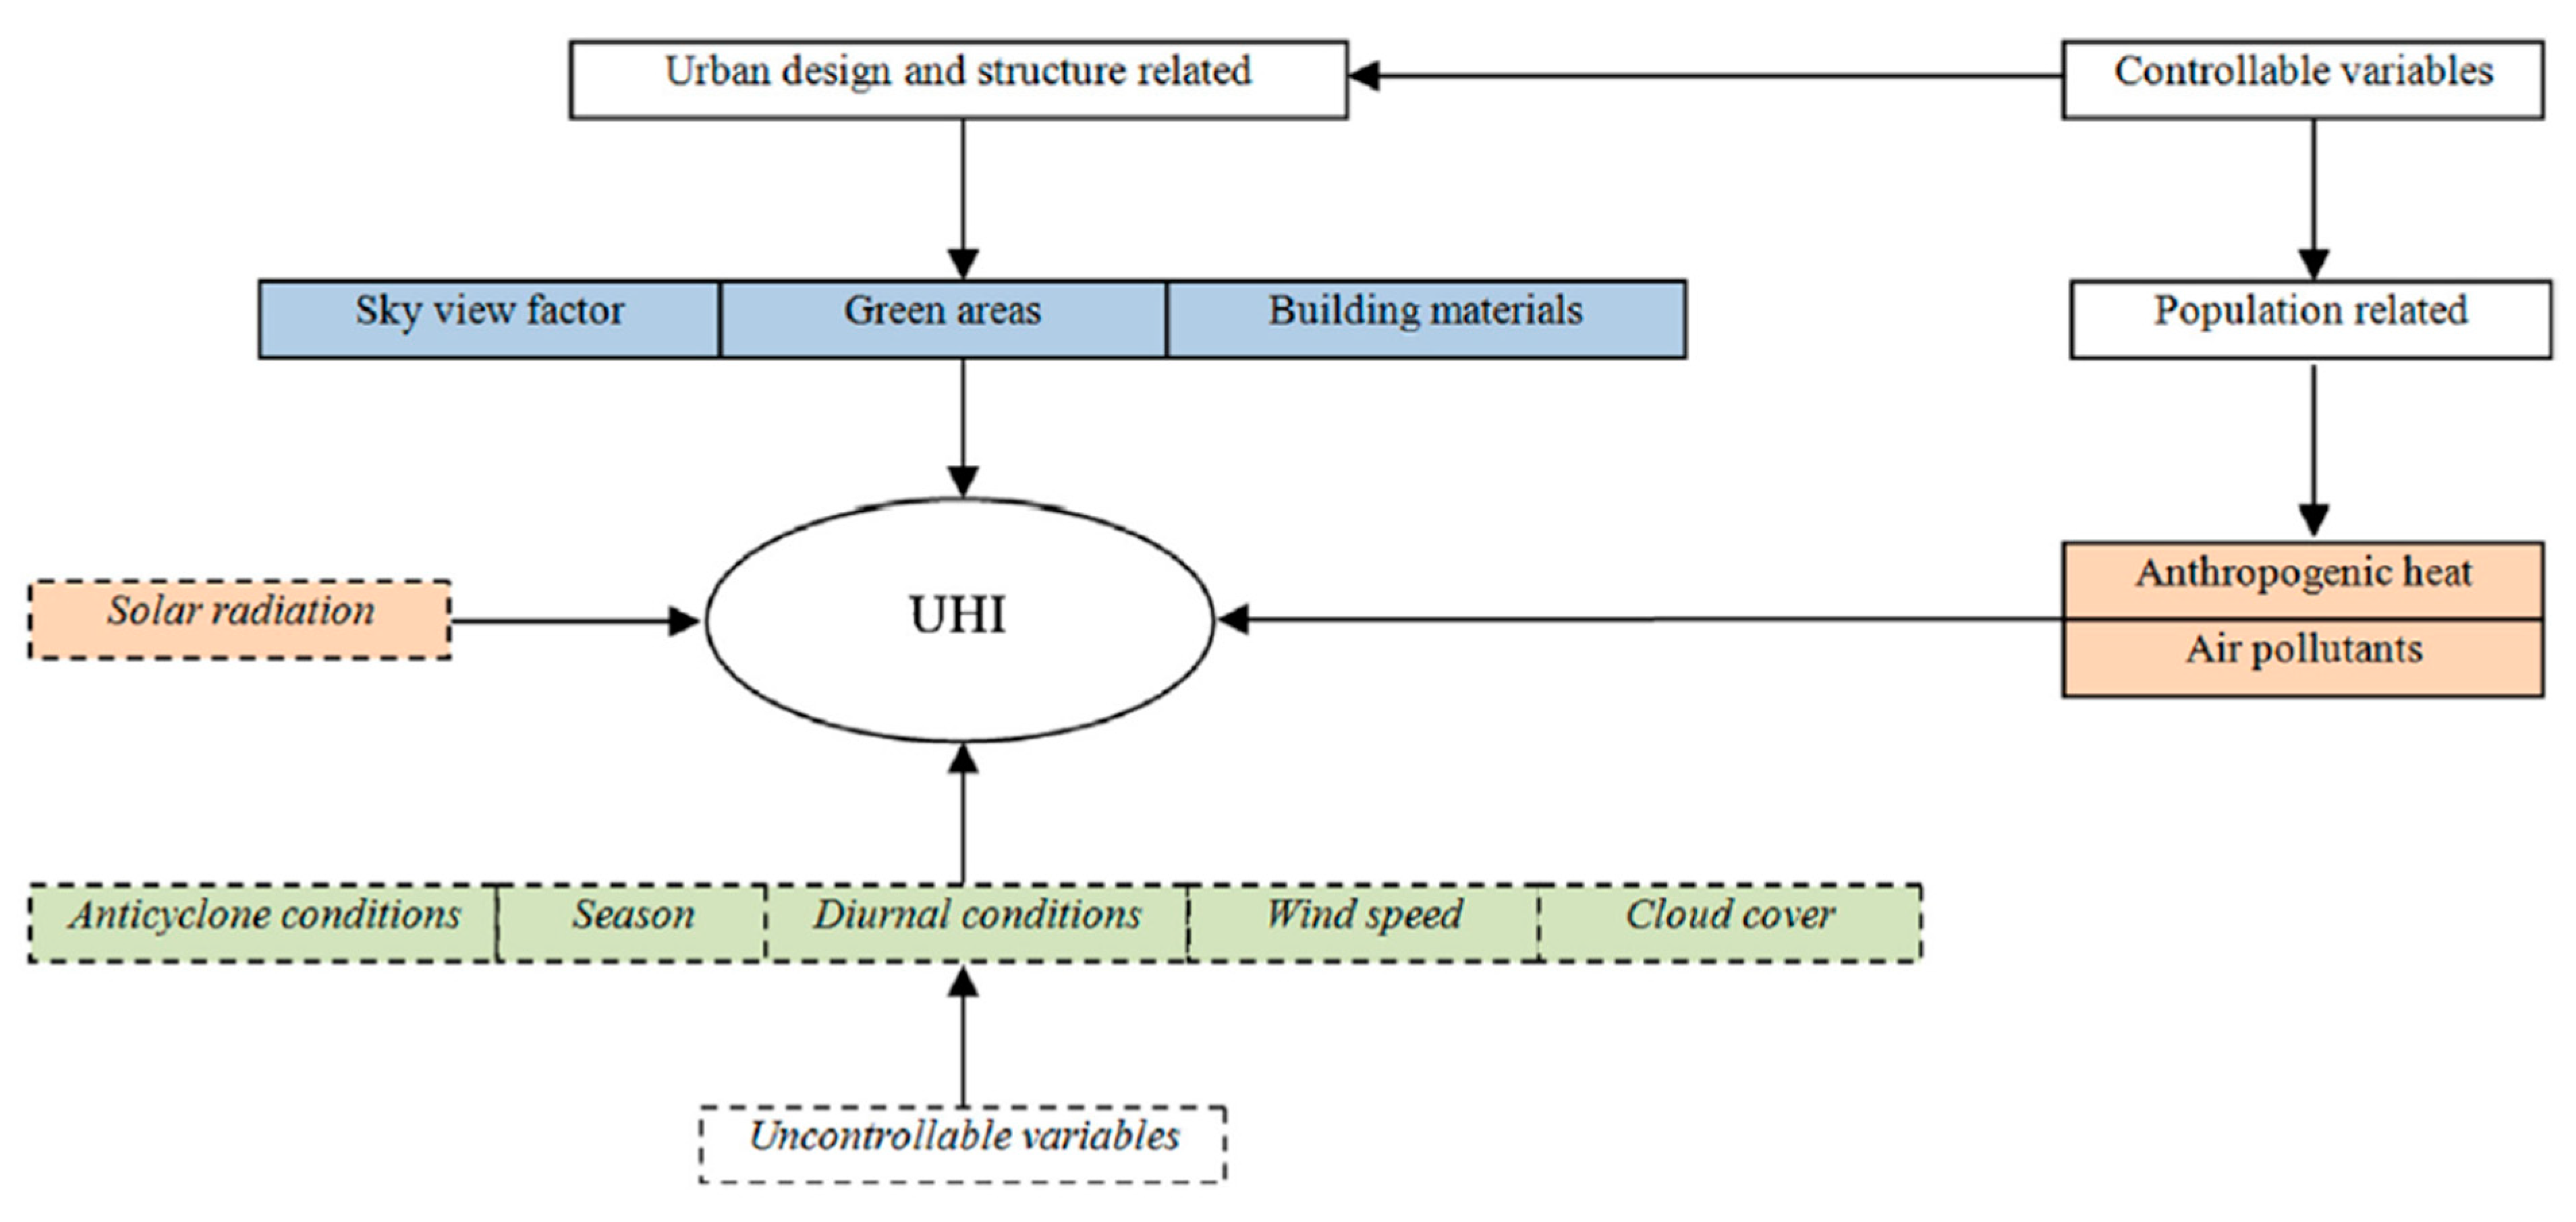
3. Contribution Factors to Urban Heat Island Formation

According to Oke [35] the potential causes of UHI are listed in Table 1. The contributing factors to UHI formation can be summarized as follows: the increase in impervious surfaces, modification of urban geometry, low albedo of urban materials, the increase of population and release of anthropogenic heat and the absence of vegetation [24,28,35,43,44,45,46,47].
Based on the review of 75 studies, Deliami et al. [48] determined the most common contributing factors of UHI such as vegetation cover (44%), season (33%), built-up area (28%), day/night (25%), and population density (14%). These factors could be classified as controllable and uncontrollable (Figure 2), which further are divided as temporary effect variables (e.g., wind speed, cloud cover), permanent effect variables (e.g., green areas, building material, sky view factor) and cyclic effect variables (e.g., solar radiations, anthropogenic heat sources) [49,50].
Urban geometry and density are the factors that influence urban microclimate due to the trapping of incoming solar and outgoing long-wave radiation, reducing turbulent transport due to wind shelter and releasing of anthropogenic heat. Further, increases in urban density are usually associated with changing surface properties due to decreasing green space and increasing build-up areas [29]. The urban environment comprises various construction materials in which radiative, thermal, and hydraulic properties differ significantly from bare rock, soil, and vegetation [51]. The differences in temperatures across the urban areas depend on the land cover types [52]. Temperatures of dark, dry impervious surfaces in direct sunlight can reach up to 88 °C during the day, while vegetated surfaces with moist soil under the same conditions might reach only 18 °C [44]. Unlike smooth rural areas, in urban areas, the airflow is reduced due to the rough surfaces.
Paved surfaces cover a significant percentage of urban areas and play an important role in UHI formation [15,53,54]. In Chicago, Illinois, paved surfaces (roads, parking areas, and sidewalks) cover 50–60% of commercial areas and about 27% of residential areas [25]. Similarly, in Sacramento, paved surfaces cover between 44–68% of commercial areas and 28% of residential areas [55].
The thermal behavior of urban materials depends on the thermal physical properties related to energy transport through a system (e.g., radiation, conduction, convection) and properties related to the thermodynamic or equilibrium state of a system (e.g., density, specific heat capacity) [56]. Table 2 shows the thermal properties of some materials used in building and urban construction. The thermal balance of pavement structure depends on the amount of absorbed and stored solar radiation, released infrared radiation, heat transferred by convection to the air, the heat stored in the mass of material, and heat conducted to the ground [57]. Figure 3 illustrates the pavement surface energy balance.
The ability of materials to capture heat depends on thermal inertia in addition to other thermal properties. Thermal inertia is related to the ability or material to resist a variation in heat flow or temperature and is defined as the speed at which a material cools or heats up. Thus, inert material is a material that takes a long time to reach a new equilibrium temperature when subjected to a thermal perturbation [58,59].
Urban construction materials have a higher heat capacity and can store more heat than natural materials, such as trees, dry soil, and sand. Urban pavements with low thermal conductivity can heat up at the surface but will not transfer heat into the other pavement layers as fast as the pavement with higher conductivity. The thermal conductivity of pavement depends on the type of mixture, aggregates used, percentage of each component in the mixture, and its compaction level. Regarding aggregate base materials or subgrade materials, the thermal conductivity depends on factors such as type of material, mineral content, moisture content, particle size, and overall density. Besides, the thermal behavior of pervious material depends on its porosity which influences surface energy fluxes [27,60].
The porosity of permeable pavements typically ranges between 10% and 30%, while the saturated liquid permeability ranges between 5 × 10⁻⁵ and 4 × 10⁻³ s. The conventional dense pavement has porosity lower than 10%, and the liquid permeability is several orders of magnitude smaller [62]. Both higher porosity and higher permeability of the pavements enhance the evaporation rate and promote the evaporative cooling effect [63,64,65].
The transport of energy through the pavements related to radiation depends on albedo and emissivity. A part of solar radiation that reaches the pavement surface will be absorbed by the surface resulting in increased pavement thermal energy. The absorption rate per unit surface area ranges from zero to one, where zero indicates no energy absorption by the surface [60]. An indicator of the energy reflected by the surface called albedo is measured on a scale from zero to one, where zero indicates that the surface absorbs all solar radiation and one that total solar radiation is reflected [64]. The albedo tends to change over time due to the ageing of the material, weathering, and dirt accumulation [65]. A part of the absorbed energy is stored within the pavement and emitted continuously into the atmosphere. The energy emitted per unit surface area is called emissive power. Emissivity refers to the ratio of energy radiated by the surface compared to the radiation emitted by a black body at the same temperature and determines the contribution of material to the UHI [60,64,65]. Table 3 shows typical values of albedo and emissivity for a variety of urban surfaces.
Compared to conventional concrete pavements, pervious concrete pavements have lower reflectivity, heat volumetric capacity, thermal conductivity, and absorb additional heat. The reflectivity of pervious concrete determines the reflectivity of aggregates, binders, and voids [12,67]. The higher porosity pavements have a larger surface temperature than lower porosity pavements as they have higher thermal diffusivity, which decreases by porosity increase [62]. Void structure and the rougher surface of pervious pavement can reduce the surface’s net solar reflectance, thermal conductivity, and heat capacity, resulting in higher surface temperature than conventional pavement [64]. Gui et al. [68] analysed near-surface temperatures of pavement material with different thermophysical properties. The results showed that both albedo and emissivity have the highest positive effects on pavement maximum and minimum temperatures, respectively. At the same time, the increases in thermal conductivity, diffusivity, and volumetric heat capacity decreased the maximum but not the minimum pavement near-surface temperature.

4. Consequences of the Urban Heat Island

One of the most important factors influencing the quality of life in urban areas is the urban microclimate [69]. The elevated temperatures in urban areas impact urban environmental quality and human well-being [70]. The consequences of the UHI are various such as degradation of the living environment, increased cooling energy usage and associated costs, intensification of air quality problems (e.g., the formation of large amounts of smog and air pollutants), impact on human health, comfort, and increased thermal stress and water quality deterioration [70,71].

4.1. Human Comfort and Health

Globally, heat extremes have adverse effects on human health and well-being, cause human discomfort and heat stress [72,73], and increase the risk of heat-related mortality [21,74,75]. According to Goggins et al. [76], in areas with high UHI intensity, a 1 °C rise above 29 °C can increase mortality by 4.1%. Murage et al. [77] found that heat exposure during the night contributes to heat-related mortality, and the impact is most prominent when hot nights follow hot days. Human thermal comfort refers to a condition in which the human body expresses satisfaction with the thermal environment and depends on the combined effect of air temperature, wind speed, air humidity, and radiation [72]. Outdoor thermal comfort is predominantly associated with the UHI phenomenon [78]. In summer, urban areas show a larger number of discomfort hours than the rural reference area. Thermal comfort during the daytime is mainly related to differences in wind velocity, while during the night-time, urban characteristics have a dominant role [79,80,81,82,83]. High temperatures in urban areas increase residents’ vulnerability to heat waves and climate warming [41]. The health effects of UHI can be direct (e.g., increased mortality and morbidity rate in population, lower life satisfaction) and indirect, such as cardiopulmonary disease, ischemic heart disease, cerebrovascular disease, respiratory disease, heat stress, sleep deprivation, and less activity during the hot period [21]. The UHI effect may increase the risk of illness and death for vulnerable urban populations [80]. Most heat-related mortalities were typical for developing countries with a high urbanisation level [81].
Extreme events such as heat waves significantly impact human life and are among the most harmful climate extremes to human society [82]. Climate change will impact heatwaves and make them more frequent, long-lasting, and more intense [19]. Further, the UHI effect may potentially increase the magnitude and duration of heat waves [27]. Zhao et al. [82] indicated that cities in temperate climate region show significant synergistic effects between UHI and heatwaves during the daytime. The simultaneous occurrence of the UHI effect and heatwave exacerbates thermal stress [82,83], particularly under anticyclonic conditions with low or negligible wind speeds, and can cause high mortality of highly vulnerable population groups [33]. In August 2003, during the heatwave in Europe 35,000 people died, of which in France 14,802, Germany 7000, Spain 4230, Italy 4175, UK 2045, Netherlands 1400, Portugal 1316, and Belgium 150 [84]. Anderson and Bell [74] analyzed mortality risk for heat waves in 43 U.S. cities during 1987–2005 and found that mortality increased 3.74% during heat waves compared with non-heat wave days. Heaviside et al. [75] studied the impact of UHI on heat-related mortality during the heatwave of 2003 in the West Midlands, England. They estimated that the contribution of UHI to total heat-related mortality was nearly 50%. As the frequency of heatwaves is expected to increase in the future, extreme events such as heatwaves in Europe from 2003 could occur every two years by 2040 [75].

4.2. Energy Consumption

One of the most critical factors that increases energy use in urban areas is the formation of UHI [28]. Higher air temperature can double energy consumption due to the increased use of cooling systems in commercial and residential buildings [14,57]. The elevated air temperatures can increase the maximum energy consumption for air conditioning by 5 to 10% [85]. According to Akbari et al. [25], each 1 °C rise in daily maximum temperature beyond a threshold of 15 °C to 20 °C may increase maximum energy consumption by 2% to 4%, respectively. Decreasing outdoor temperature by 1 °C during peak time, cooling energy consumption could be decreased by 6% [86]. The monthly cooling load in the dense urban area can be approximately 120% higher, while the heating load can be around 38% lower than in suburban reference areas [87]. Based on the analysis of a significant number of studies during the period 1970–2010, Santamouris [88] showed that the average increase of the cooling demand of representative buildings was close to 23%, while the corresponding average reduction of the heating load was around 19%. In the Athene, Greece, where UHI intensity was higher than 10 °C, the cooling demand of urban buildings doubled, and the peak electricity load for cooling tripled [87,89]. Arifwidodo et al. [21] investigated the effects of UHI on household energy consumption in Bangkok, Thailand, and Bandung, Indonesia. Their findings indicated that urban areas with a higher magnitude of UHI have higher energy consumption than suburban areas. Roxon et al. [86] studied the impact of outdoor air temperatures on energy consumption in the residential buildings of 48 US states for 12 years. They found that the UHI effect on the environment can be negative or positive depending on the region’s climate and the types of fuels used for heating and cooling. Their results showed a significant correlation between cooling energy consumption and air temperature for areas situated in warm climates. Contrarily, for the areas located in cold climates, the UHI formation can significantly reduce the energy demand for heating of buildings and subsequently reduce carbon footprint [86].

4.3. Air Pollution and Greenhouse Gas Emission

Elevated air temperatures increase electricity generation by power plants, leading to a higher level of air pollution and greenhouse gas (GHG) emissions [37]. Such conditions increase the rate of ground-level ozone formation, one of the major components of photochemical smog that is harmful to the environment. Photochemical smog is produced in photochemical reaction when primary air pollutants (e.g., carbon monoxide (CO), carbon dioxide (CO2) sulfur dioxide (SO2), nitrogen oxides (NOx), suspended particulate matter, and volatile organic compounds (VOCs) react with secondary air pollutants such as NO2 and ozone (O3) [14,20,84]. According to Akbari [85], smog incidence in Los Angeles increases by 5% for every 1.8 °F rise in air temperature when temperatures are higher than 72 °F.
Between 1950 and 2011, approximately 40% of CO2 emissions have persisted in the atmosphere [89]. Average summer temperatures are expected to increase by 2.5 °C to 3 °C by the 2050s, as well as a high CO2 emission. Additionally, an increase in the number of days per year is expected, with temperatures higher than 30 °C [24]. Kolokotroni et al. [90] conducted a computational study on the energy consumption and related CO2 emissions for heating and cooling of an office building within the UHI of London. The results showed that heating load decrease while cooling load and overheating hours increase as the office location moves from rural to urban areas. As overheating will increase in the future, such conditions might lead to a five-fold increase in CO2 emission for city-centre offices in London in 2050.

4.4. Surface Water Quality Deterioration

The temperatures of urban surfaces such as pavement and rooftop during the warm summer period can reach 27 °C to 50 °C higher than air temperatures [91]. High temperatures of urban surfaces can increase stormwater runoff temperatures and cause thermal pollution of receiving water bodies [22,23]. The amount of heat transferred to the stormwater runoff depends on watershed characteristics (e.g., land use, land cover), characteristics of the rainfall event, and weather conditions before the storm event [91,92,93]. The maximum increase in urban steam water temperatures is related to increased impervious surfaces of the urbanized catchment [22]. The impact of stormwater pollution on the stream can be more adverse when the total impervious area exceeds approximately 10% [91], when atmospheric air and dew point temperatures are higher than stream temperature, and when rainfall events are short with full or partial sunny periods before storm event [92]. According to Xie et James [23], impervious surfaces and meteorological conditions are among the factors that have the most significant influence on urban stream temperatures. Generally, the average urban stream temperature increases linearly with increasing watershed imperviousness. The increase of impervious surface by 1% will increase the average urban stream water temperature by 0.08 °C.
James and Verspagen [93] studied thermal enrichment of surface runoff from impervious asphalt and porous concrete block pavement. The observed surface temperature of the asphalt pavement and permeable pavement was 36.9 °C and 40 °C, respectively. The results showed that the surface runoff temperature from the permeable paving was between 2 °C and 4 °C lower than the surface runoff from the asphalt paving. According to a study conducted in Arlington, Virginia, heavy summer rain events increased the surface waters’ temperature up to 4 °C [37]. Elevated air temperatures followed by heat waves combined with heavy rainfall events influence the entire aquatic food web and concentrations of nutrients and pollutants. Increases in a water temperature increase the mineralization rate of organic matter, leading to nitrogen, phosphorus, and carbon releases. Besides, it can directly decrease oxygen concentration, or this impact can be indirect through increasing biological respiration rates [94]. Oxygen depletion is particularly problematic during the summer and early autumn when bacterial activity and organic matter content are high, and water temperature is increased [11].
Elevated water temperature and altered thermal regimes can cause stress, mortality, or loss of fish species diversity [91]. Due to the impact of climate change, it is expected that lake temperature will increase up to 2 °C by 2070 [94]. Nelson and Palmer [95] reported that headwater streams might be more impacted by urbanisation than by climate change.

5. Strategies for Mitigating UHI Effects

The UHI effects can be reduced by proper landscape design in urban planning [1]. As the UHI is more evident at night, “a nighttime-cooling effect should be the norm, rather than an exception, for any potential UHI mitigation strategy” [96]. To mitigate urban heat, Martilli et al. [97] stated that “the need for mitigation, the degree of mitigation needed, and the efficacy of a mitigation strategy must depend only on the thermal characteristics of the urban area, and not their difference from those of the surrounding rural areas”. Various strategies can be used to mitigate UHI, such as installing cool or vegetated green roofs, plant trees and vegetation, and replacing typical paving surfaces with cool pavements [98,99,100]. Razzaghmanesh et al. [101] stated that green roofs could be an effective strategy to mitigate the UHI effects. They reported that covering 30% of the total roof area with green roofs could reduce surface temperature by 0.06 °C. A recently published study showed that planting trees in urban areas can significantly reduce air temperatures during hot days with a maximum temperature above 30 °C [102].
Cool pavements represent various materials and technologies used in pavement modification to lower their surface temperature and the quantity of heat released from their surface compared to traditional pavements [37].
In order to create cool pavements, different mechanisms can be employed, such as increasing surface reflectance, which reduces solar radiation absorbed by the pavement; increasing permeability, which promotes evaporation and therefore cools pavement; and use of the composite structure for noise reduction, which can emit lower levels of heat at night [54,58,103]. Replacement of fraction of pavements material with materials that modify pavement thermal conductivity and heat capacity can reduce pavement surface temperatures. Replacing the part of limestone aggregates with graphite in a hot mix asphalt can reduce pavement surface temperatures between 2 °C and 4 °C [104]. Modification of hot mix asphalt using graphite powder can increase thermal conductivity by 43% and increase the temperature by 1.5 °C compared to conventional asphalt [105].
Regarding the use of cool pavements, the investigation has been mainly focused on reflective and permeable or water-retentive pavements [58,81]. Reflective pavements reduce their surface temperature by combining high solar reflectivity with high emissivity to dissipate solar radiation, while permeable or water-retentive pavements reduce their surface temperature by the evaporative cooling process [58].

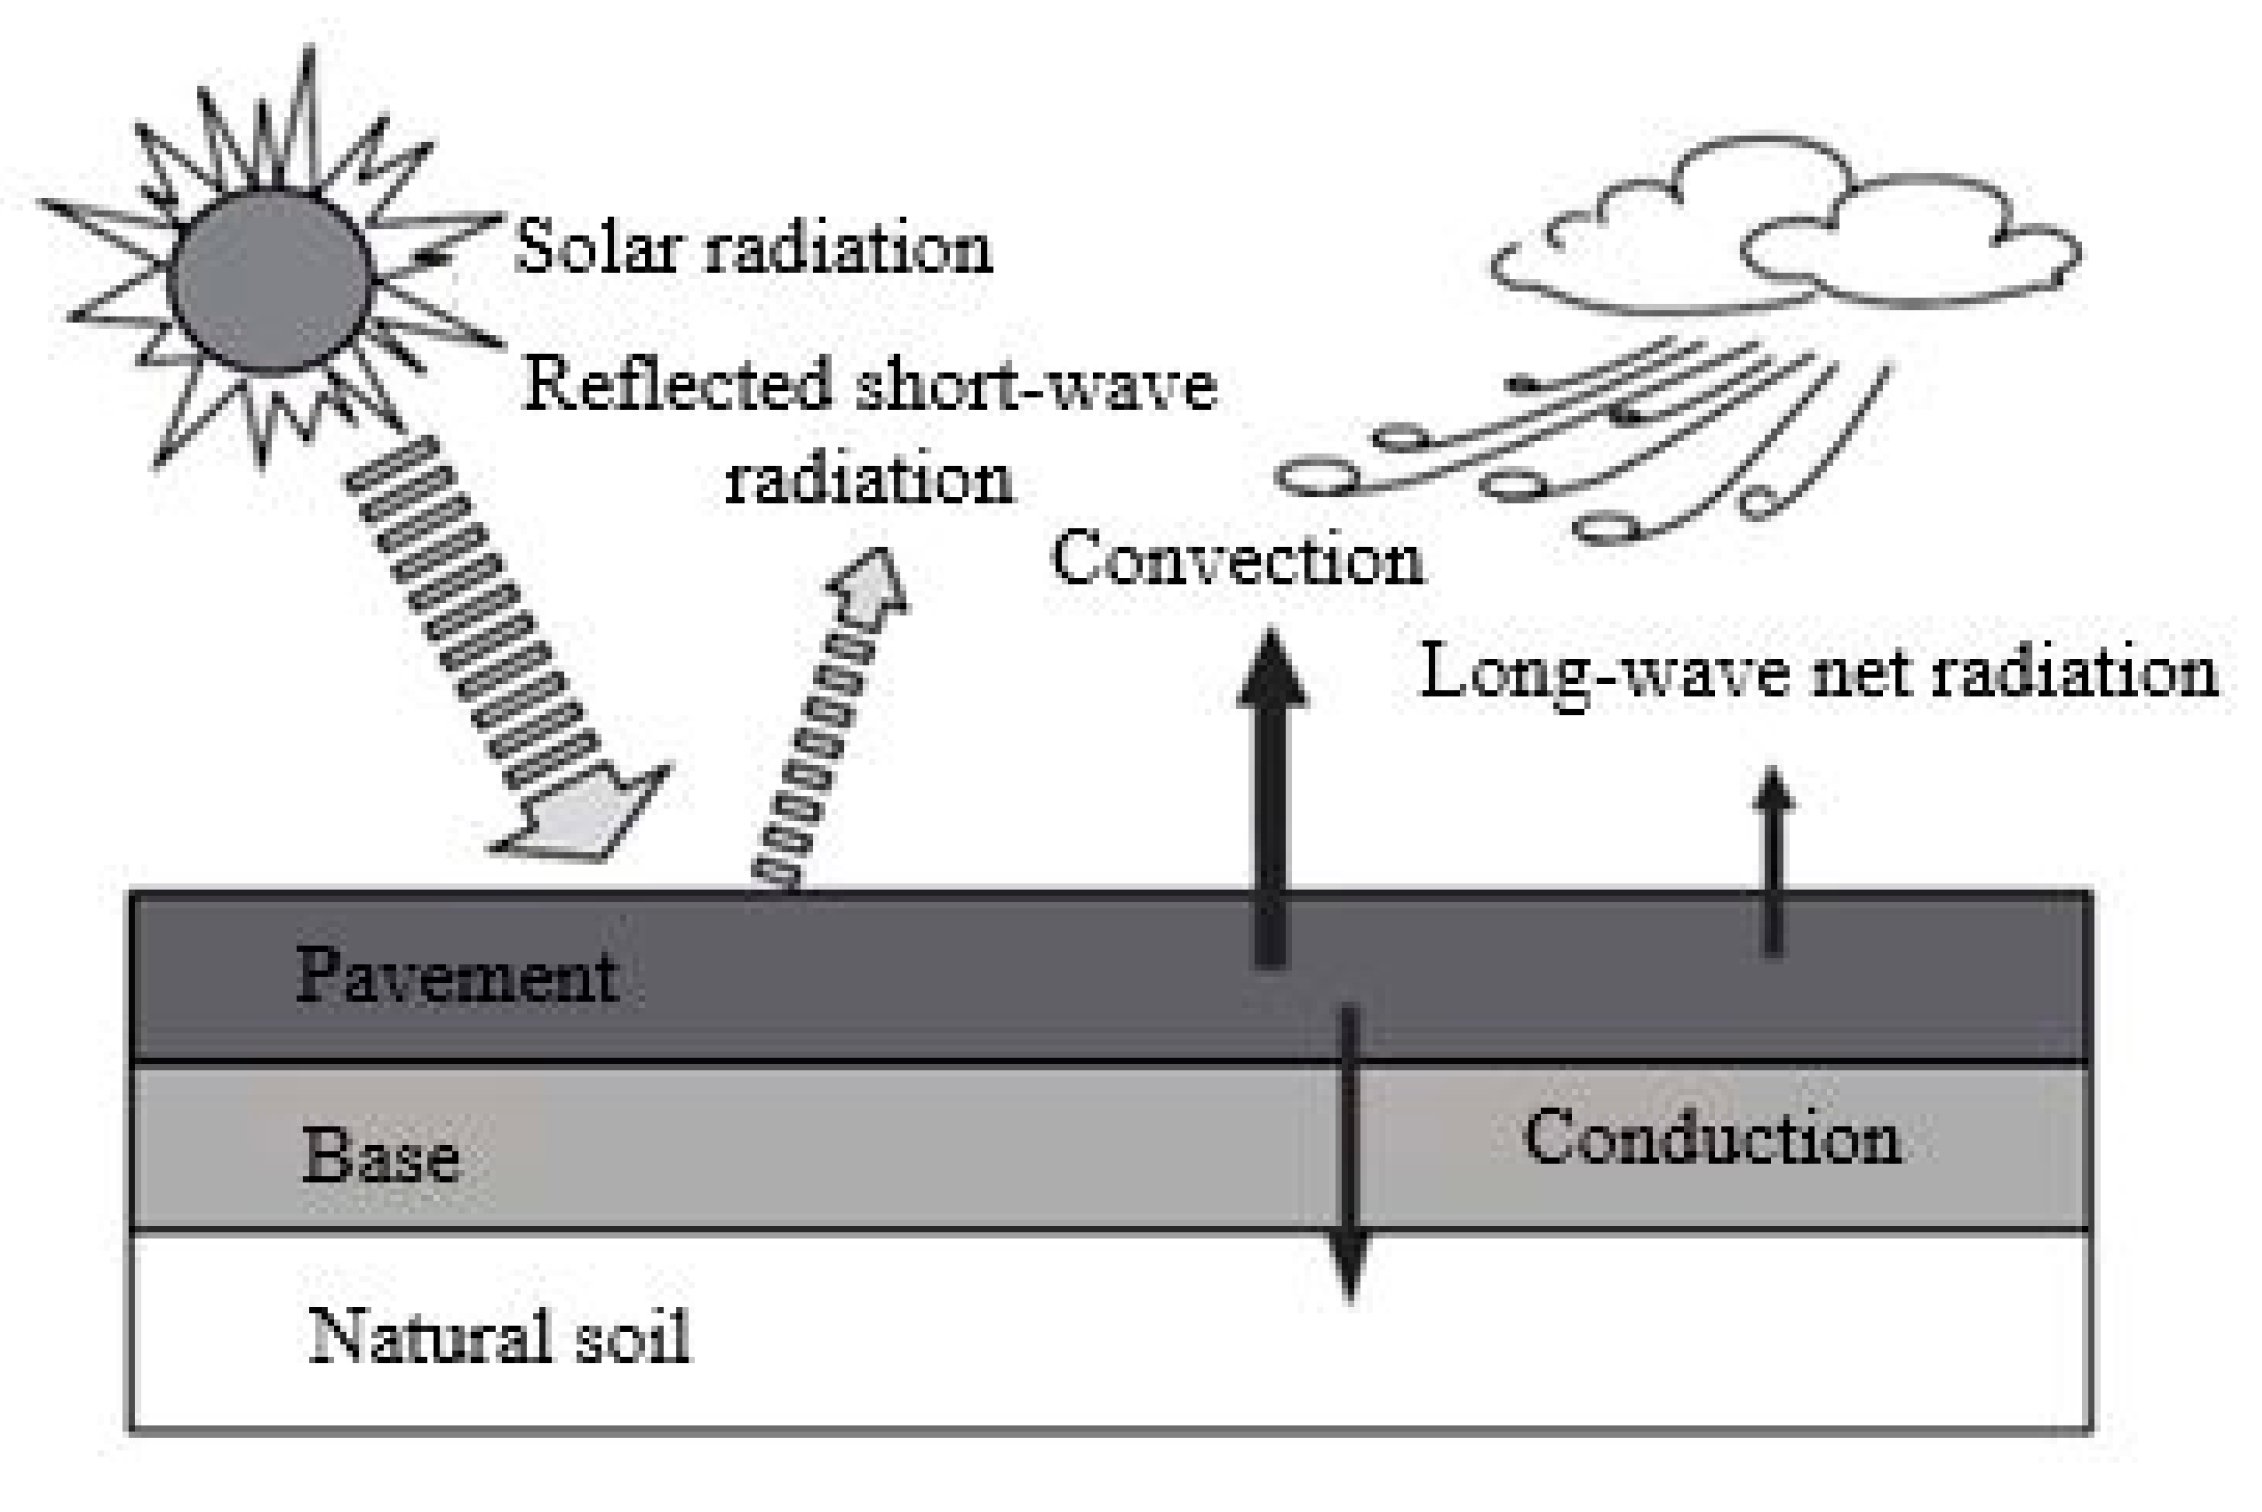
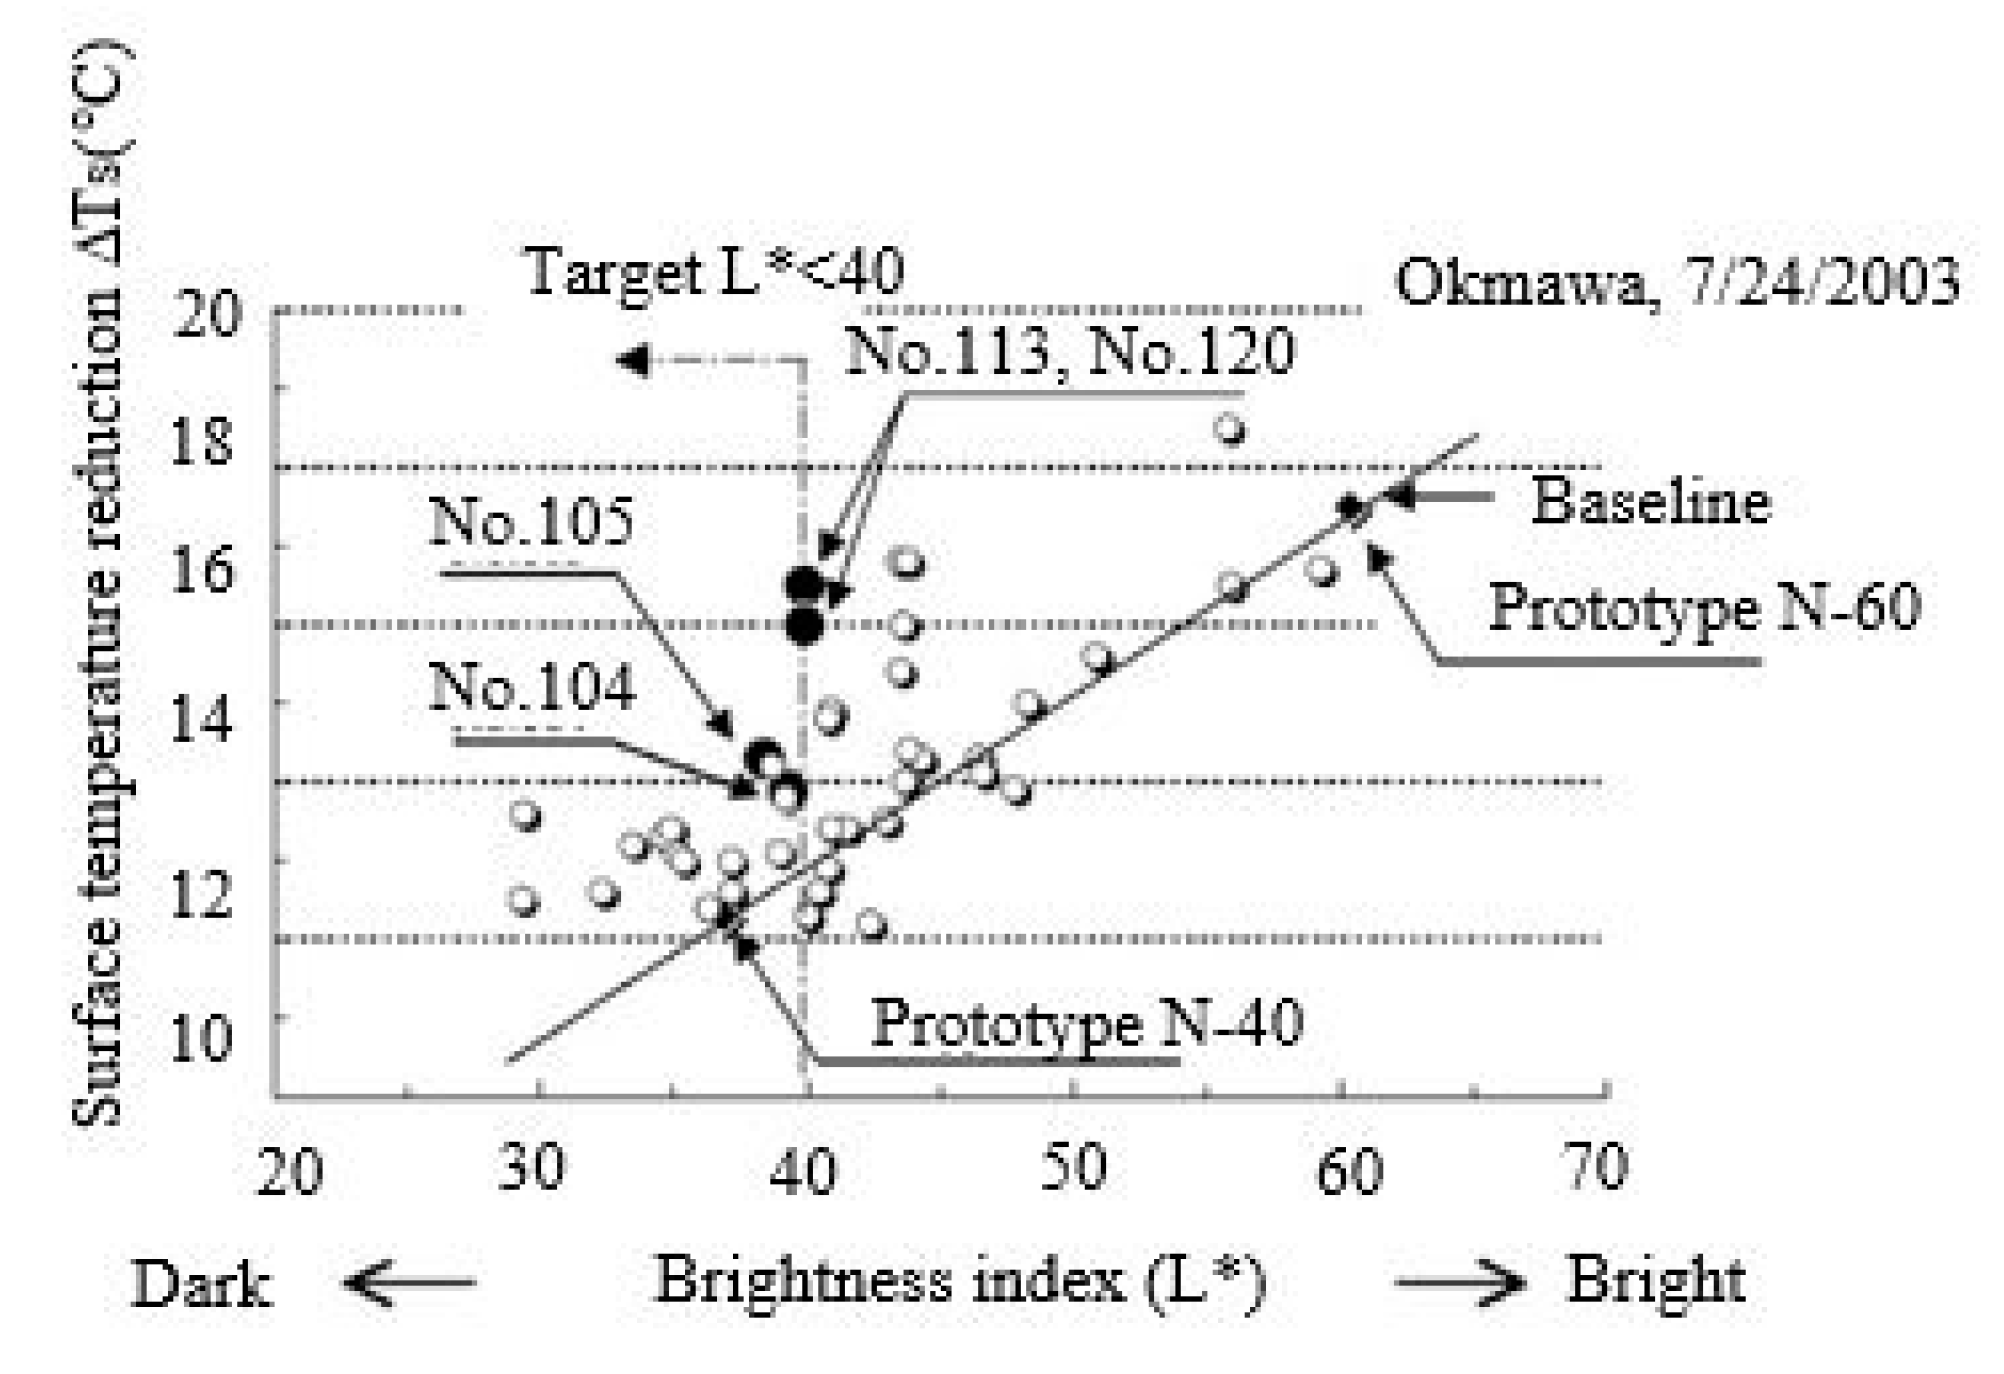
5.1. Reflective Pavements

Due to the higher albedo, light-color materials absorb less sunlight than dark-color materials and consequently stay cool [71,73,99]. White roofs and light-colored pavements absorb only 30–65% of sunlight, whereas dark pavements and roofs absorb 80–90% of sunlight [106]. Asphalt and concrete are the most common paving materials in urban areas. The albedo of asphalt ranges from 0.05 for fresh asphalt [107] to 0.20 for aged asphalt, while concrete albedo ranges from 0.25 to 0.30 [108].
Using cool materials with high reflectivity and high emissivity can ameliorate thermal conditions in urban areas [63,100,109], improve air quality, and reduce electricity demand for air conditioning [17,25,110,111]. An increase in albedo for 0.25 can lower pavement surface temperature by 10 °C [25]. Replacing asphalt pavements with more reflective concrete pavements can reduce surface air temperature by 0.20–0.40 °C [17]. Increasing albedo by 0.01 of 1 m2 urban surface in hot and temperate regions could decrease the long-term global temperature by about 3 × 10⁻¹⁵ K and reduce CO2 emissions by 6.5–7.5 kg [110]. A simulation-based study of Los Angeles showed that an increase in albedo by 0.3, through the development of 25% of the city, would result in 12% decrease in population-weighted ozone exceedance of California air quality standard. Using cooler pavements could save an estimated 100 MW of peak power in Los Angeles [25]. Increasing pavement albedo by 0.2 in Boston, Massachusetts, could impact building energy consumption and lower GHG emissions for a 50 years analysis period. Increasing the albedo of 1100 miles of roads could reduce carbon emissions by 91,720 metric tons [111].
The development of reflective pavements can be achieved using highly reflective white coatings, infrared-reflective colored pigments, and using pavements ingredients that contain reflective and color-changing paints [58].
Karlessi et al. [54] investigated the effect of colored thin layer asphalt samples such as off-white, yellow, beige, red, and green on surface temperatures. They found that all colored samples have lower surface temperatures compared to conventional asphalt. As expected, the conventional asphalt had the lowest solar reflectance of 0.04 and maximum daily surface temperature of 60 °C, while the highest solar reflectance of 0.55 had off-white thin layer asphalt with a maximum daily surface temperature 48 °C.
Besides the benefits of high albedo pavements, they may increase pedestrian thermal stress and thermal discomfort due to the absorption of reflected solar radiation. The use of light-colored pavement on roads provides less lane demarcation due to the low visibility of white lines, potentially increasing driving risk [112]. The potential glare associated with driving over a surface with very high albedo (>0.50) is a factor that should be considered in the application of highly reflective pavements. Besides, the glare issue is the possibility that highly reflective pavement may significantly improve night-time visibility or diminish street lighting demands [54,113].
In order to avoid the disadvantages of high reflective pavement, Kinouchi et al. [114] developed dark-colored paint coatings with a high albedo and low brightness and applied them to the conventional asphalt pavements. The target value of the brightness index (L*) was approximately 40 or below. They selected trial paint coatings with albedo and L* values in the range of 44% to 51% and 37 to 41, respectively (Figure 4). The results showed that the temperature of the paint-coated pavements was about 15 °C lower than that of conventional asphalt pavement. Additionally, the paint-coated pavements could provide a cooler sensation for urban residents than conventional pavements.
According to the US Green Building Council, the solar reflectance index (SRI), based on albedo and emissivity, was accepted as a methodology to determine the “coolness” of various pavements. When the SRI is greater than 29, pavements should be ranked as highly reflective. However, the thermal behavior of pervious pavement is related to porosity, and therefore, the methodology based only on SRI is shown not to be appropriate to determine the “coolness” of pavements accurately. Haselbach et al. [12] showed that the thermal behavior of pervious concrete pavement (PC) was comparable to a traditional concrete pavement (TC) with a similar material mix regarding heat gain and loss despite their SRI differences. The SRI of PC and TC was 14 and 37, respectively. Therefore, based on additional criteria such as porosity, PC should be considered as a cool pavement.
The relation between albedo and porosity of permeable concrete is investigated by Zhang et al. [67]. Their results showed that with increases of porosity, the albedo decreases linearly. Compared to conventional dense concrete, the albedo of porous concrete was about 0.05–0.15 lower.
In the field study, Yang et al. [96] investigated the influence of albedo, heat capacity and porosity of ground cover materials such as landscape gravel, green turf, concrete, pervious concrete, asphalt, and porous asphalt on their surface temperatures (Figure 5). The maximum measured surface temperature was at the green turf due to the lowest albedo. On the other hand, the concrete pavement has the highest albedo, and hence the surface temperature was the lowest. The higher heat capacity of concrete and asphalt pavements makes them retain more heat than other materials, and thus they had higher surface temperatures, while surface temperatures over green turf and gravel decreased rapidly. Due to the influence of porosity, the surface temperatures of pervious concrete and pervious asphalt, compared to concrete and asphalt pavements, were higher during the day. Contrary, during the night, their surface temperatures were lower. The higher void content and airflow within porous pavement structures provide faster heat dissipation than the traditional pavements, and hence their surface temperatures are lower at night. The results indicated that the impact of reflective pavements on air temperatures could be negligible in the presence of turbulent mixing near the surface that diminishes the effect of surface albedo. The air temperatures at 5 feet over six ground cover materials were quite similar, despite the differences in their surface temperatures (Figure 6).
In the lab-scale experiment, Hendel et al. [115] studied the thermal behavior of five different Parisian pavement structures under heatwave like conditions. To investigate the impact on air temperatures, they studied the thermal properties of surface materials and the underlying layers of pavement structures. They measured the temperature and heat flow at different depths. The studied samples, such as asphalt road, asphalt sidewalk, stabilized sand, granite sidewalk, and grass, are shown in Figure 7. The measured albedo and emissivity (ε) values for the surface materials of asphalt road, asphalt sidewalk, stabilized sand, and granite sidewalk were as follows: 0.084 (ε = 0.98), 0.101 (ε = 0.98), 0.581 (ε = 0.92), and 0.343 (ε = 0.99), respectively. Based on measured surface temperature, at the end of the day phase, the samples are divided into three groups: “hot” materials such as the asphalt road and sidewalk, whose temperature was above 60 °C, “cool” materials such as stabilized sand and granite sidewalk, with the temperature below 55 °C, and “very cool” materials such as grass with the temperatures below 40 °C. At night, the samples are divided into two groups: “cool material” such as the stabilized sand and grass samples and “warmer materials” such as all other samples.
The results showed that low albedo materials influenced the most atmospheric heating. Under the air temperature of 35 °C and spectral irradiance of 320 W/m2, for every 0.1 increase in albedo, the daily maximum surface temperature is decreased by nearly 3.4 °C. Such behavior is expected for each sample except for the granite sidewalk structure, which showed similar behavior to dark structures during the night phase. This is explained by the high effusivity and high diffusivity of granite material. Granite structures could quickly store a large portion of the absorbed radiation in depth during the day while at night, quickly release accumulated heat. To demonstrate the ability of samples to transmit absorbed radiation in depth, the authors used a solar transmission index (τ) that depends on depth, albedo, emissivity, the thickness and conductivity of the overlying material layers. Under the same incident radiation, the surface layers that are more conducive and have more absorbent surfaces have the greatest heat flow transmitted inside the structure (Figure 8).
Stempihar et al. [60] used a one-dimensional pavement temperature model to investigate the thermal behavior of porous hot mix asphalt (PHMA), hot mix asphalt (HMA), and Portland cement concrete (PCC). The results indicated that the albedo has the most significant impact on the maximum daily temperature of all pavement surfaces. Nevertheless, the type of material and properties of the pavement structure significantly impact the minimum night-time temperatures. The comparison between different pavement layer thicknesses indicated that the surface temperature decreases as the pavement thickness increases.
Environmental impacts of reflective pavements are site-dependent and influenced by various urban environmental factors, such as geographical locations, local climate, urban morphology, and building characteristics [112].
Yaghoobian and Kleissl [116] investigated the effect of albedo changes on building thermal loads using the Temperature of Urban Facets Indoor-Outdoor Building Energy Simulator (TUF-IOBES). A case study is conducted in Phoenix, Arizona, for a four-story office building with an 1820 m2 floor area and 47% window to wall ratio. The results showed that increasing pavement albedo from 0.1 to 0.5 peak cooling demand increases by 5.3–10.6% (6–13 Wm−2) in pre-1980 buildings and 7.1–10.9% (5.2–8 Wm−2) in post-1980 buildings. They stated that the application of reflective pavement to mitigate UHI with nearby air-conditioned buildings is not recommended. On the roads without nearby air-conditioned buildings, they can decrease air temperatures and energy use in the downwind of urban areas.
The use of reflective pavements in colder climates during the winter period can increase maintenance costs and environmental impacts associated with ensuring a safe winter roadway or walkways. Below 15 °F, the use of deicing salts on snow-covered roads is not as effective, and additional chemicals are required and can negatively impact nearby soils, vegetation, water, and vehicles [96].

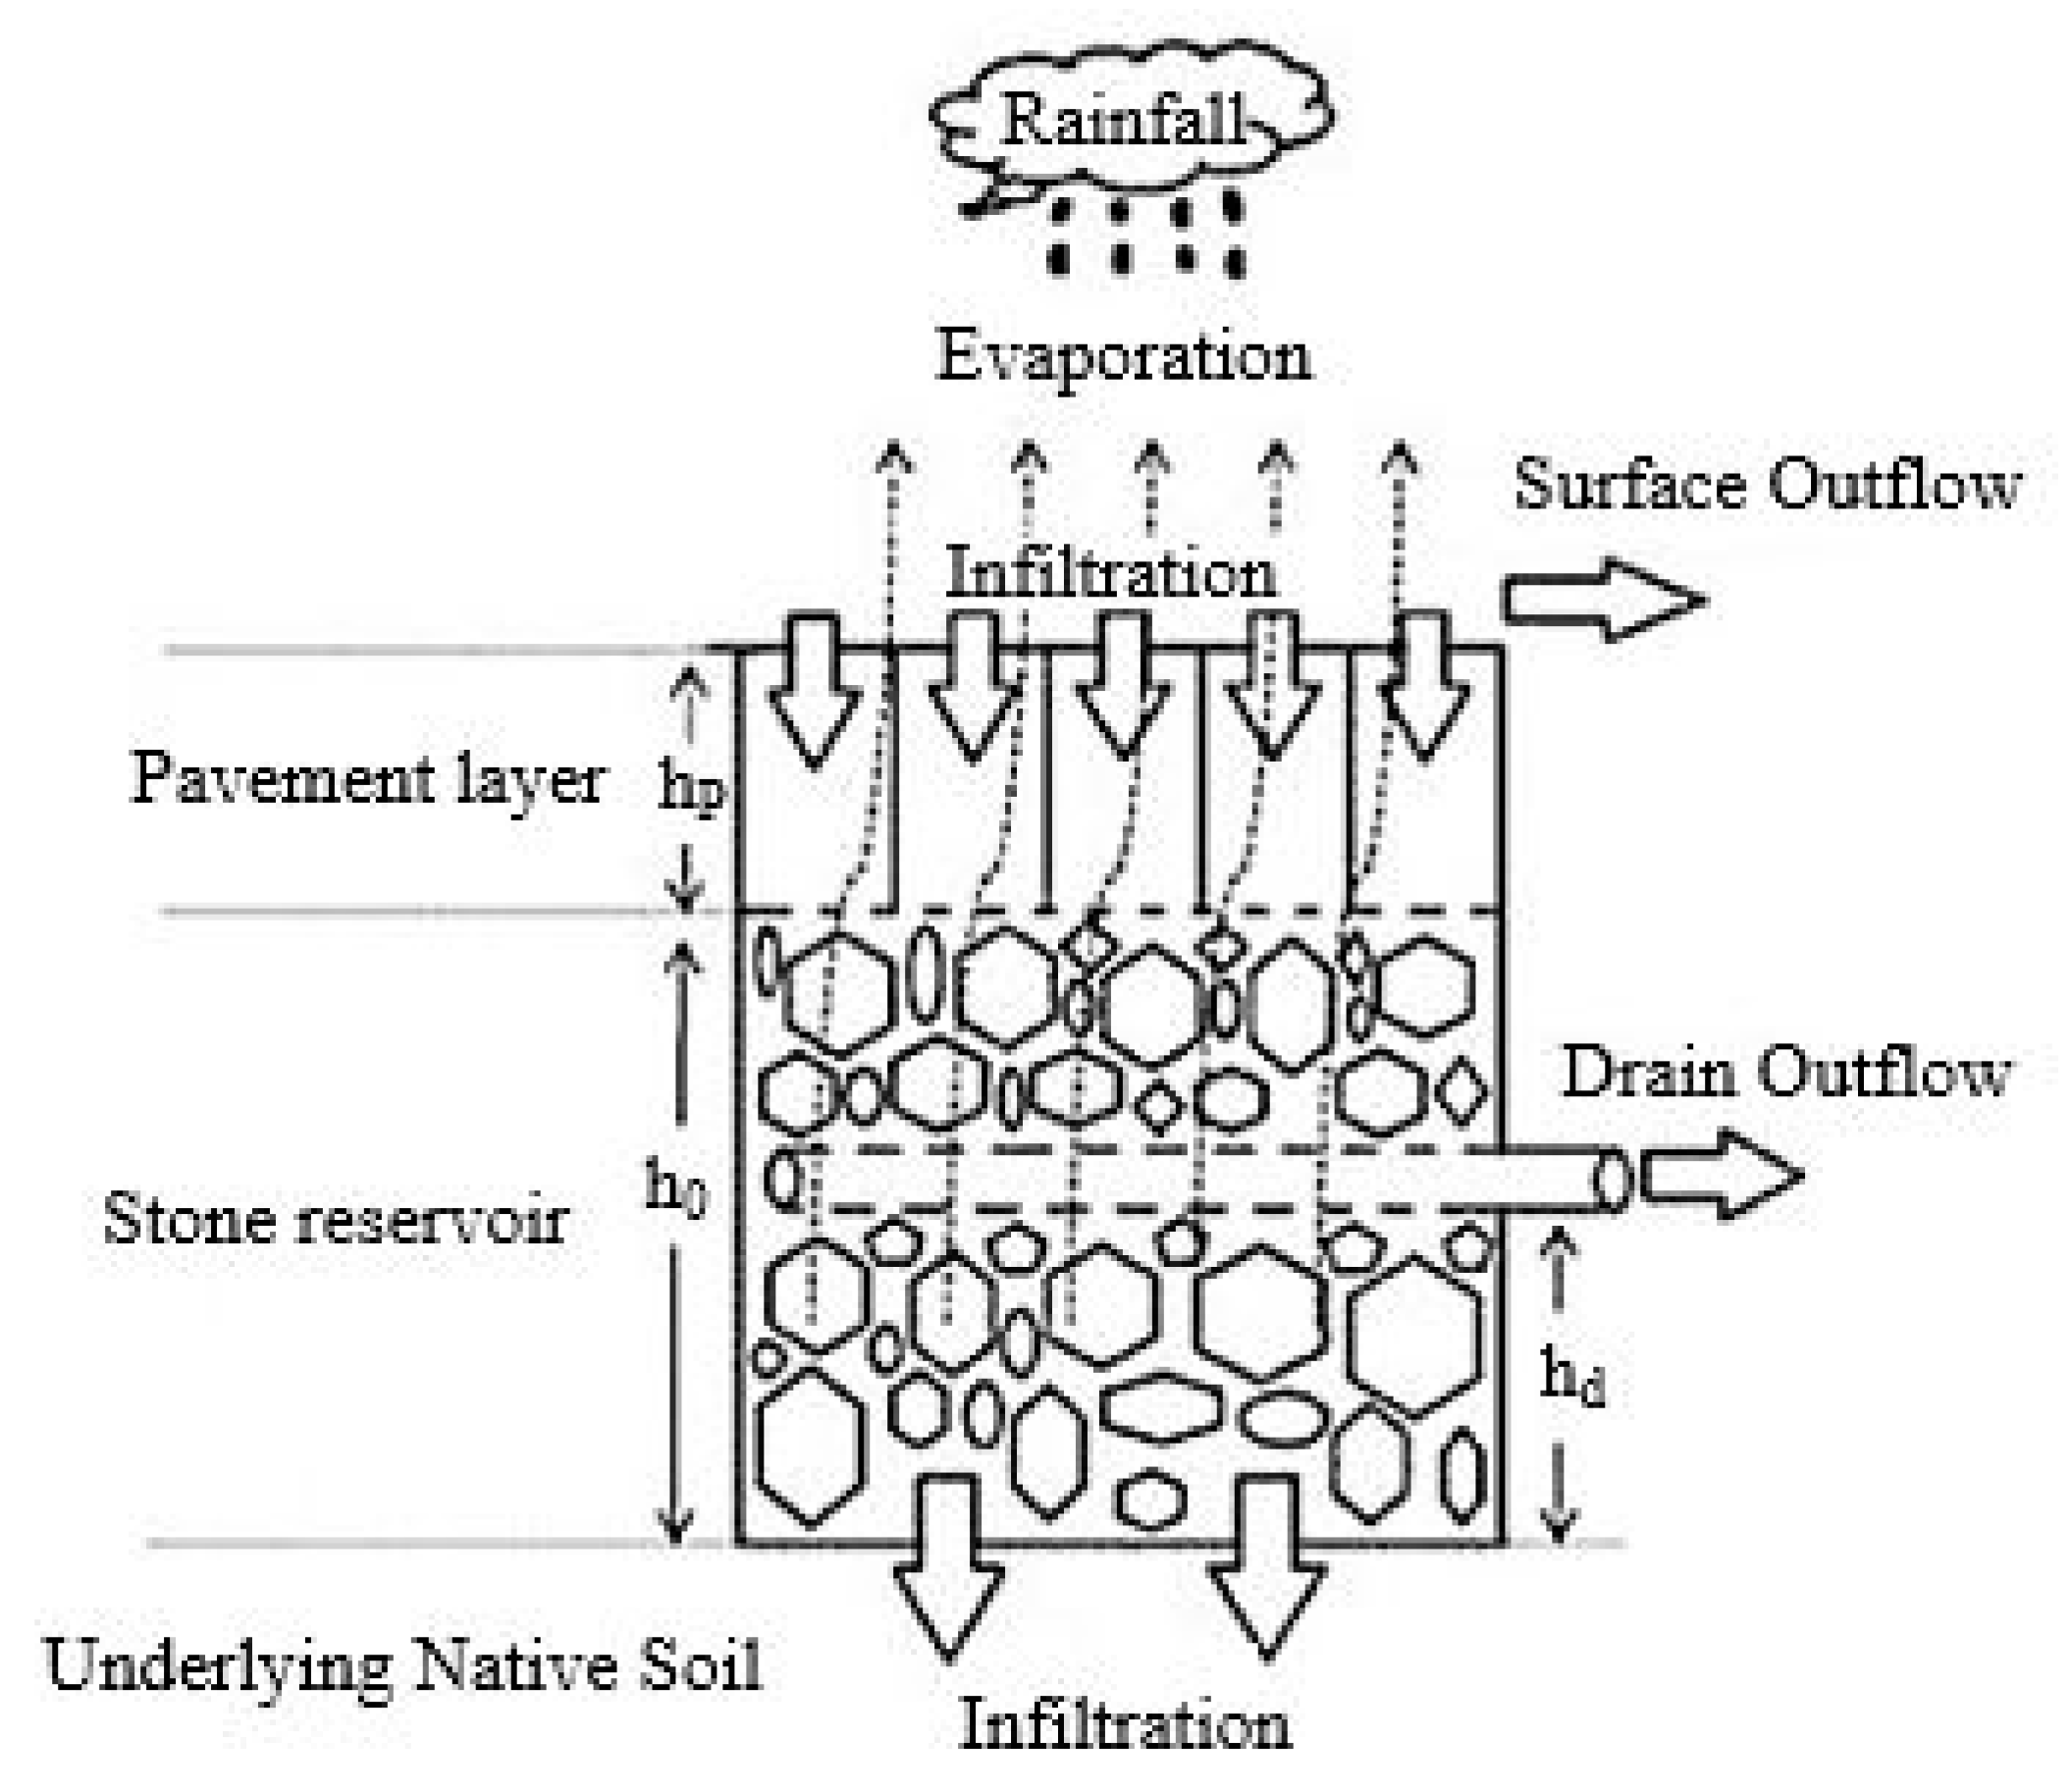
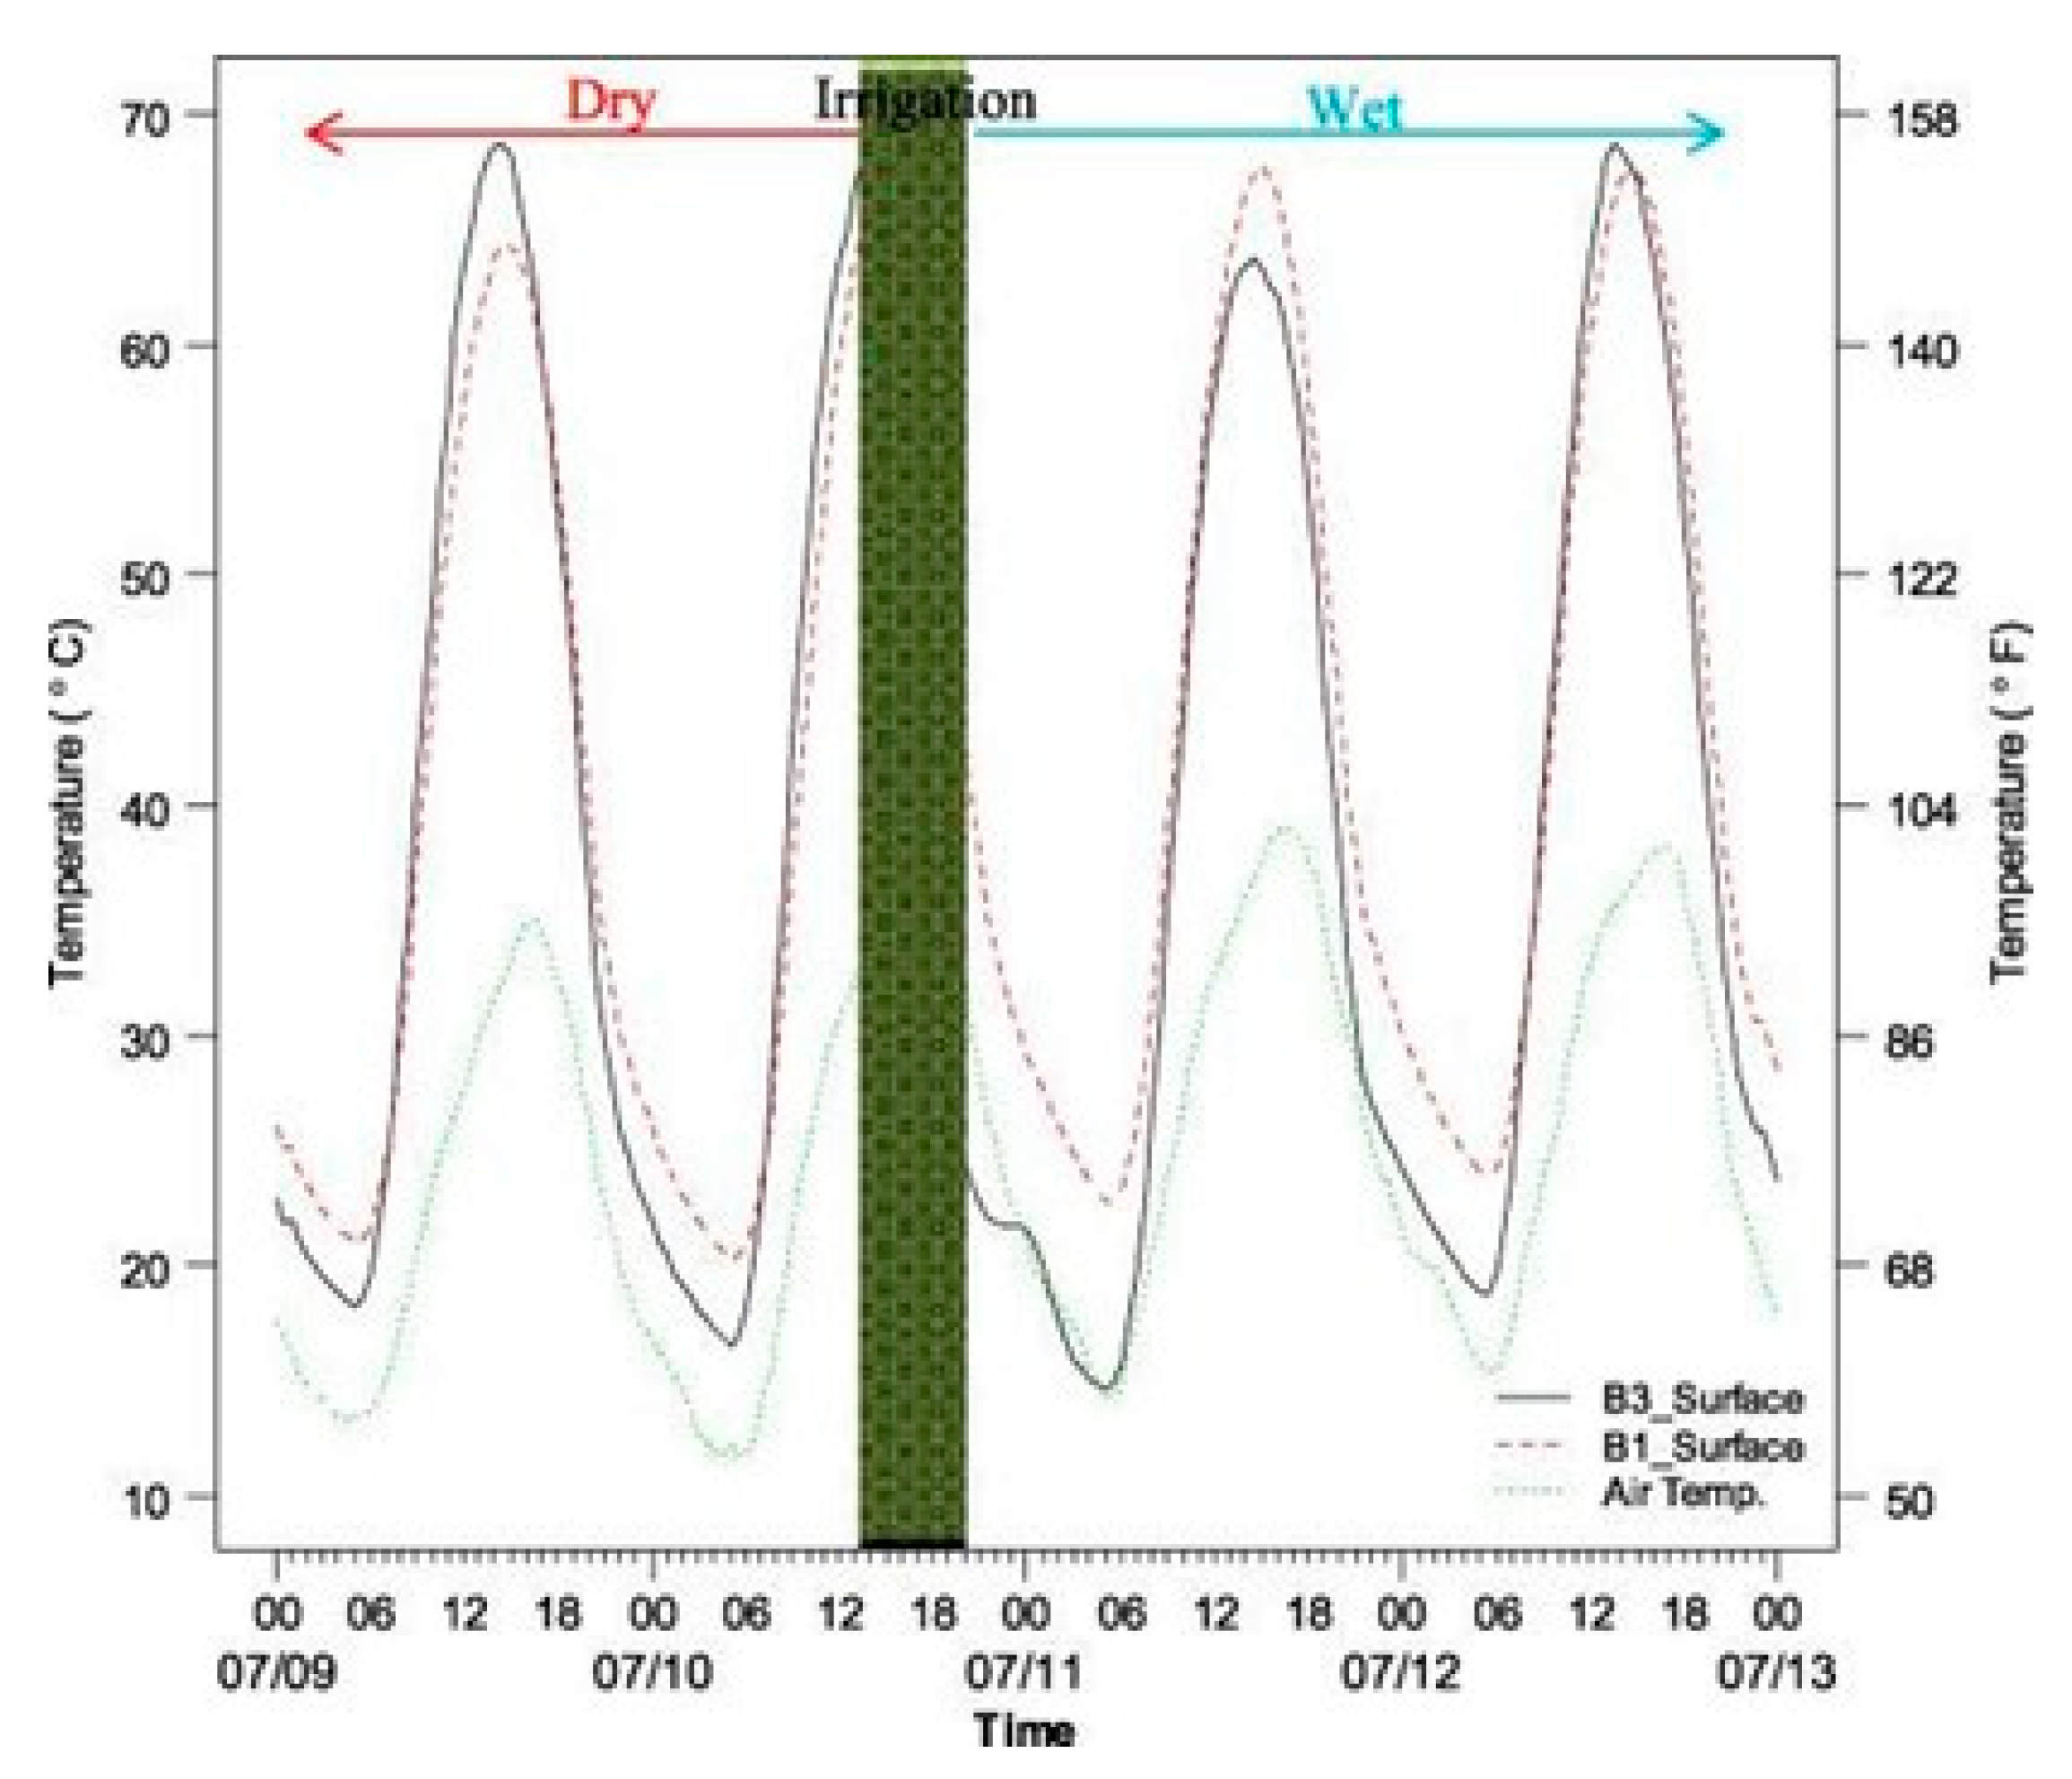
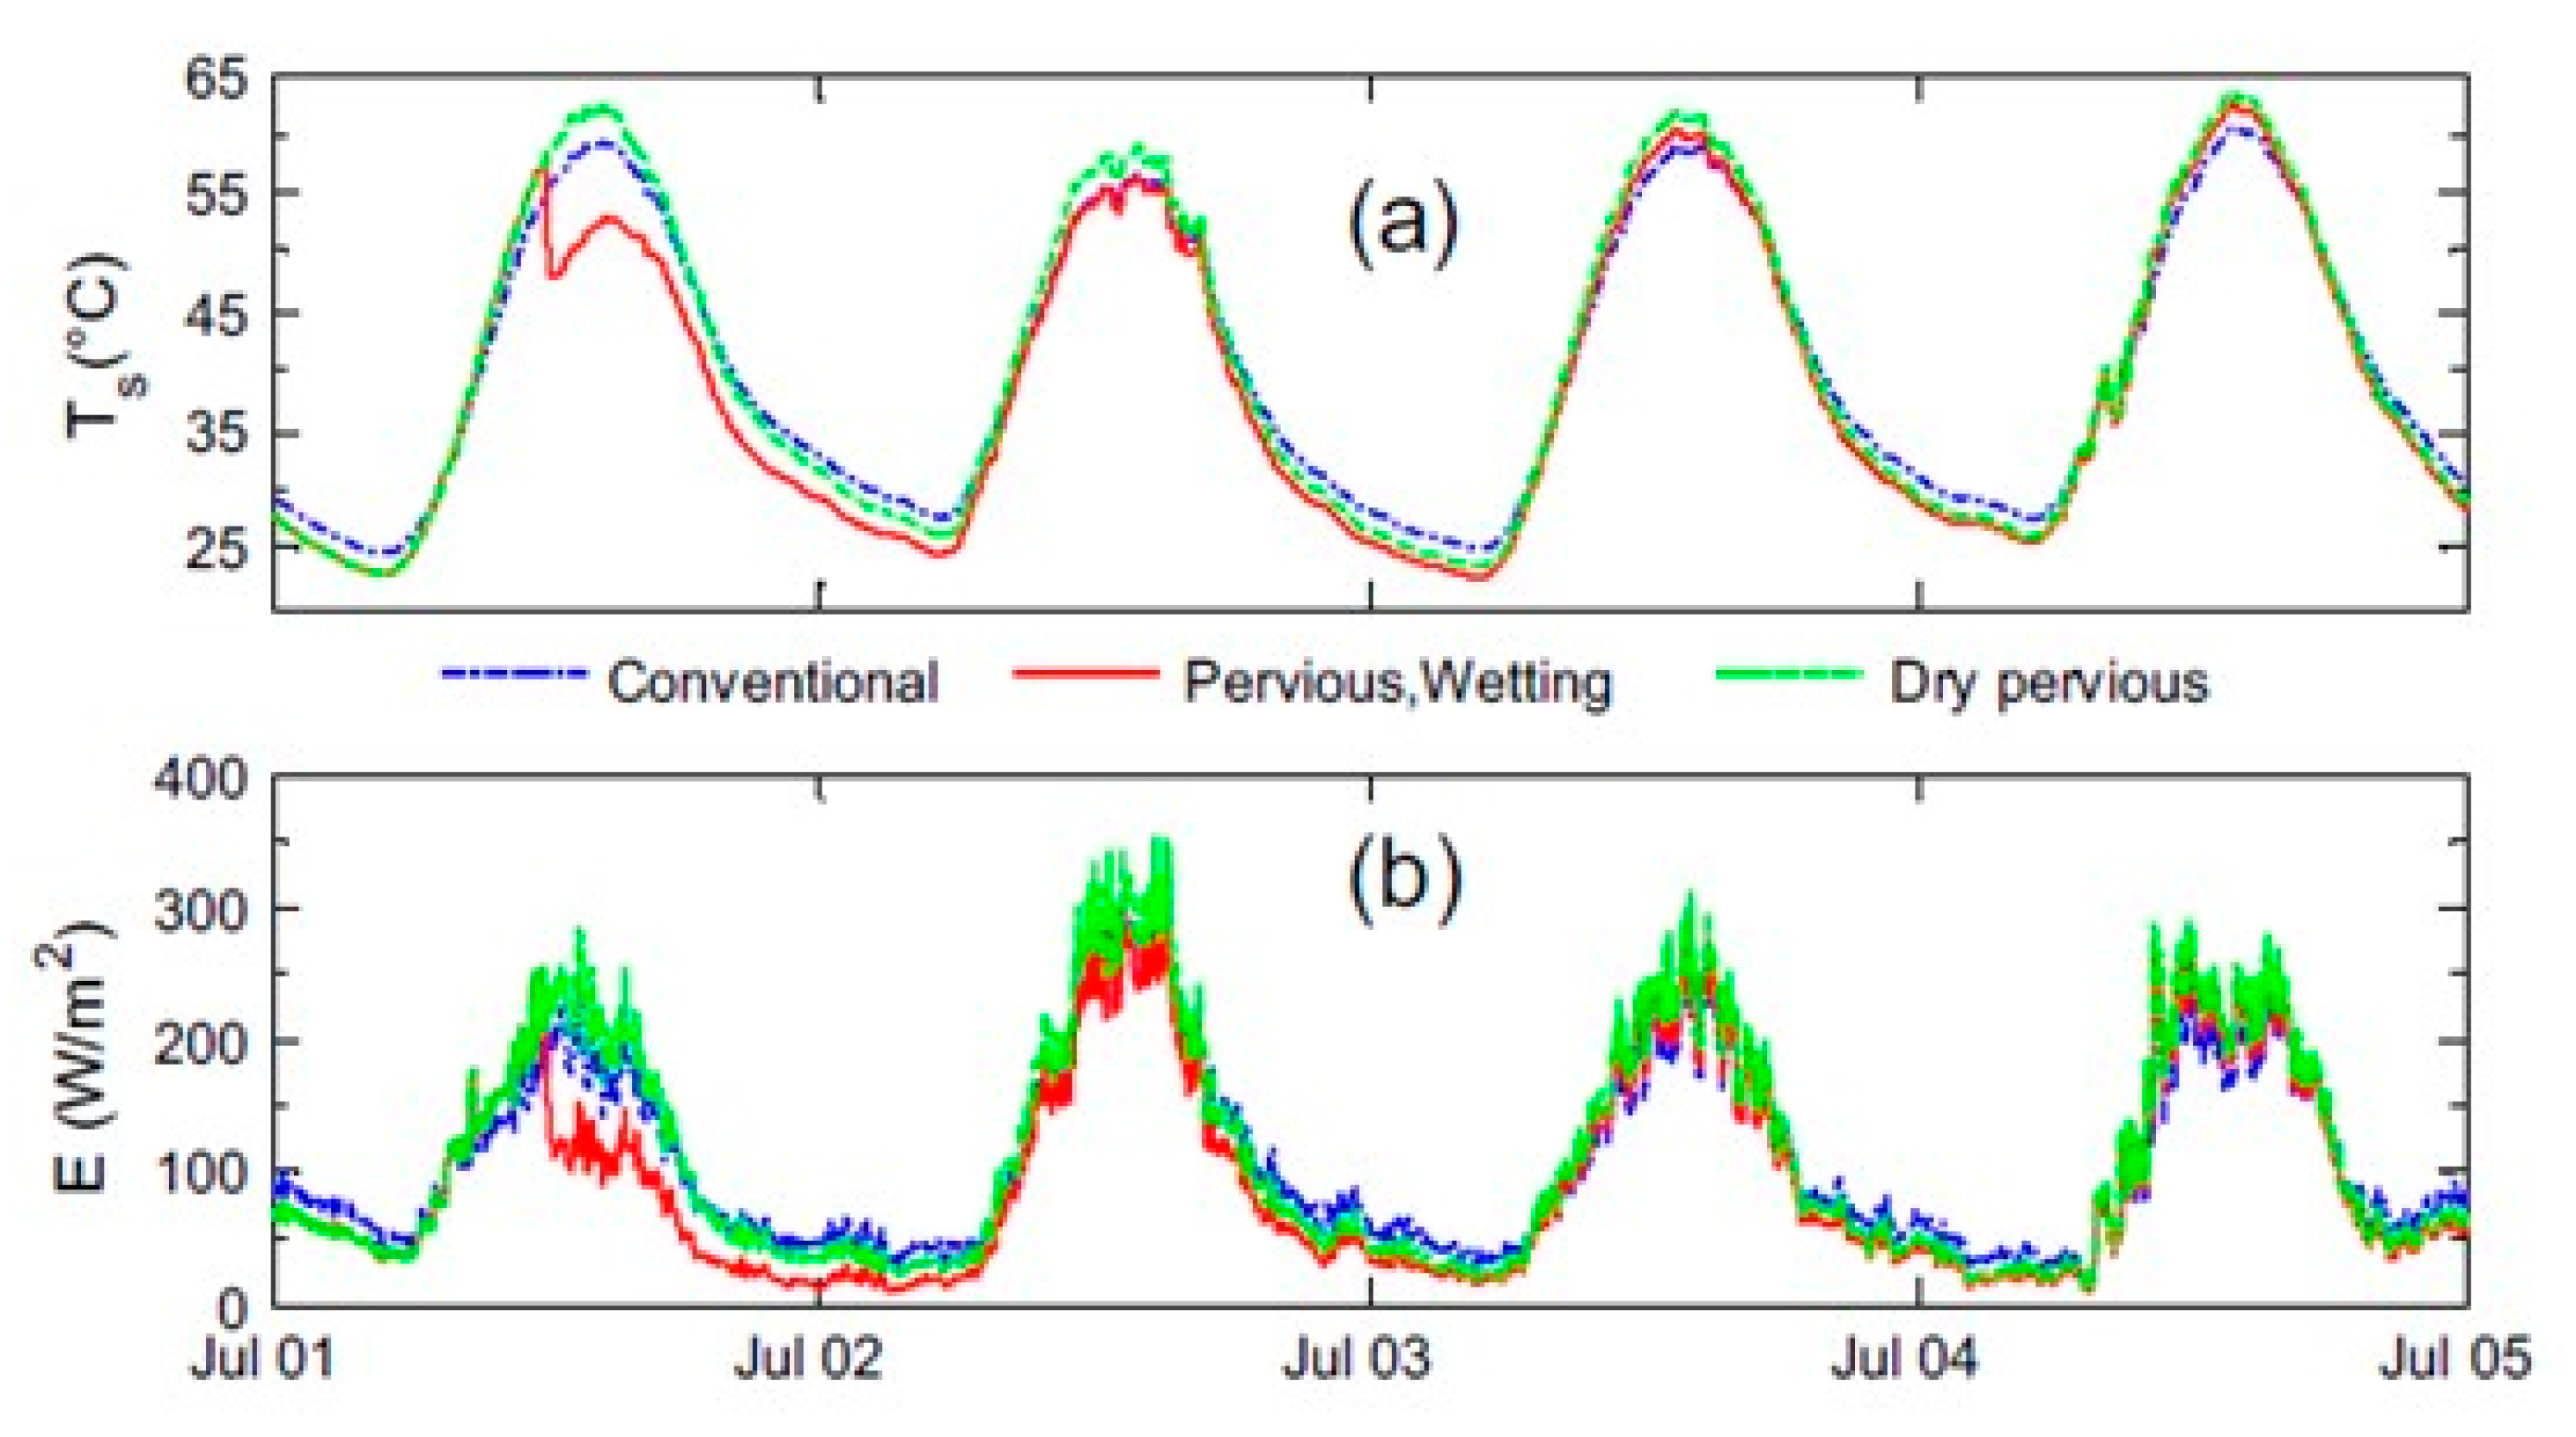
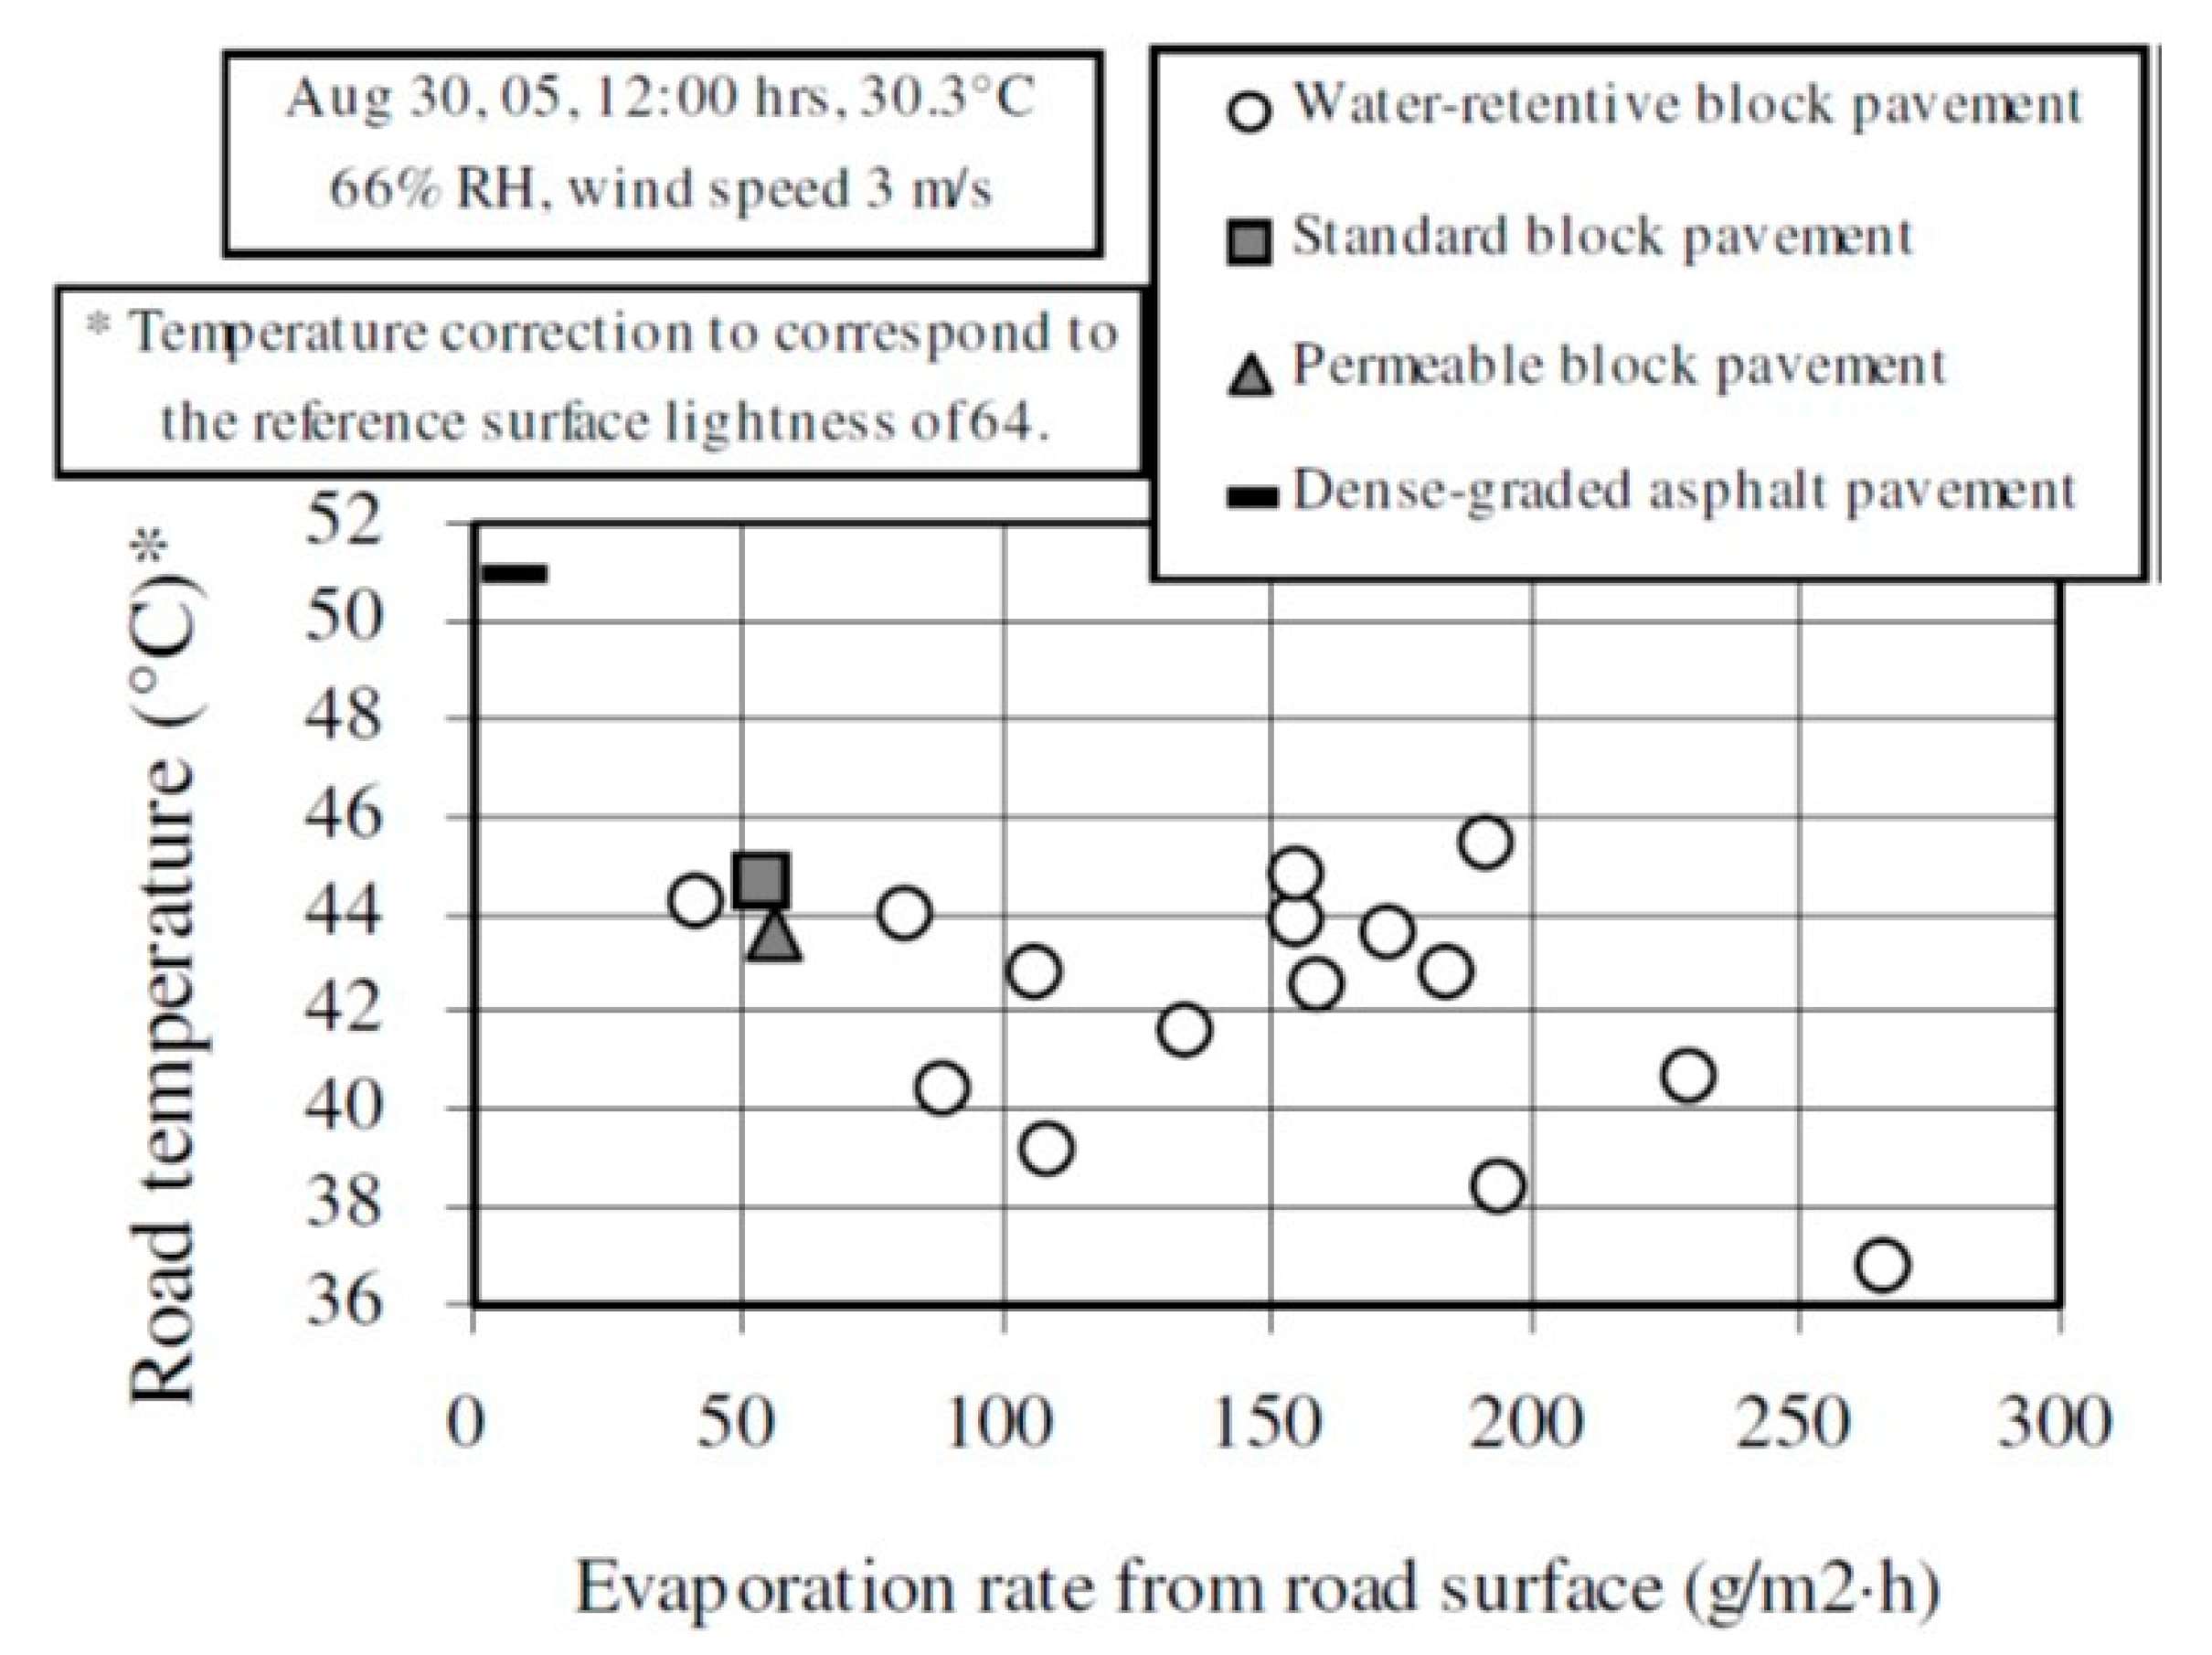
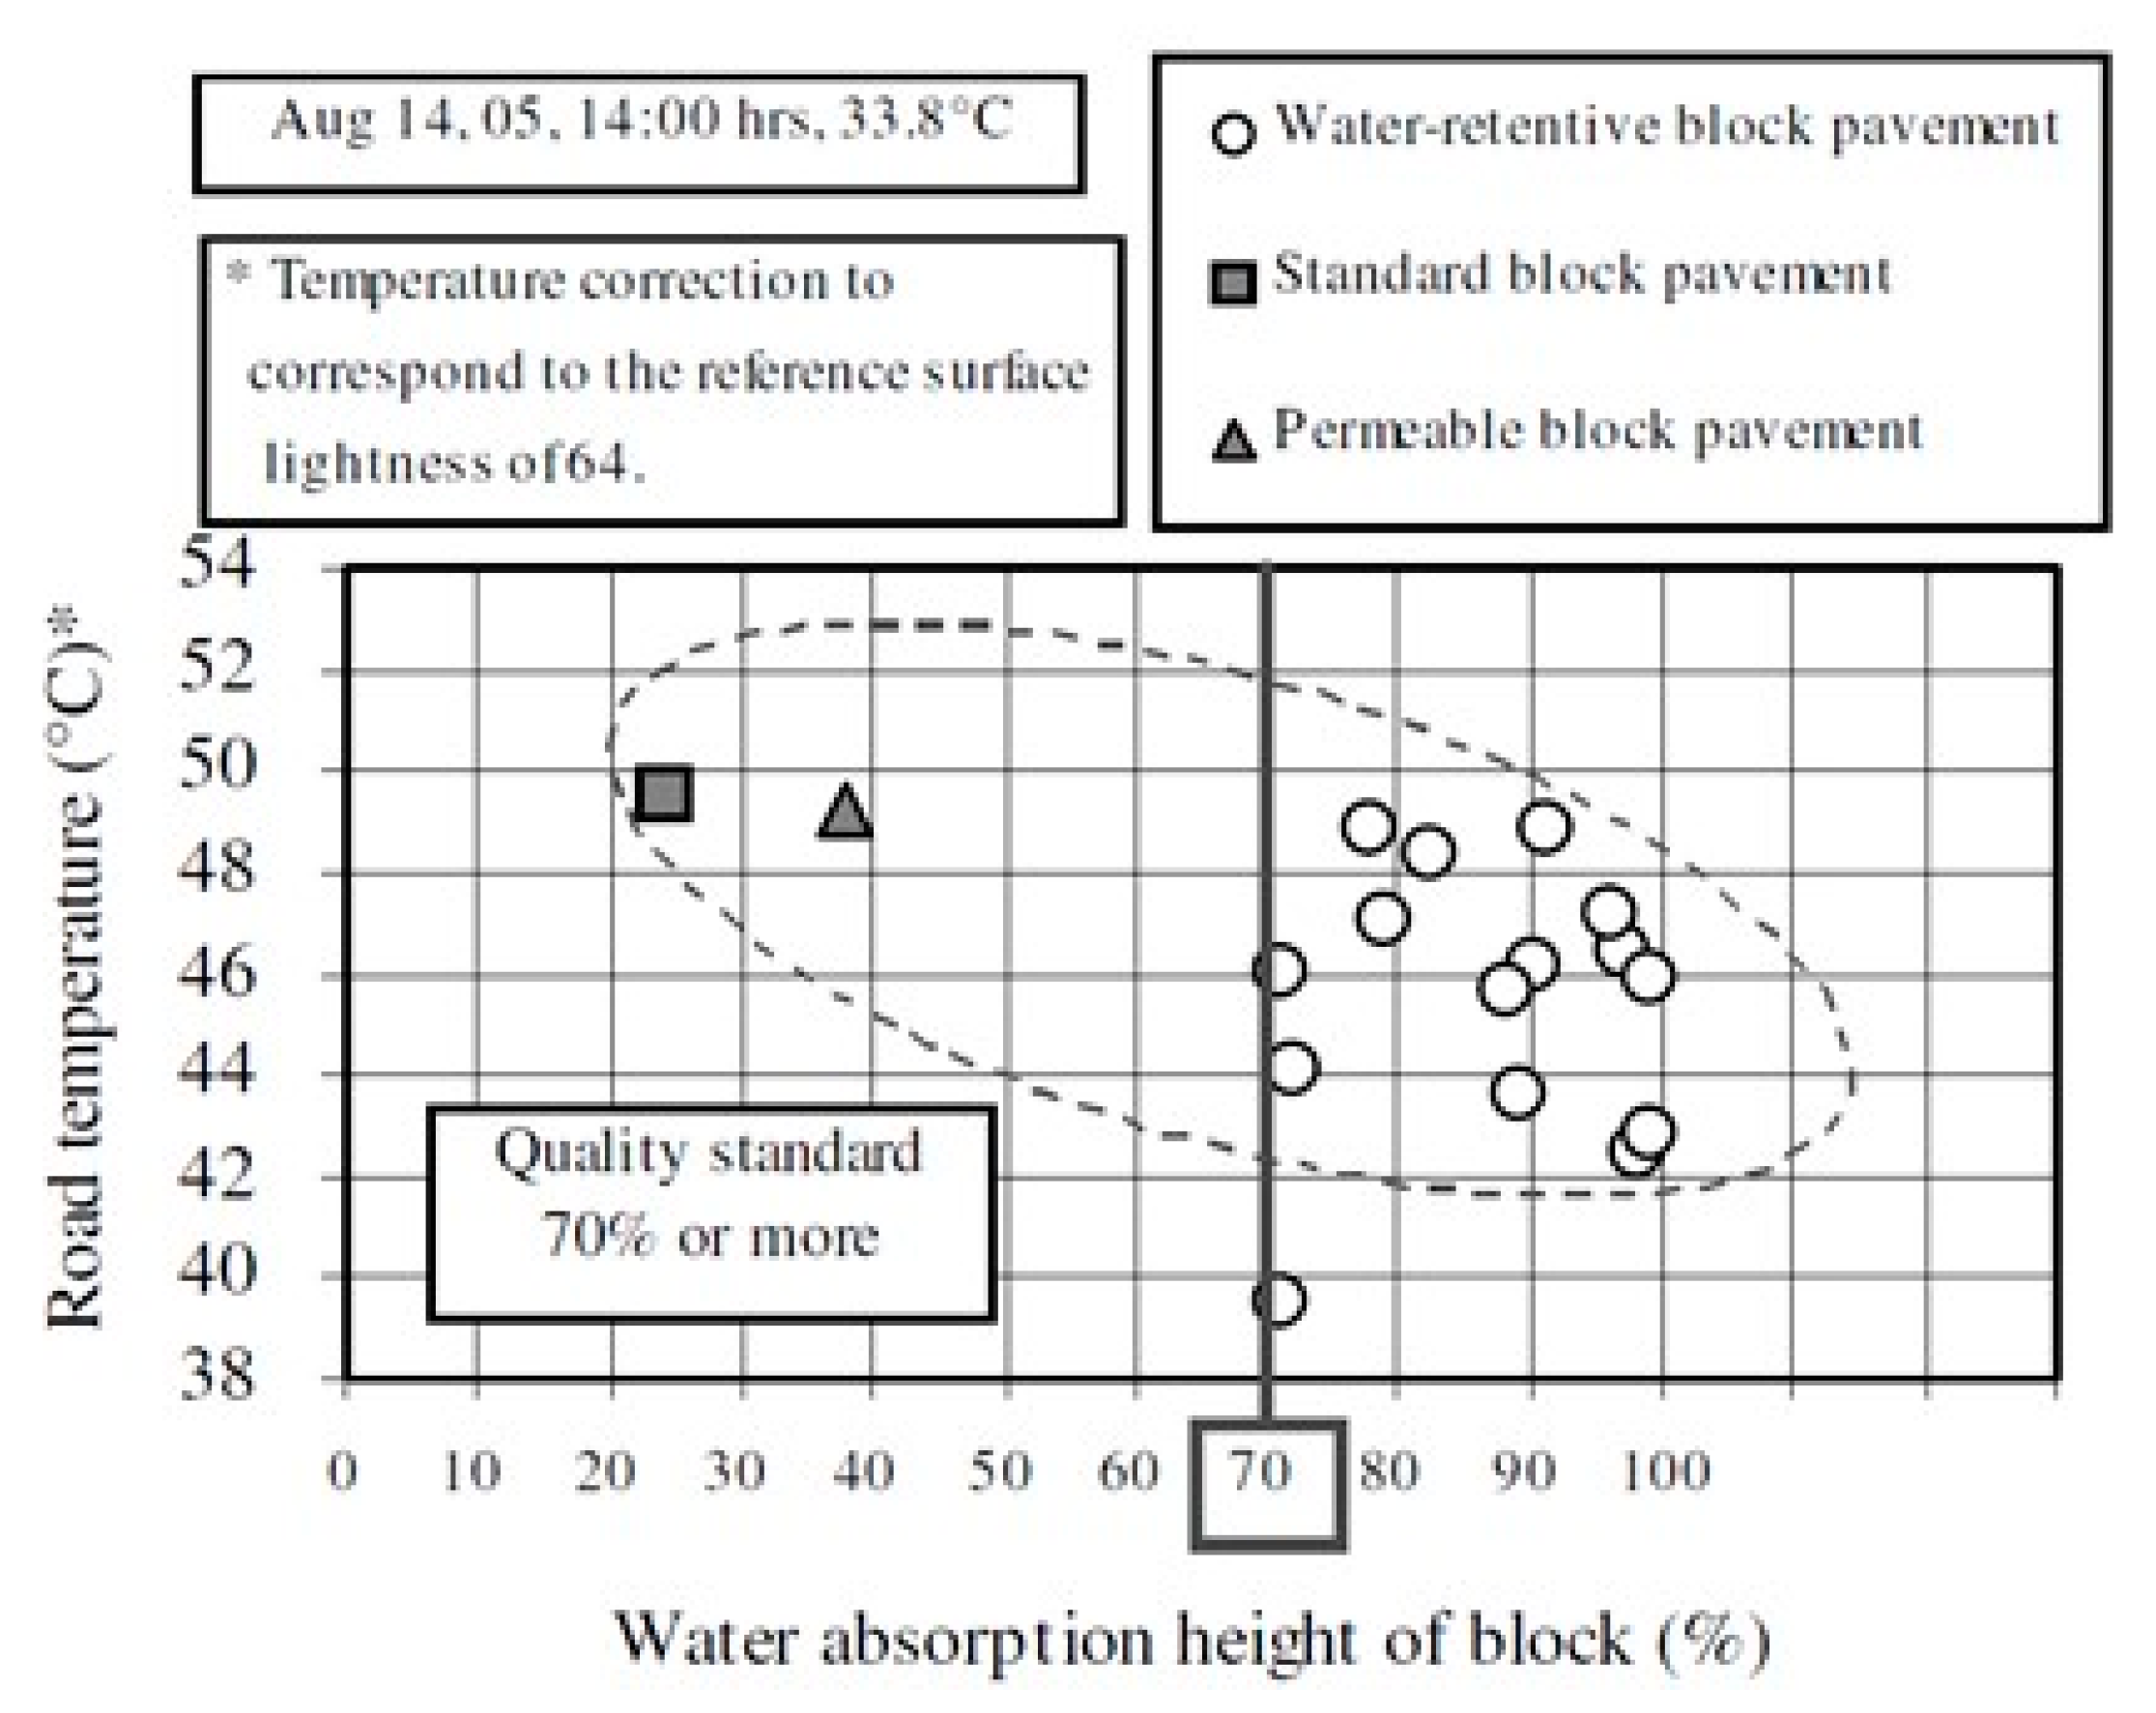
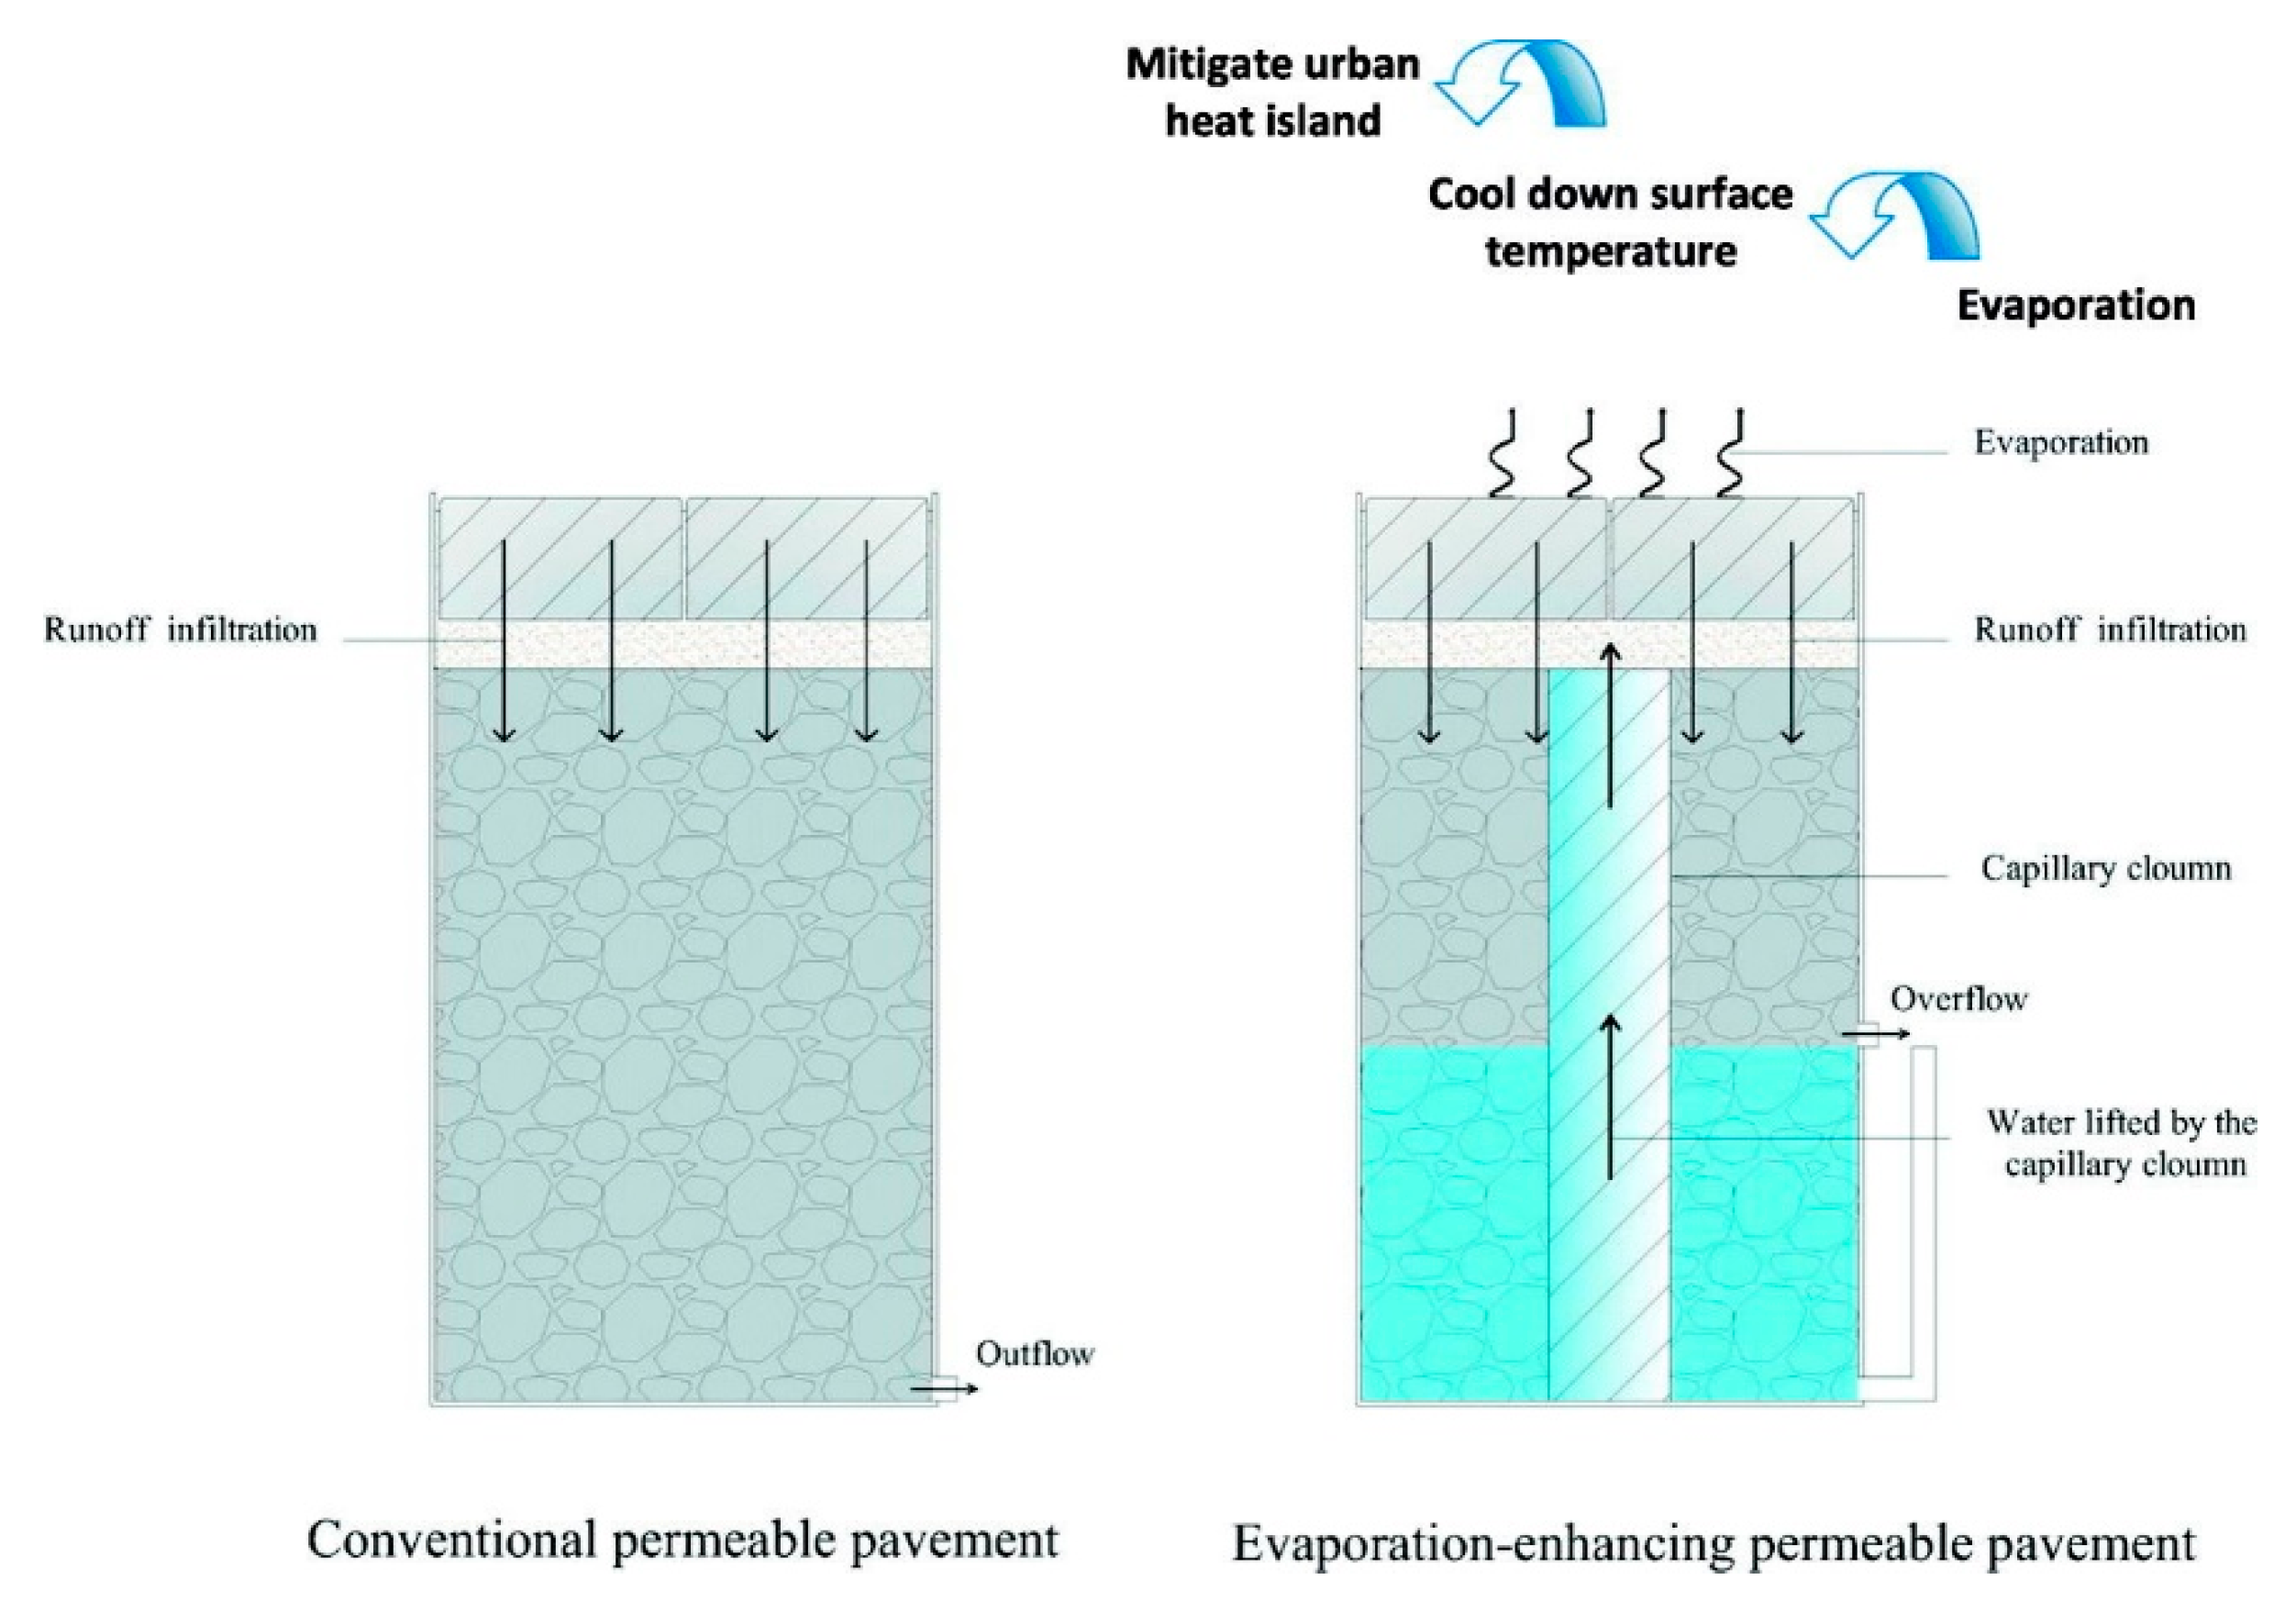
5.2. Permeable Pavements

Permeable (pervious) pavements typically include porous hot warm or mix asphalt pavement, pervious Portland cement concrete, permeable interlocking concrete pavement, and concrete/plastic grid systems [117]. Like conventional pavements, permeable concrete and porous asphalt pavements consist of a mixture of cementitious materials except for a fine aggregate fraction that is reduced, and therefore the percentage of void spaces is increased [118]. Pervious pavements are designed to carry light-duty and low-speed traffic, such as pedestrians and vehicles on local streets and parking lots [71]. They are composed of a permeable surface that allows water to infiltrate into the subbase layers [119], consisting of coarse aggregate materials (Figure 9). The water is stored in an aggregate reservoir from where it is either conveyed to a stormwater drainage system or left to infiltrate into the soil below [120].
Compared to impermeable pavements, permeable pavements have various environmental benefits such as:
  • Effective stormwater management as they can significantly diminish the impact of urbanisation on a hydrological cycle by influencing several factors such as rainwater infiltration and groundwater recharge, surface runoff reduction [121], and water purification [122].
  • Effectively ameliorate urban microclimate through the evaporative cooling process. Due to higher water retention capacity and higher volume of interconnected voids, they have a higher evaporation rate than other conventional pavements [71,121,123]. In urban areas with extensive impervious surfaces, low evapotranspiration rate is a major factor in increasing daytime temperatures [15].
  • They can reduce energy consumption and GHG emissions by 73.48% and 46.70%, respectively [123].
Compared to the impermeable pavement, permeable pavements could have higher water retention capacity and higher evaporation rates up to 3.8 L/m2 and 16%, respectively. The cooling effect could last a few days after rain events [124].
Kevern et al. [125] studied the effect of porosity of concrete pavement on their capacity to store heat. They compared pervious pavements with a porosity of 31% and traditional concrete pavements with a porosity of 5%. The experimental conditions were as follows: five days period, the air temperature greater than 32 °C, and seven days of antecedent precipitation. Measuring stored heat was at a depth of 60 cm below the surface, where the difference in temperatures was less than 1 °C. Results showed that permeable concrete pavement stores 12% less energy than the traditional one.
Hu et al. [61] investigated the thermal behavior of porous Portland cement concrete pavements (PPCC) made of different concrete types and Portland cement concrete pavements (PCC) as a reference. Due to the large amount of connected porosity of porous PPCC, the specific heat capacity was lower for about 12.4% to 20.0% compared to PCC. The surface and internal temperatures of the PPCC increased faster in the sunny day-time and decreased faster in the night-time. Regarding the influences of different concrete types on near-surface temperatures, a comparison between PPCC and PCC showed that the former’s total output heat flux was lower, with a more significant difference during the night period.
During a 15-month field experiment on six different locations, Cheng et al. [126] compared surface temperatures of pervious asphalt pavement (PA) and permeable interlocking concrete pavement (PICP) with traditional materials. Compared with conventional materials, during the summer period, the recorded drop in temperature for PA and PICP was 3.9 °C and 6.6 °C, respectively. Regarding the winter period, the reduction in temperature was 0.7 °C and 0.6 °C, for PA and PICP, respectively.
Wang et al. [123] investigated the influence of water absorption and albedo of pavement materials on the pavement surfaces temperature and air temperature. Two types of pavement materials, such as sintered ceramic bricks (CB) and open-graded concrete (PC), were studied under dry and wet conditions. A dense concrete (DC) was used as a reference. A partial immersion test results showed that CB had a higher water absorption coefficient and water-retaining capacity than PC and could transport more water for evaporation. Therefore, optimisation of water absorption properties of permeable materials could prolong evaporative cooling. Under wet conditions, CB’s surface temperature was lower for about 10 °C compared to 5 °C for PC. The cooling effect of CB could last three days longer than that of a PC. The latent heat flux of CB increased to 41.4% and of PC 29.62%. However, compared to DC due to its higher albedo, CB and PC’s cooling effect did not show good performance. CB could keep the temperature low for only one day and PC only for a few hours. The near-surface air temperature over the CB, PC, and DC were almost the same as the size of the samples had a limited influence.
To enhance the understanding of the impact of water absorption on the evaporative cooling effect of pavement, Wang et al. [127] used similar colored pavement materials with different pore sizes and geometry and similar hydrophilicity. They tested three pavement materials such as sintered ceramic pervious brick (CB), pervious concrete brick (PB), and open-graded pervious concrete (PC). CB had the highest value of the absorption coefficient of 2.040 kg/m2s0.5 and could hold more water. This value was lower about 30 and 204 times for PB and PC, respectively. Pervious materials of CB with smaller pore size around 100–200 µm uniformly distributed have shown better water absorption properties when compared with materials that have larger pore size and nonuniformly pore size distribution. CB and PB better absorption properties resulted in lower surface temperature by 20 °C and 12 °C, with a cooling period of 16 h and 12 h, respectively. PC showed a weak cooling effect of 2 °C, which only lasted for 4 h.
To evaluate the influence of permeable pavements on near-surface air temperature, Li et al. [71] studied cooling effects by changes of pavement albedo under wet and dry conditions. Their results showed that pavements with an albedo of 0.18, 0.26, and 0.29 had surface temperatures of 59 °C, 50 °C, and 44 °C, respectively. Under dry conditions, permeable pavement’s surface temperature was higher for about 5 °C compared to impermeable pavement. Contrary, during wet periods, due to the evaporation of the available moisture, the cooling effect occurred, and the surface temperature of permeable pavement was lower by about 5 °C (Figure 10).
Li et al. [71] stated that improving the capillary effect or introducing water into the pavement could enhance permeable pavements’ cooling effect. Besides, to provide wet conditions of permeable pavement during warm periods without precipitation, they suggested using a landscape irrigation water runoff.
Qin and Hiller [128] showed that after wetting permeable concrete pavements, the surface temperature could be reduced by about 8 to 10 °C, and pavements could remain cool for about 12 to 24 h (Figure 11). After this period, the surface temperature rises similarly to that of conventional concrete. Additionally, the evaporative cooling effect of permeable concrete pavement takes place only if their surface is periodically wetted and when water is at or close to the surface (0 or 25 mm).
The presence of moisture in the porous pavement is an important factor that provides cooling benefits. The sufficient capillary pressure needed to store water on the surface of the pavement structure could be provided by the presence of both small and large voids through which water will not quickly infiltrate. Accordingly, more moisture will be available for the pavement’s cooling effect [129].
According to Karasawa et al. [130], water-retentive concrete block pavement (WRP) could be used to prevent the rise in pavement surface temperature. WRP has a water retention capacity of 15% and water absorption of 70%. They compared WRP cooling performances to standard interlocking block pavement (SP), permeable interlocking block pavement (PP), and dense-graded asphalt pavement (DP). The results showed that after spraying water over the pavements, the water evaporation from WRP was higher than for SP or PP. Additionally, under the higher evaporation rate, the road temperature was lower (Figure 12). WRP, whose absorption height was higher, had a lower road surface temperature (Figure 13).
Liu et al. [131] developed evaporation-enhancing permeable pavement using hydrophilic materials, including hydrophilic geotextile, fine sand laying course, and water-holding pavers. In addition, the capillary columns made of figuline are installed in the aggregate subbase (Figure 14).
Under such conditions, the water absorption capacity increased. Besides, due to the good capillary capacity of figuline columns, captured water can be lifted to the pavement’s surface to a high of 30 cm within 5 h, providing more moisture for evaporation. Compared to conventional permeable pavement made of fine concrete, the figuline pavement’s cooling effect was more significant due to improved water absorption capacity. The evaporative cooling of figuline pavement was about five days longer than conventional permeable pavement, and it was cooler than conventional permeable pavement for 9.4 °C (Figure 15).
Li et al. [64] studied the relationship between pavement permeability and air void content with evaporation rate. They compared the evaporation rate of two concrete pavements, in which compactness was different due to the different sizes of aggregates used with open-graded asphalt concrete pavement. Simulated experimental conditions of water infiltration within permeable pavements were similar to those that occur after a heavy rain event or extensive irrigation. The results showed positive correlations of the air void content and permeability with the evaporation rate. A small air void content and low permeability tend to block water evaporation from the materials and seal the moisture inside the materials [63].

6. Conclusions

The UHI phenomenon, its causes, and consequences, such as the impact on human health and thermal comfort, increased cooling energy consumption, air pollution, and surface water quality deterioration, are well documented in the literature.
Low-albedo impervious surfaces such as sidewalks, roads, and parking areas cover a significant percentage of urban surface and hence play an important role in UHI formation. Therefore, proper landscape design in urban planning, using cool pavements, such as highly reflective and permeable pavements, could be a potential strategy to ameliorate urban microclimate.
Pavement surface temperature depends on the thermal properties of materials on the surface and underlying layers of pavement structures. Therefore, these properties determine the influence of pavement on air temperatures.
Environmental impacts of reflective pavements are site-dependent and influenced by urban environmental factors, such as geographical locations, local climate, building characteristics, and urban morphology. Using reflective pavement in areas with nearby air-conditioned buildings is not recommended because reflected radiation from high albedo pavements may increase the temperatures of the building. Additionally, it may increase pedestrian’s thermal stress and thermal discomfort.
In recent years, permeable pavements have been attracted much attention as a potential measure to ameliorate urban microclimate due to their ability to reduce surface temperature by the evaporative cooling process. Compared to conventional concrete pavements, perevious concrete pavements have lower reflectivity, heat volumetric capacity and thermal conductivity and tend to absorb additional heat due to the higher porosity. Numerous studies have shown that permeable pavements in dry conditions contribute to UHI formation, while under wet conditions they can lower air temperatures. The higher void content and airflow within porous pavement structures provide faster heat dissipation than the traditional pavements, and hence their surface temperatures are lower at night.
The evaporative cooling of permeable pavements depends on porosity, moisture content and evaporation rate. Periodically watering the pavement surface is required to provide sufficient moisture and improve pavement cooling performance.
Optimization of permeability, air voids content, water absorption, and the capillary effect, or introducing water into the pavement may increase the evaporative rate and improve the cooling performance of permeable pavements.
Different mechanisms that modify radiative and thermal properties in both reflective and permeable pavement could be employed and combined and be further engineered solutions in developing and optimizing pavement structure that can ameliorate urban microclimate.
Previous studies showed that field measurements and lab-scale experiments could provide significant information on the thermal and hydraulic behavior of cool pavements. However, they are time-consuming and document only the behavior under the actual meteorological conditions. Furthermore, using in-situ experiments to evaluate the impact of surface temperature and evaporation on air temperature for natural urban environments cannot be easily conducted [63]. Therefore, to assess the efficiency of combined strategies of reflective and permeable pavements as potential UHI mitigation measures, further research should be conducted using experimental models or numerical simulations.

Author Contributions

Conceptualization, S.V. and N.S.; Methodology, S.V. and M.B.; Writing—original draft preparation, S.V. and N.S.; Writing—review and editing, S.V., B.H., H.K., N.S. and M.B.; Supervision, S.V. and M.B. All authors have read and agreed to the published version of the manuscript.

Funding

This research received no external funding.

Institutional Review Board Statement

Not applicable.

Informed Consent Statement

Not applicable.

Data Availability Statement

Data available within the article.

Conflicts of Interest

The authors declare no conflict of interest.

References

  1. Ünal, Y.S.; Sonuç, C.Y.; Incecik, S. Investigating urban heat island intensity in Istanbul. Theor. Appl. Clim. 2020, 139, 175–190. [Google Scholar] [CrossRef]
  2. Filho, W.L.; Icaza, L.E.; Emanche, V.O.; Al-Amin, A.Q. An Evidence-Based Review of Impacts, Strategies, and Tools to Mitigate Urban Heat Islands. Int. J. Environ. Res. Public Health 2017, 14, 1600. [Google Scholar] [CrossRef] [PubMed] [Green Version]
  3. World Urbanisation Prospects 2012: The 2011 Revision—Highlights; United Nations Department of Economic and Social Affairs, Population Division: New York, NY, USA, 1973; Volume 7, pp. 769–779. [CrossRef]
  4. World Urbanization Prospects 2018: Highlights (ST/ESA/SER.A/421); United Nations, Department of Economic and Social Affairs, Population Division: New York, NY, USA, 2019.
  5. Perpiña Castillo, C.; Kavalov, B.; Jacobs-Crisioni, C.; Baranzelli, C.; Batista e Silva, F.; Lavalle, C. Main Land-Use Patterns in the EU within 2015–2030; JRC115895; European Commission: Brussels, Belgium, 2019. [Google Scholar]
  6. Tu, L.; Qin, Z.; Li, W.; Geng, J.; Yang, L.; Zhao, S.; Zhan, W.; Wang, F. Surface urban heat island effect and its relationship with urban expansion in Nanjing, China. J. Appl. Remote Sens. 2016, 10, 026037. [Google Scholar] [CrossRef] [Green Version]
  7. Chen, G.; Li, X.; Liu, X.; Chen, Y.; Liang, X.; Leng, J.; Xu, X.; Liao, W.; Qiu, Y.; Wu, Q.; et al. Global projections of future urban land expansion under shared socioeconomic pathways. Nat. Commun. 2020, 11, 537. [Google Scholar] [CrossRef] [PubMed] [Green Version]
  8. Huang, K.; Li, X.; Liu, X.; Seto, K.C. Projecting global urban land expansion and heat island intensification through 2050. Environ. Res. Lett. 2019, 14, 114037. [Google Scholar] [CrossRef] [Green Version]
  9. Oke, T. Towards better scientific communication in urban climate. Theor. Appl. Clim. 2006, 84, 179–190. [Google Scholar] [CrossRef]
  10. Imran, H.M.; Kala, J.; Ng, A.W.M.; Muthukumaran, S. Impacts of future urban expansion on urban heat island effects during heatwave events in the city of Melbourne in southeast Australia. Q. J. R. Meteorol. Soc. 2019, 145, 2586–2602. [Google Scholar] [CrossRef] [Green Version]
  11. Barnes, K.B.; Morgan, J.; Roberge, M. Impervious Surfaces and the Quality of Natural and Built Environments; Department of Geography and Environmental Planning, Towson University: Towson, MD, USA, 2001. [Google Scholar]
  12. Haselbach, L.; Boyer, M.; Kevern, J.T.; Schaefer, V.R. Cyclic Heat Island Impacts on Traditional Versus Pervious Concrete Pavement Systems. Transp. Res. Rec. 2011, 2240, 107–115. [Google Scholar] [CrossRef]
  13. Shuster, W.D.; Bonta, J.; Thurston, H.; Warnemuende, E.; Smith, D.R. Impacts of impervious surface on watershed hydrology: A review. Urban Water J. 2005, 2, 263–275. [Google Scholar] [CrossRef]
  14. Gorsevski, V.; Taha, H.; Quattrochi, D.; Luvall, J. Air pollution prevention through urban heat island mitigation: An update on the Urban Heat Island Pilot Project. Proc. ACEEE Summer Study Asilomar CA 1998, 9, 23–32. [Google Scholar]
  15. Taha, H. Urban climates and heat islands: Albedo, evapotranspiration, and anthropogenic heat. Energy Build. 1997, 25, 99–103. [Google Scholar] [CrossRef] [Green Version]
  16. Cao, L.; Li, P.; Zhang, L. Impact of impervious surface on urban heat island in Wuhan, China. In Proceedings of the International Conference on Earth Observation Data Processing and Analysis, Wuhan, China, 28–30 December 2008; Volume 7285. [Google Scholar] [CrossRef]
  17. Sen, S.; Roesler, J.; Ruddell, B.; Middel, A. Cool Pavement Strategies for Urban Heat Island Mitigation in Suburban Phoenix, Arizona. Sustainability 2019, 11, 4452. [Google Scholar] [CrossRef] [Green Version]
  18. Xu, H.; Lin, D.; Tang, F. The impact of impervious surface development on land surface temperature in a subtropical city: Xiamen, China. Int. J. Climatol. 2013, 33, 1873–1883. [Google Scholar] [CrossRef]
  19. Hong, J.W.; Hong, J.; Kwon, E.E.; Yoon, D.K. Temporal dynamics of urban heat island correlated with the socio-economic development over the past half-century in Seoul, Korea. Environ. Pollut. 2019, 254 Pt A, 112934. [Google Scholar] [CrossRef]
  20. Gray, K.A.; Finster, M.E. The Urban Heat Island, Photochemical Smog, and Chicago: Local Features of the Problem and Solution; Northwestern University: Evanston, IL, USA, 1999. [Google Scholar]
  21. Arifwidodo, S.; Chandrasiri, O.; Abdulharis, R.; Kubota, T. Exploring the effects of urban heat island: A case study of two cities in Thailand and Indonesia. APN Sci. Bull. 2019, 9. [Google Scholar] [CrossRef] [Green Version]
  22. Zeiger, S.J.; Jason, A.H. Urban Stormwater Temperature Surges: A Central US Watershed Study. Hydrology 2015, 2, 193–209. [Google Scholar] [CrossRef]
  23. Xie, D.M.; James, W. Modelling Solar Thermal Enrichment of Urban Stormwater. J. Water Manag. Model. 1994, 205–219. [Google Scholar] [CrossRef] [Green Version]
  24. Wijeyesekera, D.C.; Nazari, N.A.R.B.M.; Lim, S.M.; Masirin, M.I.M.; Zainorabidin, A.; Walsh, J. Investigation into the Urban Heat Island Effects from Asphalt Pavements. OIDA Int. J. Sustain. Dev. 2012, 5, 97–118. [Google Scholar]
  25. Akbari, H.; Rose, L.S. Characterising the Fabric of the Urban Environment: A Case Study of Metropolitan Chicago, Illinois; Lawrence Berkeley National Laboratory: Berkeley, CA, USA, 2001.
  26. Cosgrove, A.; Berkelhammer, M. Downwind footprint of an urban heat island on air and lake temperatures. NPJ Clim. Atmos. Sci. 2018, 1, 46. [Google Scholar] [CrossRef] [Green Version]
  27. Tan, J.; Zheng, Y.; Tang, X.; Guo, C.; Li, L.; Song, G.; Zhen, X.; Yuan, D.; Kalkstein, A.J.; Li, F.; et al. The urban heat island and its impact on heat waves and human health in Shanghai. Int. J. Biometeorol. 2010, 54, 75–84. [Google Scholar] [CrossRef]
  28. Shahmohamadi, P.; Che-Ani, A.; Maulud, K.; Tawil, N.; Abdullah, N. The impact of anthropogenic heat on formation of urban heat island and energy consumption balance. Urban Stud. Res. 2011, 497524. [Google Scholar] [CrossRef] [Green Version]
  29. Oke, T.R. Boundary Layer Climates, 2nd ed.; Routledge, Taylor and Francis Group: Cambridge, UK, 1987; p. 435. [Google Scholar]
  30. Georgiadis, T. Urban Climate and Risk; Oxford Handbooks Online; Oxford University Press: Oxford, UK, 2017; pp. 1–29. [Google Scholar]
  31. Hove, L.W.A.; Steeneveld, G.J.; Jacobs, C.M.J.; Heusinkveld, B.G.; Elbers, J.A.; Moors, E.J. Assessment Based on a Literature Review, Recent Meteorological Observations and Datasets Provided by Hobby Meteorologists. Alterra, report 2170. In Exploring the Urban Heat Island Intensity of Dutch Cities; Alterra: Wageningen, The Netherlands, 2011. [Google Scholar] [CrossRef]
  32. Yang, Q.; Huang, X.; Li, J. Assessing the relationship between surface urban heat islands and landscape patterns across climatic zones in China. Sci. Rep. 2017, 7. [Google Scholar] [CrossRef]
  33. Martin, P.; Baudouin, M.B.; Gachon, P. An alternative method to characterise the surface urban heat island. Int. J. Biometeorol. 2015, 59, 849–861. [Google Scholar] [CrossRef]
  34. Soltani, A.; Sharifi, E. Daily variation of urban heat island effect and its correlations to urban greenery: A case study of Adelaide. Front. Archit. Res. 2017, 6, 529–538. [Google Scholar] [CrossRef]
  35. Oke, T.R. The energetic basis of the urban heat island. Q. J. R. Meteorol. Soc. 1982, 108, 1–23. [Google Scholar] [CrossRef]
  36. Oke, T.R. The urban energy balance. Prog. Phys. Geogr. 1988, 12, 471–508. [Google Scholar] [CrossRef]
  37. US Environmental Protection Agency. Urban Heat Island Basics. In Reducing Urban Heat Islands: Compendium of Strategies; US Environmental Protection Agency: Washington, DC, USA, 2008. Available online: https://www.epa.gov/sites/production/files/2017-05/documents/reducing_urban_heat_islands_ch_1.pdf (accessed on 10 December 2020).
  38. Banya, B.; Techato, K.; Ghimire, S.; Chhipi-Shrestha, G.A. Review of Green Roofs to Mitigate Urban Heat Island and Kathmandu Valley in Nepal. Appl. Ecol. Environ. Sci. 2018, 6, 137–152. [Google Scholar]
  39. Núñez Peiró, M.; Sánchez-Guevara Sánchez, C.; González, F.J.N. Source area definition for local climate zone studies. A systematic review. Build. Environ. 2019, 148, 258–285. [Google Scholar] [CrossRef] [Green Version]
  40. Dian, C.; Pongrácz, R.; Dezső, Z.; Bartholy, J. Annual and monthly analysis of surface urban heat island intensity with respect to the local climate zones in Budapest. Urban Clim. 2020, 31, 100573. [Google Scholar] [CrossRef]
  41. Ziter, C.D.; Pedersen, E.J.; Kucharik, C.J.; Turner, M.G. Scale-dependent interactions between tree canopy cover and impervious surfaces reduce daytime urban heat during summer. Proc. Natl. Acad. Sci. USA 2019, 116, 7575–7580. [Google Scholar] [CrossRef] [Green Version]
  42. Stewart, I.D. A systematic review and scientific critique of methodology in modern urban heat island literature. Int. J. Clim. 2011, 31, 200–217. [Google Scholar] [CrossRef]
  43. Oke, T.R. City size and the urban heat island. Atmos. Environ. 1973, 7, 769–779. [Google Scholar] [CrossRef]
  44. Gartland, L. Heat Islands: Understanding and Mitigating Heat in Urban Areas; Earthscan Publications: London, UK, 2008; pp. 57–83. ISBN 1844072509. [Google Scholar]
  45. Li, H. Evaluation of Cool Pavement Strategies for Heat Island Mitigation; UCDAVIS 2012; Sustainable Transporation Center of Institute of Transportation Studies, University of California: Davis, CA, USA, 2012; pp. 1–389. [Google Scholar]
  46. Ryu, Y.; Baik, J. Quantitative Analysis of Factors Contributing to Urban Heat Island Intensity. J. Appl. Meteor. Climatol. 2012, 51, 842–854. [Google Scholar] [CrossRef]
  47. Bernard, J.; Musy, M.; Calmet, I.; Bocher, E.; Kéravec, P. Urban heat island temporal and spatial variations: Empirical modeling from geographical and meteorological data. Build. Environ. 2017, 125, 423–438. [Google Scholar] [CrossRef] [Green Version]
  48. Deilami, K.; Kamruzzaman, M.; Liu, Y. Urban heat island effect: A systematic review of spatio-temporal factors, data, methods, and mitigation measures. Int. J. Appl. Earth Obs. Geoinf. 2018, 67, 30–42. [Google Scholar] [CrossRef]
  49. Rizwan, A.M.; Dennis, L.Y.C.; Liu, C. A review on the generation, determination, and mitigation of Urban Heat Island. J. Environ. Sci. 2008, 20, 120–128. [Google Scholar] [CrossRef]
  50. Busato, F.; Lazzarin, R.M.; Noro, M. Three years of study of the Urban Heat Island in Padua: Experimental results. Sustain. Cities Soc. 2014, 10, 251–258. [Google Scholar] [CrossRef]
  51. Ibrahim, S.H.; Ibrahim, N.I.A.; Wahid, J.; Goh, N.A.; Koesmeri, D.R.A.; Nawi, M.N.M. The Impact of Road Pavement on Urban Heat Island (UHI) Phenomenon. Int. J. Technol. 2018, 9, 1597–1608. [Google Scholar] [CrossRef] [Green Version]
  52. Grimmond, S. Urbanisation and global environmental change: Local effects of urban warming. Geogr. J. 2007, 173, 83–88. [Google Scholar] [CrossRef]
  53. Asaeda, T.; Wake, A. The heating of paved ground and its effects on the near surface atmosphere. Proc. Yokohama Symposium 1993, 467, 39–47. [Google Scholar]
  54. Karlessi, K.; Synnefa, A.; Gaitani, N.; Santamouris, M. Cool Pavements. In Advances in the Development of Cool. Materials for the Built Environment; Bentham Science Publishers: Sharjah, United Arab Emirates, 2013; pp. 104–119. [Google Scholar]
  55. Akbari, H.L.; Rose, S.; Taha, H. Analysing the land cover of an urban environment using high-resolution orthophotos. Landsc. Urban Plan. 2003, 63, 1–14. [Google Scholar] [CrossRef]
  56. Georgakis, C.; Santamouris, M. Determination of the Surface and Canopy Urban Heat Island in Athens Central Zone Using Advanced Monitoring. Climate 2017, 5, 97. [Google Scholar] [CrossRef] [Green Version]
  57. Santamouris, M. Using cool pavements as a mitigation strategy to fight urban heat island—A review of the actual developments. Renew. Sustain. Energy Rev. 2013, 26, 224–240. [Google Scholar] [CrossRef]
  58. Adolphe, L. Conception Thermique du Bâtiment Dans Son Environnement; Institut Supérieur Fluides, Energies, Réseaux, Environnement (ISUPFERE): Paris, France, 2011. [Google Scholar]
  59. Sidler, O. L’inertie Thermique Des Batiments. Consommation Et Confort D’ete En Climat Mediterraneen; ENERTECH: Paris, France, 2003. [Google Scholar]
  60. Stempihar, J.J.; Pourshams-Manzouri, T.; Kaloush, K.E.; Rodezno, M.C. Porous Asphalt Pavement Temperature Effects for Urban Heat Island Analysis. Transp. Res. Rec. 2012, 2293, 123–130. [Google Scholar] [CrossRef]
  61. Hu, L.; Li, Y.; Zou, X.; Du, S.; Liu, Z.; Huang, H. Temperature Characteristics of Porous Portland Cement Concrete during the Hot Summer Session. Adv. Mater. Sci. Eng. 2017, 2058034. [Google Scholar] [CrossRef] [Green Version]
  62. Ferrari, A.; Kubilay, A.; Derome, D.; Carmeliet, J. The use of permeable and reflective pavements as a potential strategy for urban heat island mitigation. Urban Clim. 2020, 31, 100534–100559. [Google Scholar] [CrossRef]
  63. Li, H.; John, H.; Zhesheng, G. Experimental investigation on evaporation rate for enhancing evaporative cooling effect of permeable pavement materials. Constr. Build. Mater. 2014, 65, 367–375. [Google Scholar] [CrossRef]
  64. Li, H.; Harvey, J.; Jones, D. Cooling Effect of Permeable Asphalt Pavement under Dry and Wet Conditions. Transp. Res. Record. 2013, 2372, 97–107. [Google Scholar] [CrossRef]
  65. US Environmental Protection Agency. Cool Pavements. In Reducing Urban Heat Islands: Compendium of Strategies; US Environmental Protection Agency: Washington, DC, USA, 2012. Available online: https://www.epa.gov/sites/production/files/2017-05/documents/reducing_urban_heat_islands_ch_5.pdf (accessed on 10 December 2020).
  66. Bradley, A.V.; Thornes, J.E.; Chapman, L.; Unwin, D.; Roy, M. Modelling spatial and temporal road thermal climatology in rural and urban areas using a GIS. Clim. Res. 2002, 22, 41–55. [Google Scholar] [CrossRef] [Green Version]
  67. Zhang, R.; Jiang, G.; Liang, J. The Albedo of Pervious Cement Concrete Linearly Decreaseswith Porosity. Adv. Mater. Sci. Eng. 2015, 746592. [Google Scholar] [CrossRef] [Green Version]
  68. Gui, J.G.; Phelan, P.E.; Kaloush, K.E.; Golden, J.S. Impact of Pavement Thermophysical Properties on Surface Temperatures. J. Mater. Civ. Eng. 2007, 19, 683–690. [Google Scholar] [CrossRef]
  69. Rehan, R.M. Cool city as a sustainable example of heat island management case study of the coolest city in the world. HBRC J. 2016, 12, 191–204. [Google Scholar] [CrossRef] [Green Version]
  70. Mohajerani, A.; Bakaric, J.; Jeffrey-Bailey, T. The urban heat island effect, its causes, and mitigation, with reference to the thermal properties of asphalt concrete. J. Environ. Manag. 2017, 197, 522–538. [Google Scholar] [CrossRef]
  71. Li, H.; Harvey, J.T.; Holland, T.J.; Kayhanian, M. Corrigendum: The use of reflective and permeable pavements as a potential practice for heat island mitigation and stormwater management. Environ. Res. Lett. 2013, 8, 049501. [Google Scholar] [CrossRef]
  72. Abdel-Ghany, A.M.; Al-Helal, I.M.; Shady, M.R. Human Thermal Comfort and Heat Stress in an Outdoor Urban Arid Environment: A Case Study. Adv. Meteorol. 2013, 693541. [Google Scholar] [CrossRef] [Green Version]
  73. Sodoudi, S.; Shahmohamadi, P.; Vollack, K.; Cubasch, U.; Che-Ani, A.I. Mitigating the Urban Heat Island Effect in Megacity Tehran. Adv. Meteorol. 2014, 547974. [Google Scholar] [CrossRef]
  74. Anderson, G.B.; Bell, M.L. Heat-waves in the United States: Mortality risk during heat waves and effect modification by heat wave characteristics in 43 US Communities. Environ. Health Perspect. 2011, 119, 210–218. [Google Scholar] [CrossRef] [PubMed] [Green Version]
  75. Heaviside, C.; Vardoulakis, S.; Cai, X. Attribution of mortality to the urban heat island during heatwaves in the West Midlands, UK. Environ. Health 2016, 15. [Google Scholar] [CrossRef] [Green Version]
  76. Goggins, W.B.; Chan, E.Y.Y.; Ng, E.; Ren, C.; Chen, L. Effect Modification of the Association between Short-term Meteorological Factors and Mortality by Urban Heat Islands in Hong Kong. PLoS ONE 2012, 7, e38551. [Google Scholar] [CrossRef] [PubMed] [Green Version]
  77. Murage, P.; Hajat, S.; Kovats, R.S. Effect of night-time temperatures on cause and age-specific mortality in London. Environ. Epidemiol. 2017, 1. [Google Scholar] [CrossRef] [PubMed]
  78. Qaid, A.; Bin Lamit, H.; Ossen, D.R.; Nafida, R.; Shahminan, R. Urban heat island and thermal comfort conditions at micro-climate scale in a tropical planned city. Energy Build. 2016, 133, 577–595. [Google Scholar] [CrossRef]
  79. Hove, L.W.A.; Jacobs, C.M.J.; Heusinkveld, B.G.; Elbers, J.A.; Driel Holtslag, B.L. Temporal and spatial variability of urban heat island and thermal comfort within the Rotterdam agglomeration. Build. Environ. 2015, 83, 91–103. [Google Scholar] [CrossRef] [Green Version]
  80. Campbell, S.; Tomas, A.; Remenyi, T.A.; White, C.J.; Johnston, F.H. Heatwave and health impact research: A global review. Health Place 2018, 53, 210–218. [Google Scholar] [CrossRef]
  81. Lee, Y.Y.; Md Din, M.F.; Ponraj, M.; Noor, Z.Z.; Iwao, K.; Chelliapan, S. Overview of urban heat island (UHI) phenomenon toward human thermal comfort. Environ. Eng. Manag. J. 2017, 16, 2097–2111. [Google Scholar]
  82. Zhao, L.; Oppenheimer, M.; Zhu, Q.; Baldwin, J.W.; Ebi, K.L.; Bou-Zeid, E.; Guan, K.; Liu, X. Interactions between urban heat islands and heat waves. Environ. Res. Lett. 2018, 13, 034003. [Google Scholar] [CrossRef]
  83. Sun, T.; Kotthaus, S.; Li, D.; Ward, H.C.; Gao, Z.; Ni, G.H.; Grimmond, C.S.B. Attribution and mitigation of heat wave induced urban heat storage change. Environ. Res. Lett. 2017, 12, 114007. [Google Scholar] [CrossRef] [Green Version]
  84. Golden, J.S. The Built Environment Induced Urban Heat Island Effect in Rapidly Urbanising Arid Regions—A Sustainable Urban Engineering Complexity. Environ. Sci. 2004, 1–4, 321–349. [Google Scholar] [CrossRef]
  85. Akbari, H. Potentials of Urban Heat Island Mitigation. In Proceedings of the International Conference “Passive and Low Energy Cooling for the Built Environment”, Santorini, Greece, 19–21 May 2005; pp. 11–22. [Google Scholar]
  86. Roxon, J.; Ulm, F.J.; Pellenq, R.J.M. Urban heat island impact on state residential energy cost and CO2 emissions in the United States. Urban Clim. 2020, 31. [Google Scholar] [CrossRef]
  87. Santamouris, M.; Papanikolaou, N.; Livada, I.; Koronakis, I.; Georgakis, C.; Argiriou, A.; Assimakopoulos, D.N. On the impact of urban climate on the energy consumption of buildings. Sol. Energy 2001, 70, 201–216. [Google Scholar] [CrossRef]
  88. Santamouris, M. On the energy impact of urban heat island and global warming on buildings. Energy Build. 2014, 82, 100–113. [Google Scholar] [CrossRef]
  89. IPCC. Climate Change 2014: Synthesis Report. Contribution of Working Groups I, II and III to the Fifth Assessment Report of the Intergovernmental Panel on Climate Change; Core Writing Team, Pachauri, R.K., Meyer, L.A., Eds.; IPCC: Geneva, Switzerland, 2014; p. 151. [Google Scholar]
  90. Kolokotroni, M.; Ren, X.; Davies, M.; Mavrogianni, A. London’s urban heat island: Impact on current and future energy consumption in office buildings. Energy Build. 2012, 47, 302–311. [Google Scholar] [CrossRef] [Green Version]
  91. Krause, C.W.; Lockard, B.; Newcomb, T.J.; Kibler, D.; Lohani, V.; Orth, D.J. Predicting Influences of Urban Development on Thermal Habitat in a Warm Water Stream. J. Am. Water Resour. Assoc. 2004, 40, 1645–1658. [Google Scholar] [CrossRef]
  92. Herb, W.R.; Janke, B.; Mohseni, O.; Stefan, H.G. Thermal pollution of streams by runoff from paved surfaces. Hydrol. Process. 2008, 22, 987–999. [Google Scholar] [CrossRef]
  93. James, W.; Verspagen, B. Thermal Enrichment of Stormwater by Urban Pavement. J. Water Manag. Model. 2019, 155–177. [Google Scholar] [CrossRef]
  94. Mujere, N.; Moyce, W. Chapter 12: Climate Change Impacts on Surface Water Quality, Environmental Sustainability and Climate Change Adaptation Strategies, A volume in the Advances in Environmental Engineering and Green Technologies (AEEGT); Ganpat, W., Isaac, W.-A., Eds.; Information Science Reference: Hershey, PA, USA, 2017; pp. 323–341. [Google Scholar]
  95. Nelson, K.C.; Palmer, M.A. Stream water temperature surges under urbanisation and climate change: Data, models, and responses. J. Am. Water Resour. Assoc. 2007, 43, 440–452. [Google Scholar] [CrossRef]
  96. Yang, J.; Wang, Z.; Kaloush, K.E. Unintended Consequences: A research Synthesis Examining the Use of Reflective Pavements to Mitigate the Urban Heat Island Effect. Arizona State University National Center of Excellence for SMART Innovations. 2013. Available online: http://ncesmart.asu.edu/docs/smart/unintended-consequences-1013.pdf (accessed on 11 December 2020).
  97. Martilli, A.; Krayenhoff, E.S.; Nazarian, E.S. Is the Urban Heat Island intensity relevant for heat mitigation studies? Urban Clim. 2020, 31, 100541. [Google Scholar] [CrossRef]
  98. Nuruzzaman, M. Urban Heat Island: Causes, Effects and Mitigation Measures—A Review. Int. J. Environ. Monit. Anal. 2015, 3, 67–73. [Google Scholar] [CrossRef] [Green Version]
  99. Zhou, Y.; Shepherd, J.M. Atlanta’s urban heat island under extreme heat conditions and potential mitigation strategies. Nat. Hazards 2010, 52, 639–668. [Google Scholar] [CrossRef]
  100. Kyriakodis, G.-E.; Santamouris, M. Using reflective pavements to mitigate urban heat island in warm climates—Results from a large-scale urban mitigation project. Urban Clim. 2018, 24, 326–339. [Google Scholar] [CrossRef]
  101. Razzaghmanesh, M.; Beecham, S.; Salemi, T. The role of green roofs in mitigating Urban Heat Island effects in the metropolitan area of Adelaide, South Australia. Urban For. Urban Green. 2016, 15, 89–102. [Google Scholar] [CrossRef]
  102. Razzaghmanesh, M.; Borst, M.; Liu, J.; Ahmed, F.; O’Connor, T.; Selvakumar, A. Air temperature reduction at the base of tree canopies. J. Sustain. Water Built Environ. 2021, 7, 04021010. [Google Scholar] [CrossRef]
  103. Chen, M.Z.; Wei, W.; Wu, S.P. On Cold Materials of Pavement and High-Temperature Performance of Asphalt Concrete. Mater. Sci. Forum 2009, 620–622, 379–382. [Google Scholar] [CrossRef]
  104. Papagiannakis, A.; Kaphle, R. Modification of AC Thermal Properties to Mitigate UHI Effects. J. Test.Eval. 2019, 48, 189–199. [Google Scholar] [CrossRef]
  105. Shi, X.; Rew, Y.; Ivers, E.; Shon, C.-S.; Stenger, E.M.; Park, P. Effects of thermally modified asphalt concrete on pavement temperature, International. Int. J. Pavement Eng. 2019, 20, 669–681. [Google Scholar] [CrossRef]
  106. Wang, Y.; Akbari, H. Development and application of ‘thermal radiative power’ for urban environmental evaluation. Sustain. Cities. Soc. 2015, 14, 316–322. [Google Scholar] [CrossRef]
  107. Pomerantz, M.; Akbari, H.; Chang, S.-C.; Levinson, R.; Pon, B. Examples of Cooler Reflective Streets for Urban Heat-Island Mitigation: Portland Cement Concrete and Chip Seals; Berkeley National Laboratory: Berkeley, CA, USA, 2003; Available online: https://escholarship.org/uc/item/53w2s92d (accessed on 25 December 2020).
  108. Ramírez, A.Z.; Muñoz, C.B. Albedo Effect and Energy Efficiency of Cities, edited book: Sustainable Development Energy. In Engineering and Technologies Manufacturing and Environment; Ghenai, C., Ed.; InTech: London, UK, 2012; ISBN 978-953-51-0165-9. Available online: http://www.intechopen.com/books/sustainable-development-energy-engineering-and-technologiesmanufacturing-and-environment/albedo-effect-and-energy-efficiency-of-buildings (accessed on 25 December 2020).
  109. Wong, W.H.; Jusuf, S.K. Urban heat island and mitigation strategies at city and building level. In Advances in the Development of Cool Materials for the Built Environment; Bentham Science Publishers: Sharjah, United Arab Emirates, 2012; pp. 3–32. [Google Scholar]
  110. Akbari, H.; Matthews, H.D.; Seto, D. The long-term effect of increasing the albedo of urban areas. Environ. Res. Lett. 2012, 7, 024004. [Google Scholar] [CrossRef]
  111. Xu, X.; Jafari, H.A.; Gregory, J.; Norford, L.; Kirchain, R. An integrated model for quantifying the impacts of pavement albedo and urban morphology on building energy demand. Energy Build. 2020, 211, 109759. [Google Scholar] [CrossRef]
  112. Yang, J.; Wang, Z.-H.; Kaloush, K.E. Environmental impacts of reflective materials: Is high albedo a ‘silver bullet’ for mitigating urban heat island? Renew. Sustain. Energy Rev. 2015, 47, 830–843. [Google Scholar] [CrossRef] [Green Version]
  113. Sailor, D.J. Mitigation of urban heat islands—Recent progress and future prospects. In 6th Symposium on the Urban Environment and Forum on Managing Our Physical and Natural Resources; American Meteorological Society: Boston, MA, USA, 2006. [Google Scholar]
  114. Kinouchi, T.; Yoshinaka, T.; Fukae, N.; Kanda, M. Development of cool pavement with dark colored high albedo coating. Target 2003, 50, 40. [Google Scholar]
  115. Hendel, M.; Parison, S.; Grados, A.; Royon, L. Which pavement structures are best suited to limiting the UHI effect? A laboratory-scale study of Parisian pavement structures. Build. Environ. 2018, 144, 216–229. [Google Scholar] [CrossRef] [Green Version]
  116. Yaghoobian, N.; Kleissl, J. Effect of reflective pavements on building energy use. Urban Clim. 2012, 2, 25–42. [Google Scholar] [CrossRef] [Green Version]
  117. Thiagarajan, M.; Newman, G.; Van Zandt, S. The Projected Impact of a Neighborhood-scaled Green Infrastructure Retrofit. Sustainability 2018, 10, 3665. [Google Scholar] [CrossRef] [PubMed] [Green Version]
  118. Van Dam, T.; Harvey, J.T.; Muench, S.T.; Smith, K.D.; Snyder, M.B.; Al-Qadi, I.L.; Ozer, H.; Meijer, J.; Ram, P.V.; Roesler, J.R.; et al. Towards Sustainable Pavement Systems: A Reference Document; Report FHWA-HIF-15-002; Federal Highway Administration: Washington, DC, USA, 2015.
  119. Kuruppu, U.; Rahman, A.; Rahman, M.A. Permeable pavement as a stormwater best management practice: A review and discussion. Environ. Earth Sci. 2019, 78, 327. [Google Scholar] [CrossRef]
  120. Ball, E.; Rankin, K. The hydrological performance of a permeable pavement. Urban Water J. 2010, 7, 79–90. [Google Scholar] [CrossRef] [Green Version]
  121. Antunes, L.N.; Ghisi, E.; Thives, L.P. Permeable Pavements Life Cycle Assessment: A Literature Review. Water 2018, 10, 1575. [Google Scholar] [CrossRef] [Green Version]
  122. Jayakaran, A.D.; Knappenberger, T.; Stark, J.D.; Hinman, C. Remediation of Stormwater Pollutants by Porous Asphalt Pavement. Water 2019, 11, 520. [Google Scholar] [CrossRef] [Green Version]
  123. Wang, J.; Meng, Q.; Tan, K.; Zhang, L.; Zhang, Y. Experimental investigation on the influence of evaporative cooling of permeable pavements on outdoor thermal environment. Build. Environ. 2018, 140, 184–193. [Google Scholar] [CrossRef]
  124. Starke, P.; Gobel, P.; Coldewey, W.G. Urban evaporation rates for water-permeable pavements. Water Sci. Technol. 2010, 62, 1161–1169. [Google Scholar] [CrossRef]
  125. Kevern, J.T.; Haselbach, L.; Schaefer, V.R. Hot weather comparative heat balances in pervious concrete and impervious concrete pavement systems. J. Heat Isl. Inst. Int. 2012, 7, 2. [Google Scholar]
  126. Cheng, Y.Y.; Lo, S.L.; Ho, C.C.; Lin, J.Y.; Yu, S.L. Field Testing of Porous Pavement Performance on Runoff and Temperature Control in Taipei City. Water 2019, 11, 2635. [Google Scholar] [CrossRef] [Green Version]
  127. Wang, J.; Meng, Q.; Zhang, L.; Zhang, Y.; He, B.-J.; Zheng, S.; Santamouris, M. Impacts of the water absorption capability on the evaporative cooling effect of pervious paving materials. Build. Environ. 2019, 151, 187–197. [Google Scholar] [CrossRef]
  128. Qin, Y.; Hiller, J.E. Water availability near the surface dominates the evaporation of pervious concrete. Constr. Build. Mater. 2016, 111, 77–84. [Google Scholar] [CrossRef]
  129. Coseo, P.; Larsen, L. Cooling the Heat Island in Compact Urban Environments: The Effectiveness of Chicago’s Green Alley Program. Procedia Eng. 2015, 118, 691–710. [Google Scholar] [CrossRef] [Green Version]
  130. Karasawa, A.; Toriiminami, K.; Ezumi, N.; Kamaya, K. Evaluation of performance of water-retentive concrete block pavements. In Proceedings of the 8th International Conference on Concrete Block Paving, San Francisco, CA USA, 6–8 November 2006; pp. 233–242. [Google Scholar]
  131. Liu, Y.; Tian, L.; Hangyu, P. A new structure of permeable pavement for mitigating urban heat island. Sci. Total Environ. 2018, 634, 1119–1125. [Google Scholar] [CrossRef]
Figure 1. Three scales, mesoscale (a), local scale (b) and microscale (c), used to distinguish atmospheric processes in the urban area and the atmospheric layers: planetary boundary layer (PBL), the urban boundary layer (UBL), urban canopy layer (UCL) (Modified after Núñez Peiró et al.) [39].
Civileng 02 00026 g001
Figure 2. The causes of the Urban Heat Island effect [50].
Civileng 02 00026 g002
Figure 3. Pavement surface energy balance (Modified after Hu et al.) [61].
Civileng 02 00026 g003
Figure 4. The relation between L* value and reduction of pavement surface temperatures (Black circles indicate high-quality coatings in terms of brightness and albedo) [114].
Civileng 02 00026 g004
Figure 5. Surface temperature of six types of ground cover materials [96].
Civileng 02 00026 g005
Figure 6. Air temperature at 5 feet over six ground cover materials [96].
Civileng 02 00026 g006
Figure 7. Structure of studied pavement samples [115].
Civileng 02 00026 g007
Figure 8. The ratio of heat flow to irradiance as a function of solar transmission index (Modified after Hendel et al.) [115].
Civileng 02 00026 g008
Figure 9. Cross-section of a typical permeable pavement (Modified after Zhang et al.) [67].
Civileng 02 00026 g009
Figure 10. Thermal performance of permeable pavement (B3) with and without irrigation compared to the impermeable pavement (B1) for four days in July 2012 (the time unit above mm/dd indicates hours with 00 representing midnight) [71].
Civileng 02 00026 g010
Figure 11. Thermal evolution of concrete at midnight, (a) temperature evolution, and (b) release of sensible heat [128].
Civileng 02 00026 g011
Figure 12. Relation between evaporation rate from the surface and road surface temperature on the day after spraying [130].
Civileng 02 00026 g012
Figure 13. Relation between absorption height and road surface temperature on the day after the rain [130].
Civileng 02 00026 g013
Figure 14. Figuline pavements mechanism [131].
Civileng 02 00026 g014
Figure 15. Surface temperature variations of figuline (F1) and conventional concrete pavements (C1) with capillary columns when compared with their controls (F0 and C0) without capillary columns [131].
Civileng 02 00026 g015
Table 1. Potential causes of UHI [35].
Altered Energy Balance Terms Leading to a Positive Thermal AnomalyFeatures of Urbanization Underlying Energy Balance Changes
A. Canopy layer
1. Increased absorption of short-wave radiationCanyon geometry—increased surface area and multiple reflections
2. Increased long-wave radiation from the skyAir pollution—greater absorption and re-emission
3. Decreased long-wave radiation lossCanyon geometry—reduction of sky view factor
4. Anthropogenic heat sourceBuilding and traffic heat losses
5. Increased sensible heat storageConstruction materials—increased thermal admittance
6. Decreased evapotranspirationConstruction materials—increased imperviousness
7. Decreased total turbulent heat transportCanyon geometry—reduction of wind speed
B. Boundary layer
1. Increased absorption of short-wave radiationAir pollution—increased aerosol absorption
2. Anthropogenic heat sourceChimney and stack heat losses
3. Increased sensible heat input-entrainment from belowCanopy heat island—increased heat flux from canopy layer and roofs
4. Increased sensible heat input-entrainment from aboveHeat island, roughness—increased turbulent Entrainment
Table 2. Thermal properties of materials used in building and construction (Modified after Oke) [29].
Material
(Dry State)
RemarksDensity
(kg m−3 × 10³)
Specific Heat
(J kg−1 K−1 × 10³)
Heat Capacity
(J m−3K−1 × 10⁶)
Thermal Conductivity
(W m−1K−1)
Thermal Diffusivity
(m2s−1 × 10⁻⁶)
Thermal Admittance
(J m−2s−1/2)
Asphalt 2.110.921.940.750.381205
ConcreteAerated0.320.880.280.080.29150
Dense2.400.882.111.510.721785
StoneAv.2.680.842.252.194.932220
BrickAv.1.830.751.370.830.611065
Clay tiles 1.920.921.770.840.471220
Table 3. Typical values for emissivity and albedo (Modified after Bradley et al.) [66].
SurfaceAlbedoEmissivity
Asphalt0.1250.95
Concrete0.2250.805
Brick0.30.91
Stone0.2750.9
Glass0.3050.895
Wood0.150.9
Tile0.2250.9
Tar roof0.130.92
Forest0.150.97
Water0.50.97
Publisher’s Note: MDPI stays neutral with regard to jurisdictional claims in published maps and institutional affiliations.

