Article

Saccharide-Derived Zinc Oxide Nanoparticles with High Photocatalytic Activity for Water Decontamination and Sanitation

by
Kazi Afroza Sultana
1,
Javier Hernandez Ortega
1,
Md Tariqul Islam
1,
Zayra N. Dorado
2,
Bonifacio Alvarado-Tenorio
3,4,
Ignacio Rene Galindo-Esquivel
4 and
Juan C. Noveron
1,*
1
Department of Chemistry and Biochemistry, The University of Texas at El Paso, 500 West University Avenue, El Paso, TX 79902, USA
2
Department of Metallurgical & Materials Engineering, The University of Texas at El Paso, 500 West University Avenue, El Paso, TX 79902, USA
3
Instituto de Ciencias Biomédicas, Universidad Autónoma de Ciudad Juárez, Chihuahua 32310, Mexico
4
División de Ciencias Naturales y Exactas, Universidad de Guanajuato, Noria Alta s/n, Guanajuato 36040, Mexico
*
Author to whom correspondence should be addressed.
Sustain. Chem. 2023, 4(4), 321-338; https://doi.org/10.3390/suschem4040023
Submission received: 27 May 2023 / Revised: 23 October 2023 / Accepted: 25 October 2023 / Published: 3 November 2023

Abstract

:
Zinc oxide nanoparticles (ZnO NPs) with a high photocatalytic performance were prepared by using the aerobic combustion of saccharides such as glucose, fructose, dextrin, and starch with zinc nitrate. The ZnO NPs were characterized by using transmission electron microscopy (TEM), scanning electron microscopy (SEM), energy-dispersive X-ray scattering spectroscopy (EDX), X-ray powder diffraction (XRPD), and UV-vis spectroscopy. The TEM images revealed that the ZnO NPs have sizes ranging from ~20 to 35 nm with a bandgap of ~3.32 eV. The XRPD pattern revealed the hexagonal wurtzite crystalline structure of the ZnO NPs. The photocatalytic properties of the ZnO NPs were studied by the photocatalytic degradation of methyl orange (MO) in deionized water (DIW) and simulated fresh drinking water (FDW) under ultraviolet light (UV-B) and sunlight illumination. The terephthalic acid photoluminescence technique was also used to study the generation of a hydroxyl radical (•OH) by ZnO NPs. The saccharide-derived ZnO NPs exhibited higher photocatalytic activity than the nonsaccharide-derived ZnO NPs. Varying the type of saccharides used during the calcination had some effect on the degree of the catalytic enhancement.

1. Introduction

Nanomaterials possess fascinating physical [1], chemical [2], and biological properties [3] that can help solve critical scientific and engineering problems today. They have received significant attention in a broad spectrum of applications, including but not limited to chemical catalysis [4], optics [5], photovoltaics [6], energy storage [7], sensors [8], electronics [9], biological and biomedical applications [10], and environmental remediation [11]. Among various nanomaterials, zinc oxide (ZnO) is the most extensively used material owing to its physicochemical properties, stability, availability, nontoxicity, and low cost [12,13]. As a photocatalyst, ZnO NPs can degrade organic pollutants in water [14,15]. However, nanoscopic ZnO (size 1–100 nm) is more suitable for photocatalytic applications than macroscopic ZnO. Nanoscopic ZnO has a higher specific surface area, surface energy, and a suitable bandgap for separating the electron/hole that eventually allows for additional activation sites for the interaction and degradation of the pollutant [16,17]. The degradation of organic contaminants by photocatalysis happens on the surface of the zinc oxide nanoparticles via redox processes. It is initiated by the electronic excitation between the valence and conduction bands [18]. Photocatalytic degradation is beneficial over other chemical processes as it is chemical-free and does not give rise to any other contamination.
Several strategies have been followed to synthesize photocatalytic ZnO NPs with various morphologies, such as nanorods [19], nanotubes [20], nanobelts, nanowires [21], and nanomushrooms [22]. Commonly employed techniques for synthesizing ZnO NPs include ball milling [23], combustion synthesis [24,25], the sol-gel process [26], hydrothermal [27,28] and chemical vapor deposition [29,30]. However, most techniques need expensive chemicals, complex approaches, and a long response time. Methods that produce ZnO NPs with readily available materials from biomass and use facile, cost-effective procedures are highly warranted. They can potentially enable local manufacturing enterprises, mainly when the products exhibit high catalytic activity.
The calcination synthesis of metal oxide nanoparticles in citric acid has been reported previously [31]. This synthesis involved a mixture of the metal salt and the organic compound that acts as a reducer at high temperatures (500 °C) in the presence of air. We reported a similar method using zinc nitrate as the oxidizer and sawdust as an organic compound [32].
Modern dyes are extensively used in textile dyeing, cosmetics, pharmaceuticals, papermaking, food industries, and so on [33,34]. Many of these dyes and their degradation products are toxic and can cause severe health conditions such as a respiratory tract infection, vomiting, pain, hemorrhage, and other diseases [35,36]. Most of these dyes are not readily degraded by light, heat, and the biological agents available in nature [37,38]. So, removing these dyes from water bodies is essential before discharging them into the environment.
Methyl orange (MO) is a cationic dye with many applications in food, cosmetic, textile, medicine, and leather-based industries [39,40]. The release of MO into the aquatic environment from various sources poses toxic effects on living beings, considering that this dye is genotoxic, carcinogenic, mutagenic, and resistant to degradation and remediation [41]. The persistent pollution of these water sources caused by the dye poses a significant threat to the ecological balance of the environment, and developing strategies for its elimination is necessary [42,43]. Therefore, the degradation or removal of MO is essential to prevent its adverse effects. Various physical, chemical, and biological methods have recently been used to eliminate MO from water [44,45]. However, photocatalytic advanced oxidation processes (AOP) have recently drawn considerable scientific interest in degrading organic pollutants effectively from an aqueous environment due to their advantages over other approaches such as adsorption, coagulation, precipitation, filtration, and so on [46]. Photocatalytic oxidative degradation is the chemical-free method for removing dyes and pollutants from the water. This process no longer produces any other impurities and can degrade organic contaminants to mineralization, whereas other techniques move pollution from one area to another [47].
This report describes a facile method to prepare ZnO NPs by combusting a saccharide, such as glucose, fructose, dextrin, or starch, with zinc nitrate. Four highly active ZnO NP samples named Glucose-ZnO, Fructose-ZnO, Dextrin-ZnO, and Starch-ZnO were prepared. The photocatalytic properties of the ZnO NPs were studied by using their ability to decompose MO in DIW (deionized water) and simulated FDW (fresh drinking water) under UV light and sunlight irradiation. A fluorescence test evaluated the photocatalytic hydroxyl radicals (•OH) generation by the ZnO NPs [48].

2. Materials and Methods

2.1. Materials

Glucose (C6H12O6 ≥ 99.5%), fructose (C6H12O6 ≥ 99%), dextrin ((C6H10O5)n ≥ 99.5%), starch ((C6H10O5)n ≥ 95%), zinc nitrate hexahydrate (Zn (NO3)2·6H2O ≥ 98%), terephthalic acid (C8H6dO4 = 98%), and sodium hydroxide (NaOH ≥ 98%) were purchased from Sigma Aldrich. Methyl orange (C14H15N3O3S > 98.0%) was purchased from TCI AMERICA. The salts used for the preparation of the simulated fresh drinking water matrices such as sodium bicarbonate (NaHCO3, 99.5–100.5%), calcium chloride dihydrate (CaCl2·2H2O, ≥99.5%), magnesium sulfate heptahydrate (MgSO4·7H2O, ≥98%), sodium silicate nonahydrate (Na2SiO3·9H2O, ≥98%), sodium nitrate (NaNO3, ≥99%), sodium fluoride (NaF, ≥99%), and sodium phosphate hydrate (NaH2PO4·H2O, ≥98%) were purchased from Sigma Aldrich, St. Louis, MI, USA.
The Analogue Hot Plate Stirrer (Fisher Scientific 11-600-49sh Isotemp, Hampton, NH, USA) was used to synthesize the ZnO NPs as a heating source. An ultraviolet box reactor (UVP Ultraviolet Cross-linker, Model CL-1000) containing UV-B fluorescent tube lamps was used for the photocatalytic degradation of MO and hydroxyl radical generation. The intensity of light was measured by using a digital Light Meter LX1330B, and the intensity of the light on the surface of the reaction was measured to be ~22,000 lux for the UV light in the box reactor and ~100,000 lux for natural sunlight. Syringe filters with a 0.45 μm pore size were obtained from VWR to filter the reaction mixture for the UV–visible spectroscopic analysis. Milli-Q water (>18.20 MΩ·cm resistivity) was obtained from the Milli-Q (Advantage A-10) water filter system. The simulated fresh drinking water (FDW) was prepared by dissolving 252 mg/L NaHCO3, 147 mg/L CaCl2·2H2O, 124 mg/L MgSO4·7H2O, 95 mg/L Na2SiO3·9H2O, 12 mg/L NaNO3, 2.2 mg/L NaF, and 0.18 mg/L NaH2PO4·H2O in the DIW, which was formulated in a previous report [48].

2.2. Chemical–Physical Characterization of ZnO NPs

Scanning electron microscopy (SEM) images and energy-dispersive X-ray (EDX) experiments were conducted by using the Hitachi SU3500 microscope, where carbon tape was used as a substrate for sample analysis. Transmission electron microscopy (TEM) experiments were performed by using a Hitachi H-7650 microscope with an acceleration voltage of 80 kV. A carbon-filmed copper grid (200 mesh) was deposited with a suspension of ZnO NPs (0.2 mg/mL) in water and air-dried before imaging. A Bruker D8 Discover X-ray diffractometer equipped with Cu Kα radiation (λ = 1.5418 Å) operating at 40 Kv and 30 mA was used to obtain the ZnO nanoparticle’s X-ray diffraction (XRD) pattern. The diffraction patterns of the samples were collected at room temperature within a detector angle (2θ) range between 10 and 80°. The X-ray photoelectron spectroscopy (XPS) analysis was performed with Thermo Scientific™ K-alpha™ equipment using a monochromated Al Kα X-ray source. The survey spectra were obtained with a 130 eV pass energy, while high-resolution analyses for specific core levels were performed at 20 eV pass energy. An argon ions flood gun was used to avert surface charging. All the binding energies were corrected with reference to carbon 1s at 284.8 eV. The UV–visible spectroscopic analysis was performed on the Agilent Cary 50 Conc UV–visible Spectrophotometer. A standard quartz cuvette (10 mm path length) was used as the sample holder for the UV-vis studies.
The determination of the ZnO NP crystal size was executed by utilizing an X-ray diffraction (XRD) data analysis in accordance with the Debye–Scherrer Equation (1).
Debye−Scherrer’s Equation, d = kλ/βcosθ
Initially, the XRD pattern underwent rigorous data processing involving nonlinear curve fitting, precisely Gaussian fitting, to extract the full width at half maximum (FWHM) values. Iterative procedures were applied to all the data points until convergence was achieved. The obtained FWHM values, expressed in radians, along with the peak position information extracted from the XRD pattern were subsequently employed in the Scherrer equation for the crystal size determination. The wavelength (λ) utilized by the XRD instrument was consistent with that of a copper source (Cu Kα) at 1.5406 Å. The Scherrer constant (k) applicable to spherical crystalline particles was determined to be 0.9; d is the crystallite size and β is the full width at half maximum of the most intense (101) diffraction peak.

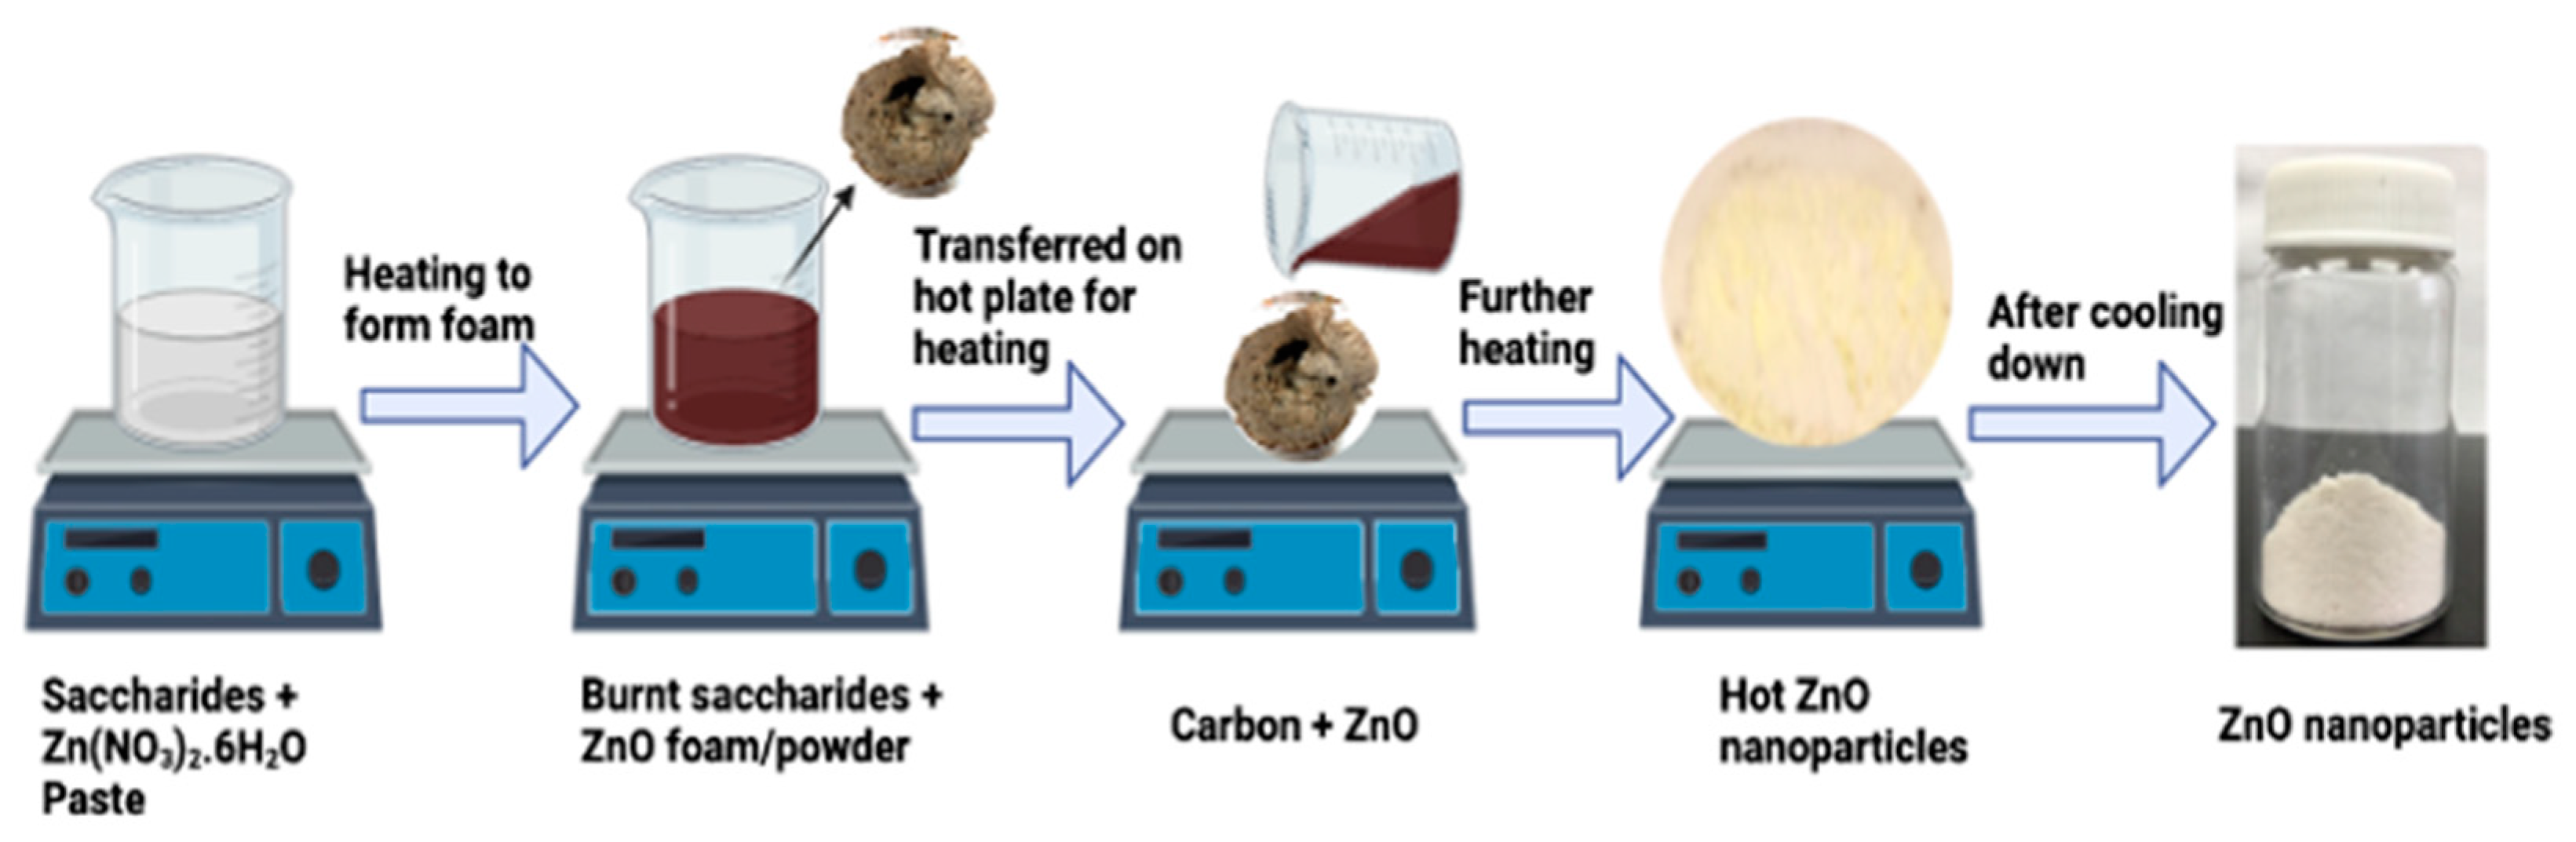
2.3. Synthesis of ZnO NPs

Four different ZnO nanoparticle samples (Glucose-ZnO, Fructose-ZnO, Dextrin-ZnO, and Starch-ZnO) were synthesized by using a similar experimental procedure. For example, the synthesis of Glucose-ZnO is explained here: Glucose (1200 mg (3.51 mmol)), Zn (NO3)2·6H2O (3569.88 mg (12 mmol)), and 2 mL of DIW were thoroughly mixed in a 150 mL glass beaker. The beaker was then placed on a hot plate, which was preheated to its maximum capacity of ~550 °C, and the temperature on the bare surface of the hot plate was ~500 °C, which was confirmed with an IR temperature gun. Within a minute of heating or burning, the mixture on the hot plate turned into a thick/viscous solution and instantly decomposed into a blackish-brown foam while producing yellowish-brown gases. The hot plate with blackish-brown powder/foam was put in a well-ventilated fume hood as the NO2 and NOx gases formed due to the breakdown of the zinc nitrate salt. Afterward, the form turned into a powder/foam that was slowly poured with a spatula on the hot plate’s surface with the minimum spreading of powder or foam on the hot plate. During heating, the blackish-colored powder became a yellowish-white-colored powder of ZnO NPs. After cooling, the ZnO NP powder became white. The white ZnO NPs were collected in a vial with a spatula and were utilized for the characterization and photocatalytic studies.
A control ZnO sample (named ZnO-control) was also obtained by using the same experimental procedure except without using any saccharides in the reaction mixture. In detail, the ZnO-control was synthesized by burning a mixture of 3569.88 mg (12 mmol) of Zn (NO3)2·6H2O and 2 mL of DIW (without using a saccharide) at ~500 °C in a 150 mL glass beaker on the same hot plate.

2.4. Methyl Orange (MO) Photodegradation Reaction Procedure

The performance of the ZnO NPs towards the photodegradation of MO in DIW and simulated fresh drinking water was studied under UV and sunlight illumination. A 5 ppm (mg/L) MO solution was used for the photodegradation test in a 250 mL glass beaker. For effective photodegradation under UV light, 30 mg of the ZnO NPs was added to a 30 mL MO (5 ppm) solution, and the mixture underwent bath sonication for 15 min in the dark to reach the adsorption–desorption equilibrium between the MO dye and ZnO photocatalyst. Afterward, the mixture (the MO dye and ZnO photocatalyst) was placed under UV light in a box reactor for 35 min. While the mixture was under the UV light, a 1 mL sample was drawn every 5 min. The same study was conducted under direct natural sunlight. In total, 30 mg of the ZnO NPs was added to a 30 mL MO (5 ppm) solution, the mixture underwent bath sonication for 5 min, and then it was placed under natural sunlight for 18 min. Afterward, a 1 mL sample was drawn every 3 min and filtered with a syringe filter (0.45μm pore size) for UV-vis spectroscopic analysis. Finally, the MO degradation rate was monitored by observing the absorbance of MO at a 464 nm wavelength.

2.5. Fluorescence Test for the Hydroxyl Radicals Detection

A 5 × 10⁻³ M stock solution of sodium terephthalate was prepared by adding terephthalic acid with a stoichiometric amount of sodium hydroxide to the DIW. A total of 30 mL of the sodium terephthalate solution was added to a glass beaker from the stock solution and photoreacted with the ZnO NPs under UV light. About 1 mL of the sample was drawn and filtered with the 0.45 μm pore size syringe filters every 5 min during photocatalysis. The fluorescence spectrum was obtained with an excitation wavelength of 315 nm, and to determine the qualitative amount of hydroxyl radicals in the solution, the fluorescence emission intensity at 425 nm was utilized.

3. Results and Discussion

3.1. Synthesis of the ZnO NPs

The ZnO NPs were prepared by heating Zn (NO3)2·6H2O in the presence of different poly- or monosaccharides at ~500 °C, as shown in Scheme 1, and similarly to our previously reported method with sucrose [49].The poly- or monosaccharides actively participated in the reaction along with dioxygen from the air. The zinc salt participated as a noninnocent spectator, possibly forming a complex with the saccharides during the reactions. The saccharides decompose to form carbon intermediates and gases and are possibly catalyzed by the Zn(II) salt. The colors of the intermediates were black and changed to yellow until reaching a white color in the end. This synthesis produces the ZnO nanoparticles derived from the various saccharides and is facile and scalable.

3.2. ZnO NPs Characterization

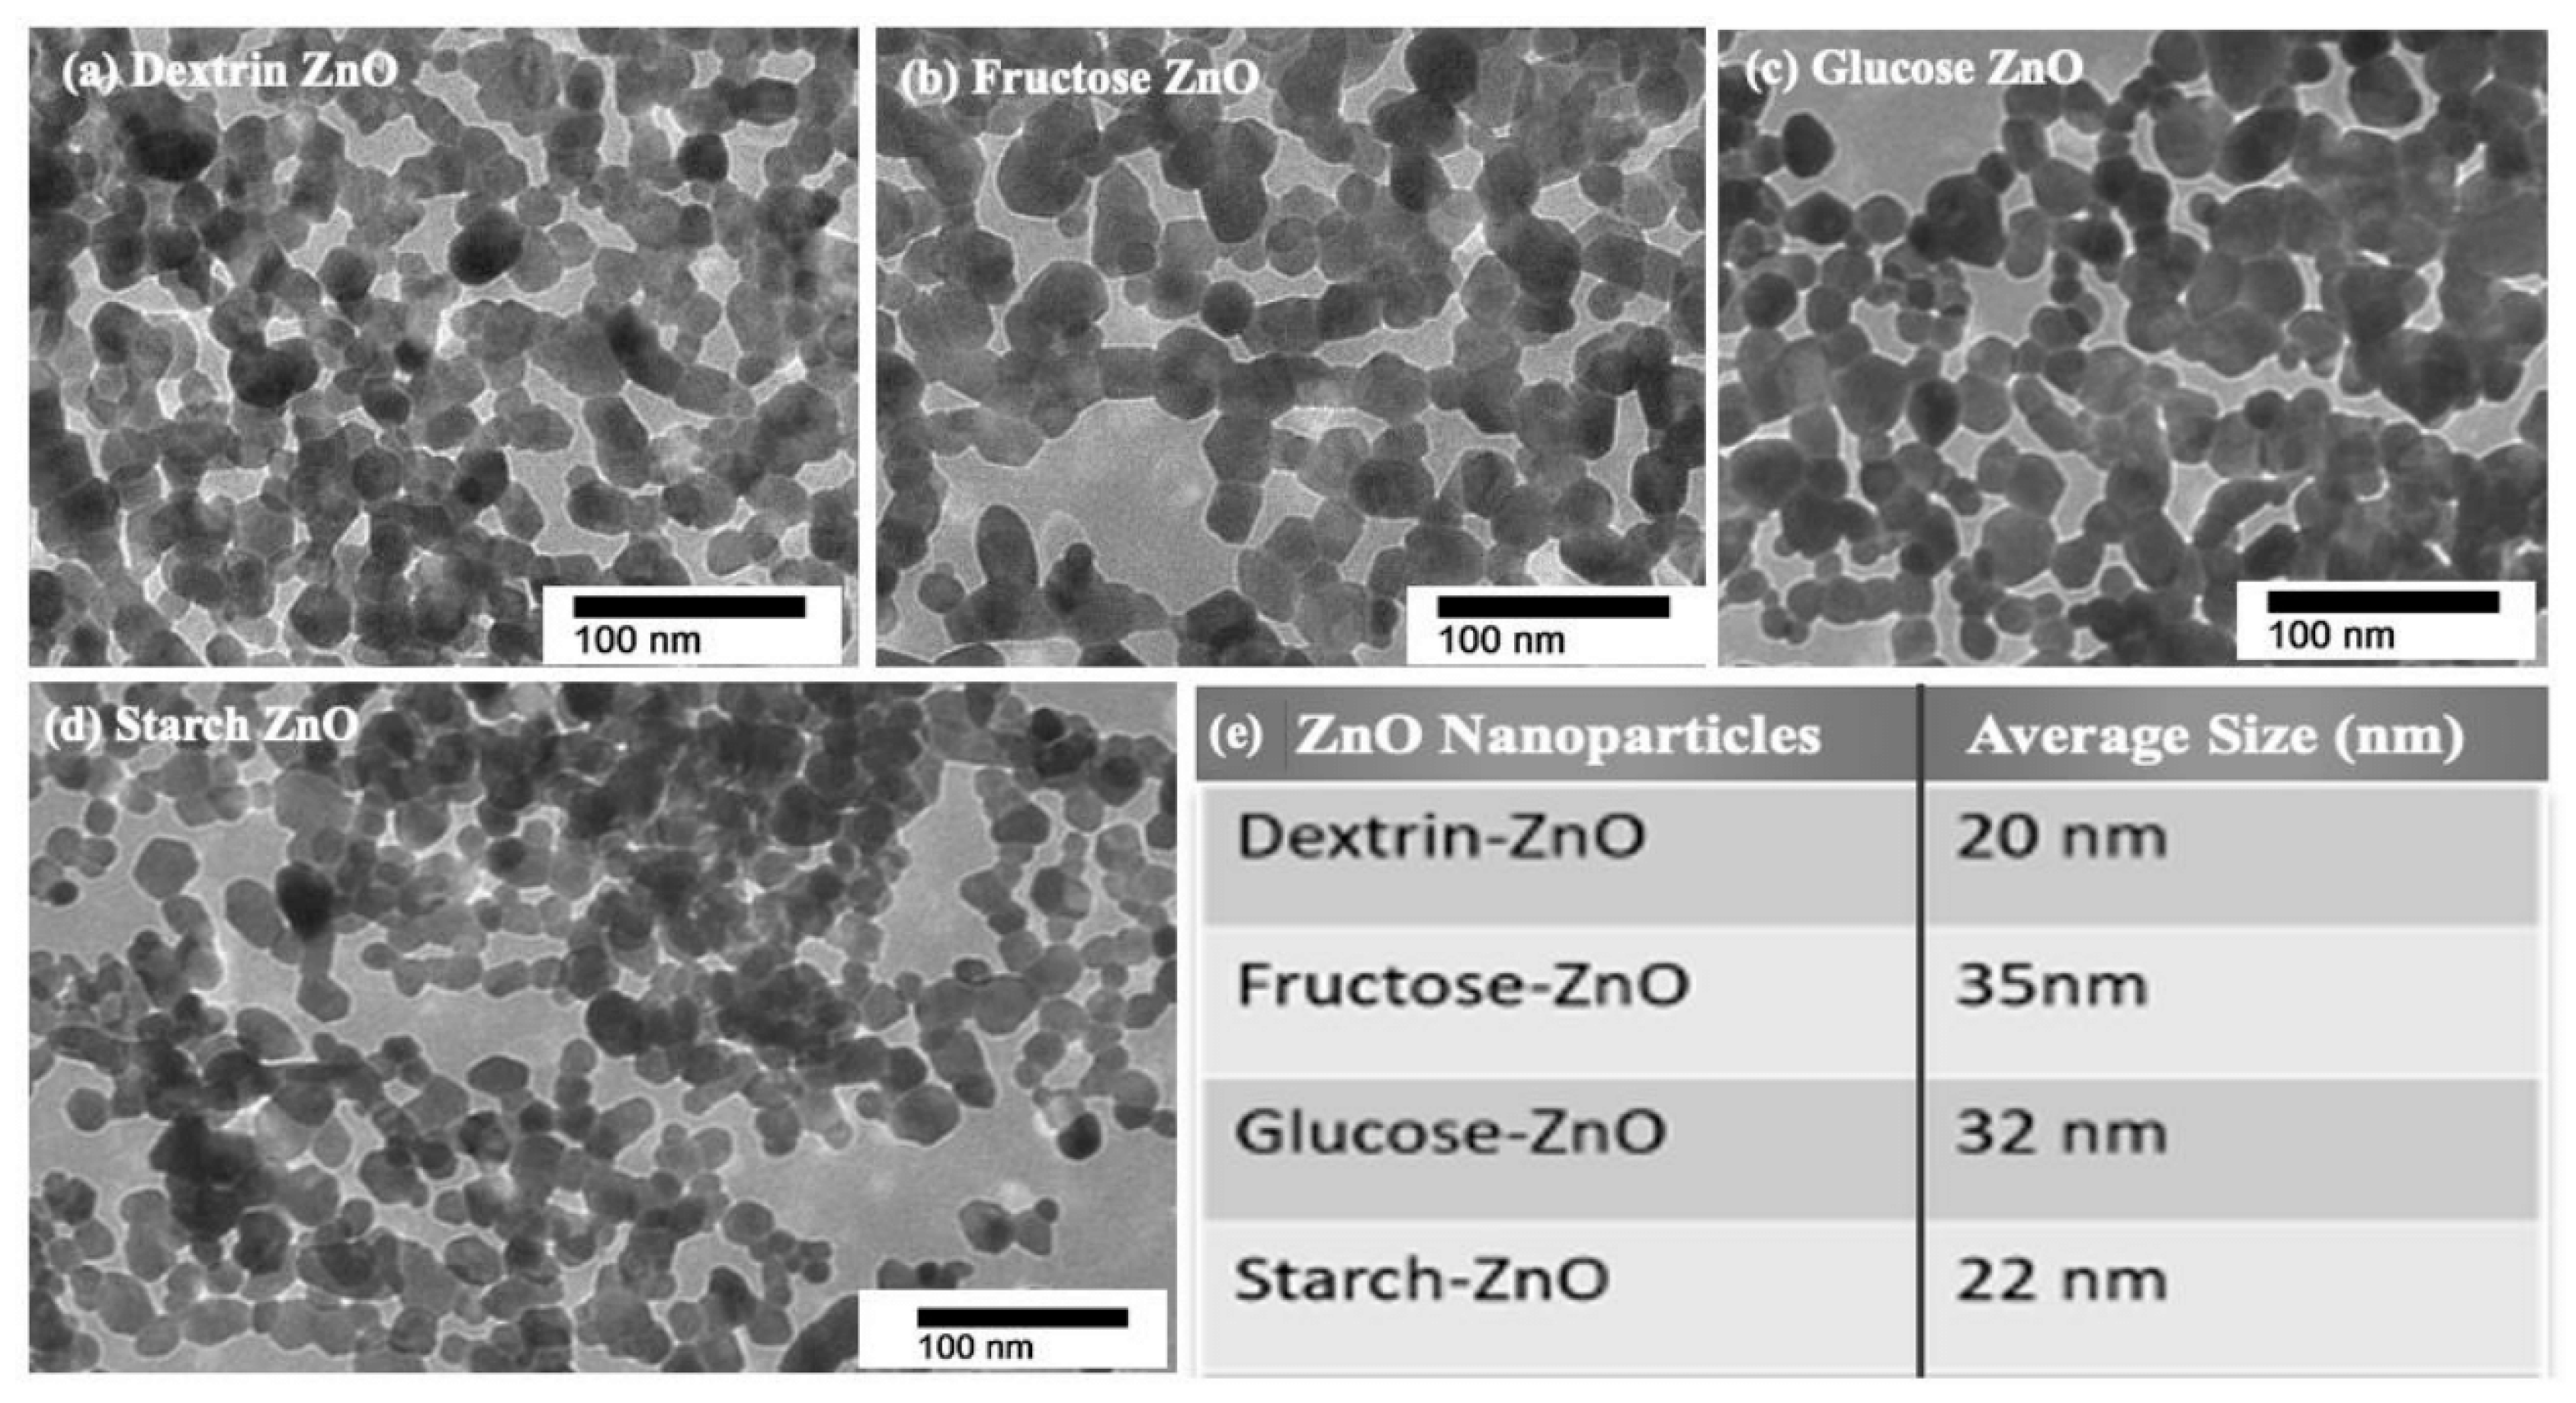
3.2.1. TEM Analysis of the ZnO NPs

The results of the TEM images suggested that the ZnO NPs (Dextrin-ZnO, Fructose-ZnO, Glucose-ZnO, and Starch-ZnO) were of different sizes and shapes with smooth surfaces, Figure 1a–d. The TEM images also revealed that the particles tended to interconnect and overlap to form aggregates. The formation of aggregates and clusters could be indicated by the high surface energy and the high surface area of the ZnO NPs [50]. Using the ImageJ software, measuring the 100 randomly picked nanoparticle sizes, the ZnO NPs’ average size was nanometric with a mean diameter of about 20 nm for Dextrin-ZnO, 35 nm for Fructose-ZnO, 32 nm for Glucose-ZnO, and 22 nm for Starch-ZnO, Figure 1e.

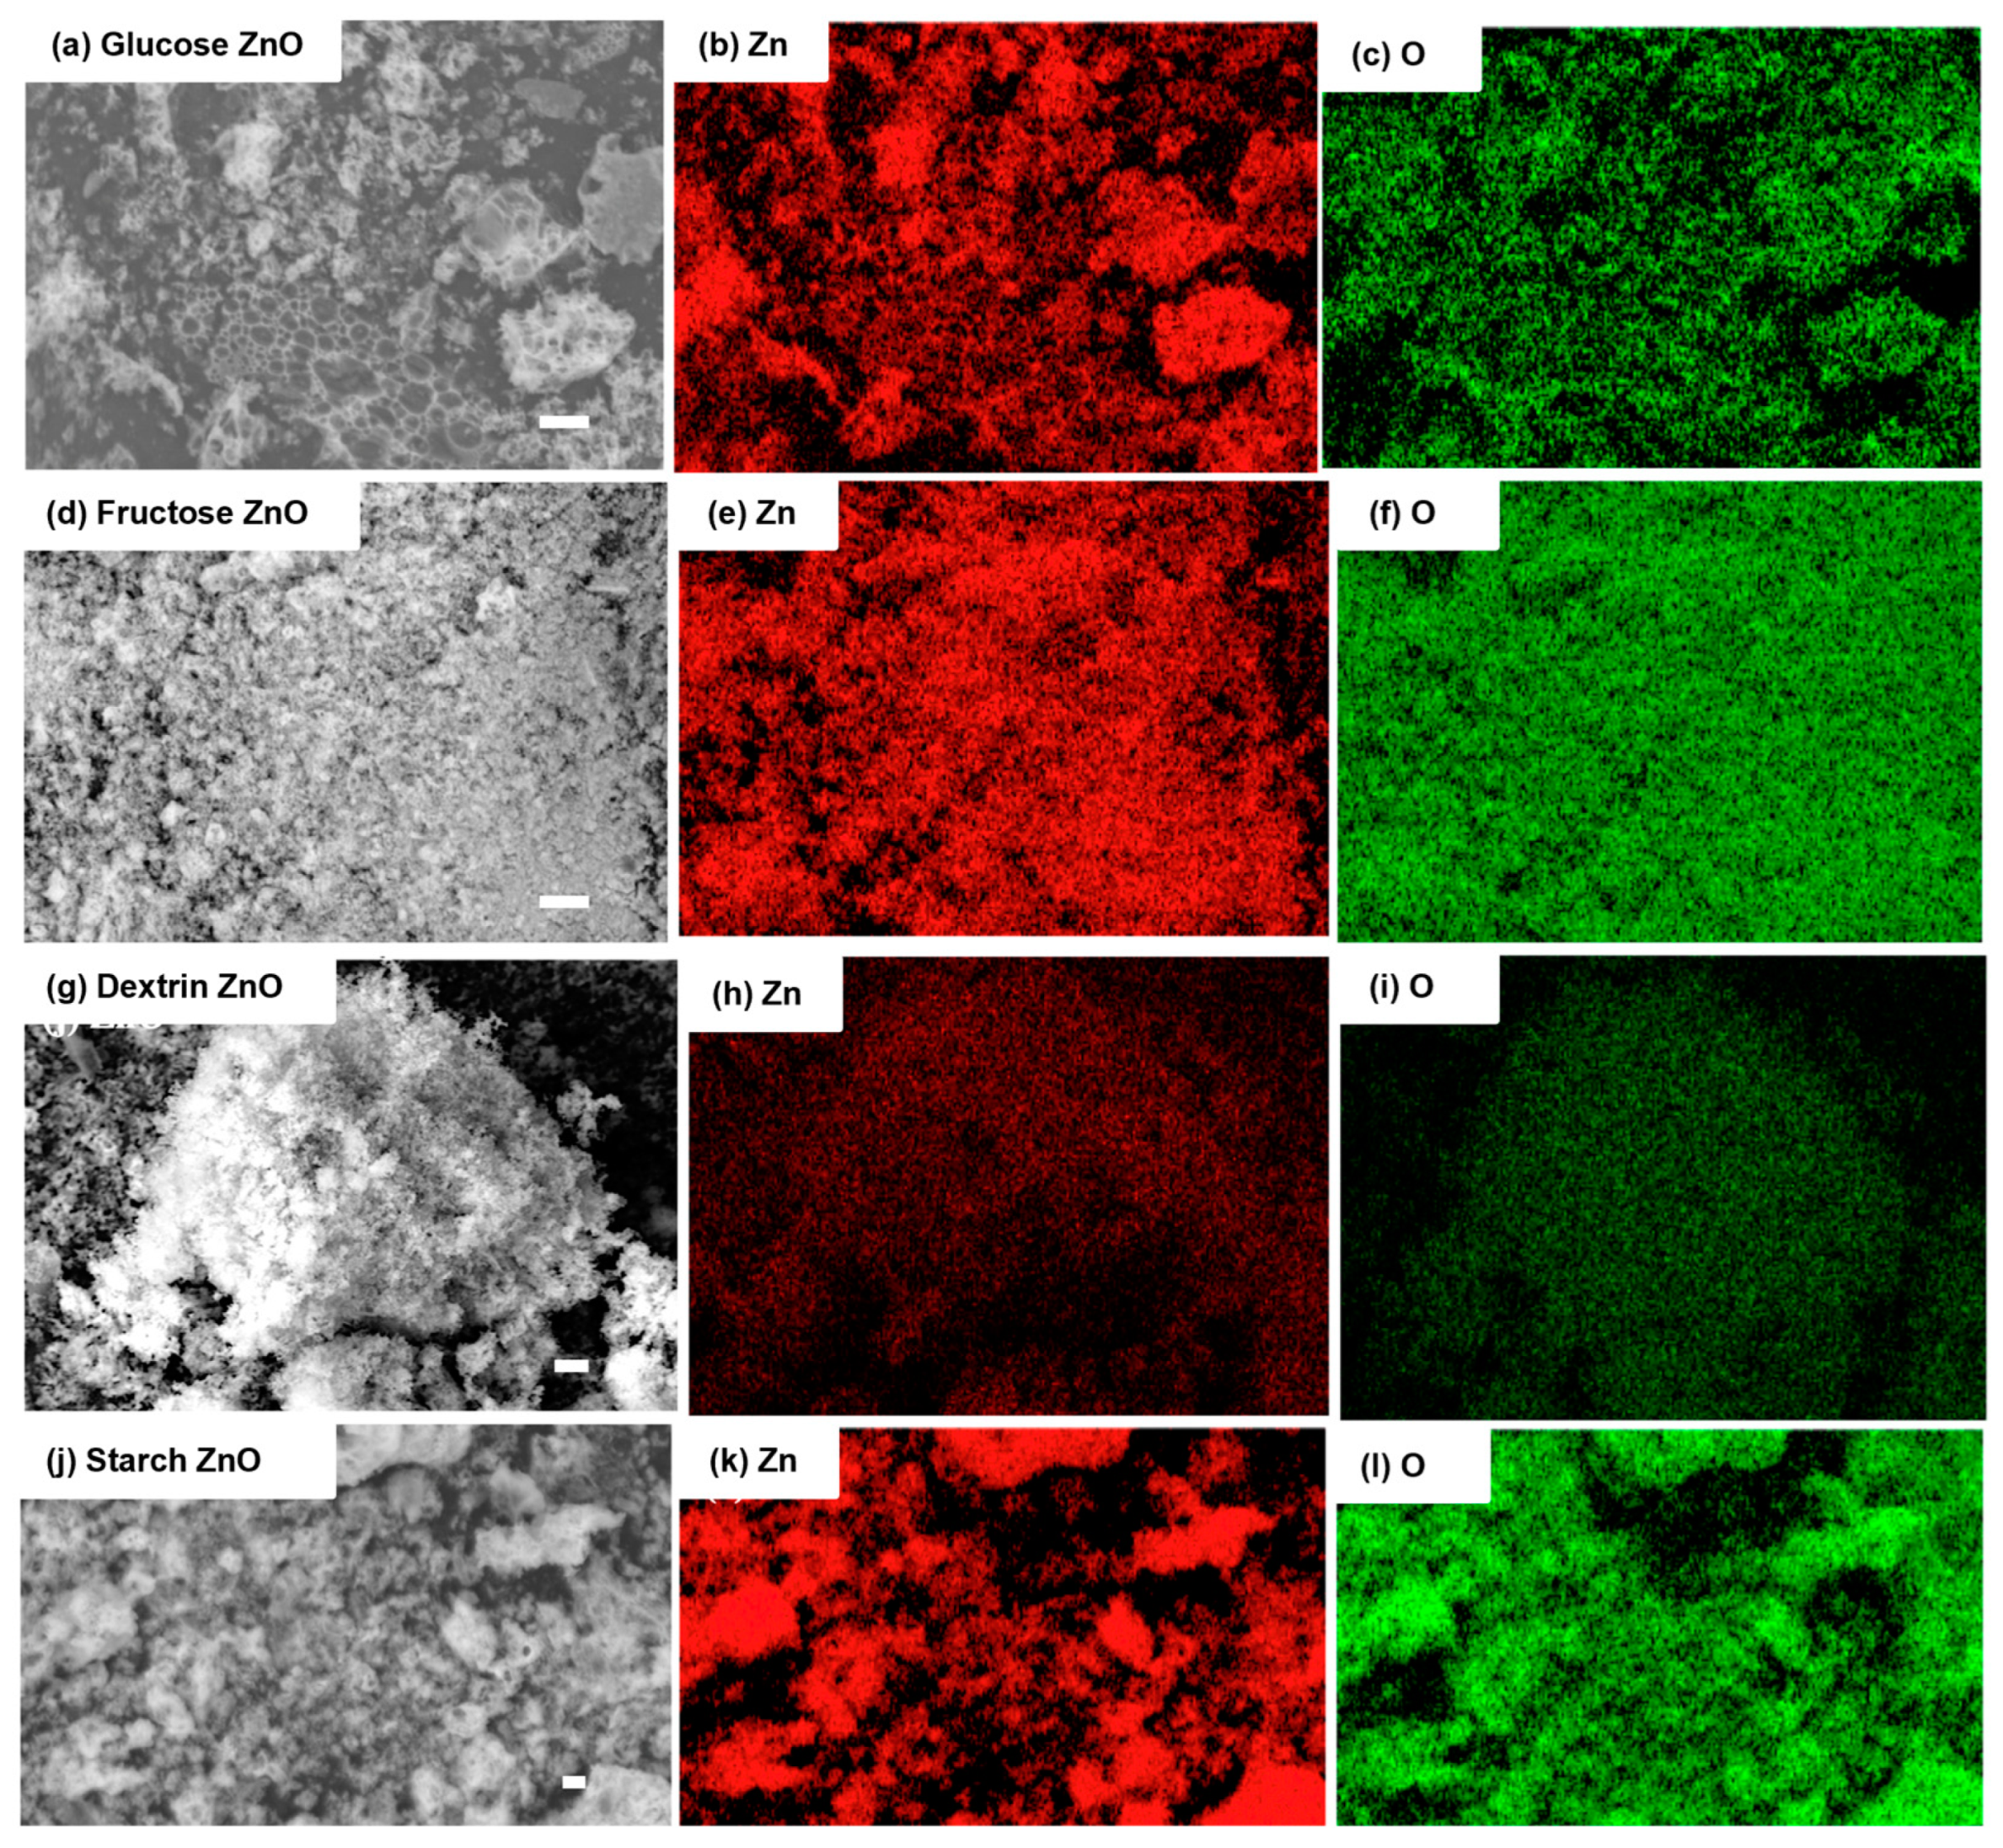
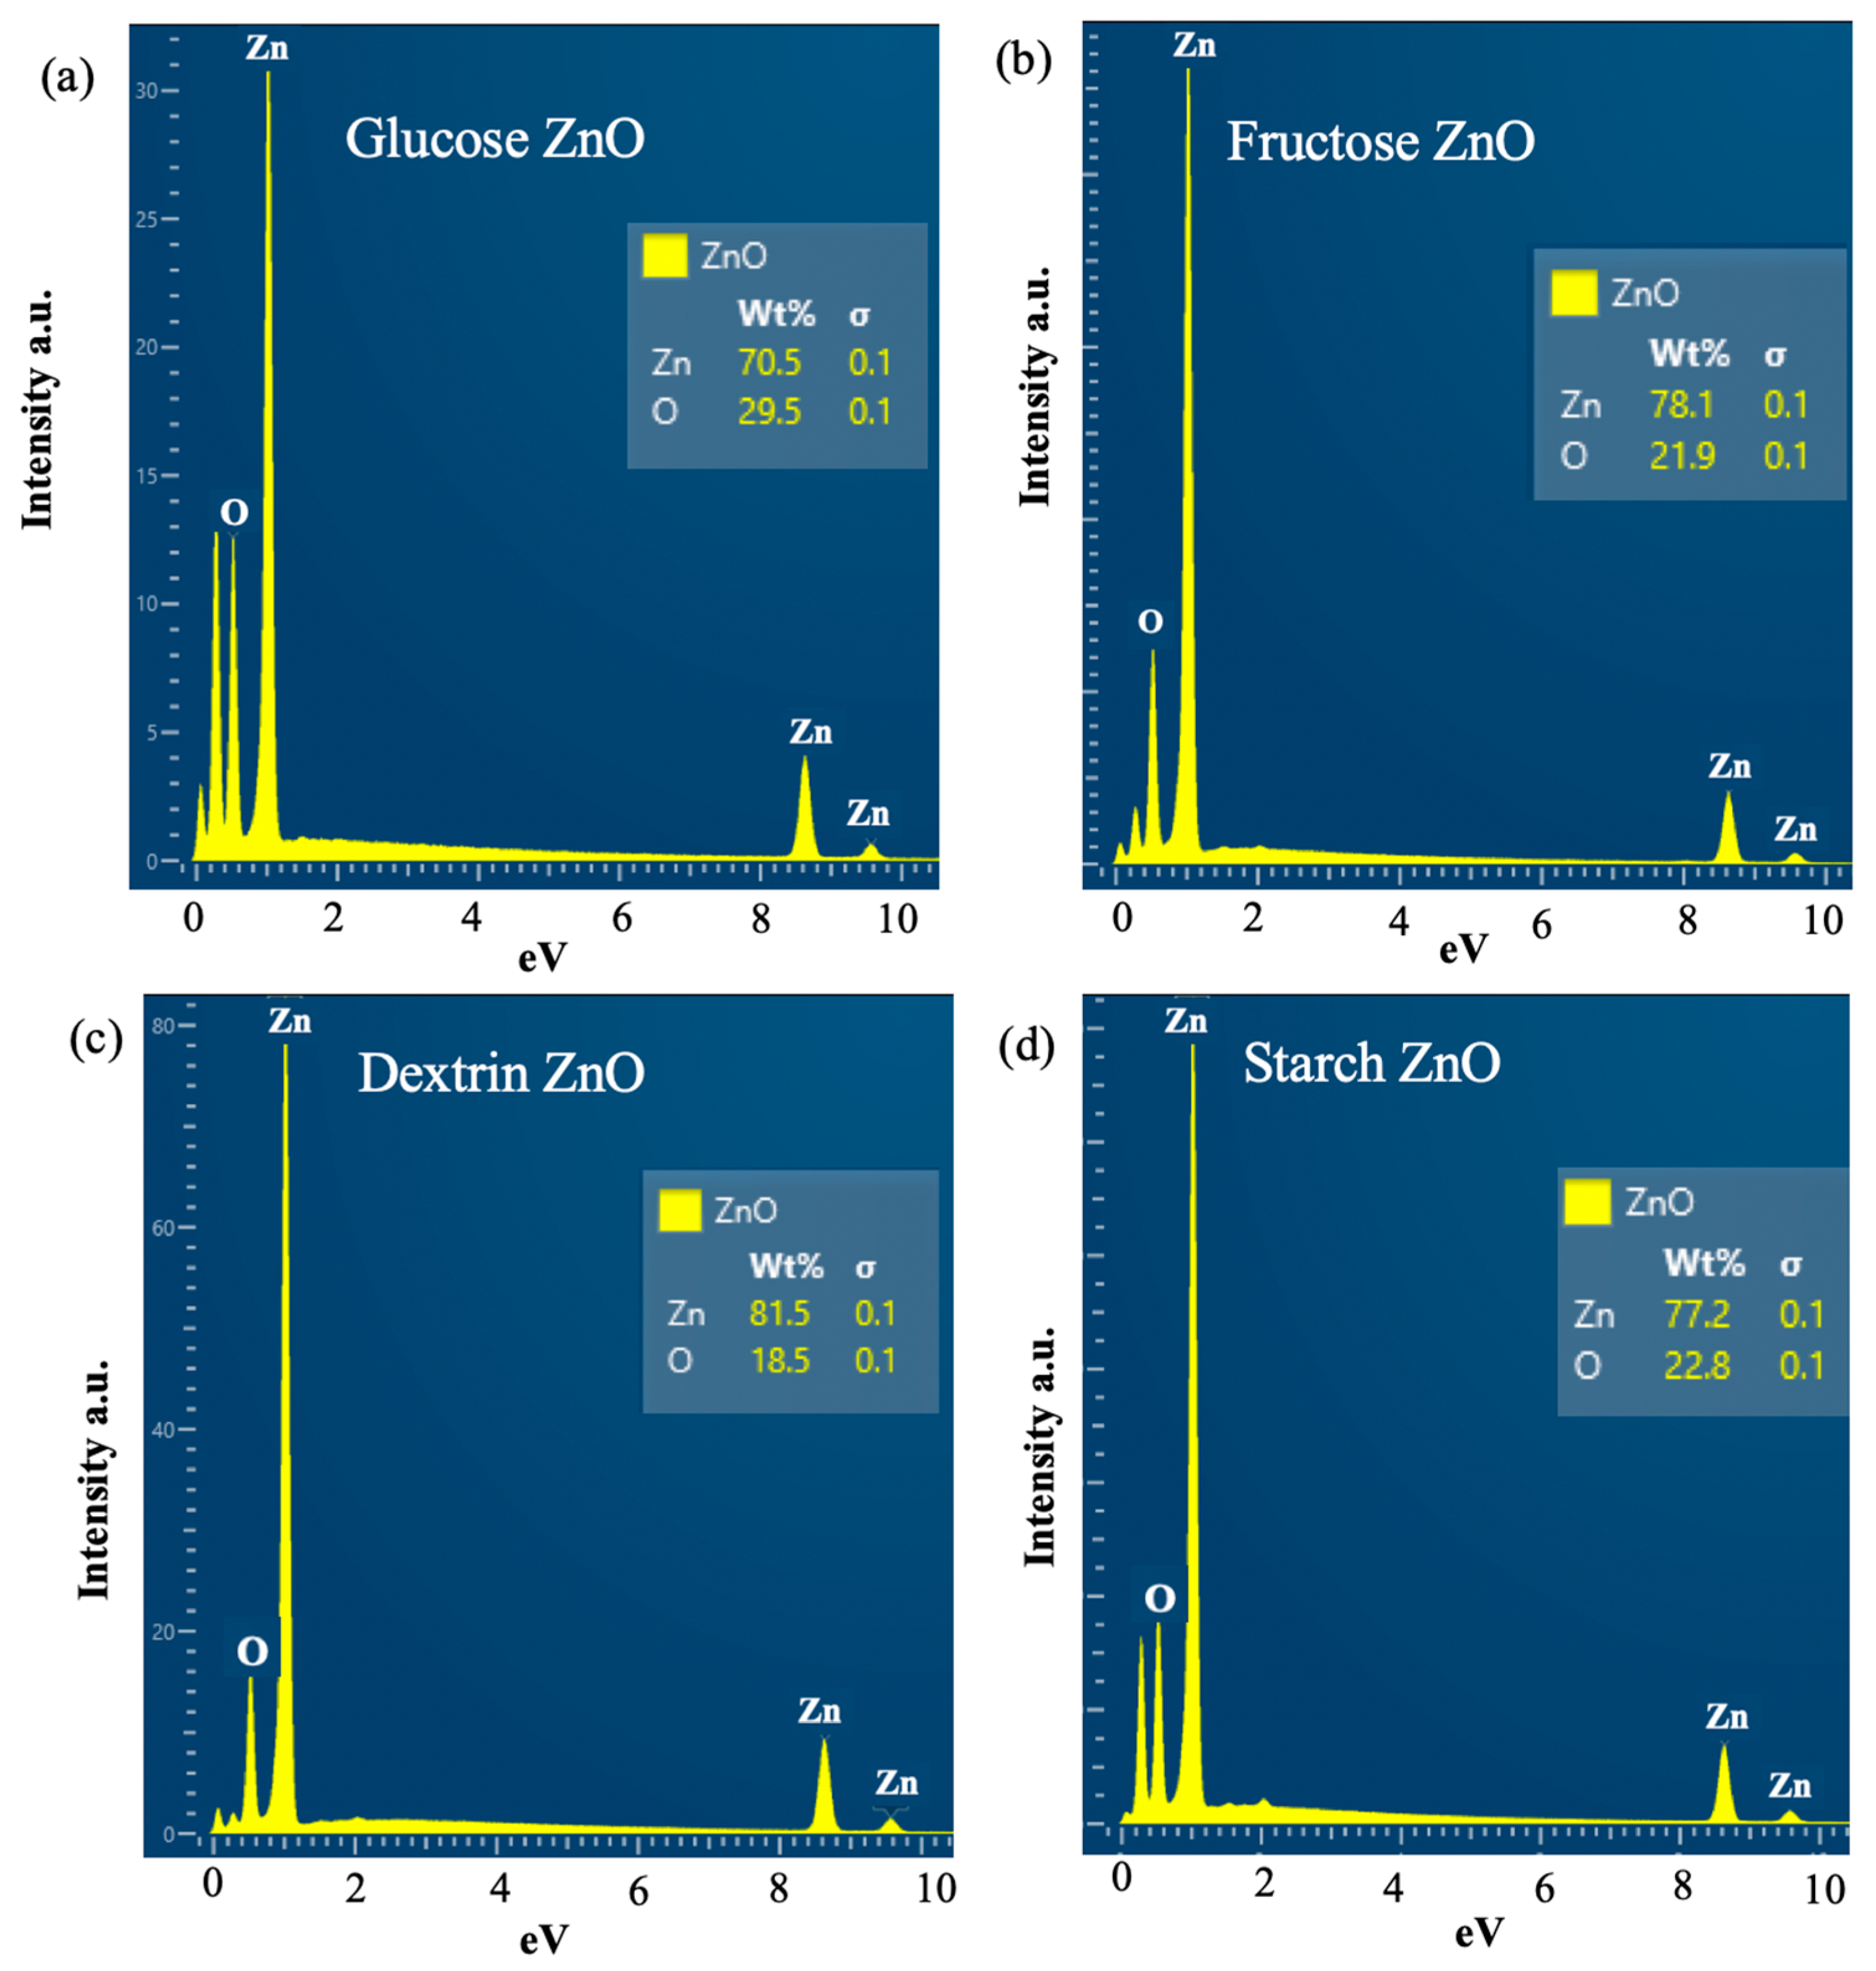
3.2.2. SEM Image and EDX Spectrum of the ZnO NPs

The SEM and EDX images were obtained to observe the bulk morphology and the composition of the elements of the ZnO NPs, respectively. The SEM images of Dextrin-ZnO, Fructose-ZnO, Glucose-ZnO, and Starch-ZnO are shown in Figure 2. The SEM images are consistent with submicron granulated ZnO NPs with no particular differences between the saccharide-derived products.
An SEM-EDX analysis was carried out for the Glucose-ZnO, Fructose-ZnO, Dextrin-ZnO, and Starch-ZnO products to obtain the elemental composition, Figure 3a–d. The EDX spectrum of all the saccharide-derived ZnO nanoparticles determined that no impurity or adulteration was there in the as-synthesized product since strong and prominent peaks were generated by EDX spectra corresponding to Zn and O. This result of the SEM-EDX spectrum also confirmed the successful formation of ZnO nanostructures. The theoretical mass% ratio of Zn:O is 80.34%:19.66%, but as shown in Figure 3, the rations obtained from the saccharide-derived ZnO NPs are not stoichiometric. These variations may be due to impurities entrapped in the lattice of the ZnO NPs. However, the nature of these impurities was not determined.

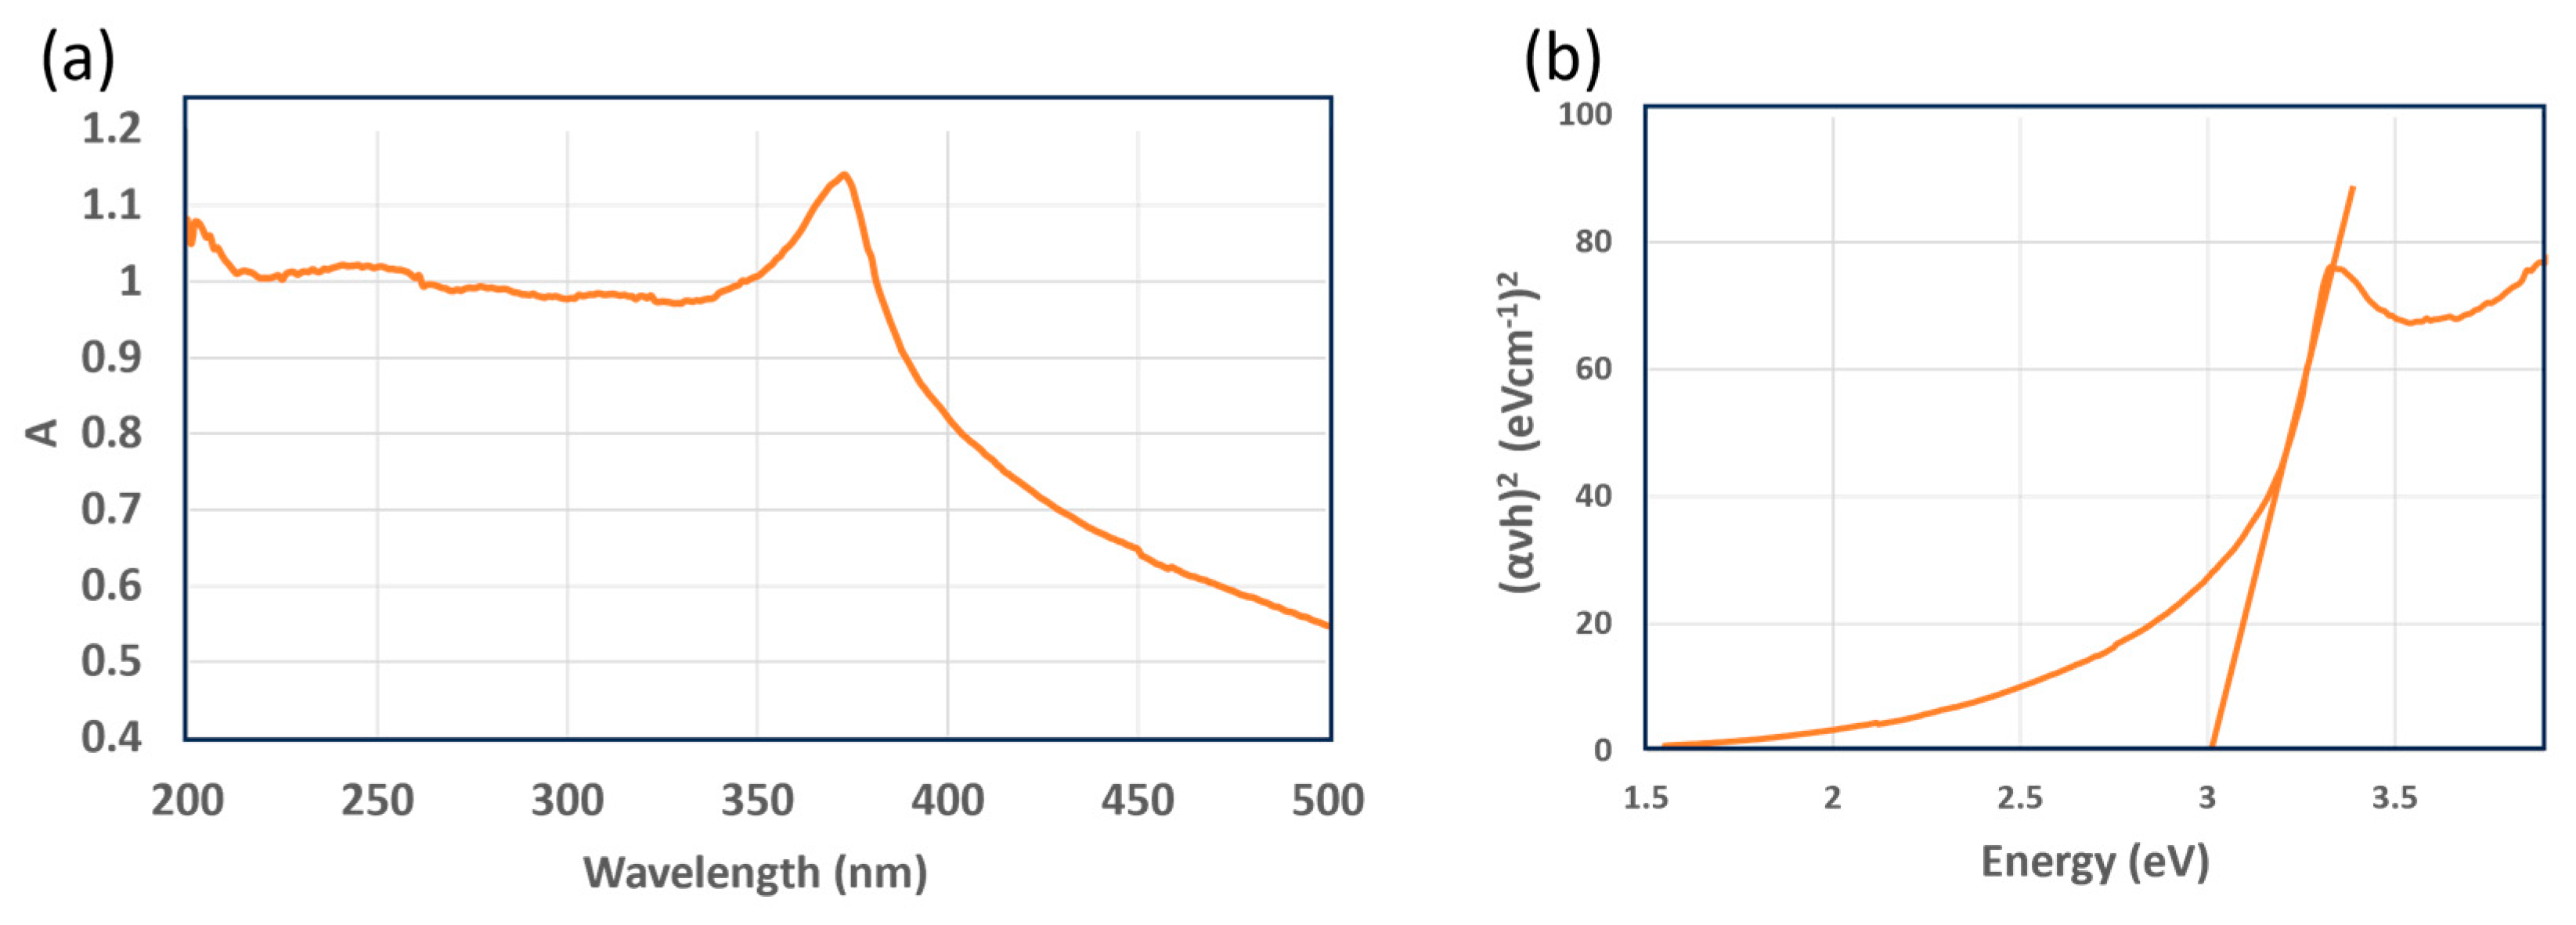
3.2.3. UV–Visible Spectrum of the ZnO NPs

The UV–visible spectrum of the saccharide-derived ZnO NPs was determined in ethanol suspensions (0.125 mg/mL). The UV–visible spectrum of the Fructose-ZnO NPs is shown in Figure 4a. The UV–visible spectra of the rest of the saccharide-derived ZnO NPs are in the supportive information. All the ZnO NPs generated a characteristic UV-vis absorption band centered at around 375 nm. A characteristic peak at around 375 nm across all the ZnO NP samples indicates that they share a common optical property in the UV region. This observation suggests that there are no significant differences in the absorbance behavior of these samples at that wavelength. The absorption band in this region could be the excitation of electrons from the valence band to the conduction band (O2p→Zn3d). It was also noticed that all the synthesized ZnO nanoparticle samples were very absorptive at the UV region in distinction to the visible region of the electromagnetic spectrum. These results further support that all the ZnO NPs used in this study acted as immensely active photocatalysts under UV light illumination.
The optical band gap of the ZnO NPs derived from saccharides (Glucose-ZnO, Fructose-ZnO, Dextrin-ZnO, and Starch-ZnO) was estimated by using UV–visible absorption spectra and the Tauc equation [50], Figure 4b. The analysis for the remaining saccharide-derived ZnO NPs is in the supportive information. The calculated band gap energies for Glucose-ZnO, Fructose-ZnO, Dextrin-ZnO, and Starch-ZnO were 3.09 eV, 3.09 eV, 3.09 eV, and 3.11 eV, respectively. These results indicate that all the ZnO nanoparticle samples exhibit band gaps lower than that of bulk ZnO (3.37 eV). The decrease in the band gap is likely attributed to the presence of defect levels within the band gap and the incorporation of donor atoms from the valence band into the nanoparticles.

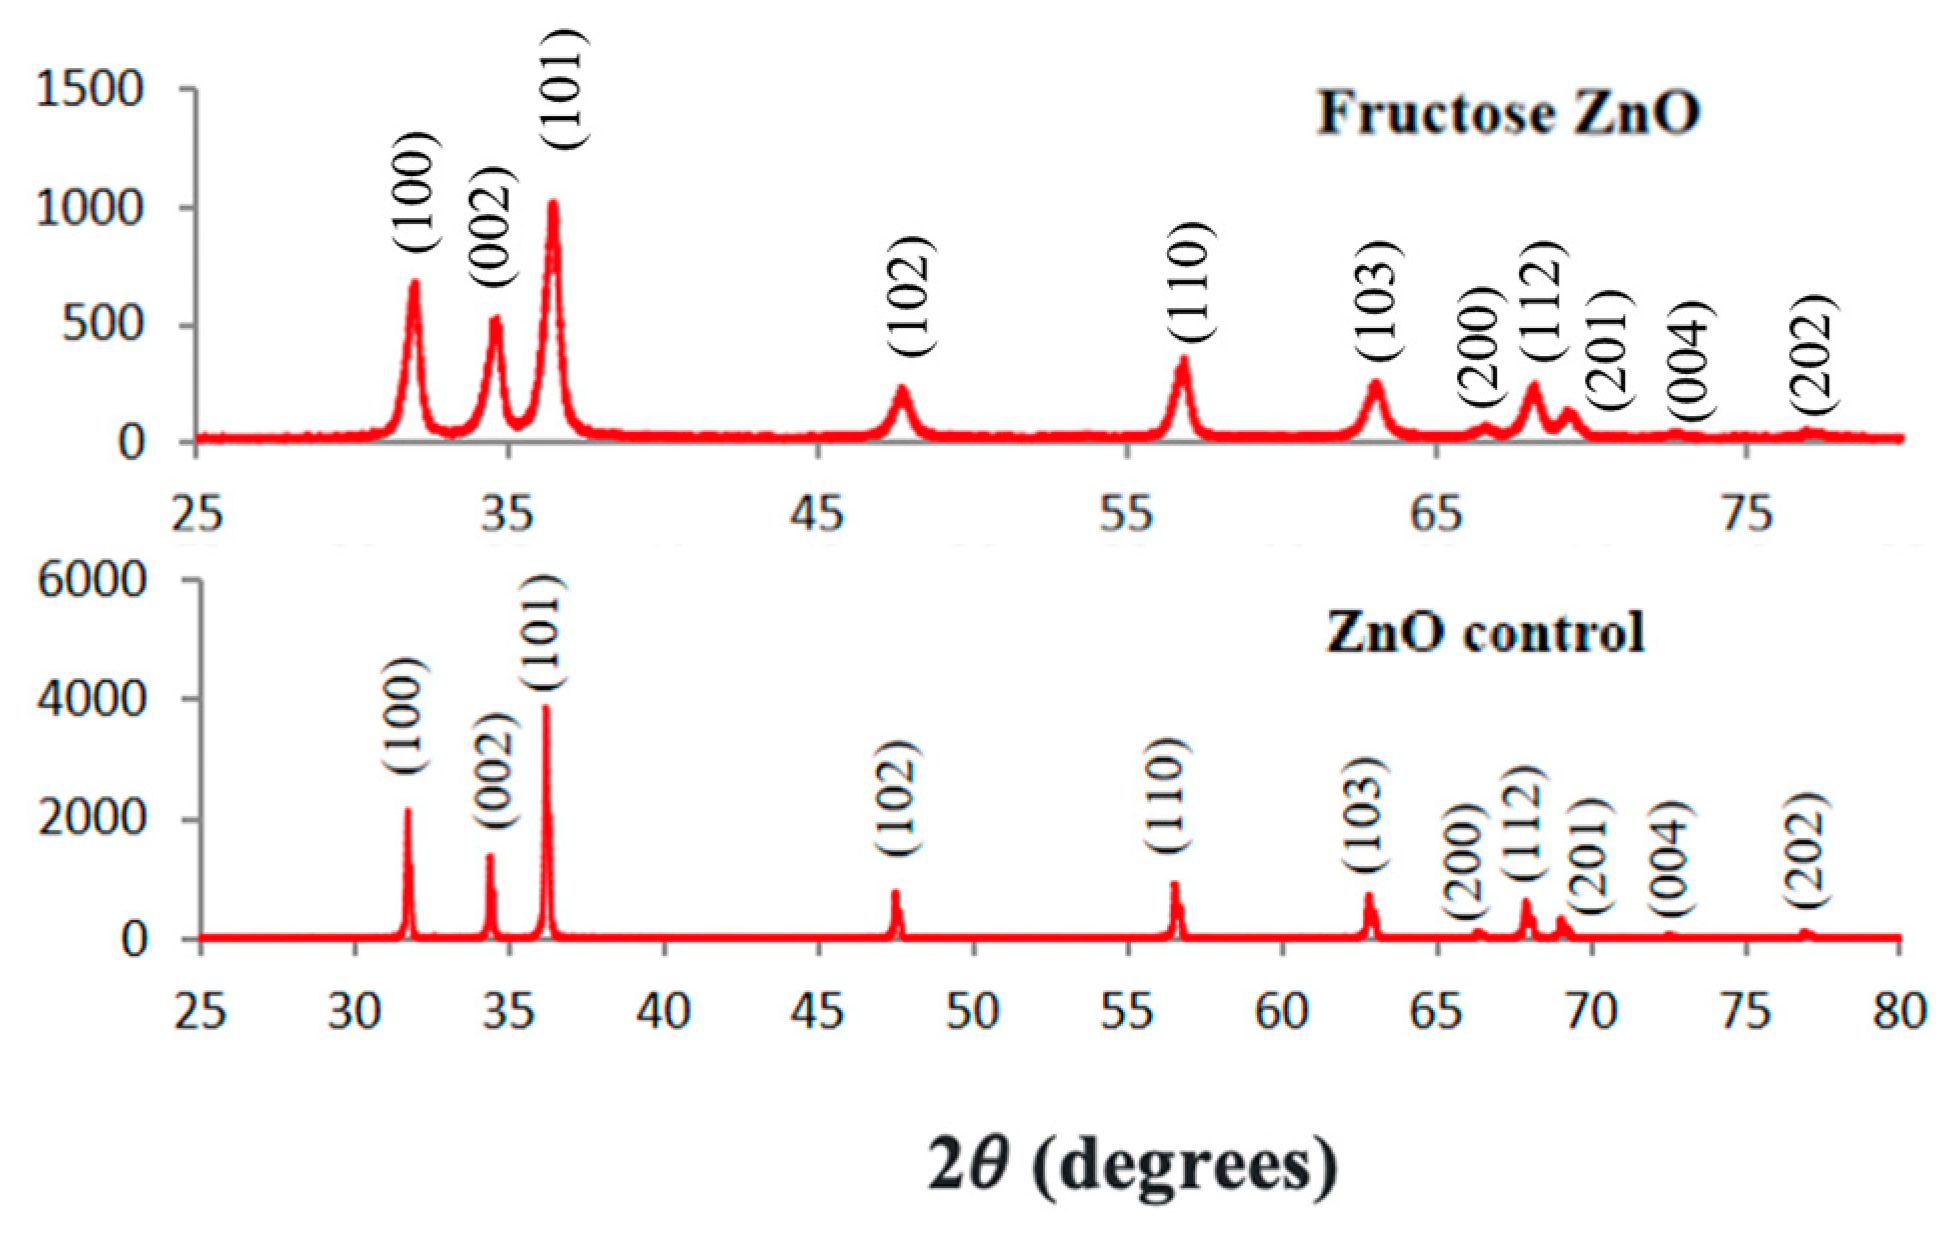
3.2.4. XRPD Analysis of the ZnO NPs

The ZnO NPs were further characterized by X-ray powder diffraction (XRPD) to obtain the sample’s crystalline structure and crystallite size. The diffraction patterns of the Fructose-ZnO NPs and ZnO-control are displayed in Figure 5. The XRD pattern of the rest of the saccharide-derived ZnO NPs is in the supportive information. The peaks at 2θ = 31.70°, 34.20°, 36.20°, 47.46°, 56.50°, 62.70°, 66.20°, 67.80°, 68.99°, 72.40°, and 77.10° 2 theta are characteristic of the ZnO crystalline hexagonal wurtzite structure (JCPDS 5-0664), in agreement with the ZnO-control [51,52]. However, the XRD peaks of the saccharide-derived samples are much broader than in the ZnO-control, suggesting structural differences in the crystal lattice.
The determination of the ZnO crystal size was derived from the XRD data in accordance with the Debye–Scherrer equation [53]. The average crystalline size of Dextrin-ZnO, Fructose-ZnO, Glucose-ZnO, and Starch-ZnO was calculated to be 20.9 nm, 25.3nm, 25.3 nm, and 18.2 nm, respectively. These values are close to the average obtained from TEM (Figure 1).
The XRPD pattern of the ZnO NPs was consistent with the expected trend observed for the other ZnO NPs [54]. However, the diffraction of the saccharide-derived ZnO NPs was broader than the control and other reported ZnO NPs, which indicates the presence of significant changes in the crystal structure that may be responsible for the enhanced photocatalysis.

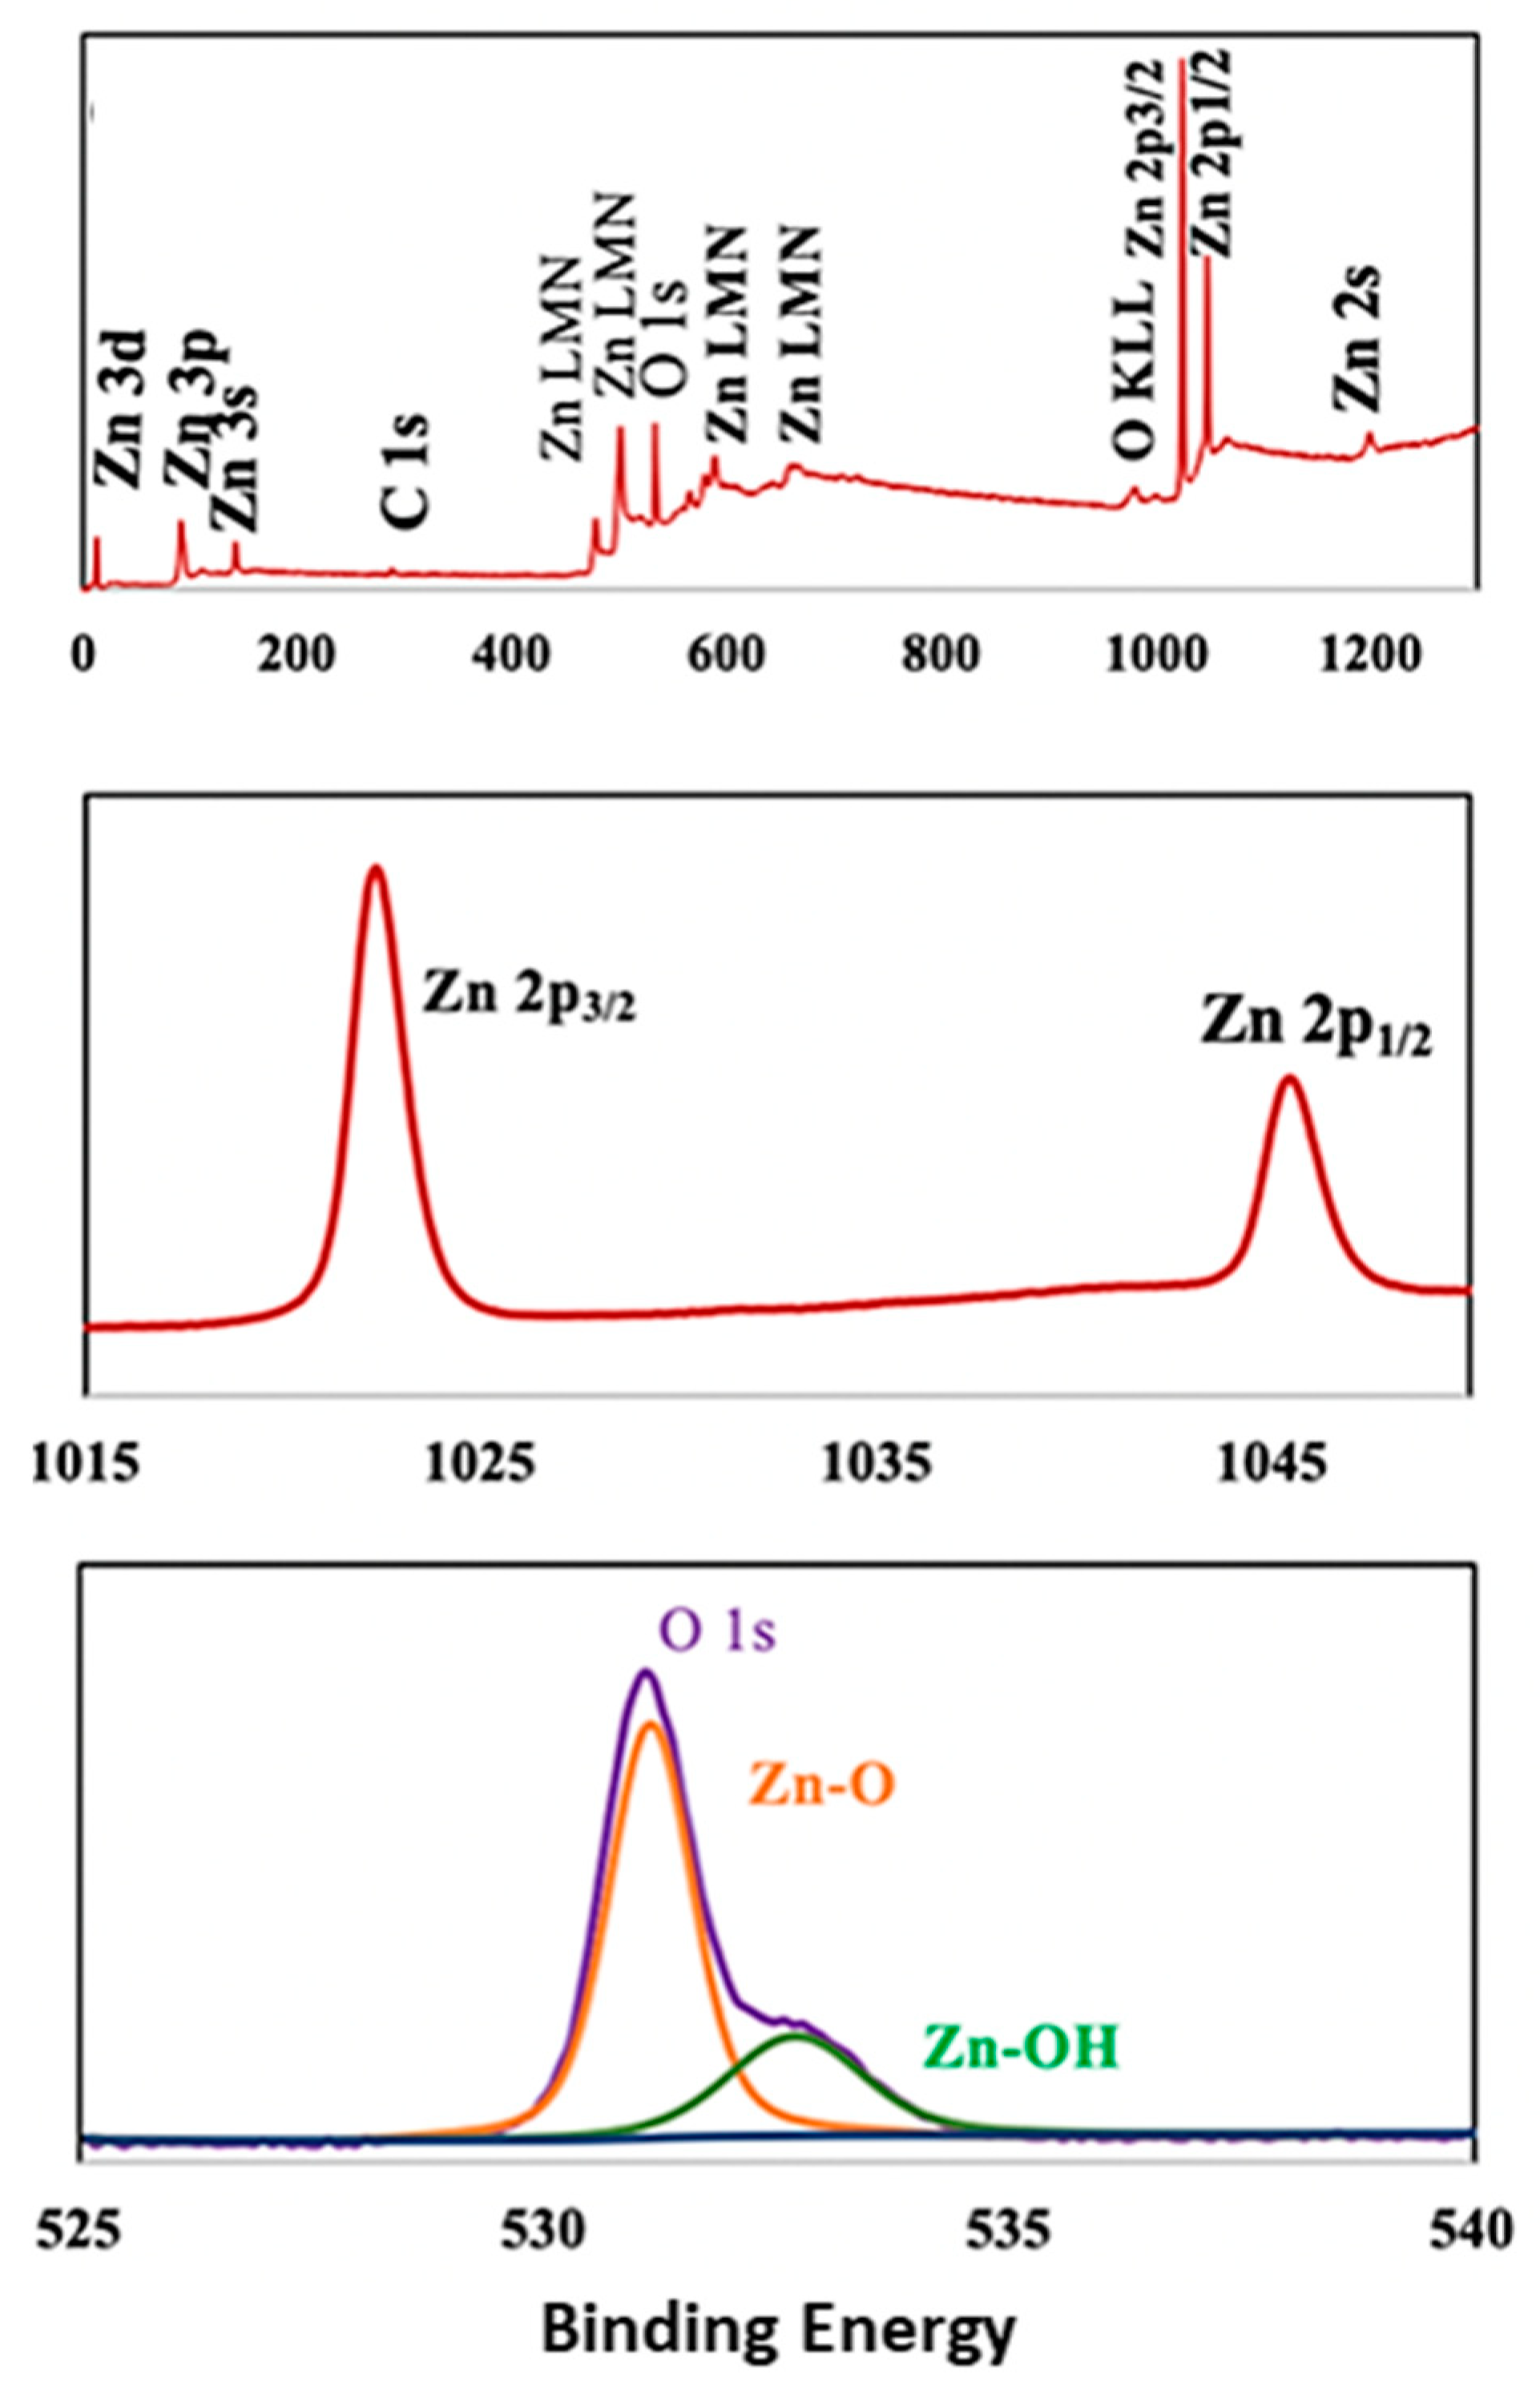
3.2.5. XPS Analysis of the ZnO NPs

The XPS analysis was conducted to assess the elemental composition at the surface and chemical state of all the saccharide-derived ZnO NPs. Figure 6 shows the XPS survey spectrum of Fructose-ZnO, and the Supplementary Materials shows the XPS survey spectrum of the rest of the saccharide-derived ZnO NPs. The XPS study revealed that all the ZnO NPs derived from saccharides primarily consist of Zn and O with a small amount of C. It is possible that the C originates from the contamination of the instrument [55] or from biocarbon impurities in the samples. The XPS survey spectra showed the characteristic binding energies corresponding to the Zn and O states like those previously reported for ZnO [56]. Figure 6 shows the Zn 2p3/2 and Zn 2p1/2 peaks of Fructose-ZnO at 1022.4 and 1045.5 eV, respectively, which are similar to those observed before for ZnO [57]. The peak observed at around 532 eV in the O 1s binding energy indicated the presence of O in the ZnO NPs at 533 eV, which is attributed to the characteristic peaks of the Zn-O and Zn-OH bonds. The OH group was more likely formed due to the breaking down of the Zn-O-Zn bond and the subsequent formation of the Zn-OH bond during the synthesis [58].

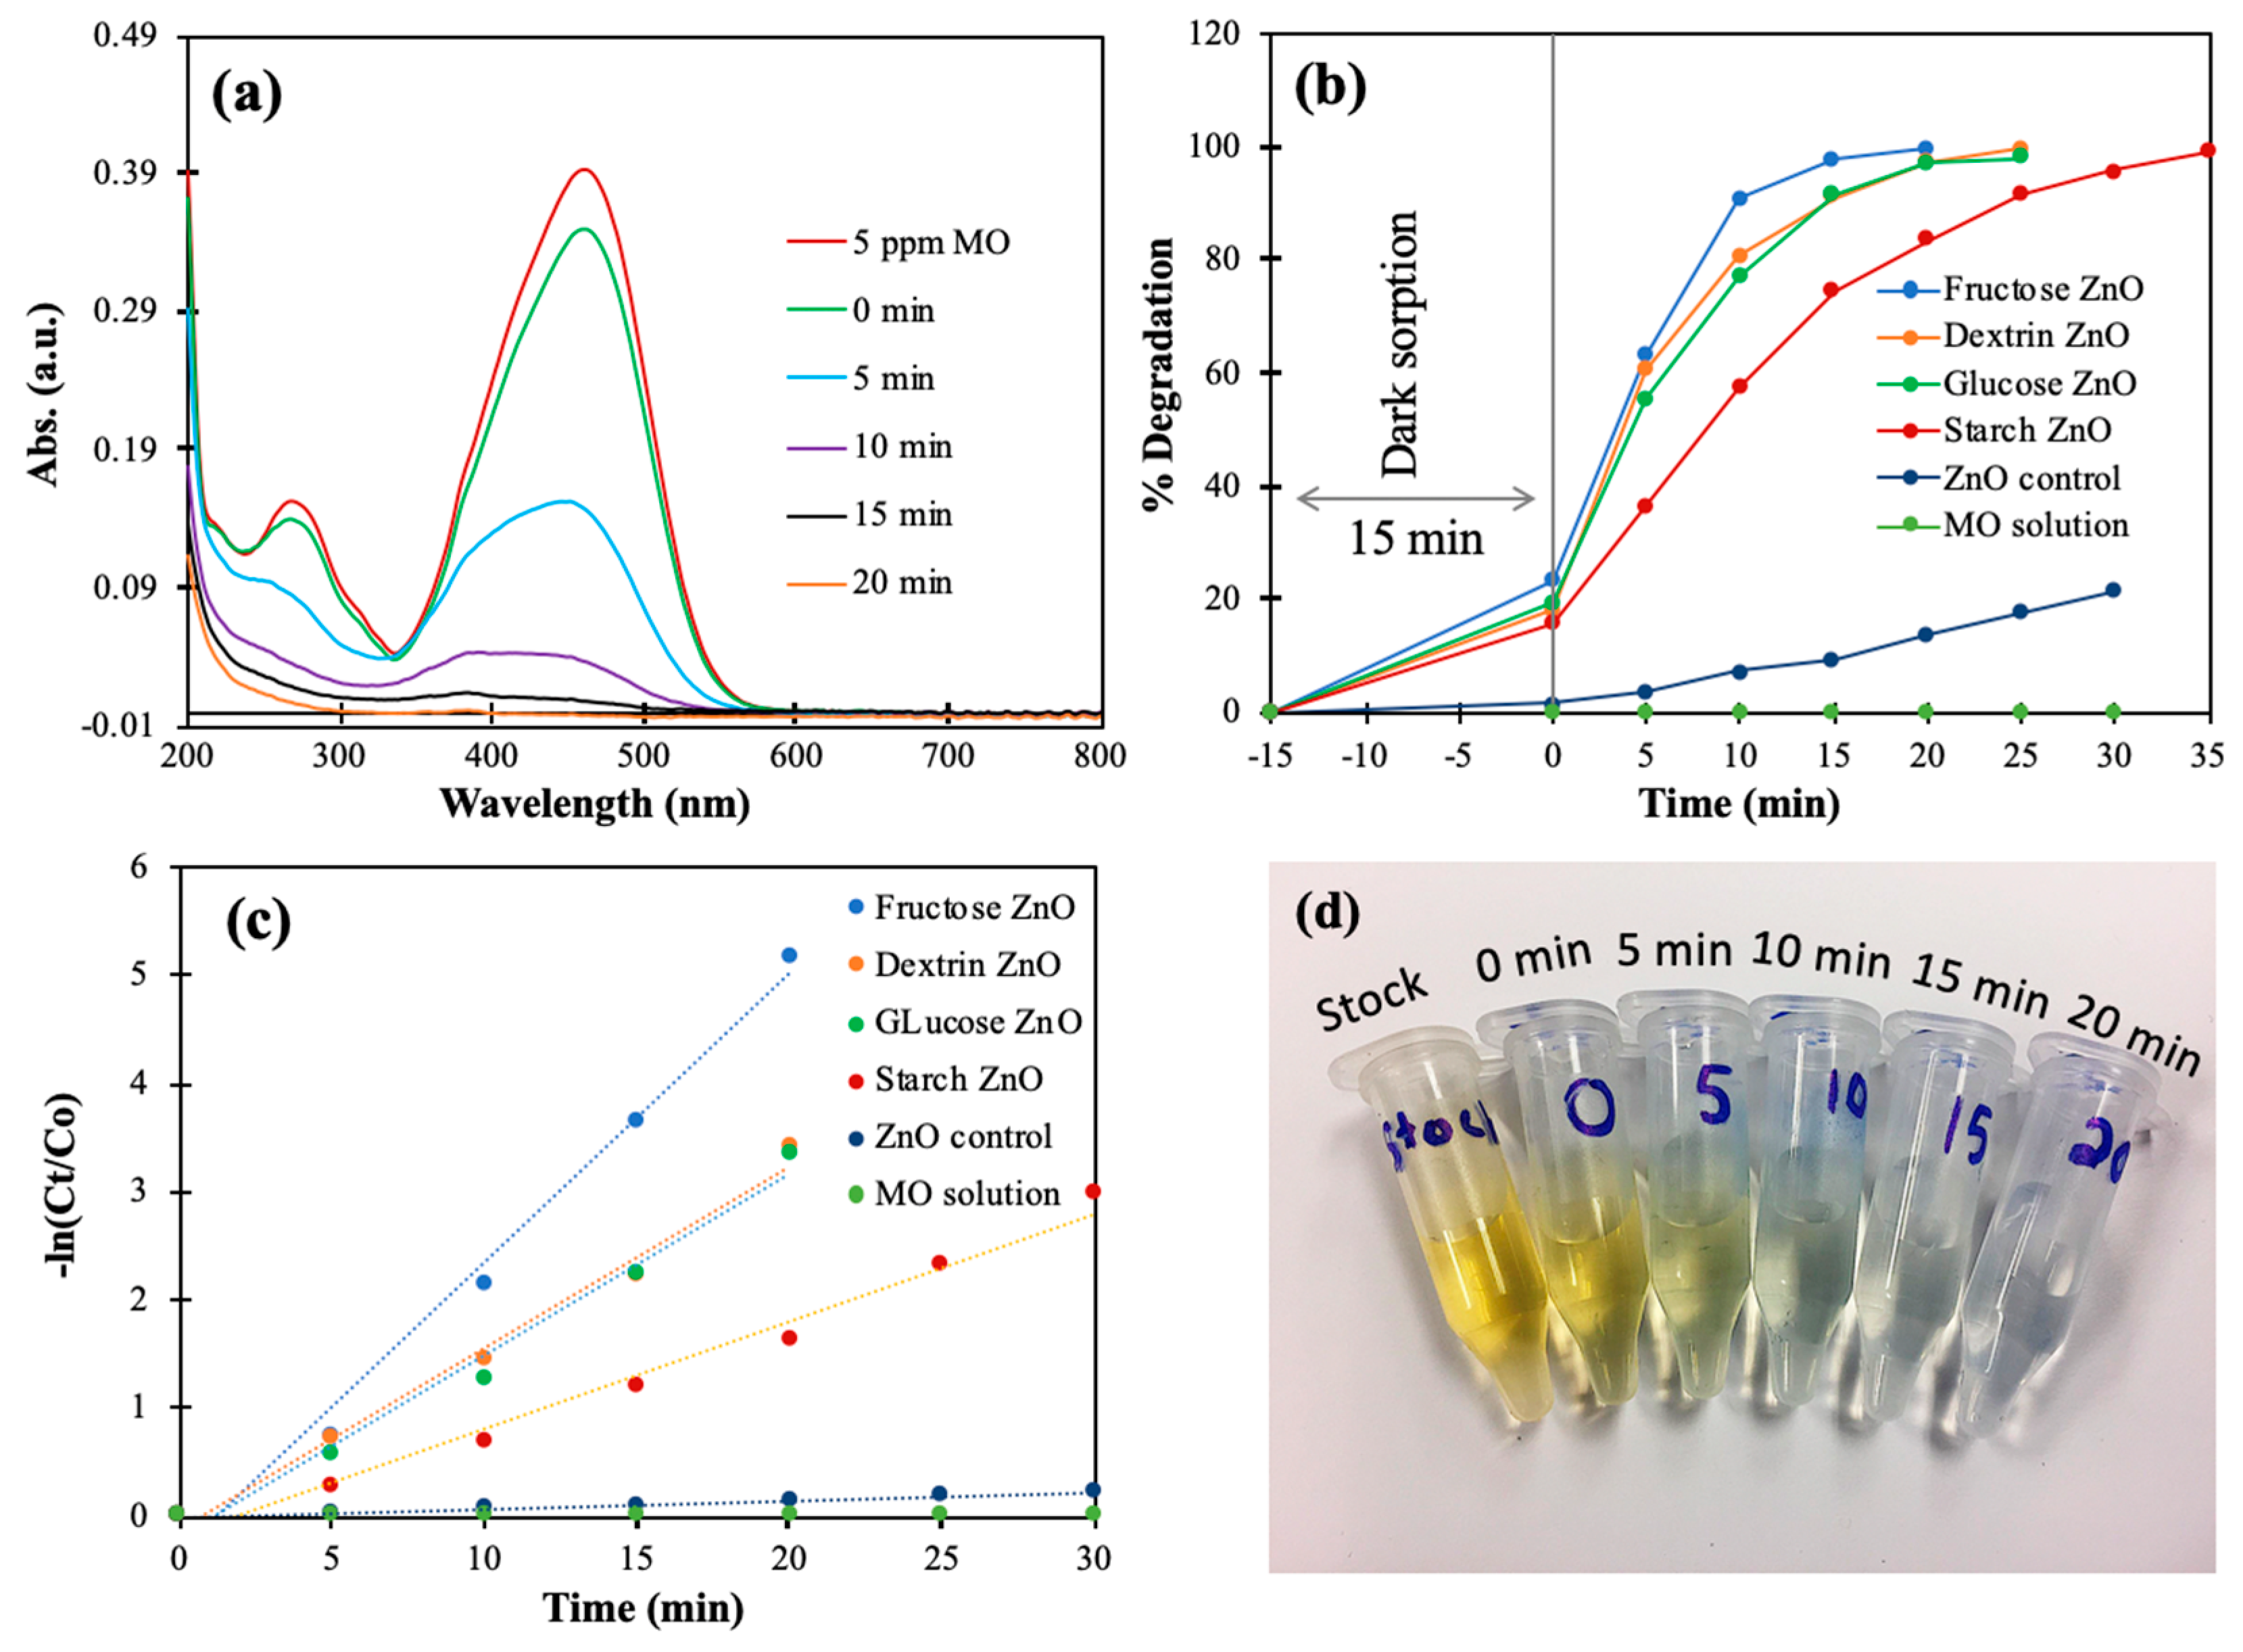
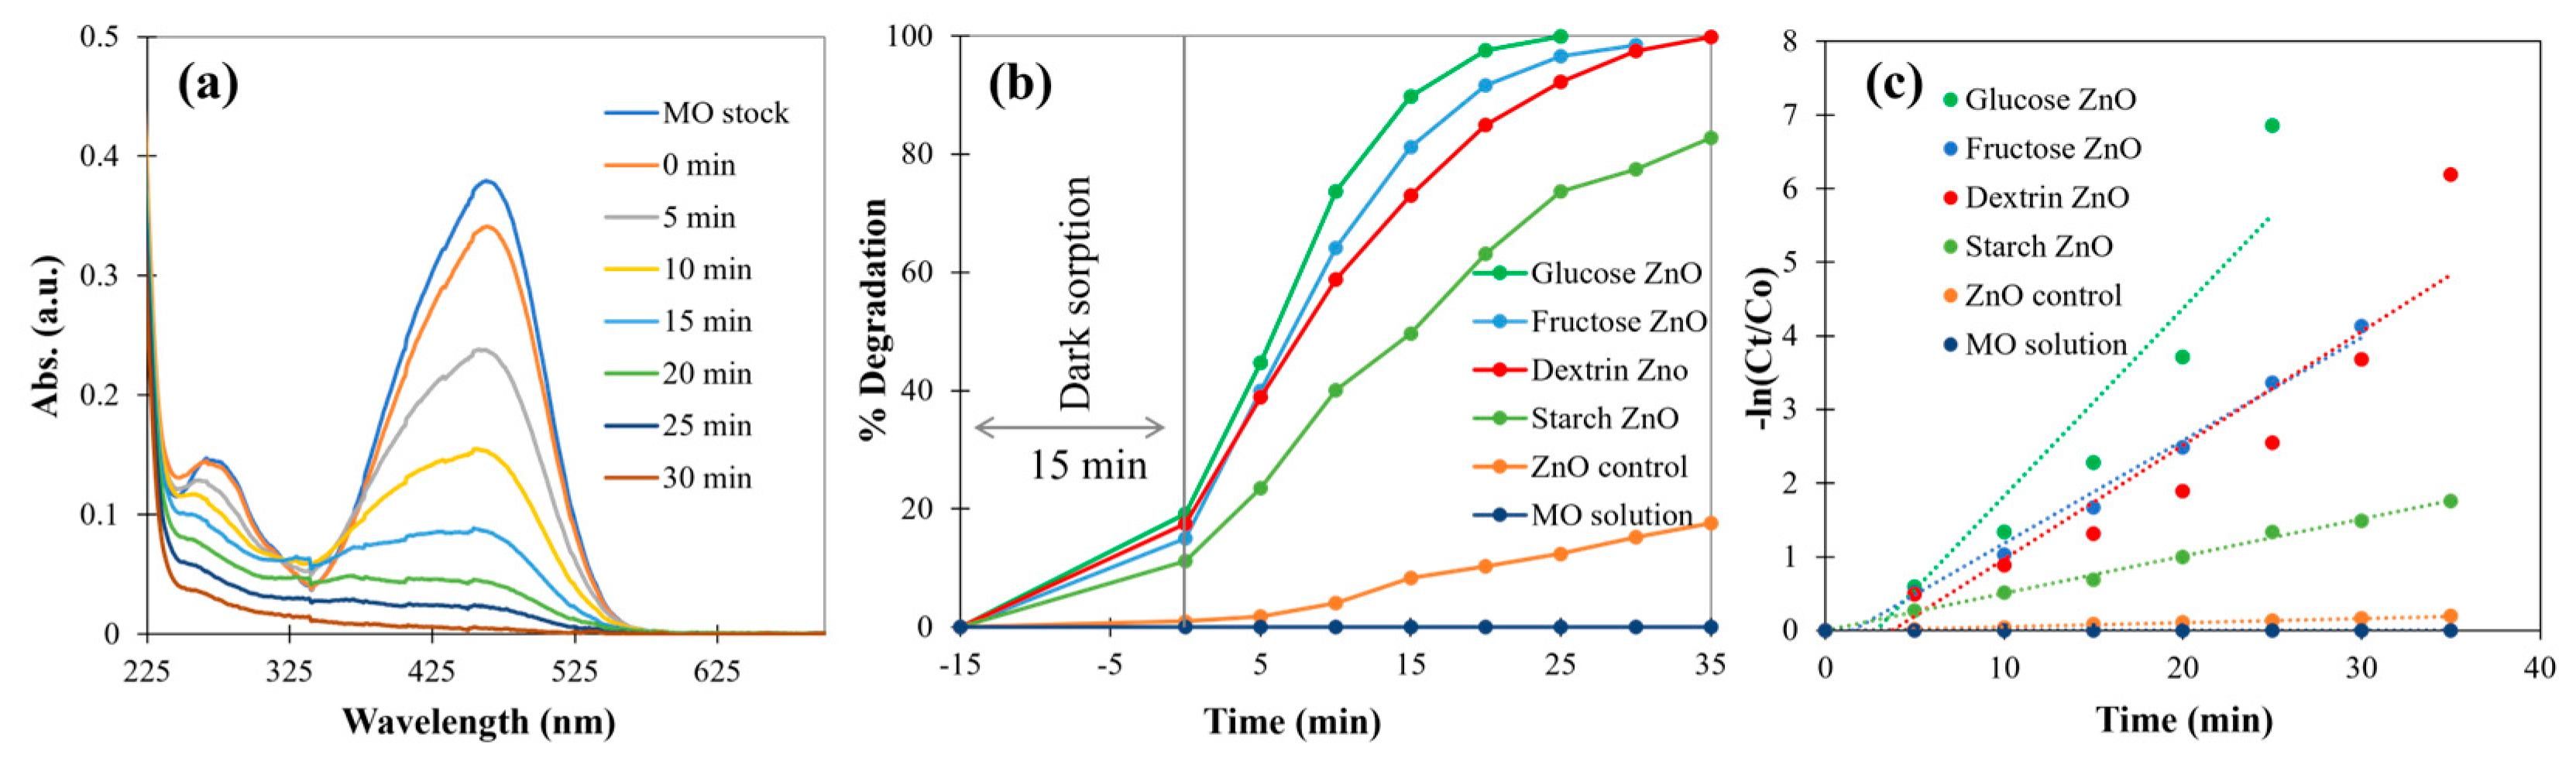
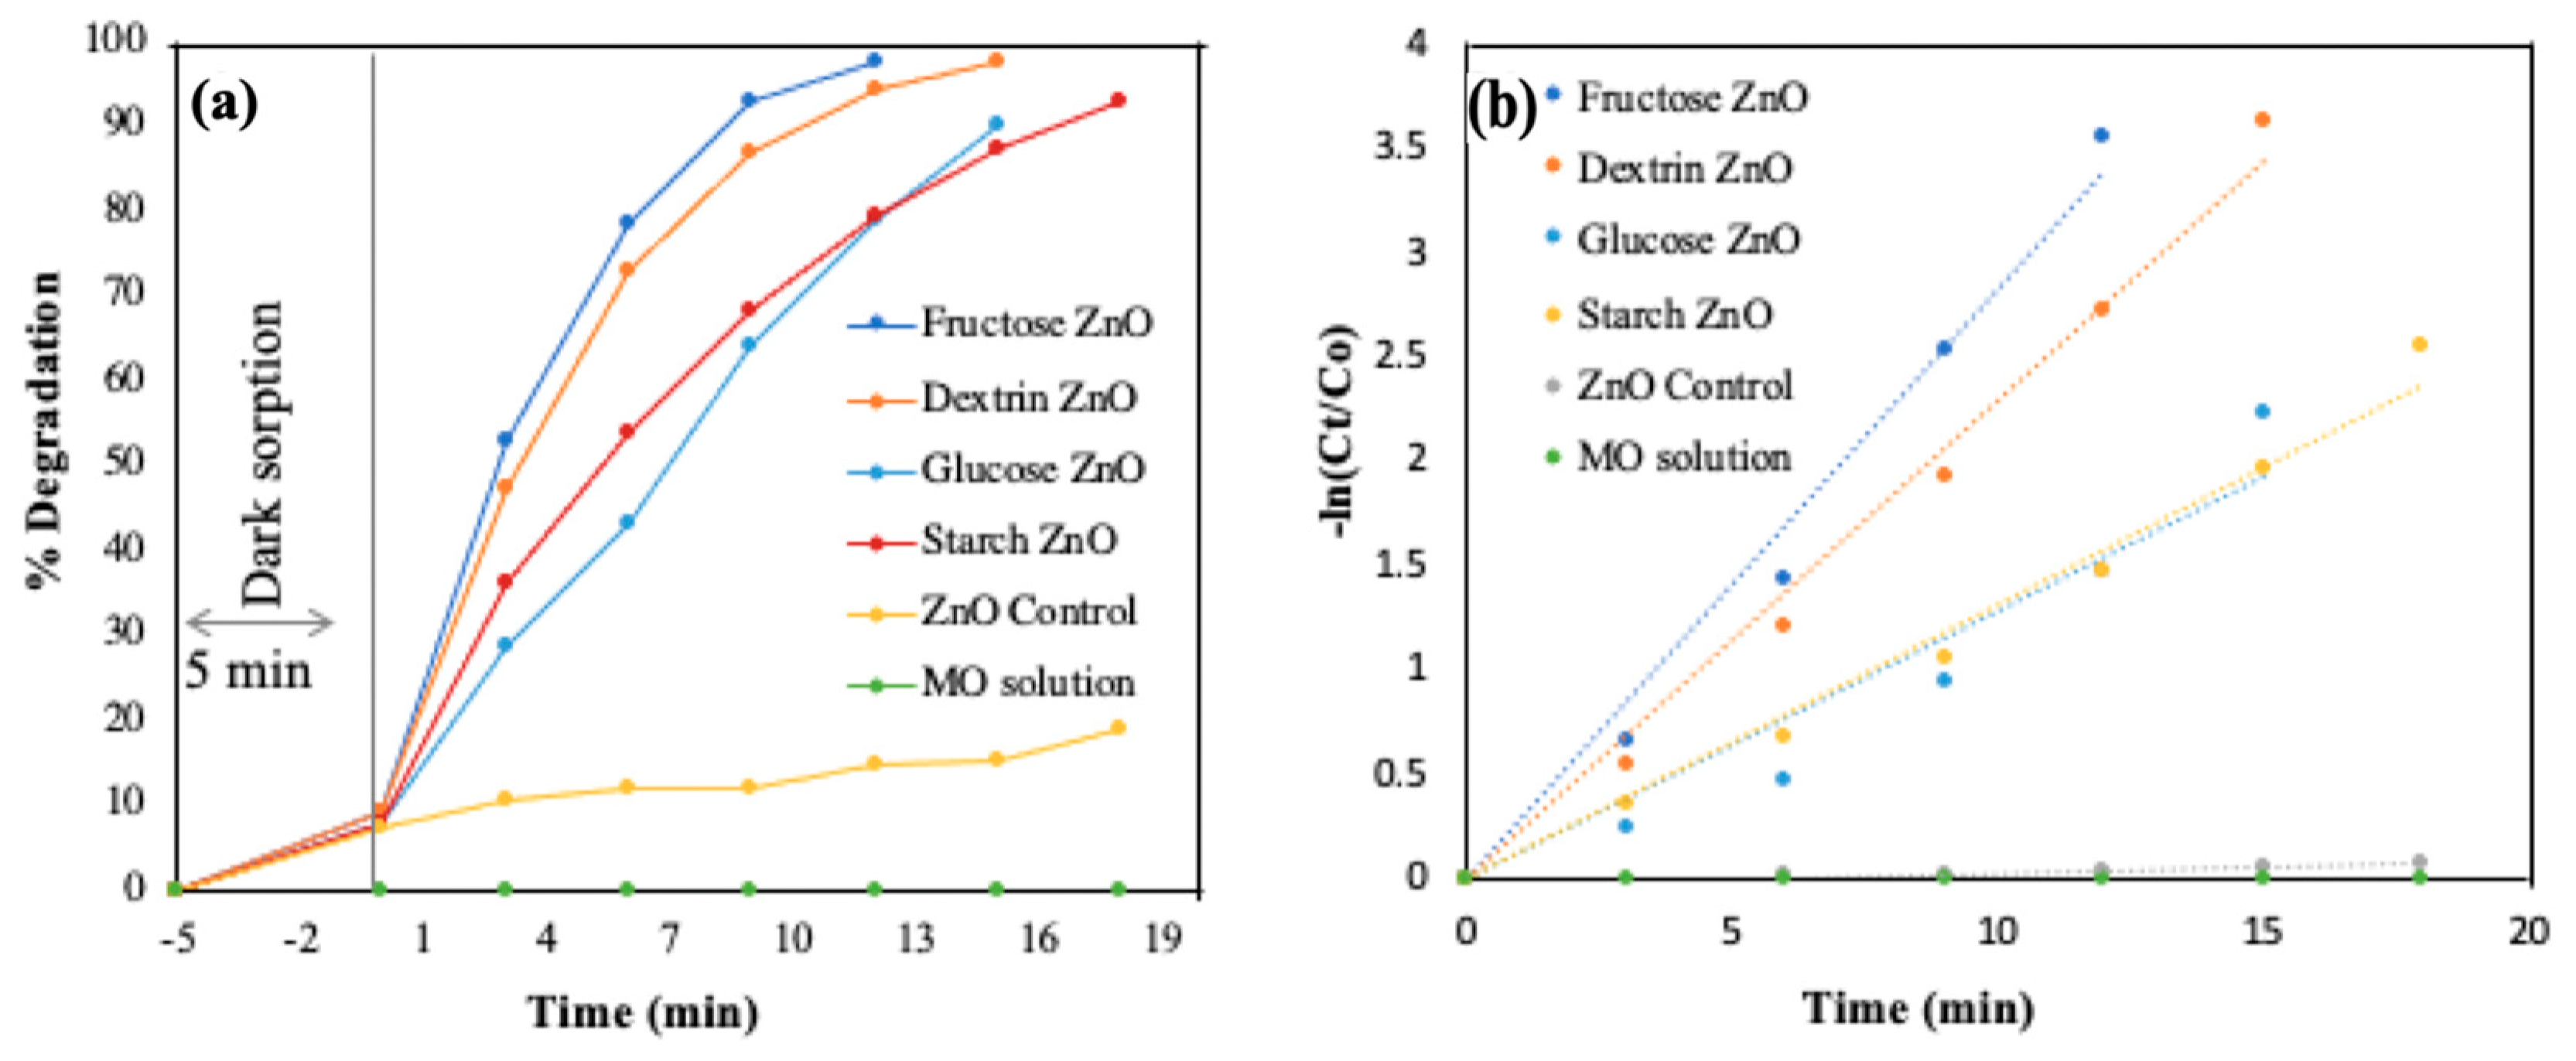
3.2.6. Photocatalytic Degradation of Methyl Orange (MO)

All four ZnO NP samples and the control ZnO sample synthesized in this study were subjected to degrading the MO dye in deionized water (DIW) and simulated fresh drinking water (FDW) under UV light and sunlight irradiation. The photocatalytic efficiency was determined by the percent degradation of MO by using Equation (2). The degradation of MO was determined by its characteristic absorbance at 464 nm by using UV–visible spectroscopy:
P e r c e n t   d e g r a d a t i o n = C o C t C o × 100 % = A o A t A o × 100 %
Co is the initial concentration, Ct is the equilibrium concentration or concentration at time t, Ao is the initial absorbance, and At is the absorbance at time t of MO at 464 nm on the absorbance spectra.
As a representative, the time-dependent UV-vis spectrum of the MO solution during its degradation by Fructose-ZnO is shown in Figure 7a. It could be found that the MO concentration gradually decreased with the progression of the photocatalysis time. The absorption maxima dropped almost to baseline at 464 nm after 20 min of reaction, which suggested an efficient MO photodegradation in water by Fructose-ZnO. A similar UV-vis spectrum with a gradual decrease in the absorbance at 464 nm was obtained for the other ZnO NP samples (not shown here).
The percent of MO degradation with respect to time was calculated and is presented in Figure 7b. It was found that Fructose-ZnO was the most active photocatalyst, which completely decolorized the MO solution in ~20 min. Glucose-ZnO and Dextrin-ZnO achieved complete decolorization in ~25 min. Starch-ZnO demonstrated comparatively slower activity and reached the complete decolorization of MO after 35 min. While the photocatalytic activity of Fructose-ZnO, Glucose-ZnO, and Dextrin-ZnO vary slightly, Starch-ZnO showed relatively slower photocatalytic activity. Since starch is a large polysaccharide with an average molecular weight of 59.7 kDa, it is possible that its reaction with the zinc salt generated different intermediates than the reactions with the smaller saccharides. We speculate that the low-molecular-weight saccharides could have generated smaller intermediates that templated the formation of ZnO motifs with high photocatalytic activity. Although we do not have direct evidence explaining the variations in the photocatalytic activity between the saccharide-derived ZnO NPs, there could be several causes, such as differences in the surface area and the nature of the impurities or intermediates that templated the active nanostructures in the ZnO NPs, which warrant further investigation.
After 30 min of UV light exposure, the ZnO-control represented only about 22% MO degradation under the same experimental conditions, possibly due to the more thermodynamically stable state achieved when no saccharide was used during the synthesis. Moreover, no decolorization of the MO solution was observed by just the UV light irradiation. Therefore, it could be concluded from the SEM images and the photocatalytic performances that the saccharides assisted with the formation of a metastable state of ZnO with nanoscopic size ranges and with a high active specific surface area that allowed for a high photocatalytic performance.
The photocatalytic degradation kinetics of MO were studied by the pseudo-first-order kinetic model in Equation (3) [59,60], which is as follows:
kt = −ln (Ct/Co)
In Equation (3), k is the photodegradation rate constant (min−1), Co is the initial concentration of MO at the beginning of the reaction, and Ct is the concentration of MO at time t.
Figure 7c shows that MO photodegradation in the DIW followed the pseudo-first-order kinetics mechanism. The −ln(Ct/Co) versus time (t) graph followed the linear trends, and this linear relationship suggested that the photocatalytic reaction of MO degradation followed the Langmuir–Hinshelwood model [61]. The rate constants of MO degradation on different ZnO NPs were obtained from the slope of the linear fit trendlines. The rate constant values are summarized in Table 1 below. A digital photograph of the decolorization of the MO solution with the progression of photocatalysis by Fructose-ZnO is shown in Figure 7d.
The photodegradation of MO was further studied in a simulated fresh drinking water (FDW) matrix. Simulated FDW has multiple commonly dissolved salts with cations and anions. Considering the fact that the presence of dissolved salts is a factor that influences photocatalytic performances, this study further proves the efficiency and applicability of the ZnO NPs in real-life conditions. The UV–visible spectrum of the MO photodegradation with time in the simulated FDW by Fructose-ZnO, as a representative, is shown in Figure 8a. After 30 min of UV light illumination, almost a complete decolorization of MO was obtained, indicating that the ZnO NPs’ photocatalytic performance in the simulated FDW is almost the same as in the DIW. The percent degradation of the MO solution in the simulated FDW (Figure 8b) was also found to be similar to that in the DIW (Figure 7b). Therefore, it could be inferred that the photocatalytic performance of the ZnO NPs prepared in this study is very similar in different water matrices, irrespective of the presence of dissolved salts.
The −ln (Ct/Co) vs. time (t) graph followed a linear trend in MO degradation in the simulated FDW, like the MO degradation in the DIW, in Figure 8c. However, upon closer examination, it was observed that all the saccharide-mediated ZnO NPs and controls exhibited almost identical trends, as seen in Figure 7c, except Glucose-ZnO and Dextrin-ZnO, which displayed slight deviations from the linear trend. Yet, when the last data point for Glucose-ZnO and Dextrin-ZnO was removed, both datasets conformed to the expected pseudo-first-order kinetics. This leads to the belief that the final data point does not align with the rest of the dataset and significantly deviates when compared to the data mean at shorter time intervals. This could be due to the alteration in the ionic composition of the simulated FDW, which raises the possibility of interference by the ions in the noncatalytic process. Therefore, it is indicated that the MO photodegradation kinetics in the DIW and simulated FDW followed the pseudo-first-order reaction mechanism. Moreover, the linear relationship between −ln (Ct/Co) and time (t) of the photodegradation of MO followed the Langmuir–Hinshelwood (LH) mechanism as well [62]. The rate constants (kapp) of MO degradation were calculated from the slope of the −ln (Ct/Co) vs. time (t) graph, which is presented in Table 1.
The applicability of the ZnO NPs was further evaluated by the degradation of MO under sunlight irradiation. A bright sunny day was chosen to conduct the MO photodegradation reaction under natural sunlight, and the average sunlight intensity was measured to be ~100,000 lux during the photodegradation (The University of Texas at El Paso, coordinates: 31.7732° N, 106.5047° W; date: 08.04.2023; and time: 1:30 pm). The percentage of MO degradation with time by different ZnO NPs in the DIW under sunlight is shown in Figure 9a. It was found that Fructose-ZnO was the most active photocatalyst under direct sunlight and UV light and achieved almost the complete decolorization of MO in 12 min. In contrast, Dextrin-ZnO achieved almost complete decolorization after 15 min, and Glucose-ZnO achieved 92% decolorization after 15 min. Starch-ZnO demonstrated comparatively slower activity and reached 92% decolorization of MO after 18 min.
After 18 min of sunlight exposure, the ZnO-control represented about 19% MO degradation under the same experimental conditions when no saccharide was used during the synthesis. The nanostructured nature of the saccharide-derived ZnO NPs favors higher photocatalytic activity compared with the ZnO-control.
Figure 9b shows that MO photodegradation in the DIW under sunlight followed the same pseudo-first-order kinetics mechanism as the −ln(Ct/Co) versus time (t) graph, which followed the linear trends. This linear relationship further indicates that the photocatalytic reaction of MO degradation also followed the Langmuir–Hinshelwood model [63].
Comparing the MO degradation under UV light and sunlight irradiation, it was found that the MO degradation was faster under sunlight illumination. This could be due to the higher intensity of sunlight (~100,000 lux) compared to UV light (22,000 lux) in the box reactor. Within the solar spectrum, UV light accounts for approximately 3–5% (λ < 400 nm), while 47% is attributed to visible light (400 > λ < 700 nm), and the rest is in the infrared region [64]. This UV portion of the sunlight might have caused the photocatalytic activity of the ZnO NPs in MO degradation.
The rate constants of all the photocatalytic reactions performed in this study are given in Table 1.

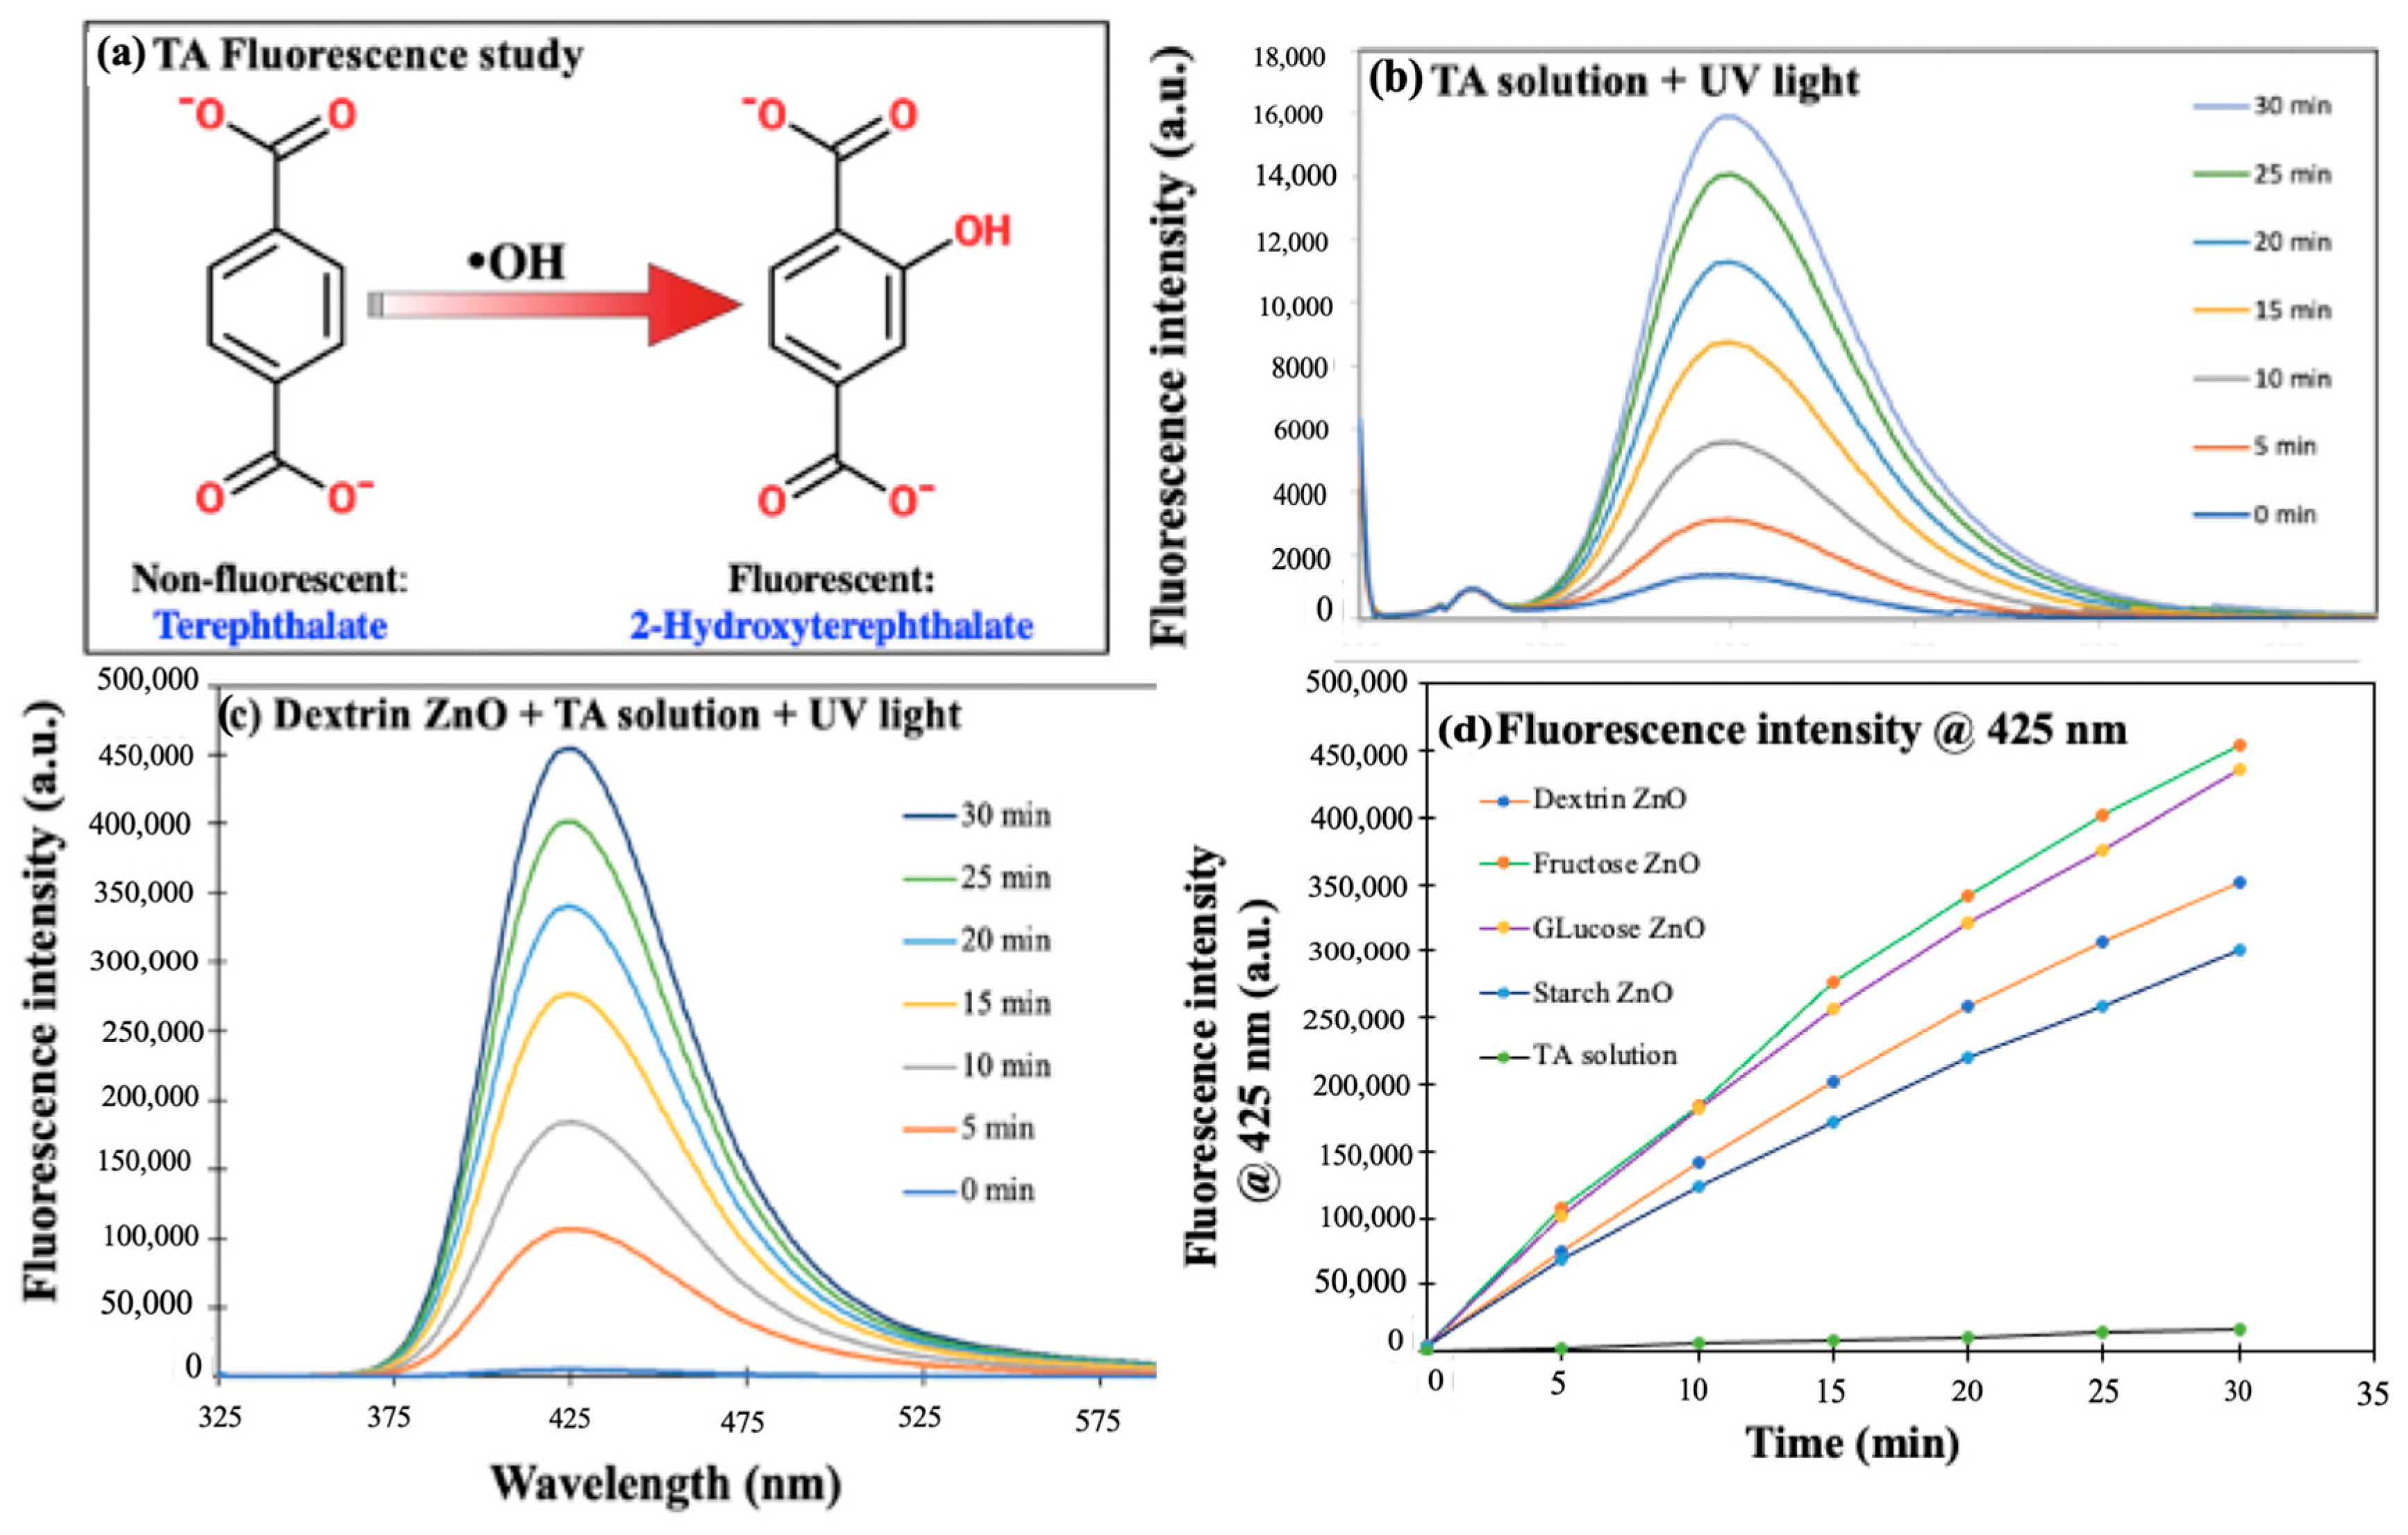
3.2.7. Determination of ROS Generation by the ZnO NPs

The hydroxyl radical (•OH) generation was confirmed by the terephthalic acid (TA) photoluminescence (PL) study [65]. The mechanism of action of this study is explained as follows: sodium terephthalate reacts with the •OH (photocatalytically generated) on the ZnO NPs to form 2-hydroxy terephthalate, which denotes a strong fluorescence emission band centered at 425 nm at an excitation wavelength of 315 nm. Therefore, it could be said that the higher the fluorescence intensity, the greater the quantity of generation of •OH at the water–catalyst interface.
The results of the TA PL tests are shown in Figure 10. The reaction of terephthalate with the photocatalytically generated •OH radical to form 2-hydroxy terephthalate is shown in Figure 10a. Figure 10b shows the fluorescence emission spectra of the 2-hydroxy terephthalate solution with respect to time without the Dextrin-ZnO NPs. The fluorescence intensity of the 2-hydroxy terephthalate solution gradually elevated with the increment in the UV light exposure time, which proved the graduate increase in the production of •OH with respect to time under UV light illumination. The time-dependent fluorescence emission spectra of the 2-hydroxy terephthalate solution photocatalyzed by Dextrin-ZnO are shown in Figure 10c. Figure 10d shows the comparison in the production of •OH by the saccharide-derived ZnO NPs. Figure 10d was obtained by plotting the fluorescence intensity of the 2-hydroxy terephthalate solution at 425 nm vs. the time of light irradiation.
Based on the results of this PL study, it was found that the PL intensity of the TA solution at 425 nm catalyzed by the ZnO NPs was much higher than the control TA solution that did not have any ZnO. These results prove that the ZnO NPs generated the •OH during UV light irradiation.
Like the MO degradation, Fructose-ZnO and Glucose-ZnO showed a higher rate of •OH generation than the other ZnO NPs. Starch-ZnO had the slowest rate of •OH generation among all the ZnO NPs prepared in this study. These results further confirmed the ZnO NPs’ photocatalytic performance towards the MO’s oxidative degradation by radicals such as •OH, which can also degrade other organic pollutants in water and sanitize water.

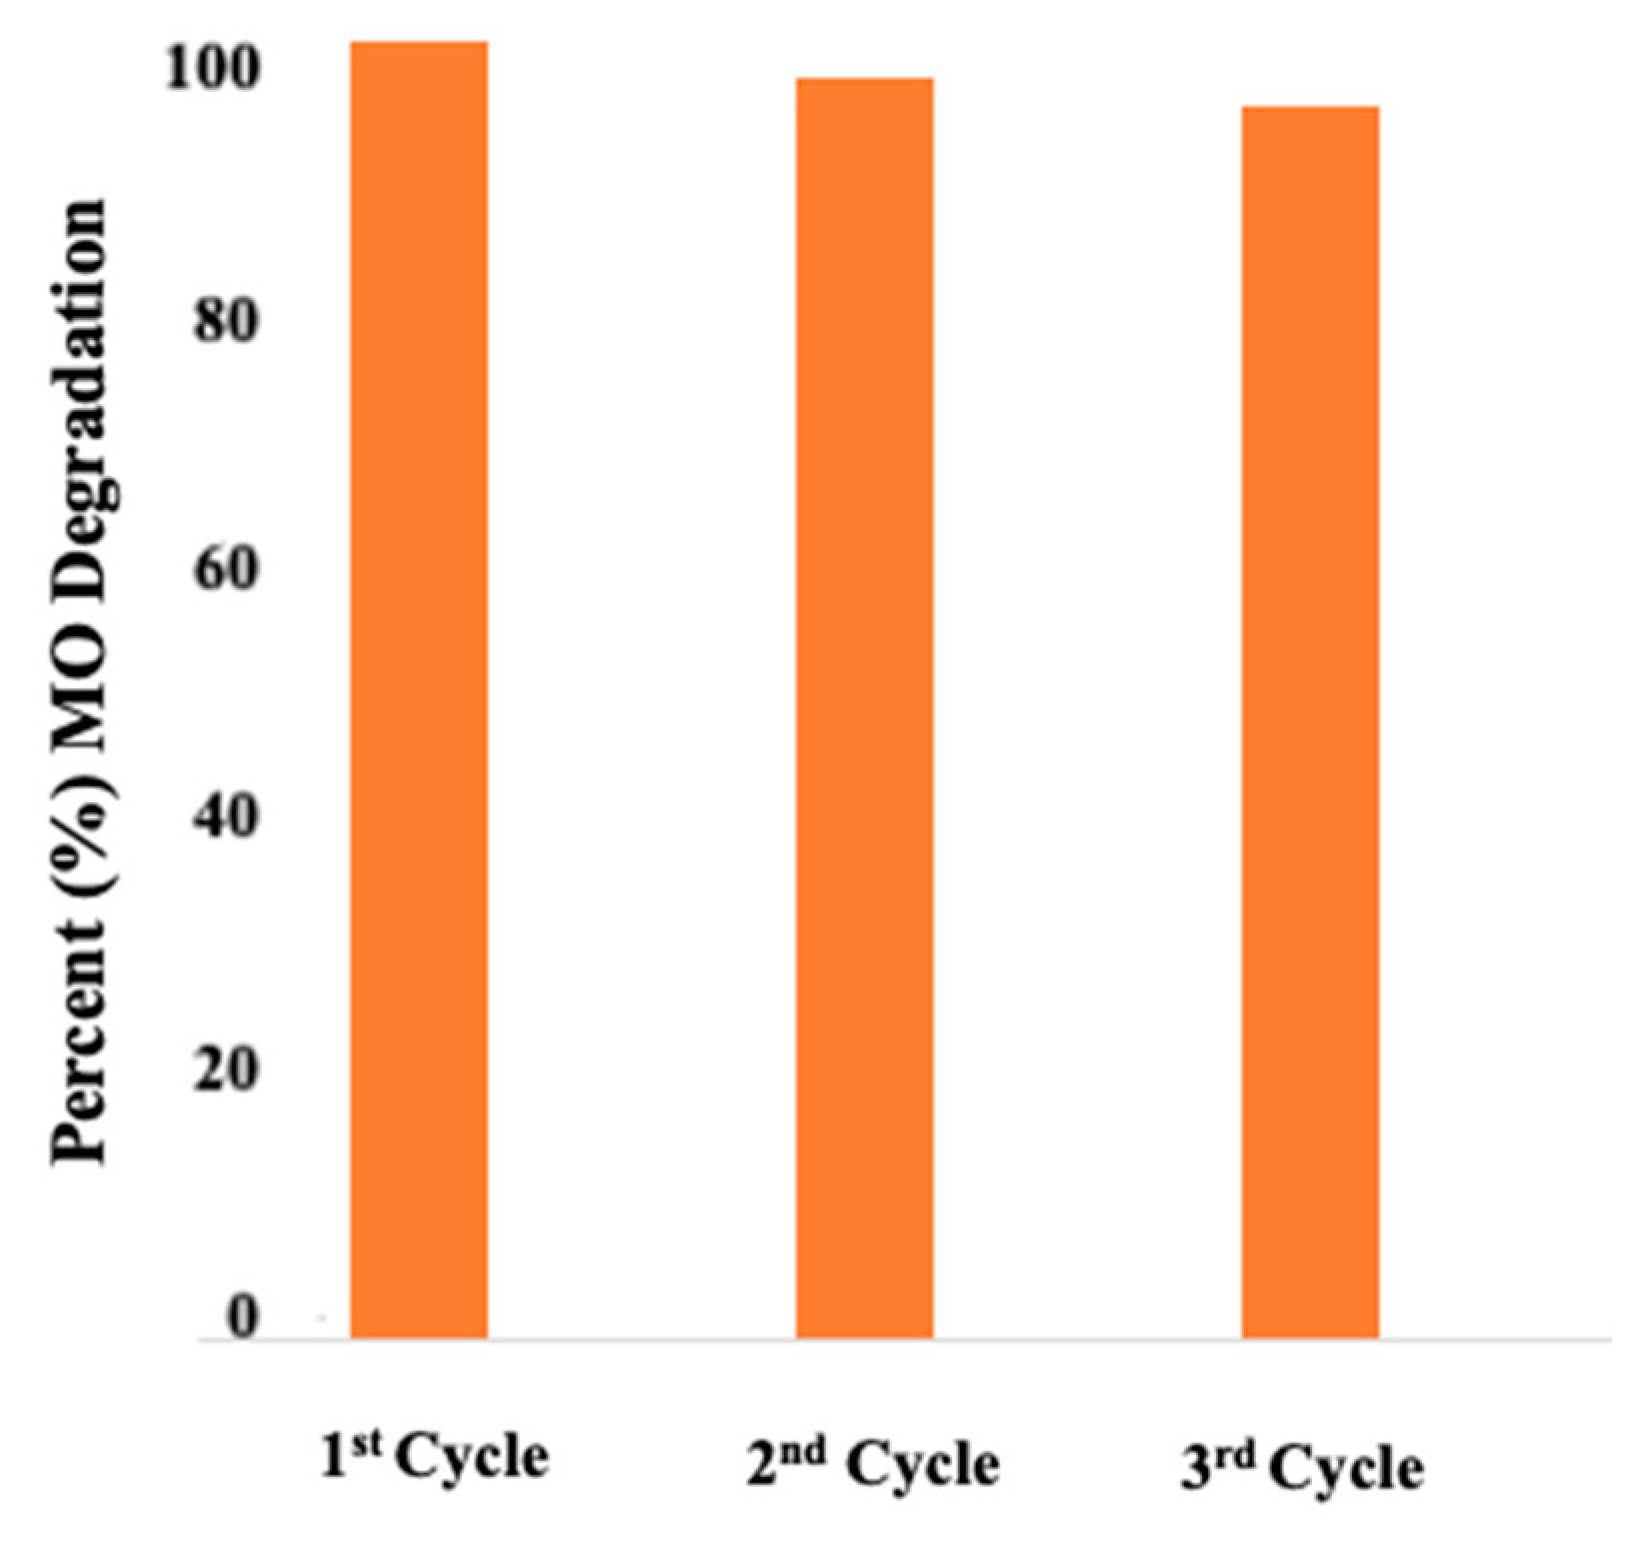
3.2.8. Cyclic Stability of the ZnO NPs

The cyclic stability experiment was conducted to assess the stability of the ZnO NPs by performing the photodegradation of MO over three cycles. For that experiment, 30 mL of a 5 ppm MO solution with 30 mg of Fructose-ZnO NPs (as a representative) was added to a 250 mL beaker and exposed to the mixture under UV light for 30 min. Afterward, the mixture underwent centrifugation at a speed of 4000 rpm for 10 min to achieve a transparent supernatant. This transparent liquid was then subjected to UV-vis spectroscopy analysis to quantify the percent degradation of MO. This process was repeated for subsequent cycles by using the centrifuged ZnO NPs.
The photocatalytic activity of the ZnO NPs over the course of three cycles is illustrated in Figure 11. The results demonstrate that the ZnO NPs exhibited a reliable performance throughout the study. In each cycle, more than 95% of the MO was degraded by the ZnO NPs. Based on these findings, it can be inferred that the saccharide-derived ZnO NPs synthesized in this study have the potential to serve as a durable and effective photocatalyst for the degradation of organic pollutants in wastewater.

4. Conclusions

This study demonstrated that saccharides such as glucose, fructose, dextrin, and starch are excellent reagents for making ZnO NPs with high photocatalytic activity. The saccharide-derived ZnO NPs were characterized with XRPD, XPS, UV-vis, SEM-EDS, and TEM. They efficiently photodegraded MO dye in aqueous solutions under UV-C or natural sunlight irradiation. The highest photocatalytic activity was obtained with the Fructose-ZnO NPs, and the least active NPs were the Starch-ZnO NPs. The effectiveness of degrading MO was nearly equal in the deionized water and simulated fresh drinking water matrices. Based on the terephthalic acid photoluminescence test, the ability of the saccharide-derived ZnO NPs to generate hydroxyl radicals (•OH) was demonstrated. The present method offers a facile synthetic route for highly active ZnO NPs with a wide range of water treatment and sanitation applications.

Supplementary Materials

The following supporting information can be downloaded at: https://www.mdpi.com/article/10.3390/suschem4040023/s1, the supporting information file contains data related to the UV–visible spectra, XRPD, and XPS. Figure S1: (a) The UV-visible absorption spectrum of Dextrin-ZnO NPs suspension in ethanol, (b) Tauc plot for the determination of bandgap of ZnO NPs. Figure S2: (a) The UV-visible absorption spectrum of Glucose-ZnO NPs suspension in ethanol, (b) Tauc plot for the determination of bandgap of ZnO NPs. Figure S3: (a) The UV-visible absorption spectrum of Starch-ZnO NPs suspension in ethanol, (b) Tauc plot for the determination of bandgap of ZnO NPs. Figure S4: XRPD Patterns of the Dextrin ZnO NP and ZnO control. Figure S5: XRPD Patterns of the Glucose ZnO NP and ZnO control. Figure S6: XRPD Patterns of the Starch ZnO NP and ZnO control. Figure S7: (a) XPS survey spectrum of Dextrin ZnO, (b) XPS spectrum of Zn 2p, (c) XPS spectrum of O 1s. Figure S8: (a) XPS survey spectrum of Glucose ZnO, (b) XPS spectrum of Zn 2p, (c) XPS spectrum of O 1s. Figure S9: (a) XPS survey spectrum of Starch ZnO, (b) XPS spectrum of Zn 2p, (c) XPS spectrum of O 1s.

Author Contributions

Conceptualization, K.A.S.; methodology, K.A.S.; characterization, M.T.I., J.H.O., Z.N.D., I.R.G.-E., B.A.-T. and K.A.S.; writing—original draft preparation, K.A.S. and J.H.O.; writing—review and editing, J.C.N.; supervision, J.C.N.; project administration, J.C.N. All authors have read and agreed to the published version of the manuscript.

Funding

This research was funded by the National Institute of Food and Agriculture, grant 2019-38422-30214; the National Science Foundation ERC Nanotechnology-Enabled Water Treatment, 1449500; and the Ralph and Kathleen Ponce de Leon Endowment for J.C.N.

Institutional Review Board Statement

Not applicable.

Informed Consent Statement

Not applicable.

Data Availability Statement

The data presented in this study are available within the article. If additional data are needed, they will be available upon request from the corresponding author.

Conflicts of Interest

The authors declare no conflict of interest.

References

  1. Chen, Y.; Fan, Z.; Zhang, Z.; Niu, W.; Li, C.; Yang, N.; Zhang, H. Two-dimensional metal nanomaterials: Synthesis, properties, and applications. Chem. Rev. 2018, 118, 6409–6455. [Google Scholar] [CrossRef] [PubMed]
  2. Zhu, Y.; Peng, L.; Fang, Z.; Yan, C.; Zhang, X.; Yu, G. Structural engineering of 2D nanomaterials for energy storage and catalysis. Adv. Mater. 2018, 30, 1706347. [Google Scholar] [CrossRef] [PubMed]
  3. Giljohann, D.A.; Seferos, D.S.; Daniel, W.L.; Massich, M.D.; Patel, P.C.; Mirkin, C.A. Gold nanoparticles for biology and medicine. Angew. Chem. Int. Ed. 2010, 49, 3280–3294. [Google Scholar] [CrossRef] [PubMed]
  4. Campelo, J.M.; Luna, D.; Luque, R.; Marinas, J.M.; Romero, A.A. Sustainable preparation of supported metal nanoparticles and their applications in catalysis. ChemSusChem 2009, 2, 18–45. [Google Scholar] [CrossRef] [PubMed]
  5. Sathyavathi, R.; Krishna, M.B.; Rao, S.V.; Saritha, R.; Rao, D.N. Biosynthesis of silver nanoparticles using Coriandrum sativum leaf extract and their application in nonlinear optics. Adv. Sci. Lett. 2010, 3, 138–143. [Google Scholar] [CrossRef]
  6. Kim, T.Y.; Song, D.; Barea, E.M.; Lee, J.H.; Kim, Y.R.; Cho, W.; Kang, Y.S. Origin of the high open-circuit voltage in solid-state dye-sensitized solar cells employing polymer electrolyte. Nano Energy 2016, 28, 455–461. [Google Scholar] [CrossRef]
  7. Wang, J.; Polleux, J.; Lim, J.; Dunn, B. Pseudocapacitive contributions to electrochemical energy storage in TiO2 (anatase) nanoparticles. J. Phys. Chem. C 2007, 111, 14925–14931. [Google Scholar] [CrossRef]
  8. Luo, X.; Morrin, A.; Killard, A.J.; Smyth, M.R. Application of nanoparticles in electrochemical sensors and biosensors. Electroanalysis 2006, 18, 319–326. [Google Scholar] [CrossRef]
  9. He, Z.; Zhang, Z.; Bi, S. Nanoparticles for organic electronics applications. Mater. Res. Express 2020, 7, 012004. [Google Scholar] [CrossRef]
  10. Huang, X.; Neretina, S.; El-Sayed, M.A. Gold nanorods: From synthesis and properties to biological and biomedical applications. Adv. Mater. 2009, 21, 4880–4910. [Google Scholar] [CrossRef]
  11. Singh, J.; Dutta, T.; Kim, K.H.; Rawat, M.; Samddar, P.; Kumar, P. ‘Green’ synthesis of metals and their oxide nanoparticles: Applications for environmental remediation. J. Nanobiotechnol. 2018, 16, 1–24. [Google Scholar] [CrossRef] [PubMed]
  12. Badawy, A.A.; Ghanem, A.F.; Yassin, M.A.; Youssef, A.M.; Rehim, M.H.A. Utilization and characterization of cellulose nanocrystals decorated with silver and zinc oxide nanoparticles for removal of lead ion from wastewater. Environ. Nanotechnol. Monit. Manag. 2021, 16, 100501. [Google Scholar] [CrossRef]
  13. Das, T.K.; Poater, A. Review on the use of heavy metal deposits from water treatment waste towards catalytic chemical syntheses. Int. J. Mol. Sci. 2021, 22, 13383. [Google Scholar] [CrossRef] [PubMed]
  14. Somu, P.; Paul, S. Casein-based biogenic-synthesized zinc oxide nanoparticles simultaneously decontaminate heavy metals, dyes, and pathogenic microbes: A rational strategy for wastewater treatment. J. Chem. Technol. Biotechnol. 2018, 93, 2962–2976. [Google Scholar] [CrossRef]
  15. Hariharan, C. Photocatalytic degradation of organic contaminants in water by ZnO nanoparticles: Revisited. Appl. Catal. A Gen. 2006, 304, 55–61. [Google Scholar] [CrossRef]
  16. Liu, Y.; Deng, Y.; Sun, Z.; Wei, J.; Zheng, G.; Asiri, A.M.; Zhao, D. Hierarchical Cu2S micro sponges constructed from nanosheets for efficient photocatalysis. Small 2013, 9, 2702–2708. [Google Scholar] [CrossRef]
  17. Kumar, S.G.; Rao, K.K. Zinc oxide based photocatalysis: Tailoring surface-bulk structure and related interfacial charge carrier dynamics for better environmental applications. Rsc Adv. 2015, 5, 3306–3351. [Google Scholar] [CrossRef]
  18. Hossain, M.A.; Elias, M.; Sarker, D.R.; Diba, Z.R.; Mithun, J.M.; Azad, M.A.K.; Uddin, M.N. Synthesis of Fe-or Ag-doped TiO2–MWCNT nanocomposite thin films and their visible-light-induced catalysis of dye degradation and antibacterial activity. Res. Chem. Intermed. 2018, 44, 2667–2683. [Google Scholar] [CrossRef]
  19. Wahid, K.A.; Rahim, I.A.; Safri, S.N.; Ariffin, A.H. Synthesis of ZnO nanorods at very low temperatures using ultrasonically pre-treated growth solution. Processes 2023, 11, 708. [Google Scholar] [CrossRef]
  20. Lv, M.S.; Li, C.; Li, Y.N.; Zhang, X.F.; Deng, Z.P.; Cheng, X.L.; Gao, S. Facilely controlled synthesis of porous ZnO nanotubes with rich oxygen vacancies for highly sensitive and selective detection of NO2 at low temperatures. Sens. Actuators B Chem. 2023, 375, 132865. [Google Scholar] [CrossRef]
  21. Wang, X.; Song, J.; Wang, Z.L. Nanowire and nanobelt arrays of zinc oxide from synthesis to properties and to novel devices. J. Mater. Chem. 2007, 17, 711–720. [Google Scholar] [CrossRef]
  22. Kumar, R.; Kumar, G.; Umar, A. ZnO nano-mushrooms for photocatalytic degradation of methyl orange. Mater. Lett. 2013, 97, 100–103. [Google Scholar] [CrossRef]
  23. Sharma, H.; Kaur, N.; Singh, N.; Jang, D.O. Synergetic catalytic effect of ionic liquids and ZnO nanoparticles on the selective synthesis of 1, 2-disubstituted benzimidazoles using a ball-milling technique. Green Chem. 2015, 17, 4263–4270. [Google Scholar] [CrossRef]
  24. Krobthong, S.; Rungsawang, T.; Wongrerkdee, S. Comparison of ZnO Nanoparticles Prepared by Precipitation and Combustion for UV and Sunlight-Driven Photocatalytic Degradation of Methylene Blue. Toxics 2023, 11, 266. [Google Scholar] [CrossRef]
  25. Jalali, T.; Ghanavati, F.; Osfouri, S. Green synthesis of ZnO nanoparticles using marine brown algae (Cystoseira) extract comprising sol–gel, and combustion techniques based on dye-sensitized solar cells application. Int. J. Mod. Phys. B 2023, 245017. [Google Scholar] [CrossRef]
  26. Alberti, S.; Basciu, I.; Vocciante, M.; Ferretti, M. Experimental and physicochemical comparison of ZnO nanoparticles’ activity for photocatalytic applications in wastewater treatment. Catalysts 2021, 11, 678. [Google Scholar] [CrossRef]
  27. Yu, J.; Liu, X.; Wang, G.; Zhi, H.; Dong, J.; Hao, J.; Zhang, X.; Liu, B. Synthesis of the porous ZnO nanosheets and tio2/zno/fto composite films by a low-temperature hydrothermal method and their applications in photocatalysis and electrochromism. Coatings 2022, 12, 695. [Google Scholar]
  28. Sansenya, T.; Masri, N.; Chankhanittha, T.; Senasu, T.; Piriyanon, J.; Mukdasai, S.; Nanan, S. Hydrothermal synthesis of ZnO photocatalyst for detoxification of anionic azo dyes and antibiotics. J. Phys. Chem. Solids 2022, 160, 110353. [Google Scholar] [CrossRef]
  29. Ding, J.; Chen, S.; Han, N.; Shi, Y.; Hu, P.; Li, H.; Wang, J. Aerosol-assisted chemical vapor deposition of nanostructured ZnO thin films for NO2 and ethanol monitoring. Ceram. Int. 2020, 46, 15152–15158. [Google Scholar] [CrossRef]
  30. Ponja, S.D.; Sathasivam, S.; Parkin, I.P.; Carmalt, C.J. Highly conductive and transparent gallium-doped zinc oxide thin films via chemical vapor deposition. Sci. Rep. 2020, 10, 638. [Google Scholar] [CrossRef]
  31. Shkir, M.; Palanivel, B.; Khan, A.; Kumar, M.; Chang, J.H.; Mani, A.; AlFaify, S. Enhanced photocatalytic activities of facile auto-combustion synthesized ZnO nanoparticles for wastewater treatment: An impact of Ni doping. Chemosphere 2022, 291, 132687. [Google Scholar] [CrossRef]
  32. Sultana, K.A.; Islam, M.T.; Silva, J.A.; Turley, R.S.; Hernandez-Viezcas, J.A.; Gardea-Torresdey, J.L.; Noveron, J.C. Sustainable synthesis of zinc oxide nanoparticles for photocatalytic degradation of organic pollutant and generation of hydroxyl radical. J. Mol. Liq. 2020, 307, 112931. [Google Scholar] [CrossRef]
  33. Naik, M.A.; Mishra, B.G.; Dubey, A. Combustion synthesized WO3–ZrO2 nanocomposites as catalysts for the solvent-free synthesis of coumarins. Colloids Surf. A Physicochem. Eng. Asp. 2008, 317, 234–238. [Google Scholar] [CrossRef]
  34. Ngulube, T.; Gumbo, J.R.; Masindi, V.; Maity, A. An update on synthetic dye adsorption onto clay-based minerals: A state-of-art review. J. Environ. Manag. 2017, 191, 35–57. [Google Scholar] [CrossRef]
  35. Morcillo-Martín, R.; Espinosa, E.; Rabasco-Vílchez, L.; Sanchez, L.M.; de Haro, J.; Rodríguez, A. Cellulose nanofiber-based aerogels from wheat straw: Influence of surface load and lignin content on their properties and dye removal capacity. Biomolecules 2022, 12, 232. [Google Scholar] [CrossRef] [PubMed]
  36. Maleki, A.; Moradi, F.; Shahmoradi, B.; Rezaee, R.; Lee, S.M. The photocatalytic removal of diazinon from aqueous solutions using tungsten oxide doped zinc oxide nanoparticles immobilized on a glass substrate. J. Mol. Liq. 2020, 297, 111918. [Google Scholar] [CrossRef]
  37. Szostak, K.; Banach, M. Sorption and photocatalytic degradation of methylene blue on bentonite-ZnO-CuO nanocomposite. J. Mol. Liq. 2019, 286, 110859. [Google Scholar] [CrossRef]
  38. Kausar, A.; Iqbal, M.; Javed, A.; Aftab, K.; Bhatti, H.N.; Nouren, S. Dyes adsorption using clay and modified clay: A review. J. Mol. Liq. 2018, 256, 395–407. [Google Scholar] [CrossRef]
  39. Chen, Y.; He, F.; Ren, Y.; Peng, H.; Huang, K. Fabrication of chitosan/PAA multilayer onto magnetic microspheres by LbL method for removal of dyes. J. Chem. Eng. 2014, 249, 79–92. [Google Scholar] [CrossRef]
  40. Adeel, M.; Saeed, M.; Khan, I.; Muneer, M.; Akram, N. Synthesis and characterization of Co–ZnO, and evaluation of its photocatalytic activity for photodegradation of methyl orange. ACS Omega 2021, 6, 1426–1435. [Google Scholar] [CrossRef]
  41. Aljuaid, A.; Almehmadi, M.; Alsaiari, A.A.; Allahyani, M.; Abdulaziz, O.; Alsharif, A.; Alsaiari, J.A.; Saih, M.; Alotaibi, R.T.; Khan, I. g-C3N4 Based Photocatalyst for the Efficient Photodegradation of Toxic Methyl Orange Dye: Recent Modifications and Future Perspectives. Molecules 2023, 28, 3199. [Google Scholar] [CrossRef] [PubMed]
  42. Bhosale, A.; Kadam, J.; Gade, T.; Sonawane, K.; Garadkar, K. Efficient photodegradation of methyl orange and bactericidal activity of Ag-doped ZnO nanoparticles. J. Indian Chem. Soc. 2023, 100, 100920. [Google Scholar] [CrossRef]
  43. Khan, S.; Naushad, M.; Govarthanan, M.; Iqbal, J.; Alfadul, S.M. Emerging contaminants of high concern for the environment: Current trends and future research. Environ. Res. 2022, 207, 112609. [Google Scholar] [CrossRef]
  44. Hasnat, M.A.; Safwan, J.A.; Islam, M.S.; Rahman, Z.; Karim, M.R.; Pirzada, T.J.; Rahman, M.M. Electrochemical decolorization of Methylene blue at Pt electrode in KCl solution for environmental remediation. J. Ind. Eng. Chem. 2015, 21, 787–791. [Google Scholar] [CrossRef]
  45. Ljubas, D.; Smoljanić, G.; Juretić, H. Degradation of Methyl Orange and Congo Red dyes using TiO2 nanoparticles activated by the solar and the solar-like radiation. J. Environ. Manag. 2015, 161, 83–91. [Google Scholar] [CrossRef]
  46. Piaskowski, K.; Świderska-Dąbrowska, R.; Zarzycki, P.K. Dye removal from water and wastewater using various physical, chemical, and biological processes. J. AOAC Int. 2018, 101, 1371–1384. [Google Scholar] [CrossRef]
  47. Islam, M.T.; Jing, H.; Yang, T.; Zubia, E.; Goos, A.G.; Bernal, R.A.; Noveron, J.C. Fullerene stabilized gold nanoparticles supported on titanium dioxide for enhanced photocatalytic degradation of methyl orange and catalytic reduction of 4-nitrophenol. J. Environ. Chem. Eng. 2018, 6, 3827–3836. [Google Scholar] [CrossRef]
  48. Islam, M.T.; Dominguez, A.; Turley, R.S.; Kim, H.; Sultana, K.A.; Shuvo, M.A.I.; Noveron, J.C. Development of photocatalytic paint based on TiO2 and photopolymer resin for the degradation of organic pollutants in water. Sci. Total Environ. 2020, 704, 135406. [Google Scholar] [CrossRef]
  49. Islam, M.T.; Dominguez, A.; Alvarado-Tenorio, B.; Bernal, R.A.; Montes, M.O.; Noveron, J.C. Sucrose-mediated fast synthesis of zinc oxide nanoparticles for the photocatalytic degradation of organic pollutants in water. ACS Omega 2019, 4, 6560–6572. [Google Scholar] [CrossRef]
  50. Meena, P.L.; Poswal, K.; Surela, A.K. Facile synthesis of ZnO nanoparticles for the effective photodegradation of malachite green dye in aqueous solution. Water Environ. J. 2022, 36, 513–524. [Google Scholar] [CrossRef]
  51. Becheri, A.; Dürr, M.; Lo Nostro, P.; Baglioni, P. Synthesis and characterization of zinc oxide nanoparticles: Application to textiles as UV-absorbers. J. Nanopart. Res. 2008, 10, 679–689. [Google Scholar] [CrossRef]
  52. Tripathy, N.; Ahmad, R.; Song, J.E.; Ko, H.A.; Hahn, Y.B.; Khang, G. Photocatalytic degradation of methyl orange dye by ZnO nanoneedle under UV irradiation. Mater. Lett. 2014, 136, 171–174. [Google Scholar] [CrossRef]
  53. Salem, M.; Salem, J.; Ghannam, H.; Massoudi, I.; Bourguiba, F.; Gaidi, M. Optical and passivation properties of ZnO: Fe on silicon substrates. J. Mater. Sci. Mater. Electron. 2023, 34, 332. [Google Scholar] [CrossRef]
  54. Raoufi, D. Synthesis, and microstructural properties of ZnO nanoparticles prepared by precipitation method. Renew. Energy 2013, 50, 932–937. [Google Scholar] [CrossRef]
  55. Bindu, P.; Thomas, S. Estimation of lattice strain in ZnO nanoparticles: X-ray peak profile analysis. J. Theor. Appl. Phys. 2014, 8, 123–134. [Google Scholar] [CrossRef]
  56. Salavati-Niasari, M.; Davar, F.; Khansari, A. Nanosphericals and nano bundles of ZnO: Synthesis and characterization. J. Alloys Compd. 2011, 509, 61–65. [Google Scholar] [CrossRef]
  57. Claros, M.; Setka, M.; Jimenez, Y.P.; Vallejos, S. AACVD synthesis and characterization of iron and copper oxides modified ZnO structured films. Nanomaterials 2020, 10, 471. [Google Scholar] [CrossRef]
  58. Lupan, O.; Emelchenko, G.A.; Ursaki, V.V.; Chai, G.; Redkin, A.N.; Gruzintsev, A.N.; Yakimov, E.E. Synthesis, and characterization of ZnO nanowires for nanosensor applications. Mater. Res. Bull. 2010, 45, 1026–1032. [Google Scholar] [CrossRef]
  59. Molla, M.A.I.; Furukawa, M.; Tateishi, I.; Katsumata, H.; Kaneko, S. Studies of effects of calcination temperature on the crystallinity and optical properties of Ag-doped ZnO nanocomposites. J. Compos. Sci. 2019, 3, 18. [Google Scholar] [CrossRef]
  60. Kaur, J.; Bansal, S.; Singhal, S. Photocatalytic degradation of methyl orange using ZnO nanopowders synthesized via thermal decomposition of oxalate precursor method. Phys. B Condens. Matter 2013, 416, 33–38. [Google Scholar] [CrossRef]
  61. Balcha, A.; Yadav, O.P.; Dey, T. Photocatalytic degradation of methylene blue dye by zinc oxide nanoparticles obtained from precipitation and sol-gel methods. Environ. Sci. Pollut. Res. 2016, 23, 25485–25493. [Google Scholar] [CrossRef] [PubMed]
  62. Prabhakaran, E.K.; Pillay, K. One-step synthesis of AgClNPs/PANI/D-dextrose nanocomposite by interfacial polymerization method and its catalytic and photocatalytic applications. J. Mol. Liq. 2019, 283, 6–29. [Google Scholar] [CrossRef]
  63. He, J.; Zhang, Y.; Guo, Y.; Rhodes, G.; Yeom, J.; Li, H.; Zhang, W. Photocatalytic degradation of cephalexin by ZnO nanowires under simulated sunlight: Kinetics, influencing factors, and mechanisms. Environ. Int. 2019, 132, 105105. [Google Scholar] [CrossRef] [PubMed]
  64. Neelgund, G.M.; Oki, A. ZnO conjugated graphene: An efficient sunlight driven photocatalyst for degradation of organic dyes. Mater. Res. Bull. 2020, 129, 110911. [Google Scholar] [CrossRef]
  65. Shen, J.H.; Chiang, T.H.; Tsai, C.K.; Jiang, Z.W.; Horng, J.J. Mechanistic insights into hydroxyl radical formation of Cu-doped ZnO/g-C3N4 composite photocatalysis for enhanced degradation of ciprofloxacin under visible light: Efficiency, kinetics, products identification and toxicity evaluation. J. Environ. Chem. Eng. 2022, 10, 107352. [Google Scholar] [CrossRef]
Scheme 1. Saccharide (glucose in the scheme above)-mediated combustion synthesis of ZnO NPs.
Suschem 04 00023 sch001
Figure 1. TEM images of the ZnO NPs (a) Dextrin-ZnO, (b) Fructose-ZnO, (c) Glucose-ZnO and (d) Starch-ZnO and (e) the average size of the ZnO NPs based on the TEM image.
Suschem 04 00023 g001
Figure 2. (a) SEM backscattered electron images of Glucose-ZnO; (b,c) X-ray EDS mapping of zinc and oxygen, respectively; (d) SEM backscattered electron image of Fructose-ZnO; (e,f) X-ray EDS mapping of zinc and oxygen, respectively; (g) SEM backscattered electron images of Dextrin-ZnO; (h,i) X-ray EDS mapping of zinc and oxygen, respectively; (j) SEM backscattered electron images of Starch-ZnO; (k,l) X-ray EDS mapping of zinc and oxygen, respectively. Scale bar = 100 μm. Colors identify the indicated element.
Suschem 04 00023 g002
Figure 3. EDX spectra showing the elemental composition of (a) Glucose-ZnO, (b) Fructose-ZnO, (c) Dextrin-ZnO and (d) Starch-ZnO.
Suschem 04 00023 g003
Figure 4. (a) The UV–visible absorption spectrum of Fructose-ZnO NPs’ suspension in ethanol; (b) Tauc plot for the determination of bandgap of Fructose-ZnO.
Suschem 04 00023 g004
Figure 5. XRPD patterns of Fructose-ZnO NP and ZnO-control.
Suschem 04 00023 g005
Figure 6. XPS spectrum of Fructose-ZnO and ZnO-control.
Suschem 04 00023 g006
Figure 7. (a) Time-dependent UV-vis spectra of MO (5 ppm) solution in DIW during photocatalysis by Fructose-ZnO. (b) Percent degradation of MO by ZnO NPs and controls. (c) Pseudo-first-order kinetics of MO photodegradation. (d) A digital photograph of degradation of MO solution during photocatalysis by Fructose-ZnO.
Suschem 04 00023 g007
Figure 8. (a) Time-dependent UV-vis spectra of MO (5 ppm) solution in simulated FDW during photocatalysis by Fructose-ZnO. (b) Percent degradation of MO by ZnO NPs and controls. (c) Pseudo-first-order kinetics of the MO photodegradation.
Suschem 04 00023 g008
Figure 9. (a) Percent degradation of MO in DIW under sunlight irradiation by ZnO NPs and controls. (b) Pseudo-first-order kinetics of the MO degradation under sunlight irradiation.
Suschem 04 00023 g009
Figure 10. (a) Reaction of terephthalate with the photocatalytically generated •OH radical to form 2−hydroxy terephthalate, (b) time-dependent fluorescence emission spectra of 2−hydroxy terephthalate solution without ZnO NPs, (c) fluorescence emission spectra of 2−hydroxy terephthalate solution photocatalyzed by Dextrin-ZnO with respect to time, and (d) fluorescence emission intensity at 425 nm versus time graph for different saccharide-derived ZnO NPs.
Suschem 04 00023 g010
Figure 11. Cyclic stability of Fructose-ZnO NPs during MO degradation for 3 cycles.
Suschem 04 00023 g011
Table 1. Rate constants of all the photocatalytic reactions performed in this study.
ZnO SampleMO Conc.Water MatrixLight SourceRate Constant (min−1)R-squared Value
Glucose-ZnO5 ppmDIWUV1.62 × 10−10.98
Fructose-ZnO5 ppmDIWUV2.65 × 10−10.98
Dextrin-ZnO5 ppmDIWUV2.00 × 10−10.99
Starch-ZnO5 ppmDIWUV1.19 × 10−10.98
ZnO-Control5 ppmDIWUV7.62 × 10−30.98
Glucose-ZnO5 ppmFDWUV2.54 × 10−10.89
Fructose-ZnO5 ppmFDWUV1.39 × 10−10.98
Dextrin-ZnO5 ppmFDWUV1.54 × 10−10.87
Starch-ZnO5 ppmFDWUV5.03 × 10−20.99
ZnO-Control5 ppmFDWUV5.57 × 10−30.99
Glucose-ZnO5 ppmDIWSunlight1.28 × 10−10.95
Fructose-ZnO5 ppmDIWSunlight2.82 × 10−10.99
Dextrin-ZnO5 ppmDIWSunlight2.29 × 10−10.99
Starch-ZnO5 ppmDIWSunlight1.32 × 10−10.99
ZnO-Control5 ppmDIWSunlight3.50 × 10−30.95
MO Solution5 ppmDIW and FDWUV0.0NA
MO Solution5 ppmDIWSunlight0.0NA
Disclaimer/Publisher’s Note: The statements, opinions and data contained in all publications are solely those of the individual author(s) and contributor(s) and not of MDPI and/or the editor(s). MDPI and/or the editor(s) disclaim responsibility for any injury to people or property resulting from any ideas, methods, instructions or products referred to in the content.

