Article

Values and Costs in History: A Case Study on Estimating the Cost of Hadrianic Aqueduct’s Construction

1
Laboratory of Hydrology and Water Resources Development, School of Civil Engineering, National Technical University of Athens, Heroon Polytechneiou 9, 157 80 Zographou, Greece
2
Institute of Structural Analysis and Antiseismic Research, School of Civil Engineering, National Technical University of Athens, Heroon Polytechneiou 9, 157 80 Zographou, Greece
*
Author to whom correspondence should be addressed.
World 2022, 3(2), 260-286; https://doi.org/10.3390/world3020014
Submission received: 28 February 2022 / Revised: 4 April 2022 / Accepted: 13 April 2022 / Published: 19 April 2022

Abstract

:
The pursuit of wealth has been a basic occupation of humans; as it turns out, wealth increases life expectancy. Analyzing global data, we show that money, probably connected with medical care, increase life expectancy. However, the base of real wealth is access to the Water–Energy–Food nexus, and the access to this also increases life expectancy. The first objective of this study was to compare the present values of wealth with antiquity, and we showed that about 1.4 billion people live in the present under the average lower wages of antiquity. As a case study, we analyze the construction of the Hadrianic aqueduct. We present a detailed description of the construction and the used methods, and we identify the total requirement of labor–time. Then, we investigate the wages of various occupations in the first century AD. The second objective of this study was the estimation of the total cost of daily wages for the construction of the project and the effect of the aqueduct on Athenians’ quality of life. Finally, we show that, today, about two billion people live with less available water than Athenians had with the Hadrianic aqueduct in the second century A.D.

«καὶ ἤκουσα ὡς φωνὴν ἐν μέσῳ τῶν τεσσάρων ζῴων λέγουσαν· χοῖνιξ σίτου δηναρίου, καὶ τρεῖς χοίνικες κριθῆς δηναρίου· καὶ τὸ ἔλαιον καὶ τὸν οἶνον μὴ ἀδικήσῃς»
(Καινή Διαθήκη, Aποκάλυψη 6:6) [1]
“and I heard a voice in the midst of the four beasts say: A measure of wheat for a denarius, and three measures of barley for a denarius; and see thou hurt not the oil and the wine.”
(New Testament, Revelation 6.6)

1. Introduction

The history of civilization is a pursuit of wealth. Related archeological data indicate that the growth and storage of wealth was a basic function of human societies that led to stratification. The analysis of the data presented in Section 2 shows that this pursuit is aimed at increasing the life expectancy through access to water, food and energy.
Unfortunately, the quantification of the value of wealth varies both temporally and spatially. The values of gold and silver that are considered archetypal symbols of wealth, in recent history, they have fluctuated over a wide range, as demonstrated in Section 3. For this reason, we also examined the values of wheat, which is a necessary quantity for the survival of humans over time. Additionally, we compare the values of wheat in different phases of history, and we find their correspondence of these values with the present.
In Section 4, we examine the case study of Hadrianic aqueduct’s construction costs. In order to approach and describe the construction of the aqueduct, a related research project [2] was implemented, including in situ research [3] and underground explorations.
The Hadrianic aqueduct of Athens was built in the early second century AD at a time when there was an economic and social continuity from the first century. The available literature gives data from inscriptional evidence, with the correlations between the prices of wheat per liter and the wages of various professions at that time.
In order to quantify the cost of the Hadrianic aqueduct, we describe in detail how it was constructed, we analyze the labor–times required and we calculate the total cost with the corresponding labor and wages of the Roman period.
The study correlates the values in antiquity with values of today’s prices (February 2022) in Greece, which is the place of construction of the aqueduct, and we estimate the costs of a similar project using modern material techniques.
In Section 5, we also estimate the water footprint of an Athenian in the Roman era, and we correlate it with the water consumption of people in different countries. We found that about two billion peoples have access to less water than the Athenians of the Roman era.
Overall, this paper presents a holistic approach of values and costs in history, comparing the prosperity of society in different eras, using standardized measures such as wheat wages and water footprint per capita. Furthermore, this paper presents a unique analytical description of the Hadrianic aqueduct, a large-scale infrastructure construction in antiquity, estimating its cost in standardize values.

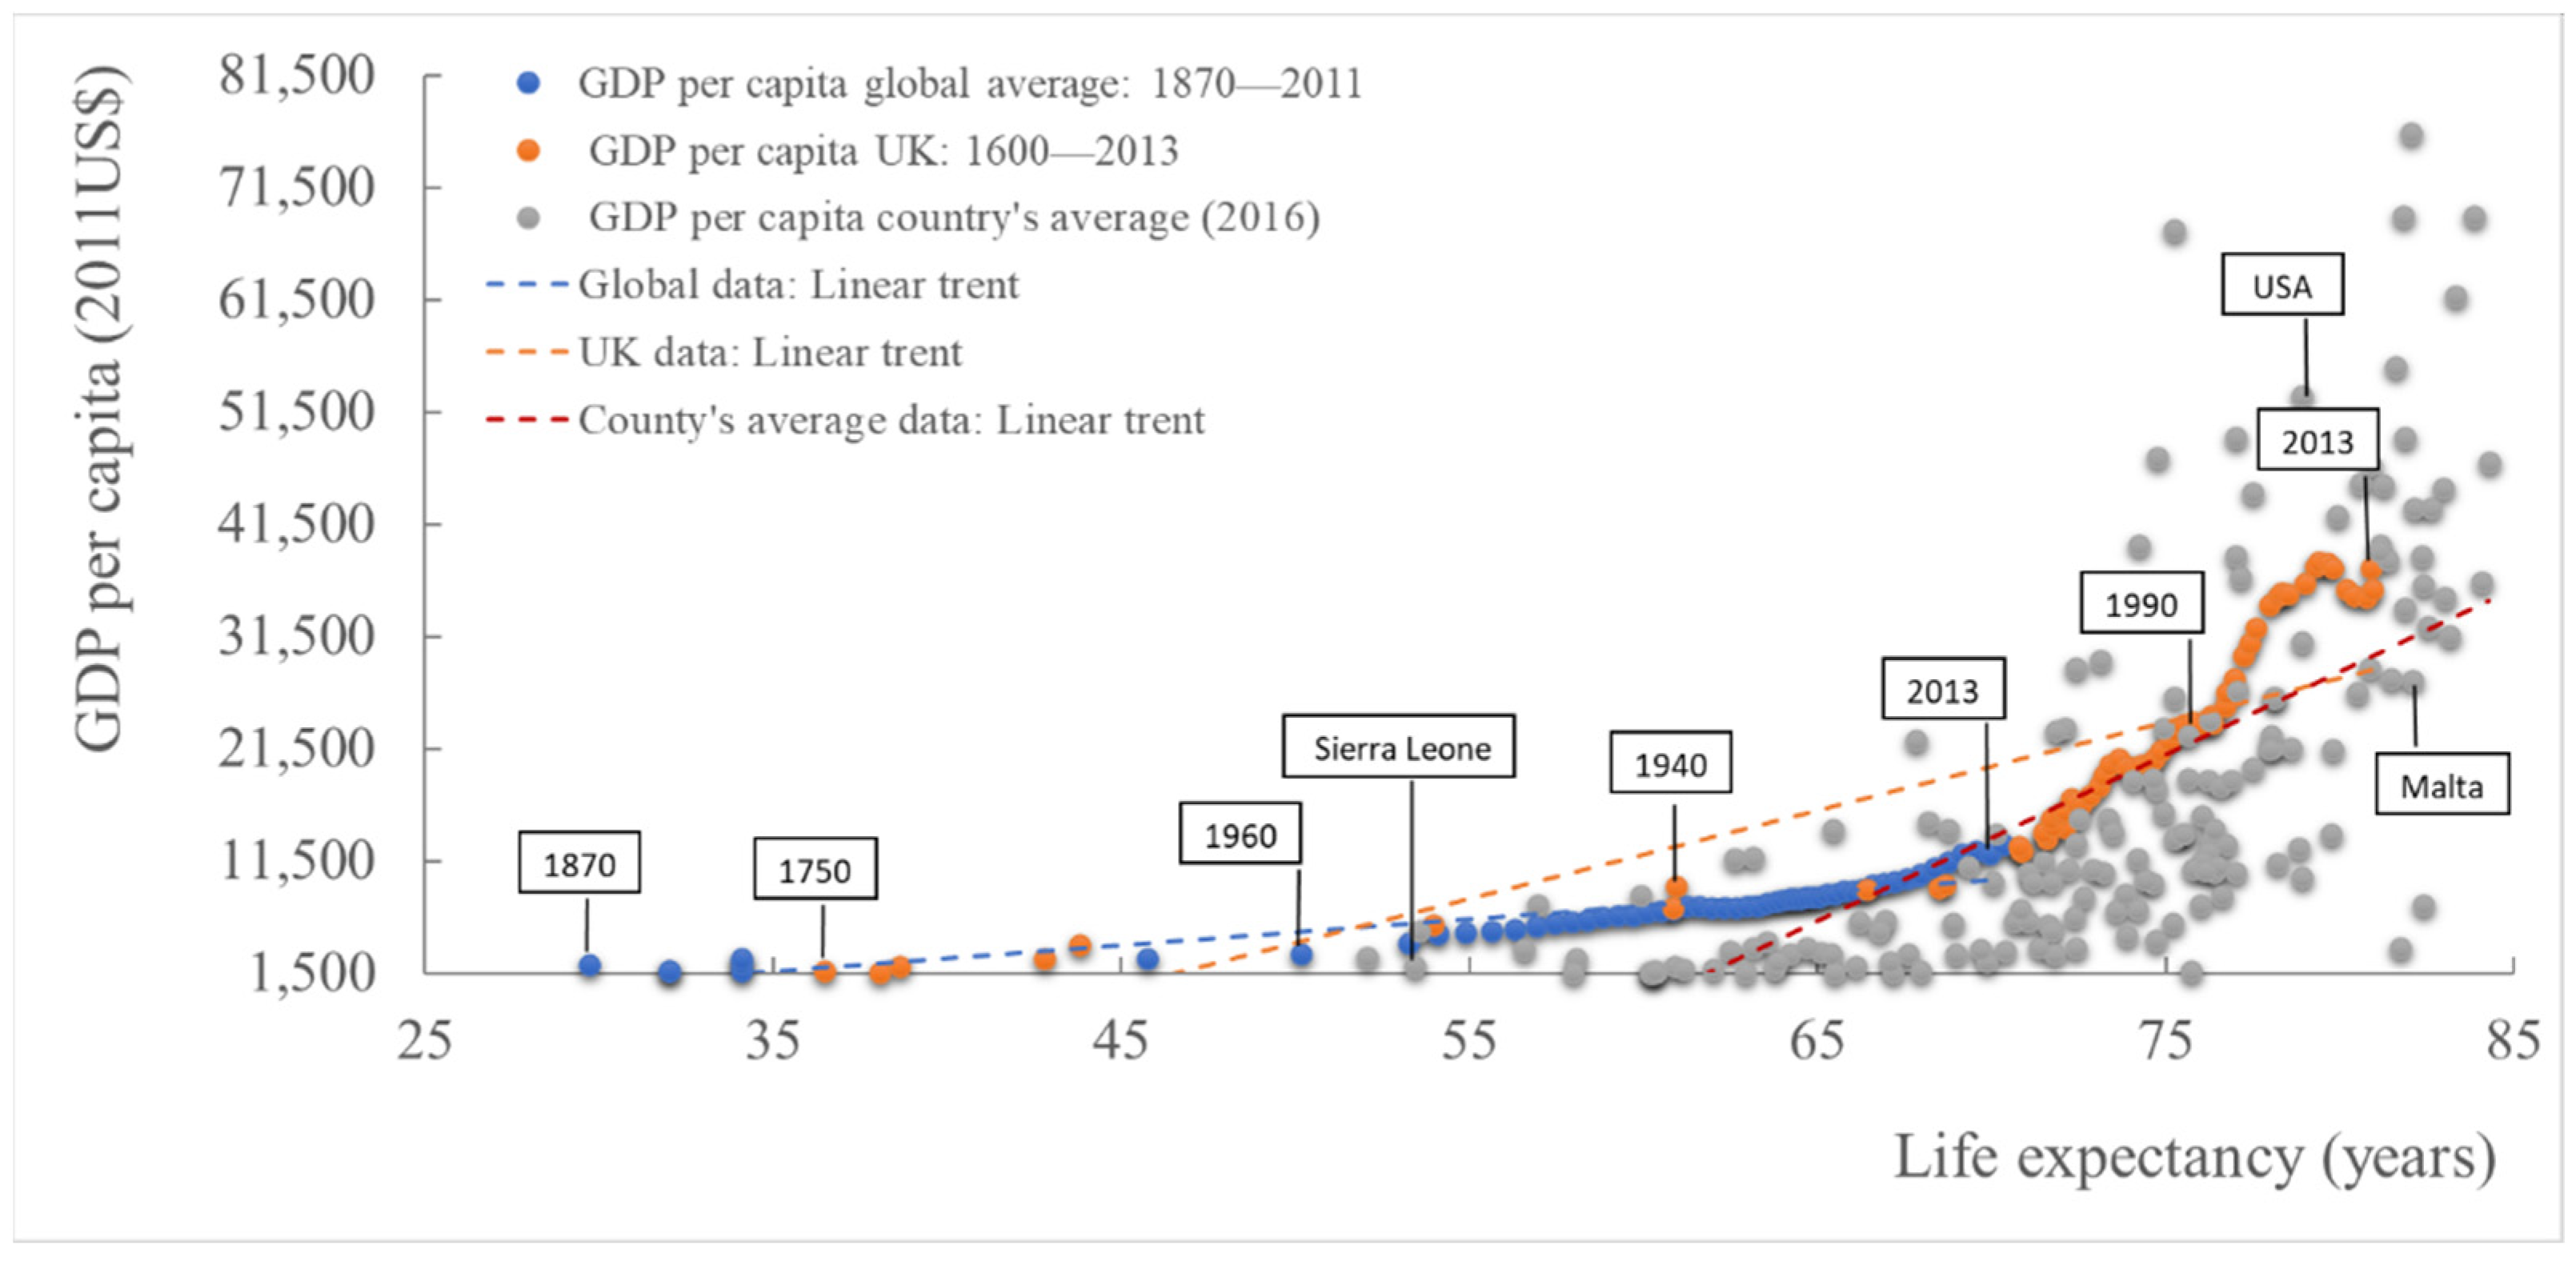
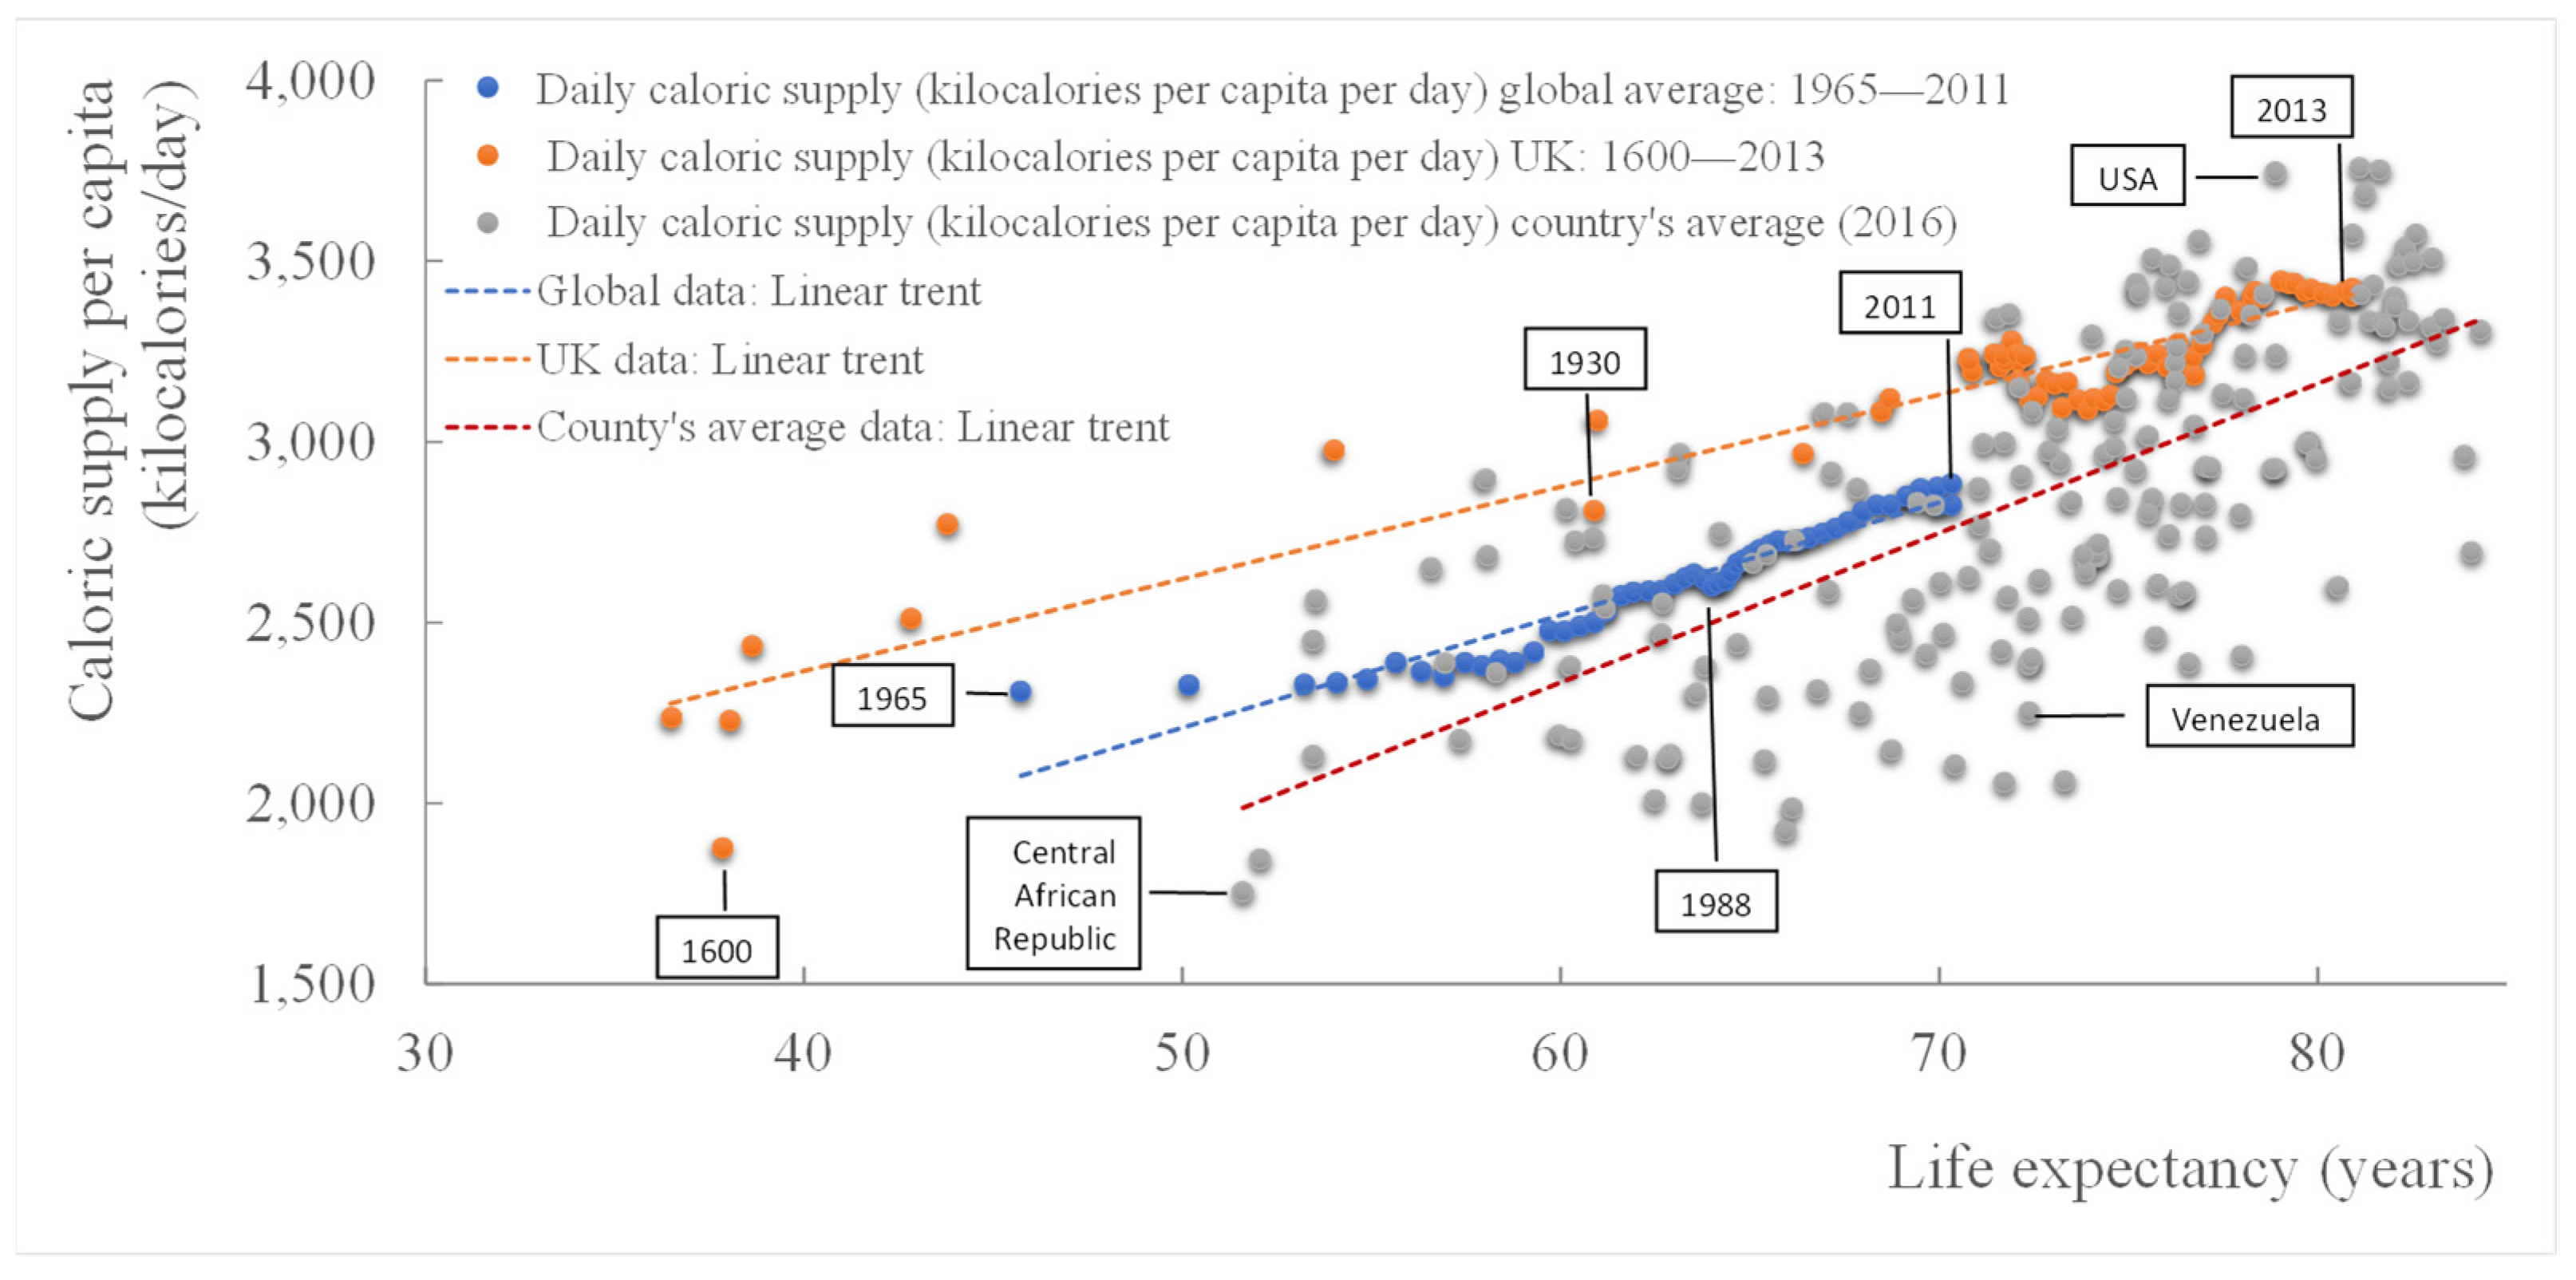
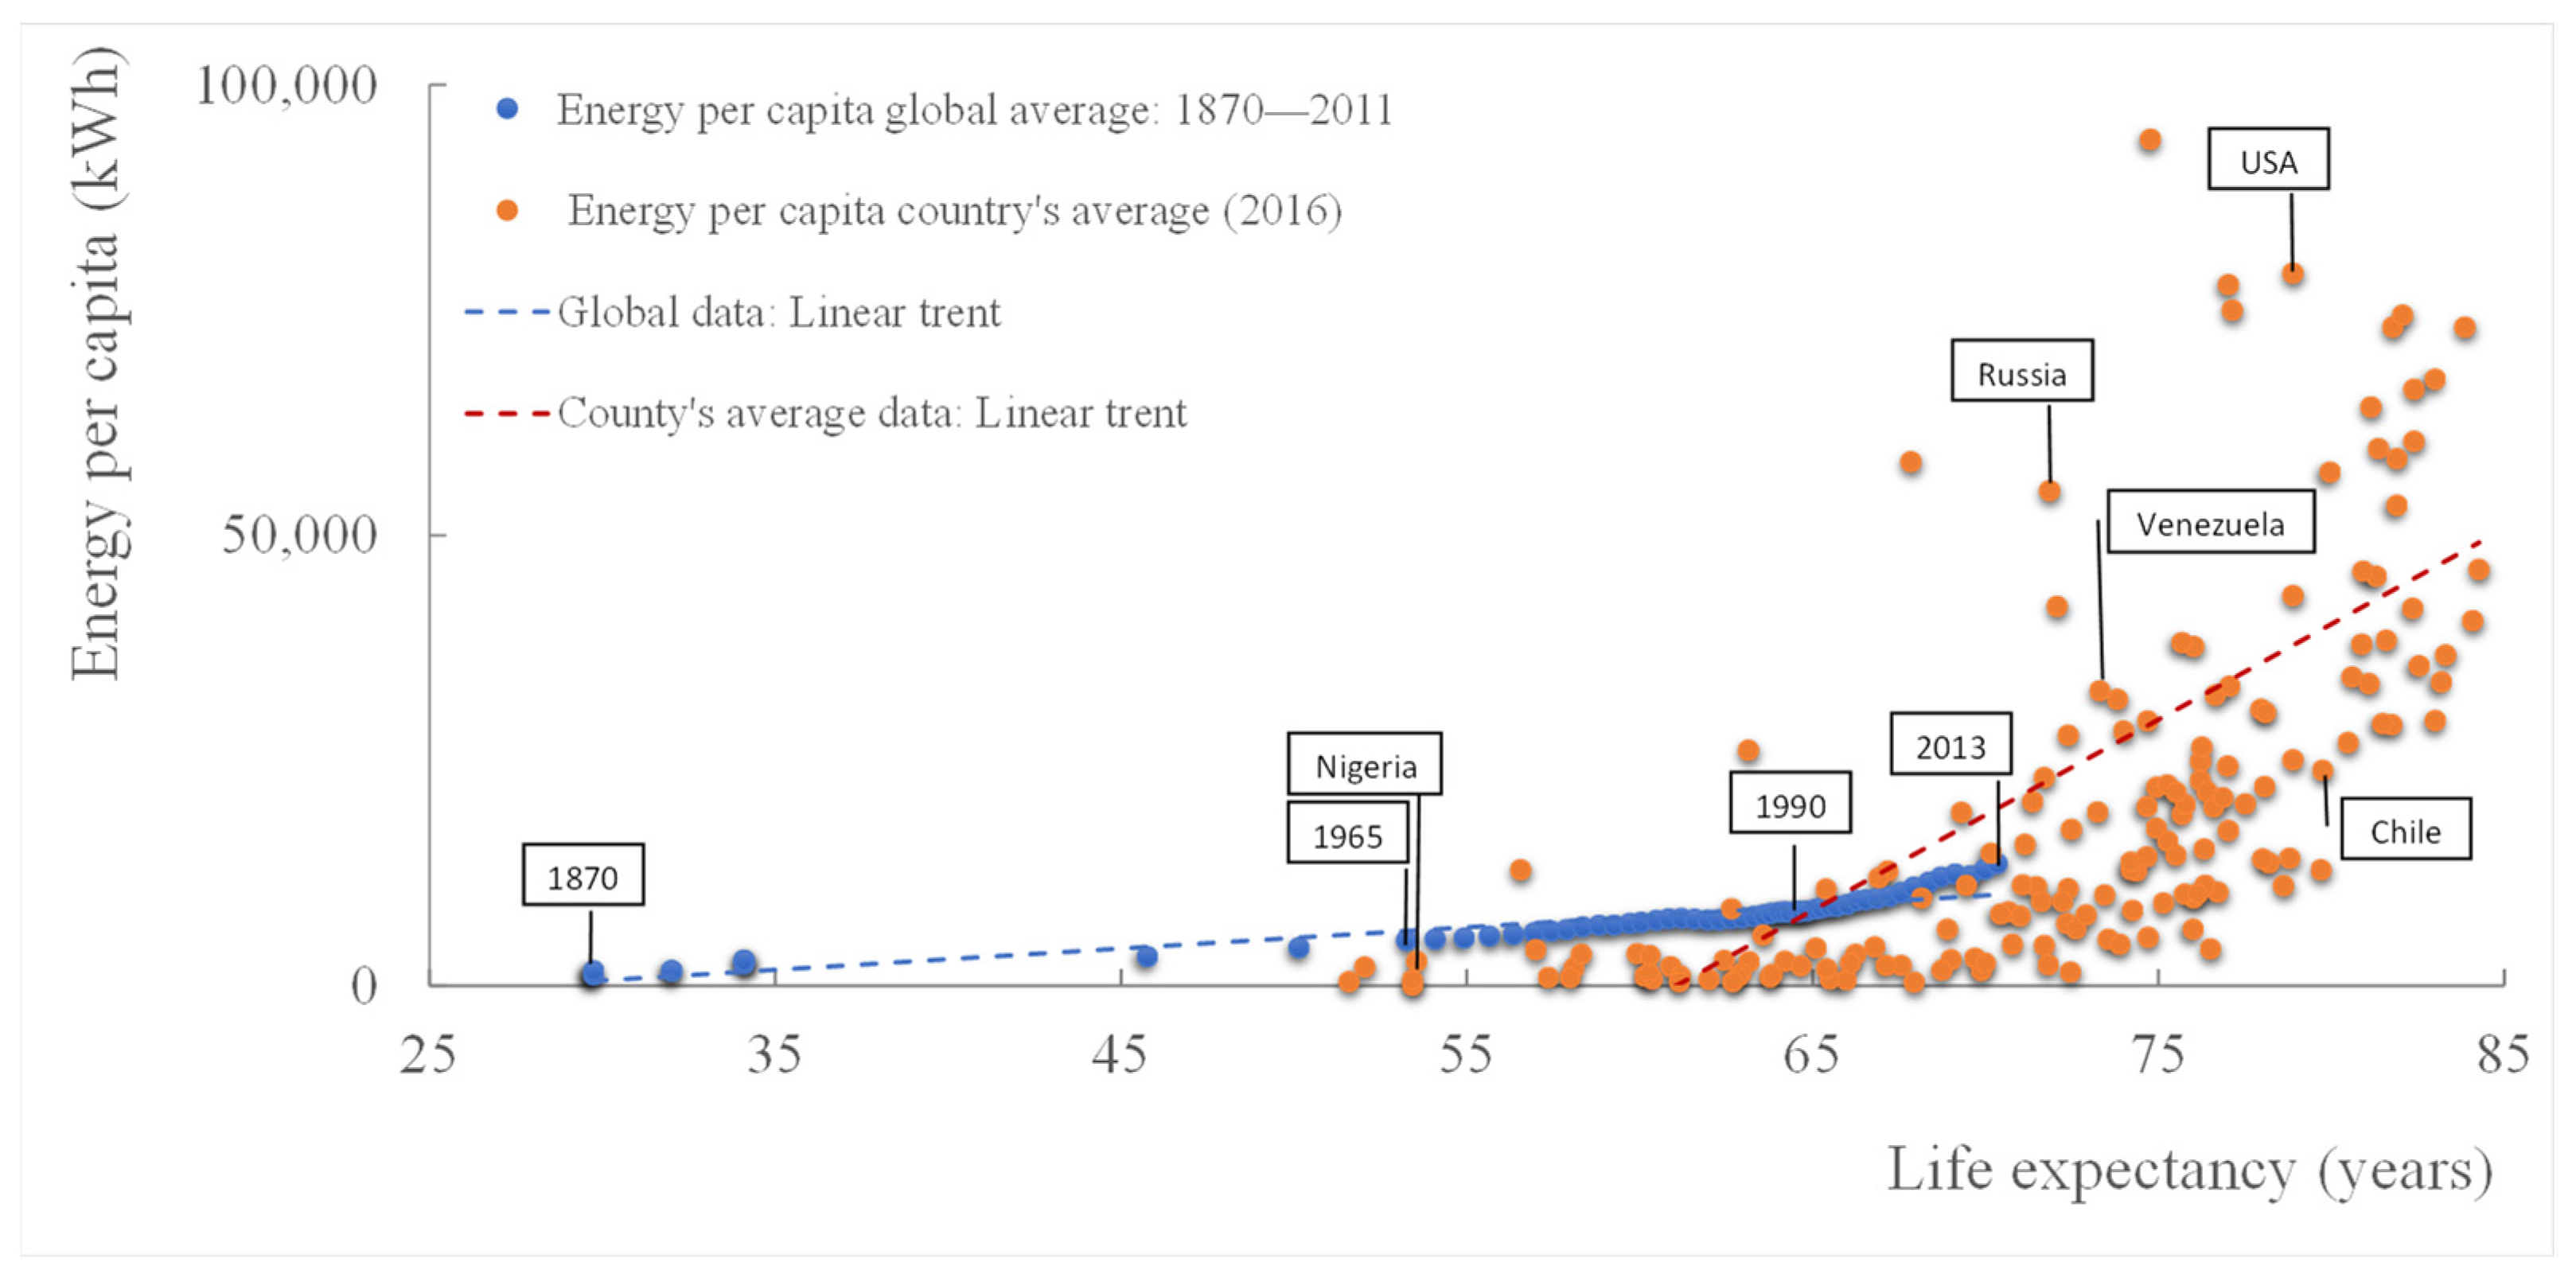
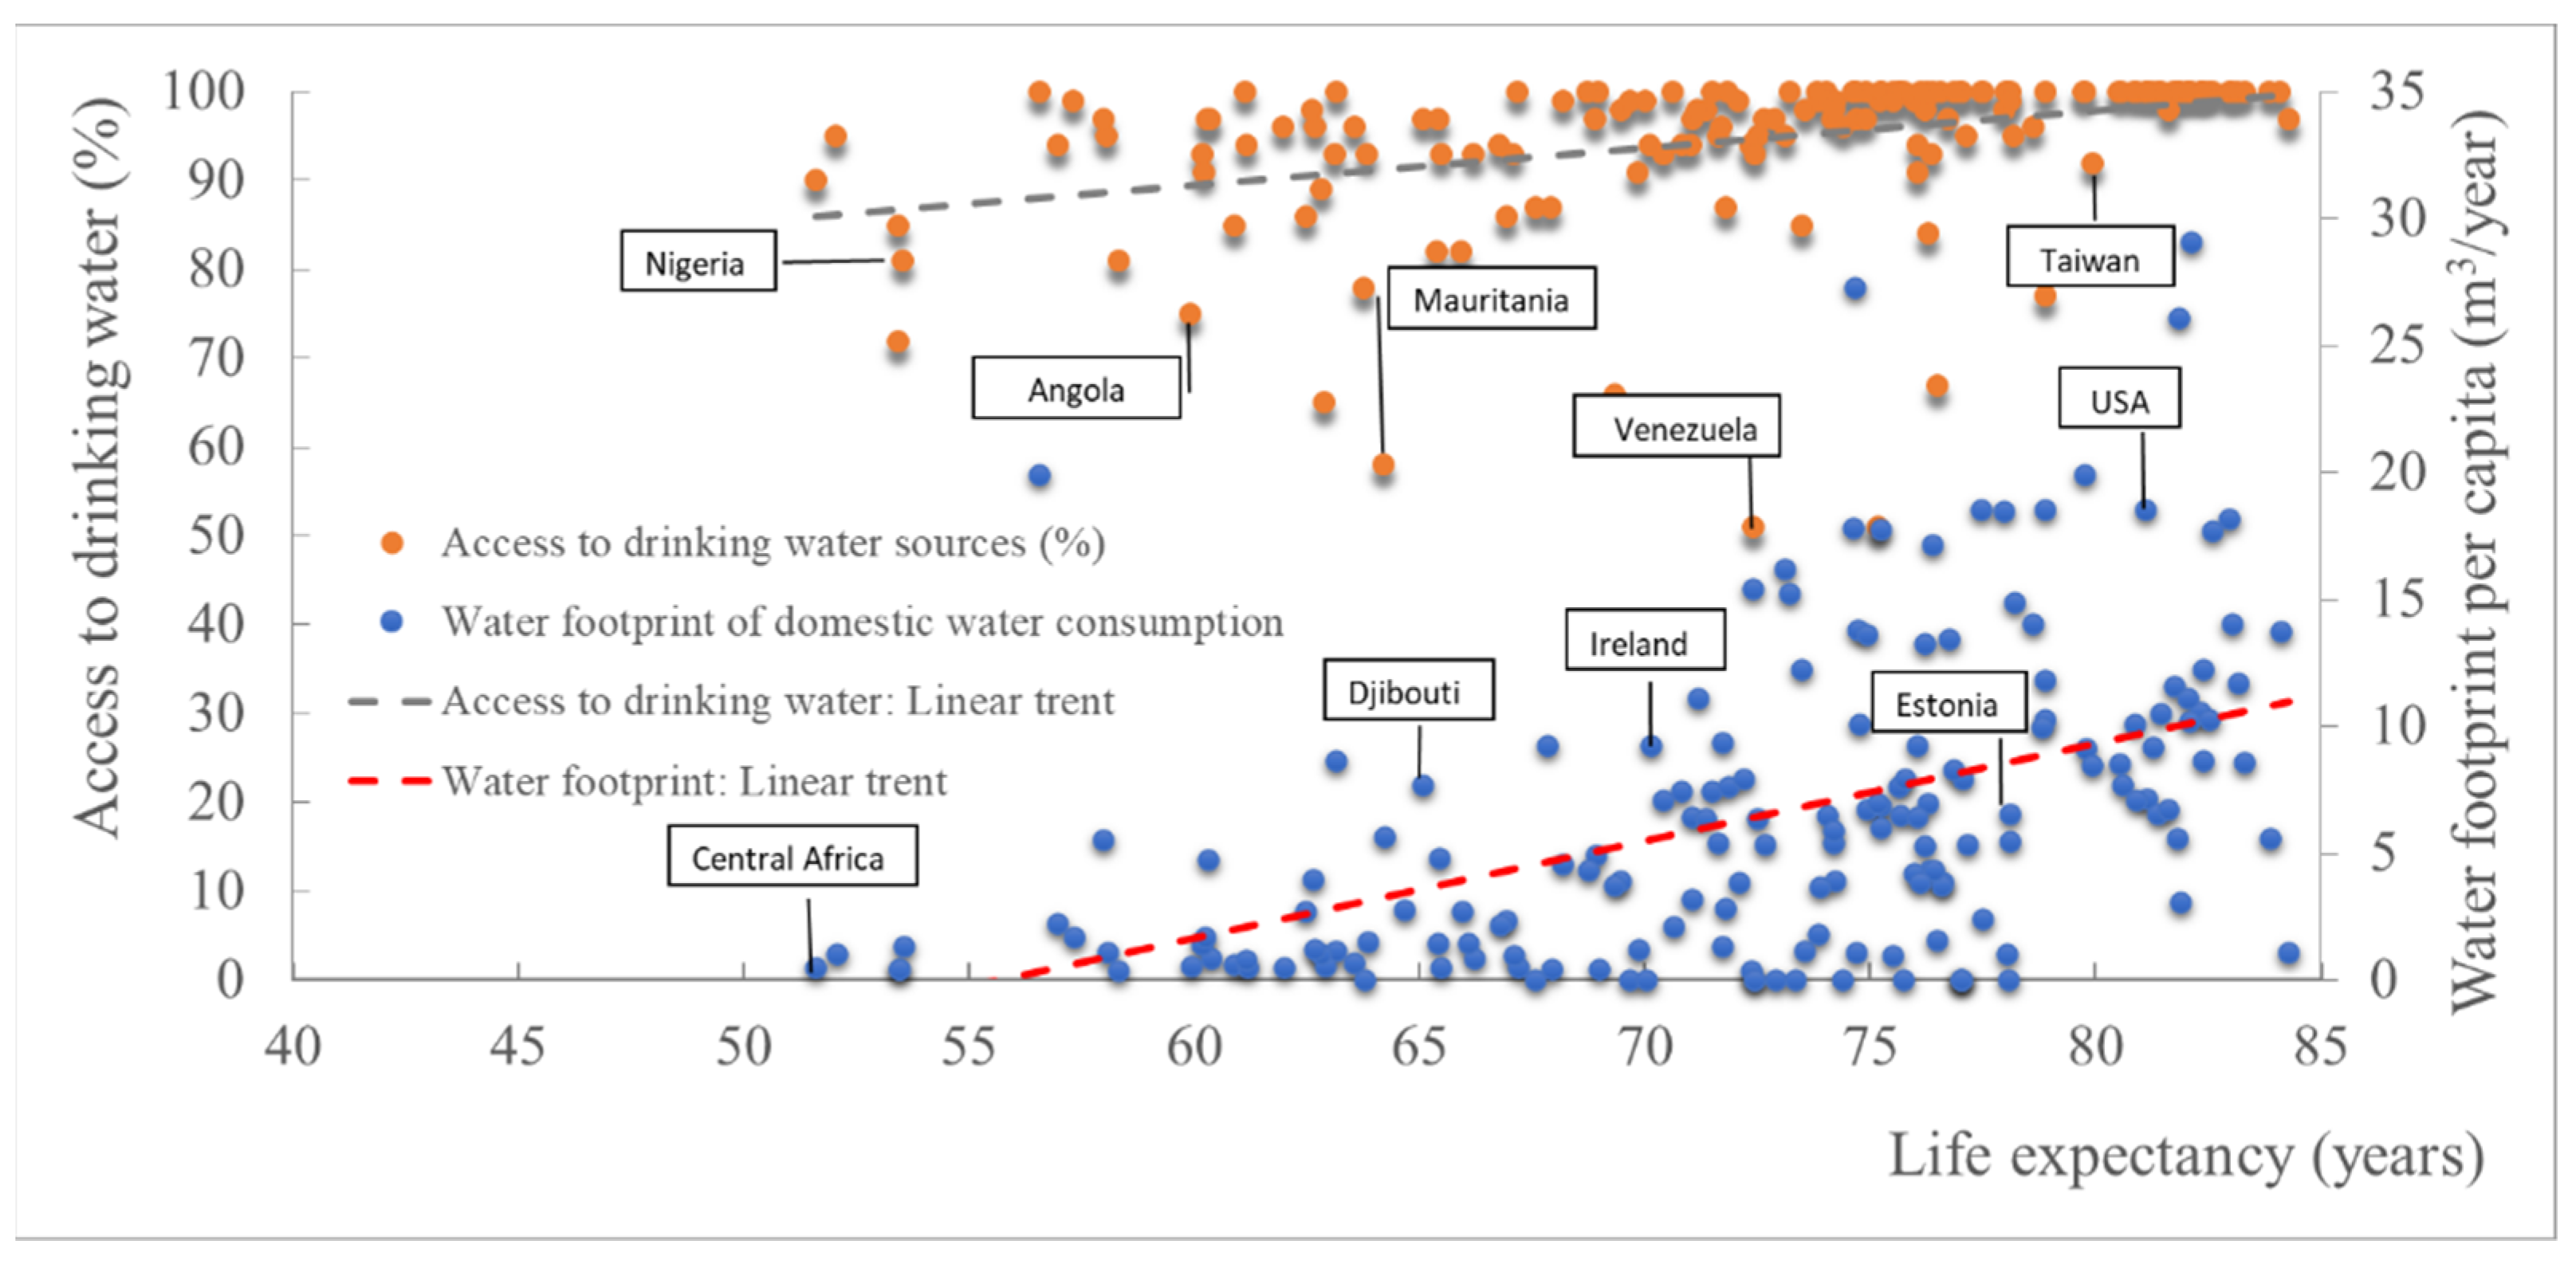
2. True Wealth. Life Expectancy Related to the Water–Energy–Food Nexus

There is a general criticism about the human pursuit of wealth, which is attributed to their greediness. However, if we look at analytical data, we see that economic status is the quantified prosperity that increases the life expectancy of people, e.g., as seen for the Gross Domestic Product (GDP) of 172 countries (Figure 1), UK data (1600–2011) and the global average between 1870 and 2011, which is probably connected with the access to medical care. In this regard, Confucius famously said that “the first wealth is health” [4,5].
However, life expectancy is correlated to the availability of the Water–Energy–Food nexus, which is necessary for survival (Figure 2, Figure 3 and Figure 4) [9].
The optimum caloric supply for humans is between 2000 and 2500 calories [10]. Data from 172 countries, UK (1600–2013) and global average show that even more consumption of the caloric supply is corelated to life expectancy and is an indicator of prosperity (Figure 2).
Since Homeric times, the size of ox or cattle herds signified the wealth of a person. The symbol of wealth measurement in the Roman Empire was the head of an animal (Latin: capis), which bequeathed to us the term capital. In 1909, Wilhelm Ostwald first noted that energy consumption is correlated with life expectancy [12]. The data in Figure 3 show 172 countries’ average and global average (1870–2011), which confirm his hypothesis.
Nevertheless, energy sources (e.g., animals) could not be easily validated, as they are mostly used multiplying wealth (e.g., agriculture), formulating the stratification of society. A related paper by Kohler et al. showed that the increasing of technology and available energy (use of animals) in ancient times was related to the stratification of society [13]. Recent studies [14,15] delivered also the same conclusions, presenting the dynamics of stratification in society with an entropic approach [16]. The same conclusions were delivered by Atkinson for modern economies [17].
The access to clean water is also an indicator of society’s prosperity and humans’ life expectancy [19]. The data in Figure 4 show 172 countries’ averages (2015) in access of drinking water and the countries’ average footprint for domestic water, which corresponds to the hygienic standards of society [20].

3. Can We Standardize the Values of Wealth?

Since prehistory, humans have devoted much of their energy to making works of art, jewelry and other inoperable objects, which eventually became the testimony of civilization. Redundant activities that do not aim to meet survival needs are aimed at two very volatile values: beauty, which mutates in every cultural phase, and rarity.
In order to find a stable measure to exchange values, humans needed something precious and rare enough. Professor Andrea Sella, in a very interesting article for BBC [24], explained why mankind considers gold and silver precious. Especially for gold, he noted that, as other metals are white or red (coper) and most of them can be oxidated, the secret to gold’s success as a currency is that, with its unique yellow color, it is unbelievably beautiful. However, as the demand for gold and silver can vary wildly with a fixed supply, that can lead to equally wild swings in its price. Therefore, he concluded that “gold [and silver] makes the worst possible currency”.
Koutsoyiannis and Mamassis [25] noted that mythology has been very influential in triggering social behaviors. Ancient Greek mythology described the subjectivity of gold and how Midas was trapped and starved by his divine charisma transforming everything to gold, which is not eatable [26]. Nevertheless, this myth seems to be a footnote in social perceptions, as gold and silver have a timeless value.
Since the beginning of money’s history, precious metals were used as symbols of exchange value, because unlike energy, they have a material substance. In the Roman Empire the ratio gold to silver was about 11–12:1 [27]. In modern times, the U.S. government fixed the ratio at 15:1 with the Mint Act of 1792 [28]. Since the late 19th century, historical data (orange line in Figure 5a,b) showed that the values had a small variance, and the ratio (Figure 5c) could be considered as consistent to the Mint Act. However, the ratio started to fluctuate in a wide range at the end of 19th century.
The last attempt to consolidate the relation of money to precious metals was made in July 1944 at the Mount Washington Hotel near Bretton Woods, which gave rise to what is widely known as the Bretton Woods Agreement [31].
There, the absolute dominance of the dollar in the markets and strict adherence to trade agreements even between struggling and powerful economies and the linking of the dollar to gold at USD 35 per ounce were established. However, as the US had devalued dollars currency, with a unilateral proclamation on an August Sunday in 1970, Richard Nixon suspended the convertibility of the dollar into gold [32,33].
Although many analysts at the time predicted the end of the dollar, in an ingenious move that can be said was looking back to the archetypal association of capital with energy, two years later, the Americans, through the mediation of Henry Kissinger, came to an agreement with the Saudis, and in exchange for guarantees of their security, persuaded them to make all oil transactions in dollars [34], releasing the values of gold, silver and oil in a wide range of fluctuations (Figure 6a). However, we have to note that, even before the petrodollars, their ratio was fluctuated (Figure 6b).

4. Correlations between Wealth in Antiquity and Now

It is almost impossible to estimate the value of wealth based on the exchange rate of the currencies or the value of precious metals in historical eras. However, as wheat is the base element of the digestive menu of humans, and we have historical information of its cost and wages, we estimated the wheat wages (i.e., the liters of wheat that can be bought by a daily wage). Wheat wages is a proper measure, adapted already in antiquity by Solon for the differentiation of social classes of Athenians on the basis of the medimnoi (bushels) of grain produced [36]. This allows us to create an important cross-cultural comparison of economic wellbeing [37,38,39].
In antiquity, the average daily wage level was about 7.9 L/day. Classical Athens had the highest average daily wage. Loomis noted:
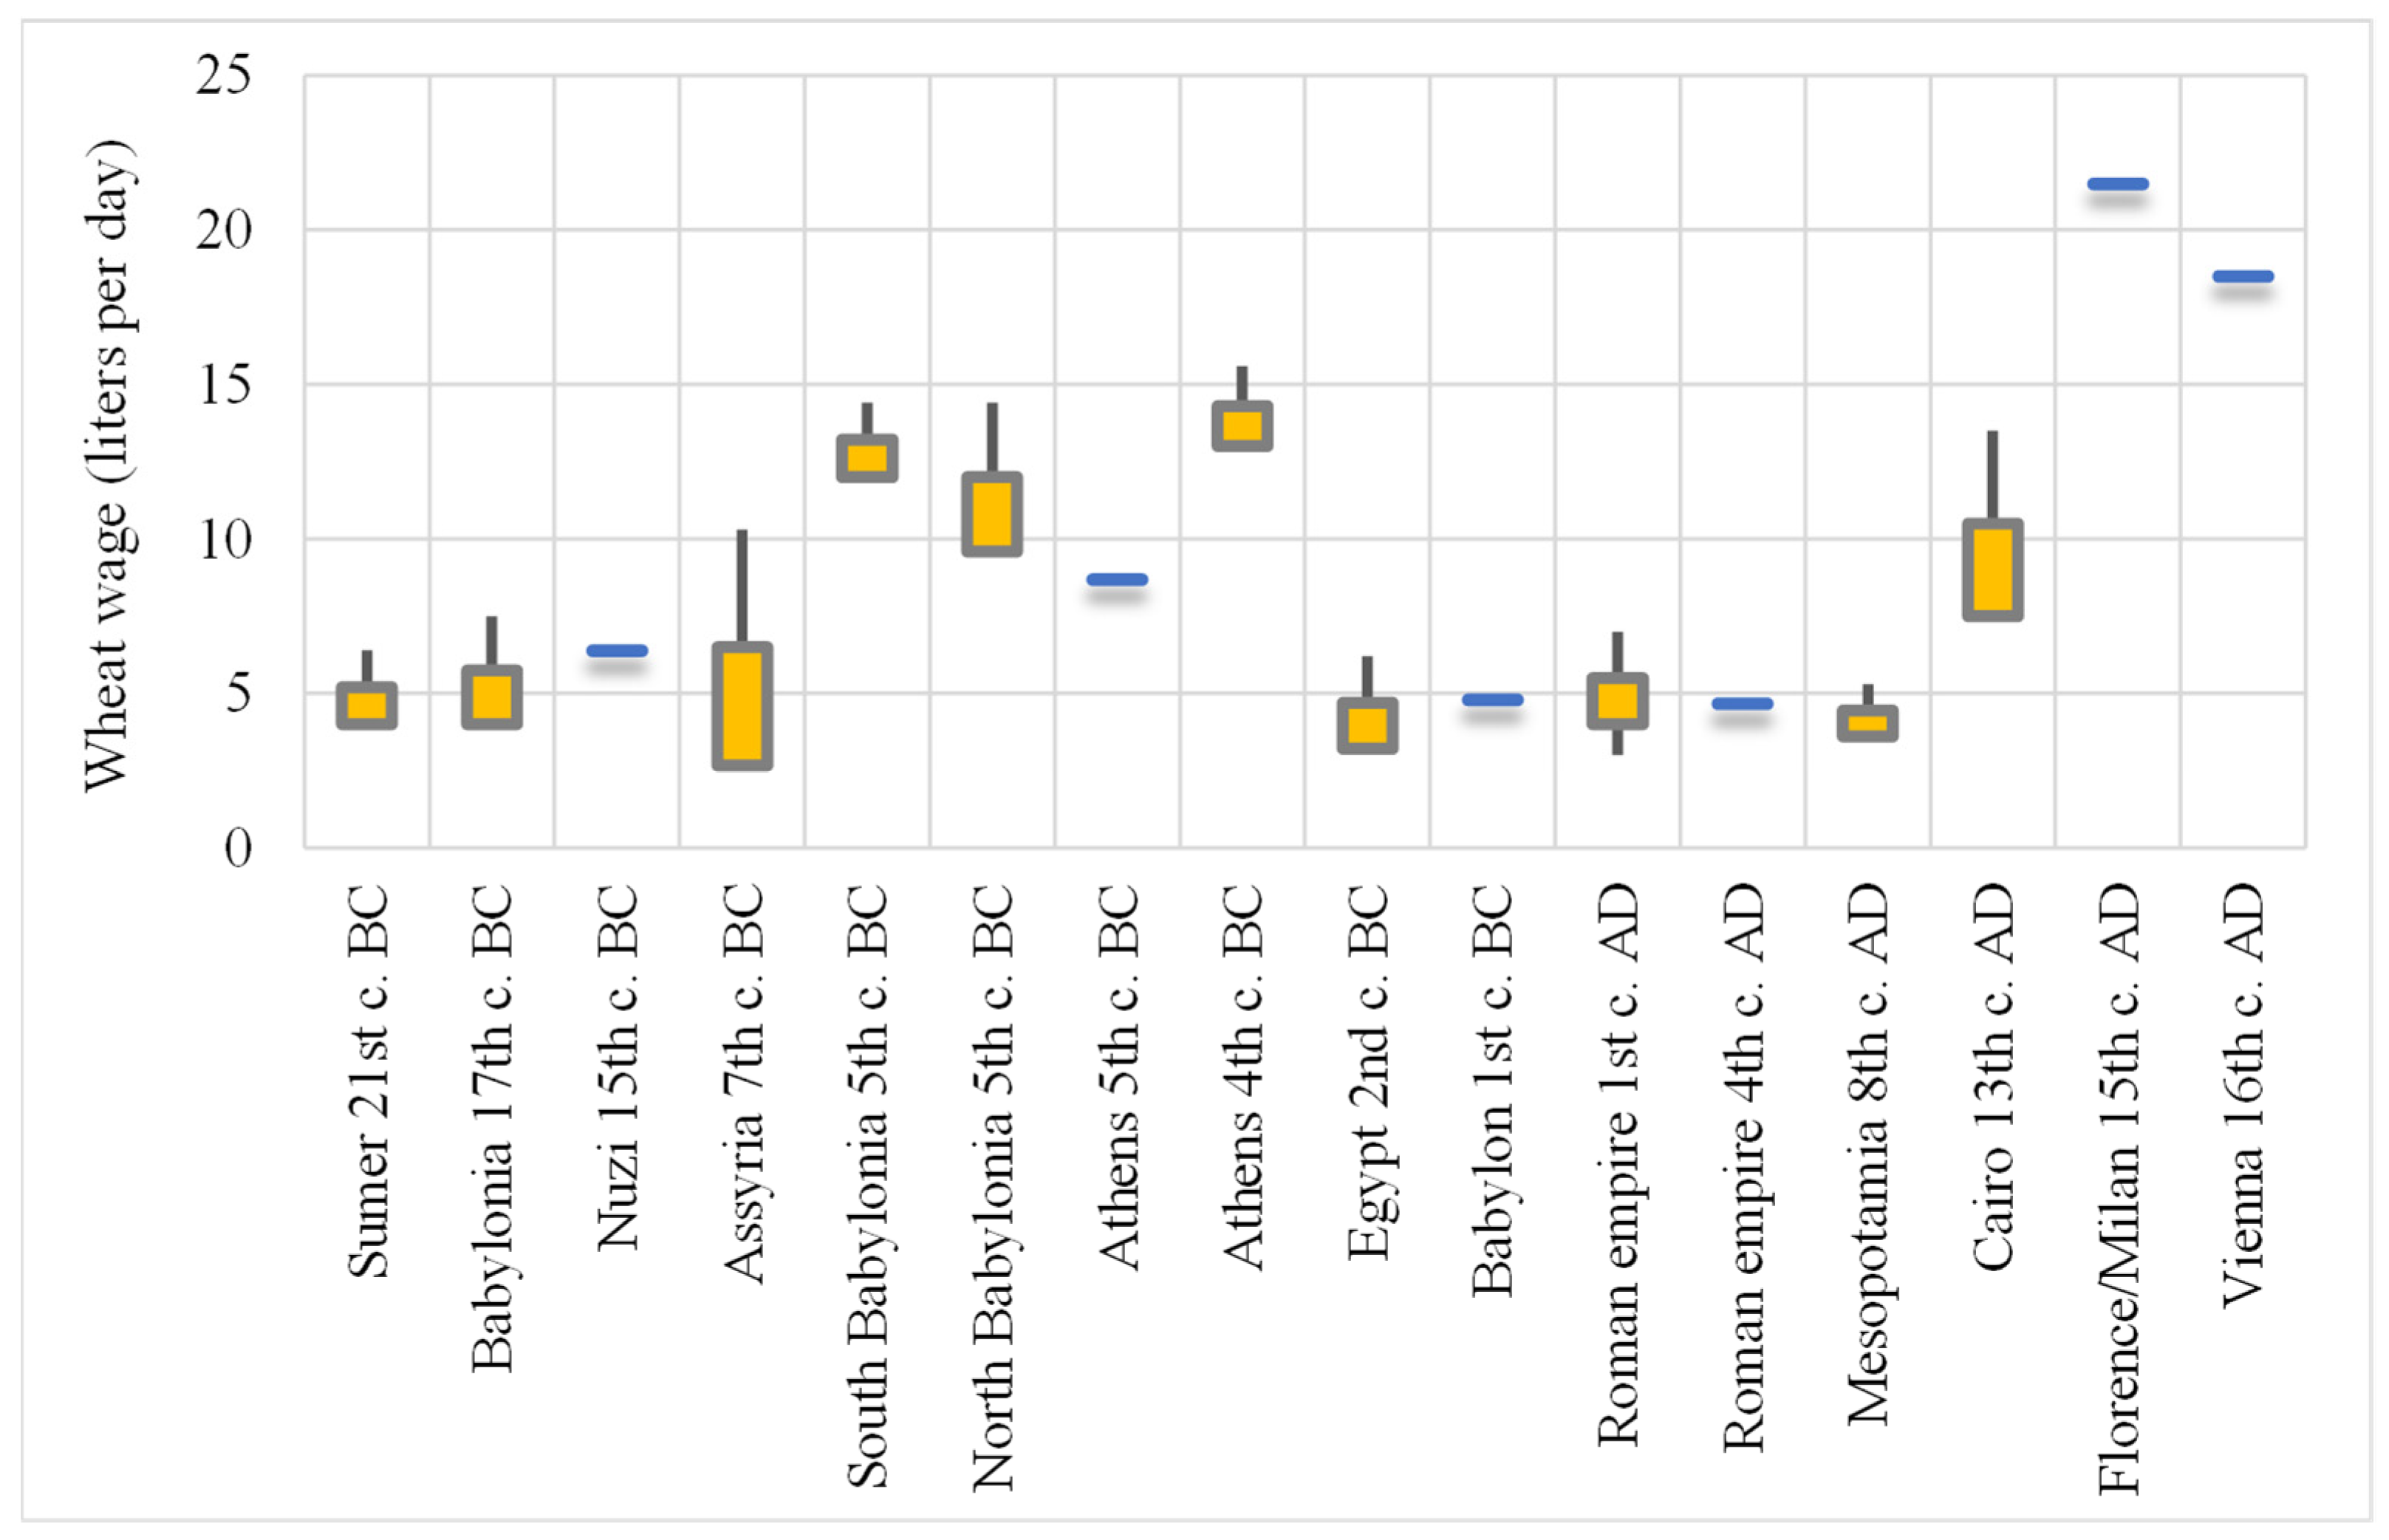
In Eleusis near Athens in the 320s BCE, epigraphic records report that unskilled construction workers received 1.5 drachms per day, compared to 1.25–2.5 drachms for skilled workers. At that time, wheat sold for 5 to 6 drachms per medimnos (c. 52 L). This translates into a daily wheat wage of 13–15.6 L.
[40]
Figure 7 visualizes the average daily wheat wages of unskilled laborers from 21st c. BC until the Renaissance [41,42,43,44,45].
As we wanted to correlate wealth with wheat wages, we studied the values of gold, silver and oil related to wheat in today’s values (1990–2019).
In this analysis, we noted the following range of fluctuations, e.g., coefficient of variation of: Gold-to-Silver Ratio = 2.57, Gold-to-Wheat Ratio = 0.95, Oil-to-Wheat Ratio = 0.04 and Silver-to-Wheat Ratio = 0.01. Interesting to note is that the minimum fluctuation corresponds to the Silver-to-Wheat Ratio (Figure 8).
The prices of wheat in countries’ markets are different than the prices of global markets; however, considering local prices double more than global markets (e.g., 0.3 USD/L), we visualized an indicative relation of wheat wages based on the average GDP per capita [7] of 95 different countries in 2016 (Figure 9).
Figure 9 is encouraging and shows the progress we have made from antiquity. Nevertheless, it shows the average values of daily wheat wages and not the wages of unskilled laborers. With reverse calculations, we found that the average daily wheat wage of an unskilled laborer in antiquity (7.9 L/day) corresponded to about 2.37 USD/day, slightly higher than the value of 1.9 USD, which is considered as the limit of extreme poverty [47]. Studding the income mountains in Gapminder (year 2016) [48], we found that about 1.4 billion people (17.5% of the population) live today under the average daily wage in antiquity.

5. Case Study: The Cost of Athens’ Hadrianic Aqueduct

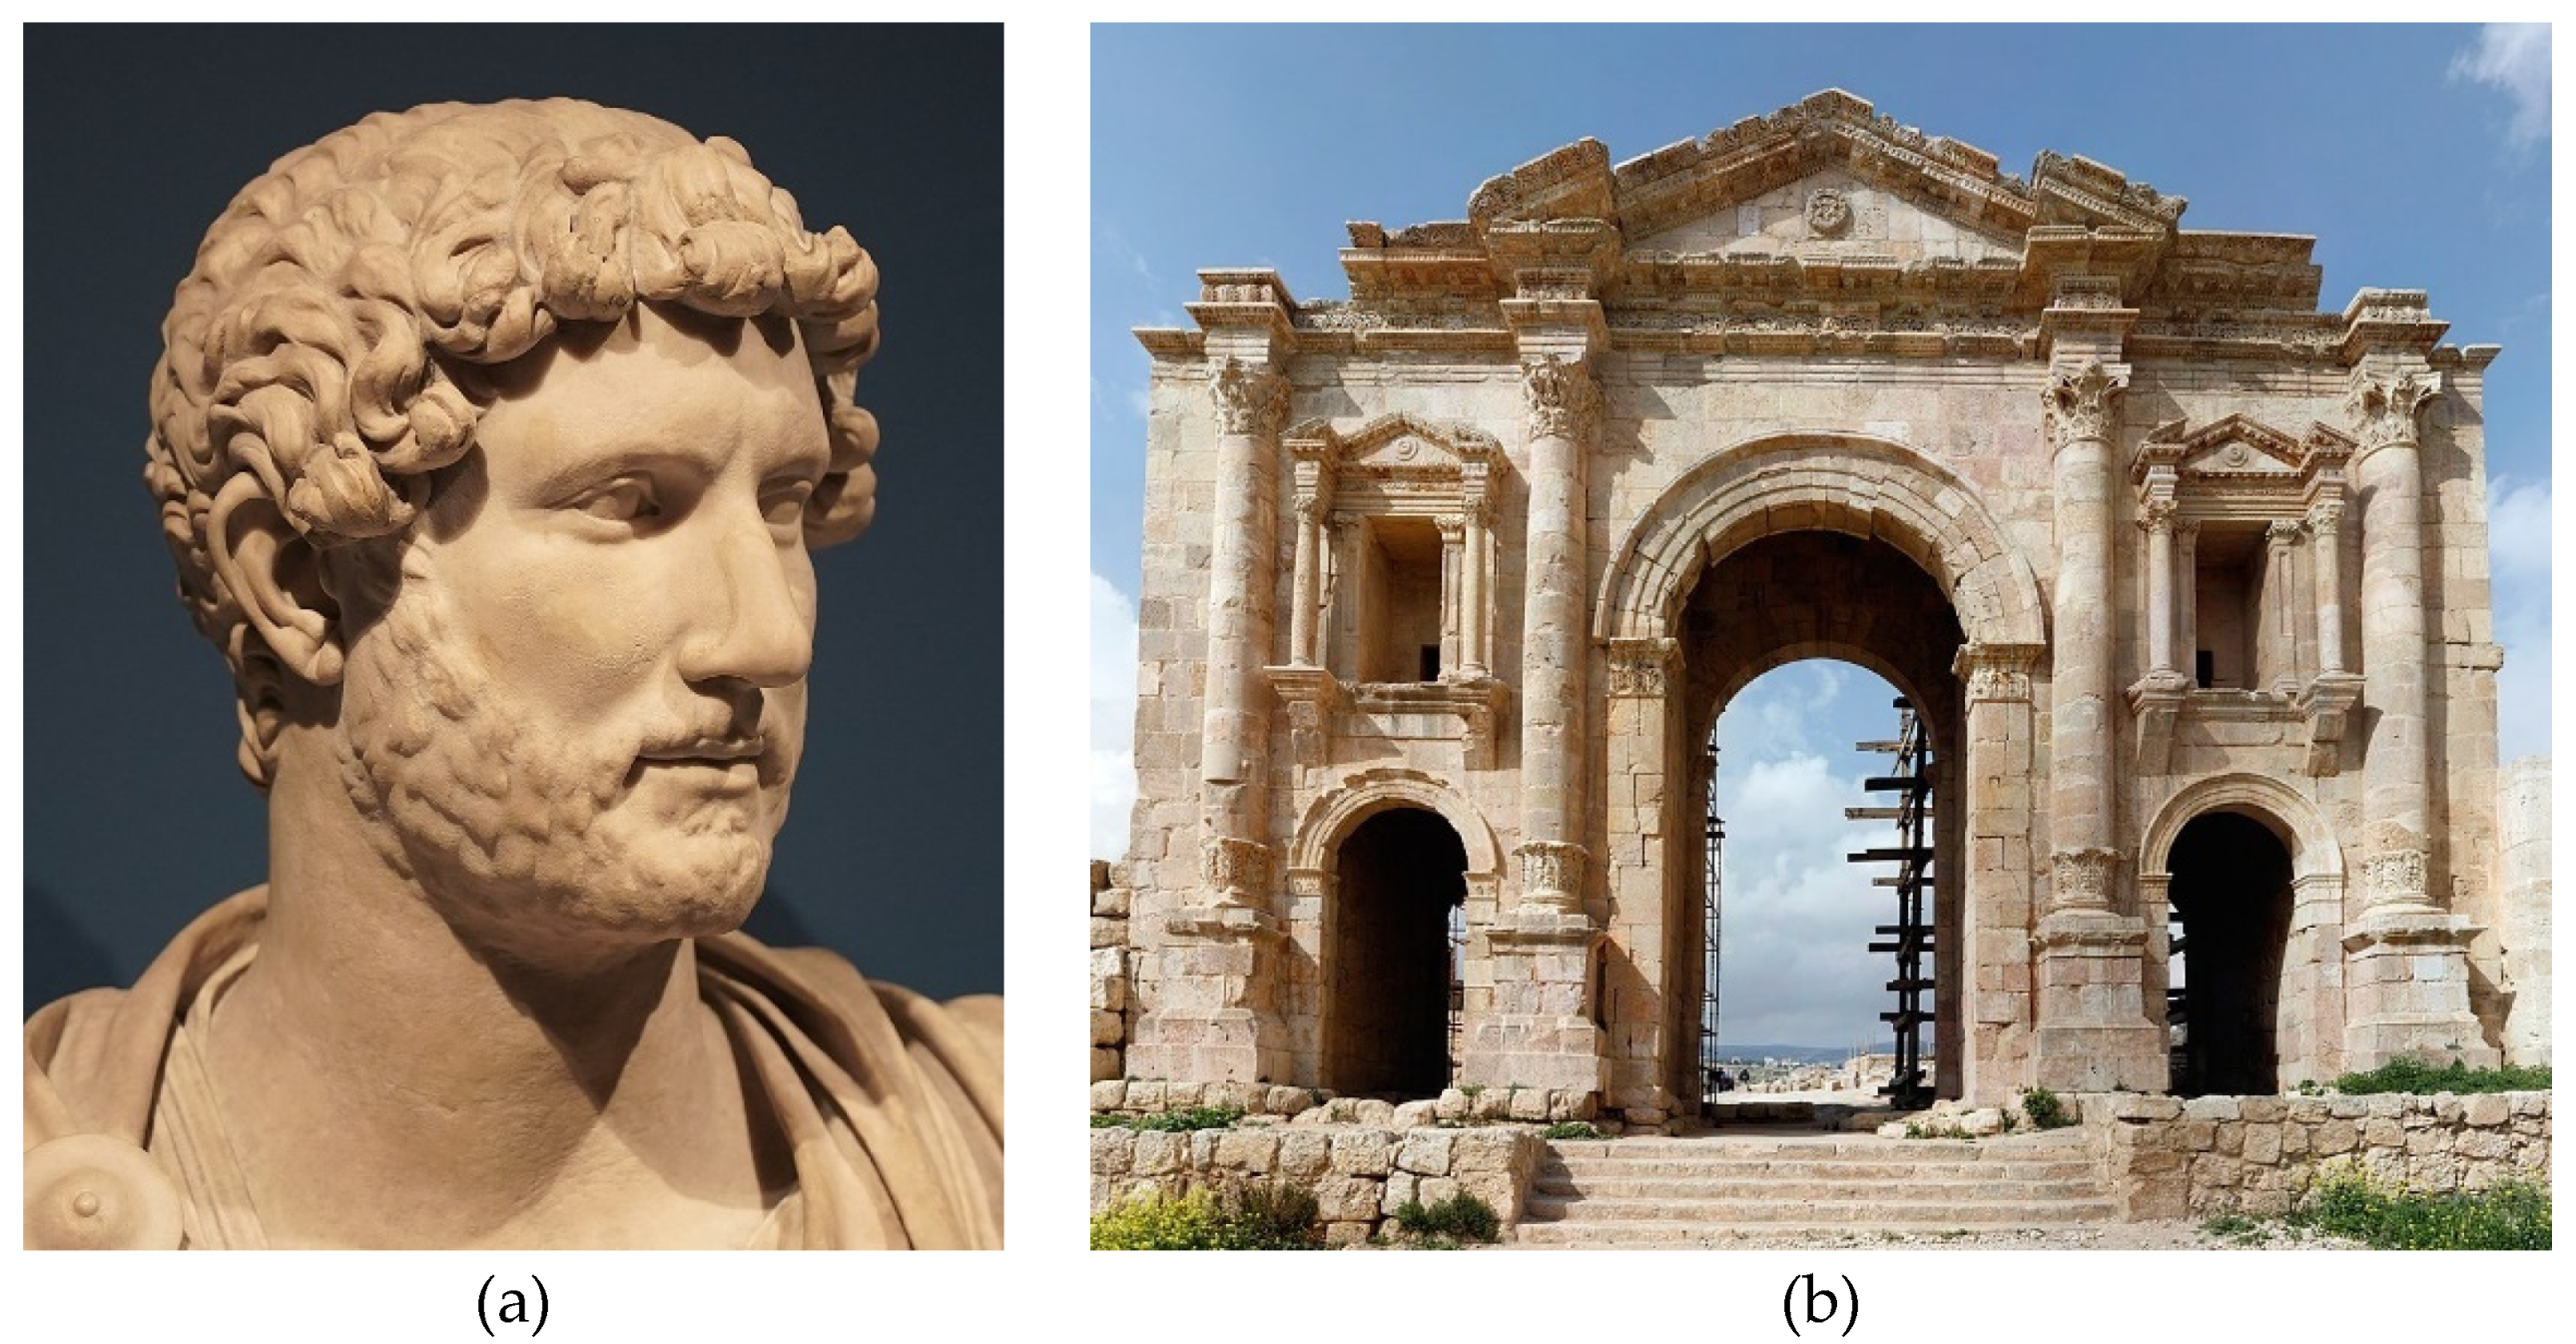
5.1. The Era of Emperor Hadrian 76–138 AD

Since antiquity, the technology of the civil infrastructure was a key element in the prosperity of a civilization. Tassios noted [49]:
The oldest and most useful set of knowledge was about Technology: whenever a human Need cannot be satisfied by available natural means, artificial means are invented to this end.
Public infrastructures were the key point in this aspect [50,51,52].
Romans made high technological steps with large-scale infrastructure progress [53]. Estimations for the cost of the Roman infrastructures were done mostly by inscriptions that are referred to in the literature [54,55,56].
Hadrian was a Roman Emperor who was focused on large-scale projects [57], traveling constantly throughout the territory of the empire [58] (Figure 10). Hadrian built in Athens (Figure 11) a series of impressive constructions that embellished the city: a library, temple, theater and aqueduct [59,60]. Under Hadrian, the Athenians saw their former glorious city be transformed into a cultural capital of the Roman East. Until the 1930s, the main water supply system of Athens was the Hadrianic aqueduct [61].
We have to note that these infrastructures were not made by slaves but by free citizens. Slaves were very expensive in ancient Rome (a man-slave costed about 600 drachmas [63], and slave owning was not an efficient investment. West referred that, in Egypt, all the slaves mentioned in the papyri (almost without exception) were women kept as concubines or persons kept as domestic servants.
The income of the Roman state was taxation; therefore, it seems that taxes were the financial resources of the construction of large-scale infrastructure projects [64]. Possibly, Roman Emperors were thinking according to the theory of Karl August Wittfogel [65], which assumed that hydraulic works are the basis for human society. Hydraulic works need special knowledge for their construction and bureaucratic management. This justifies social stratification, despotism and the existence of an elite.

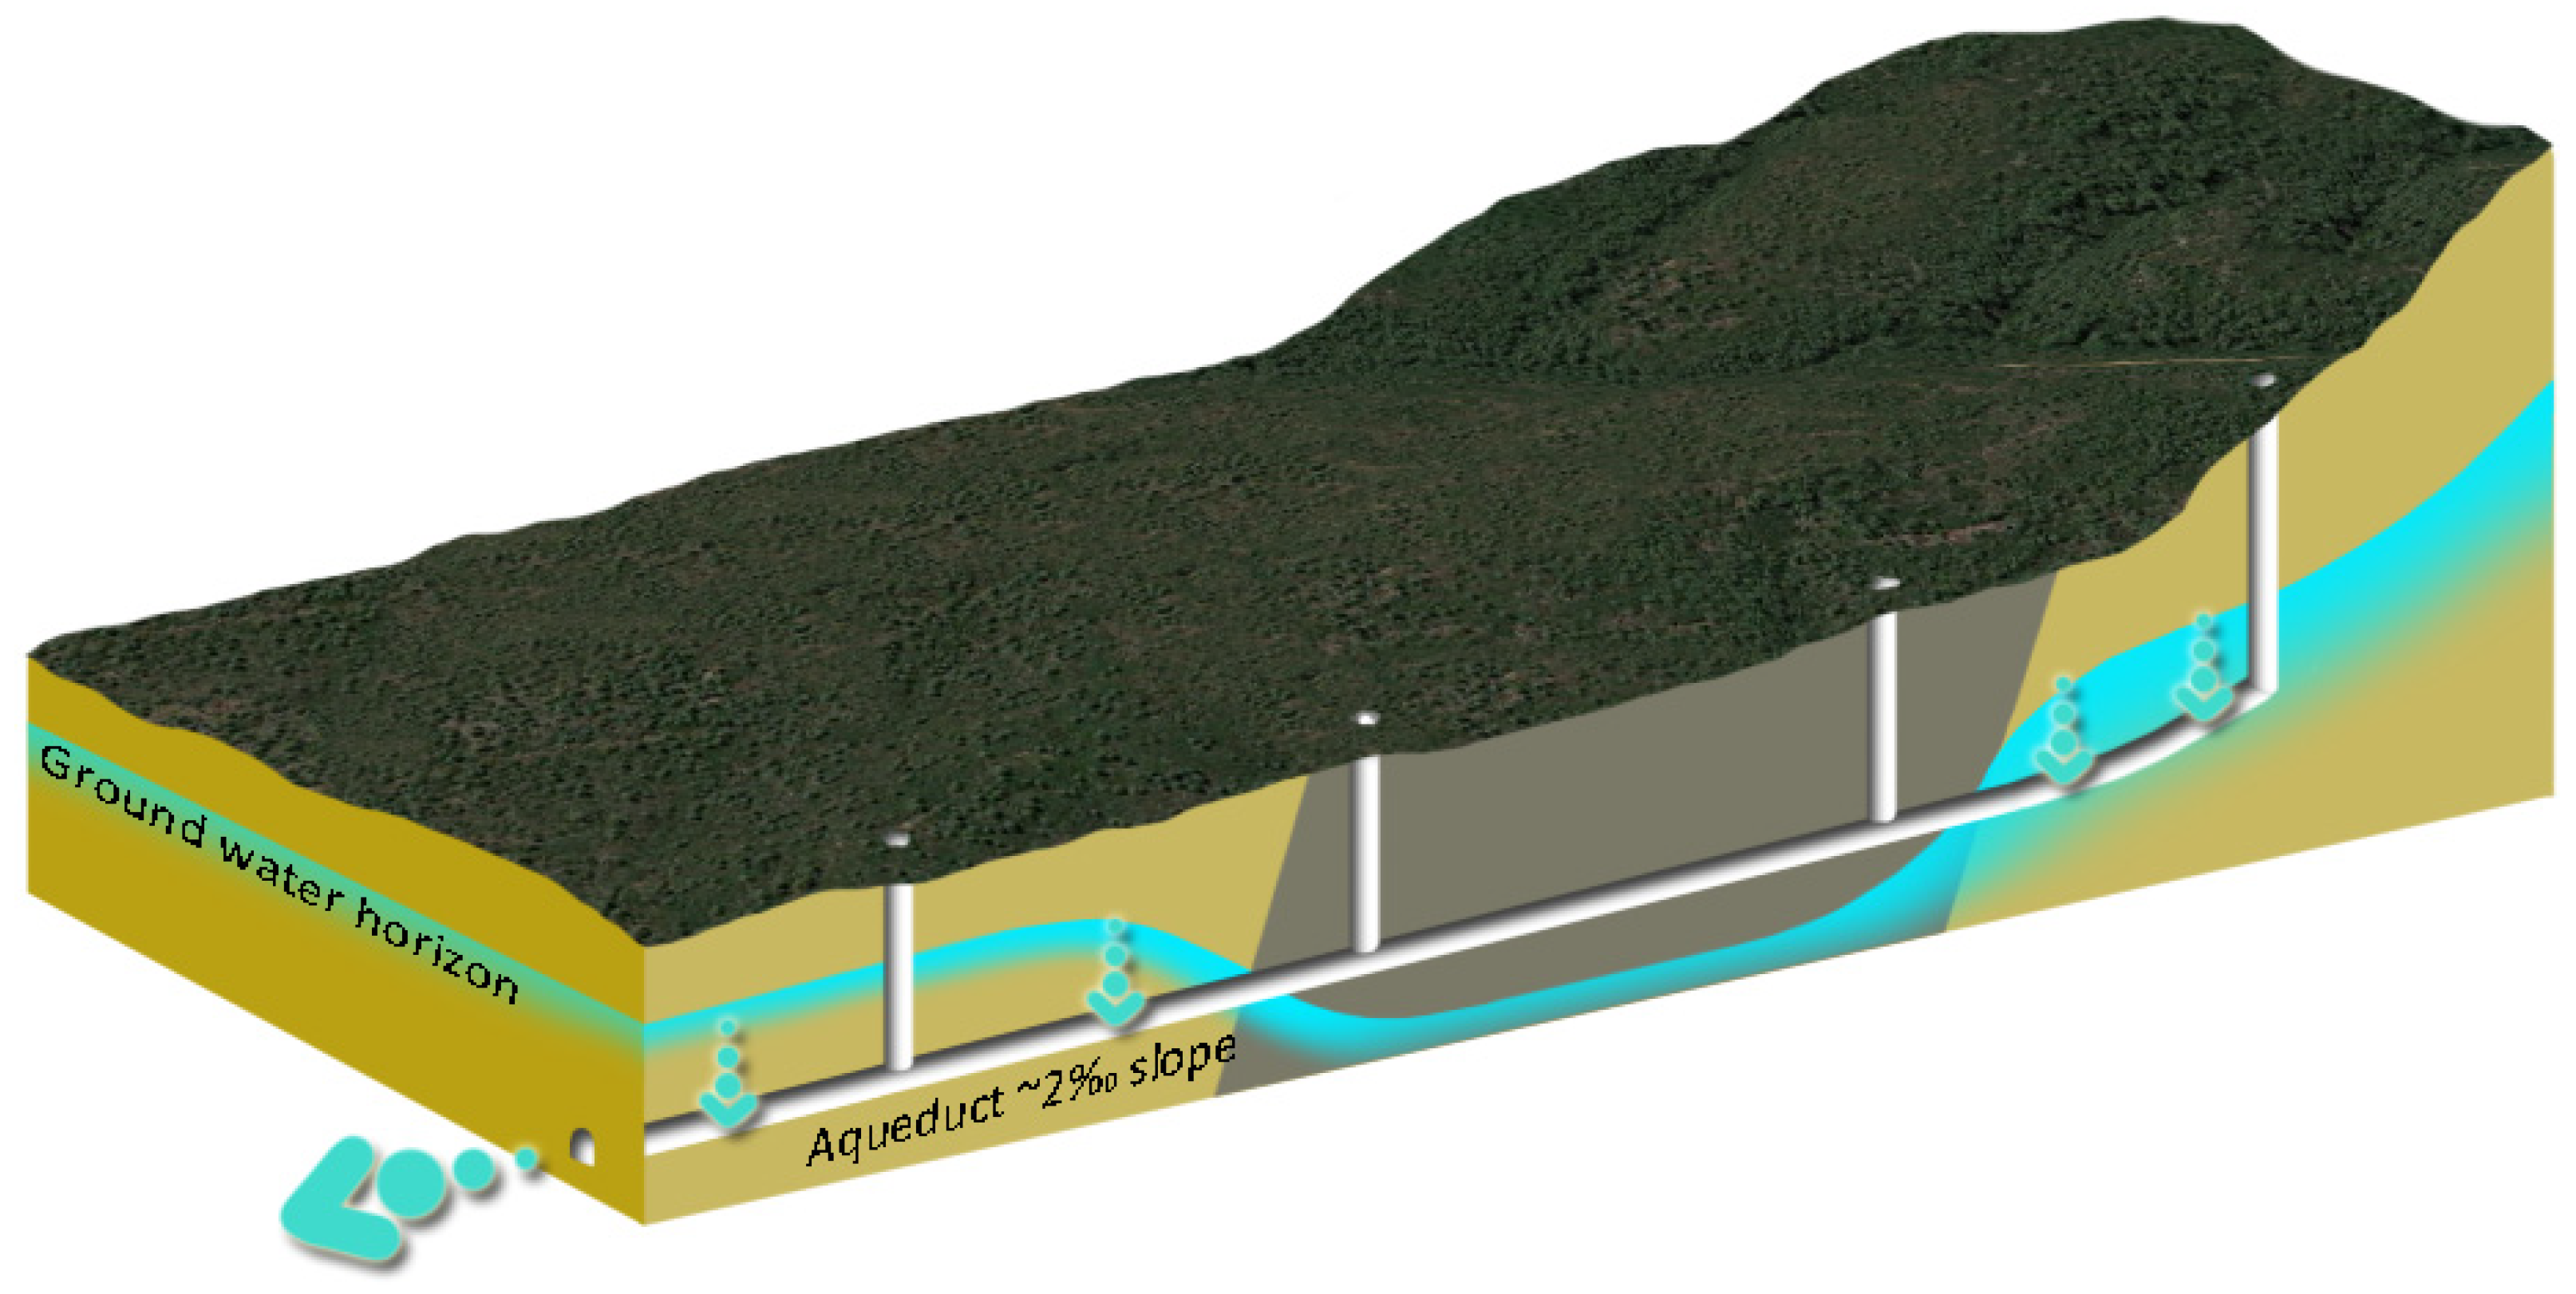
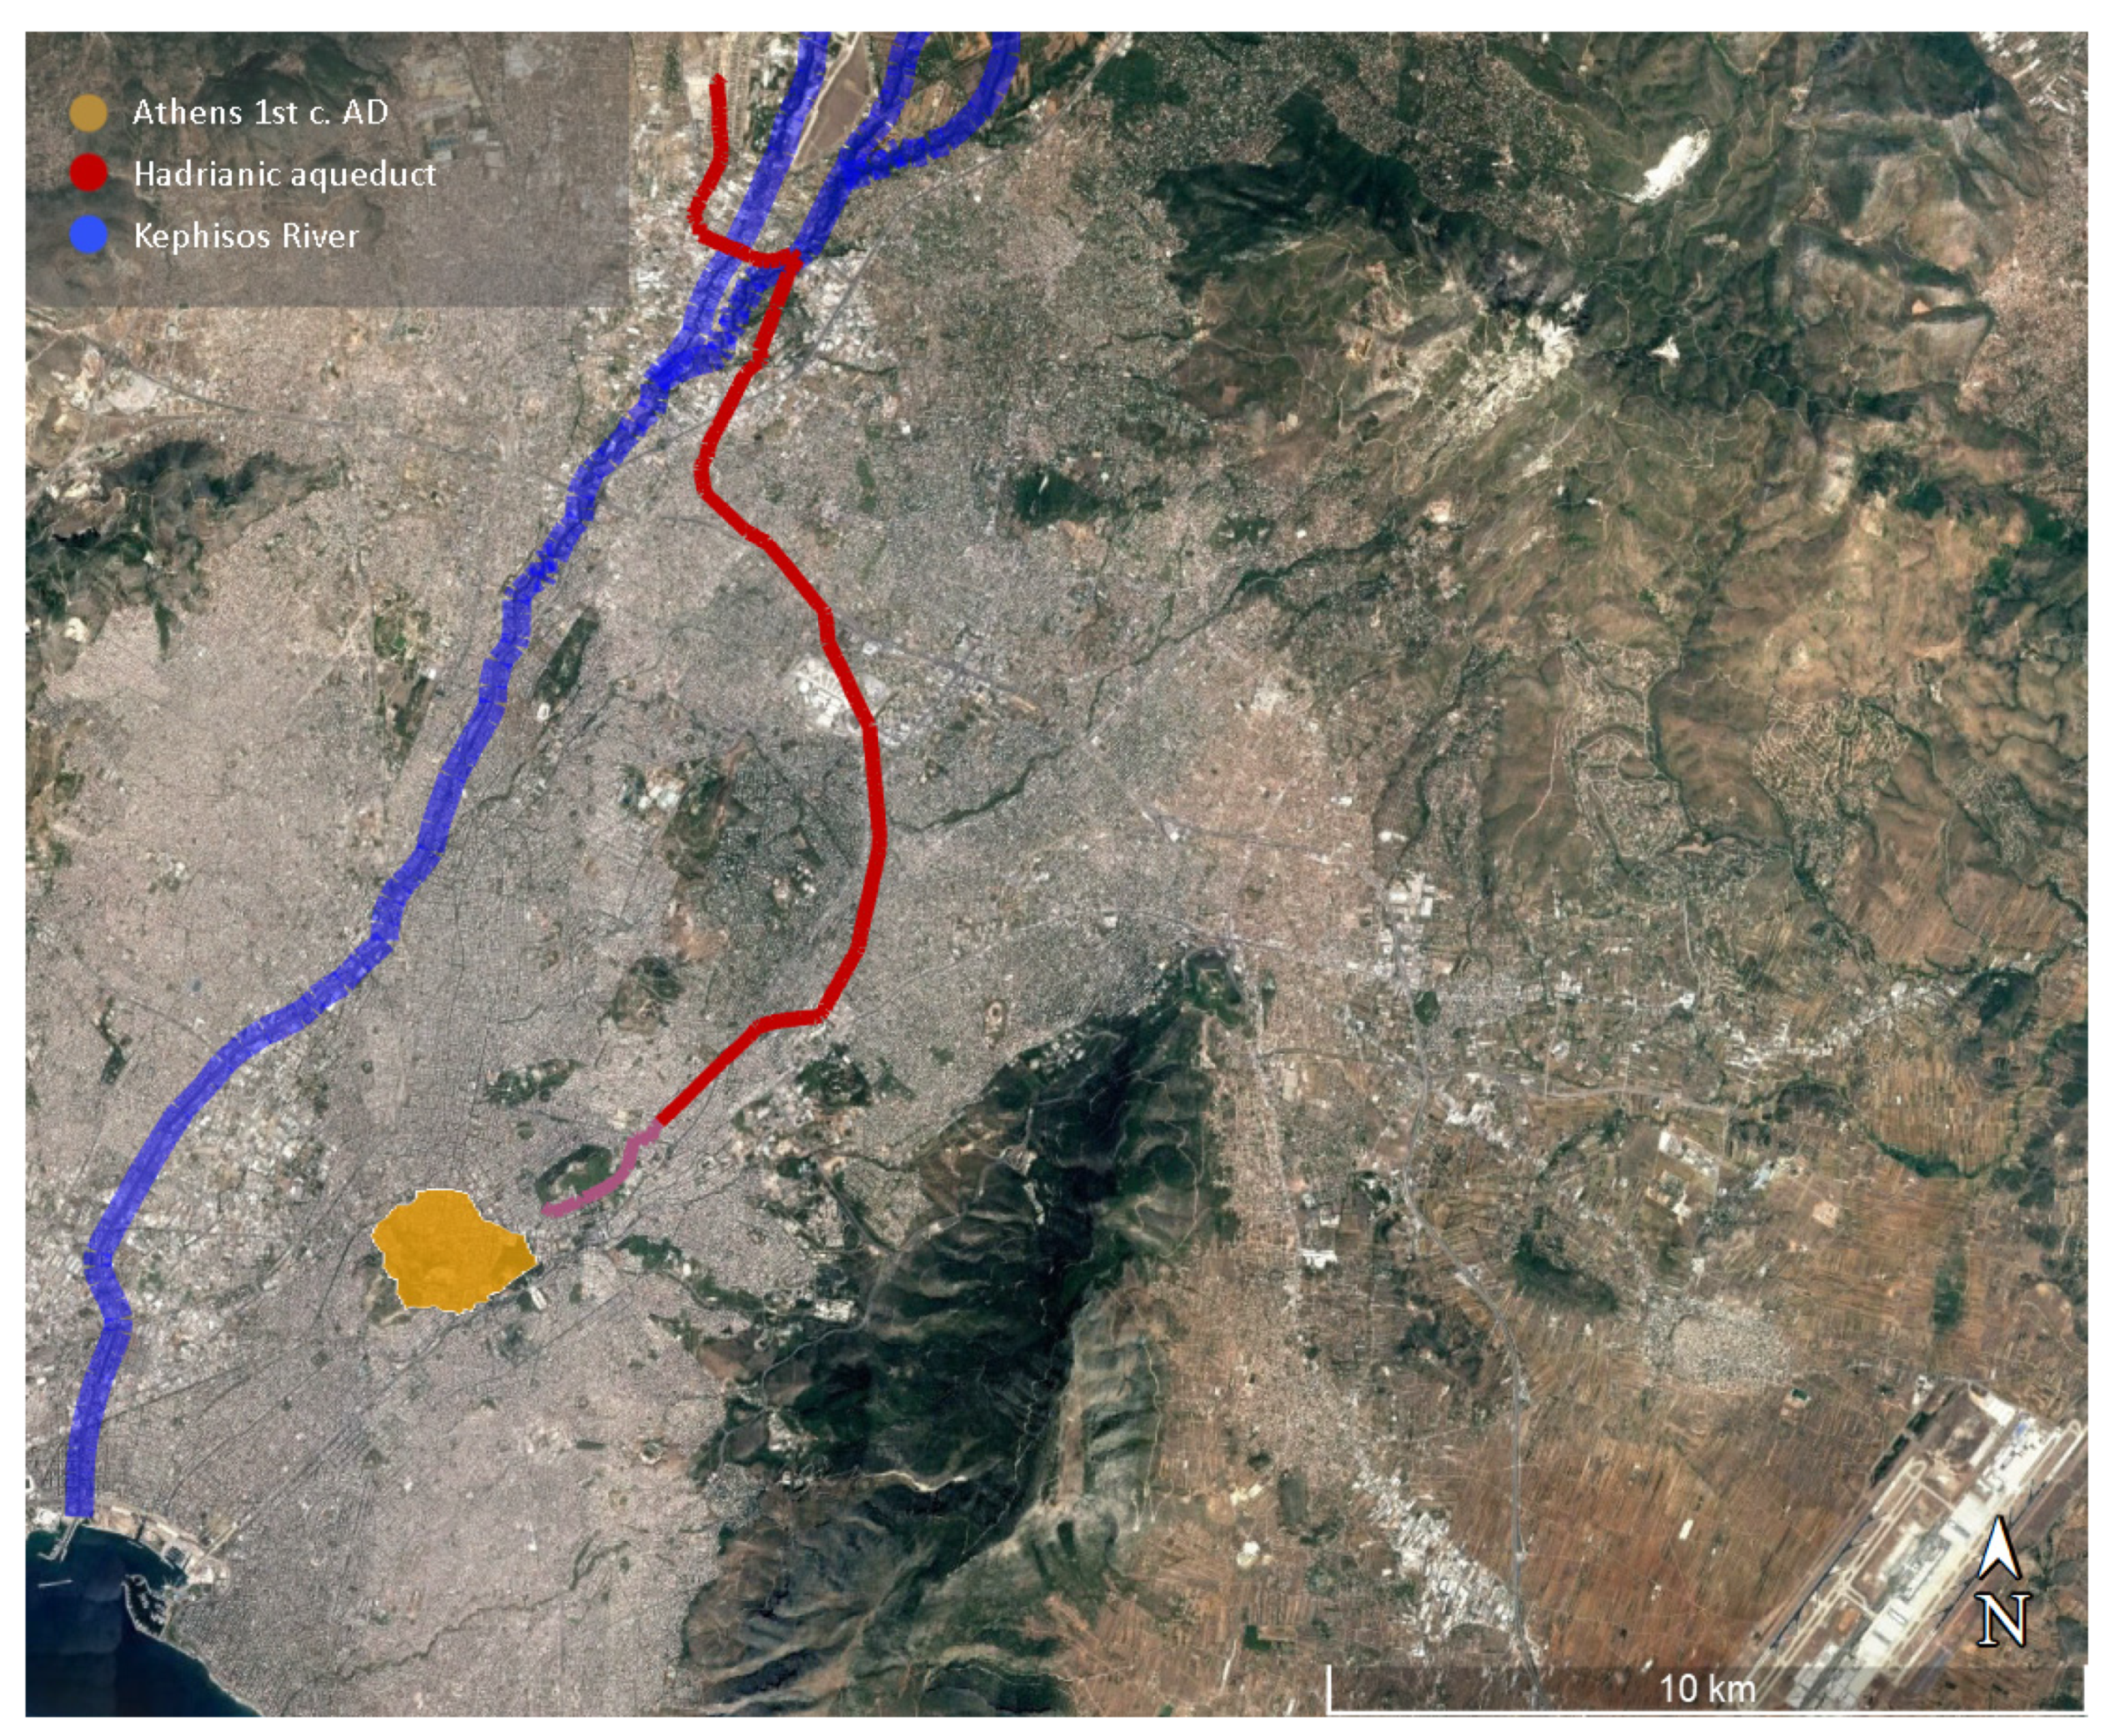
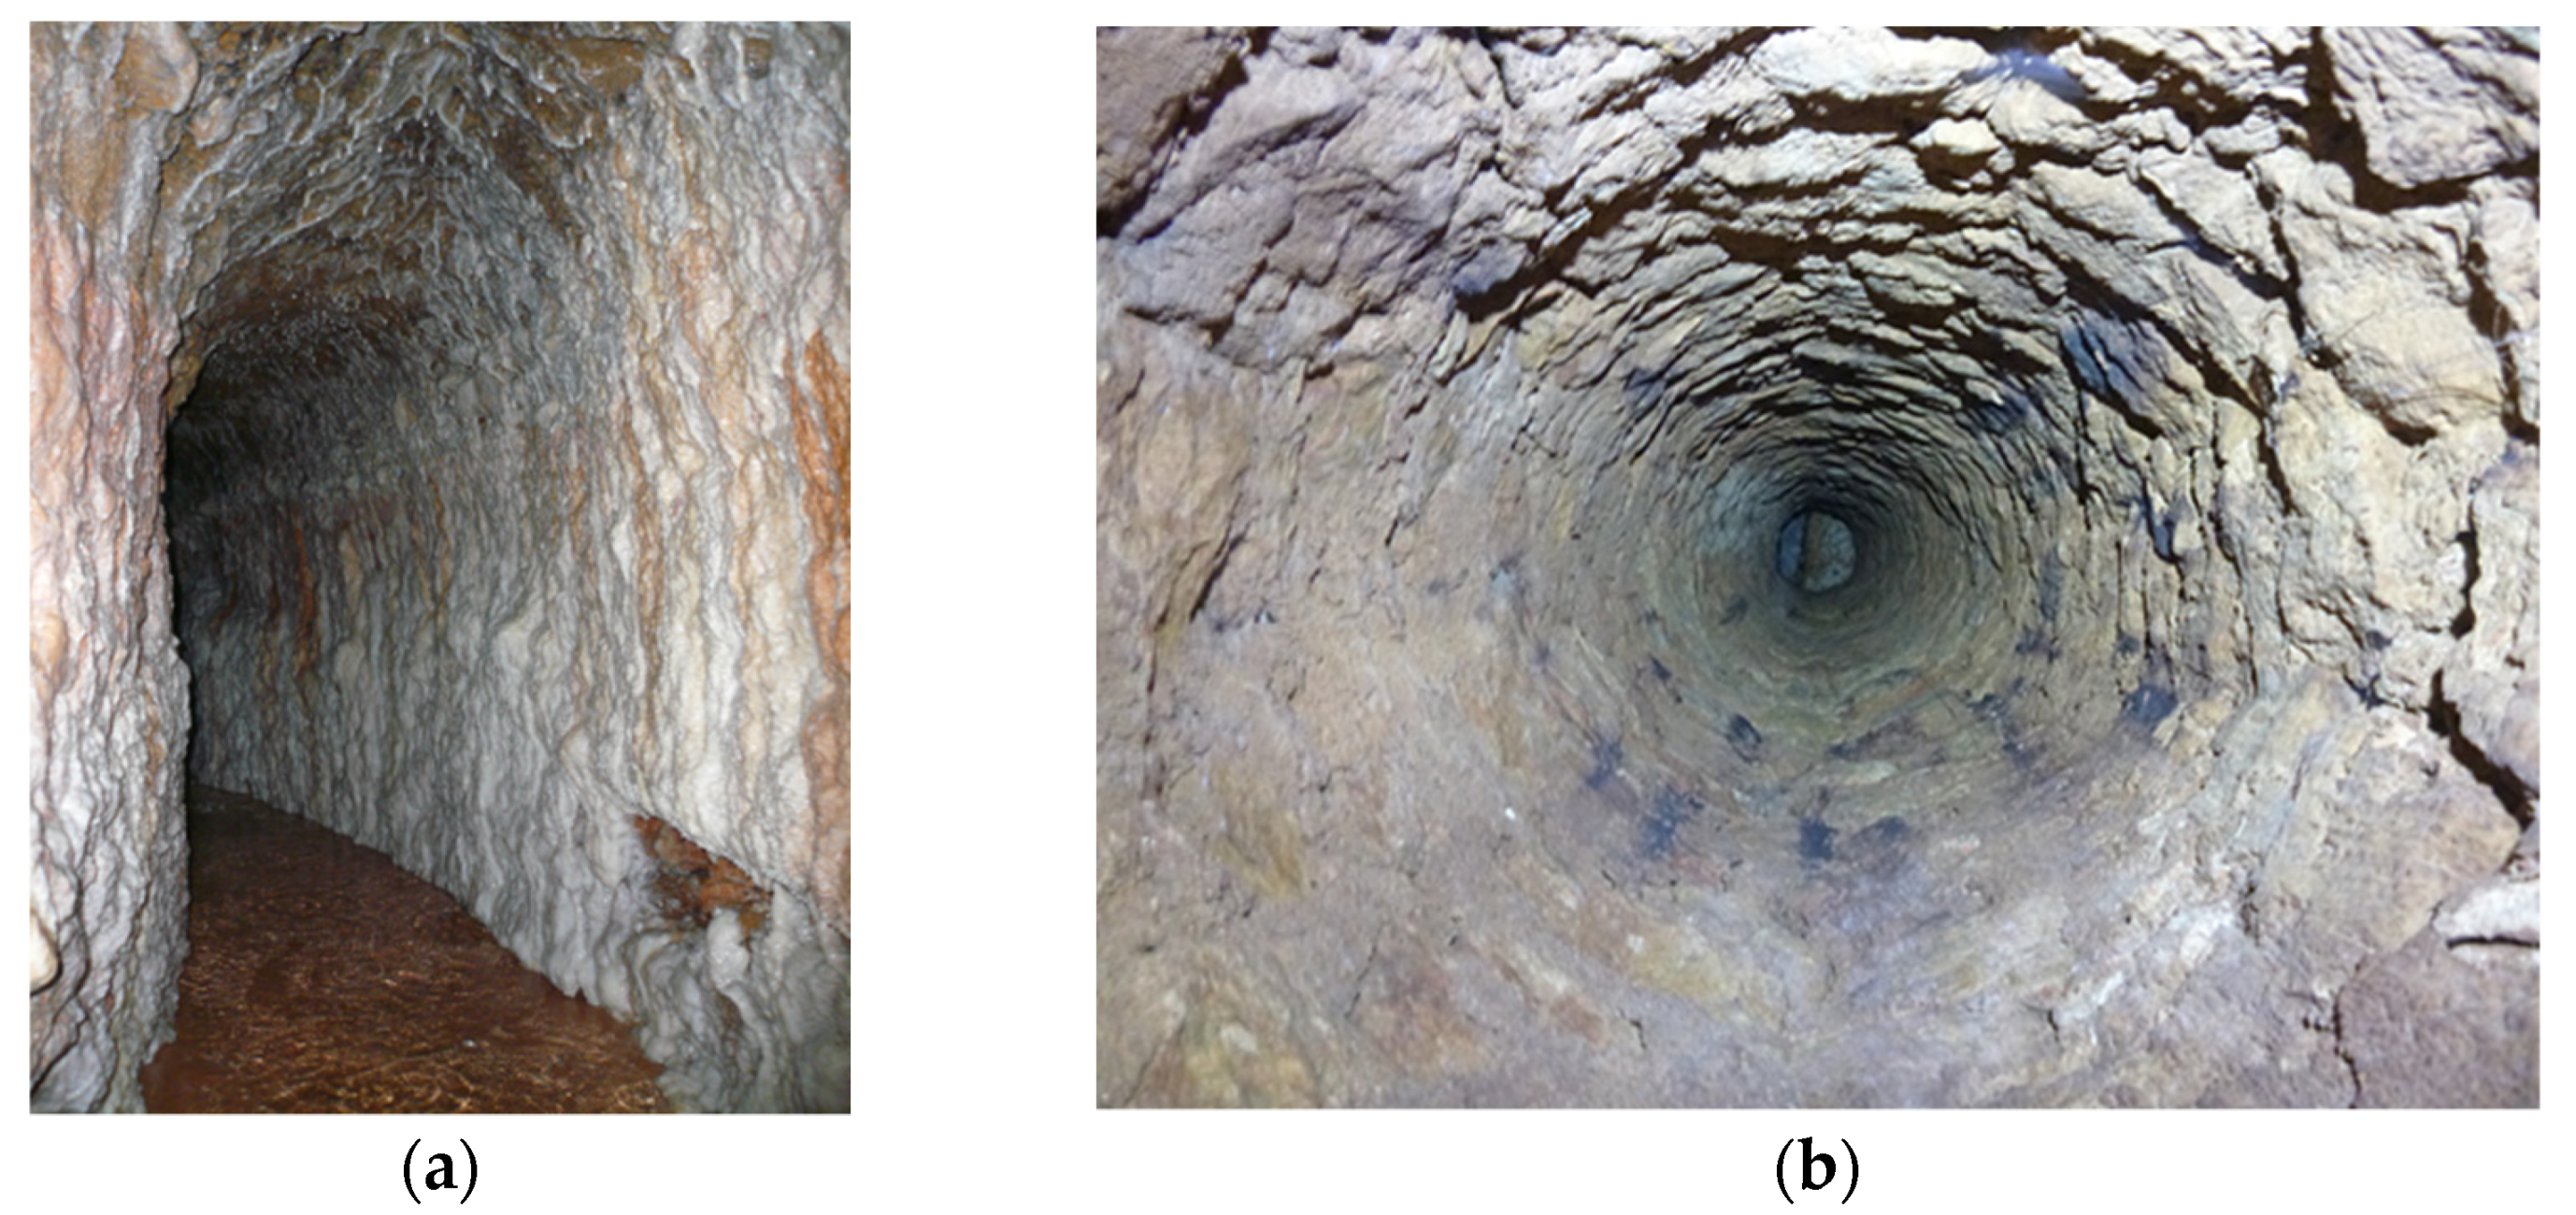
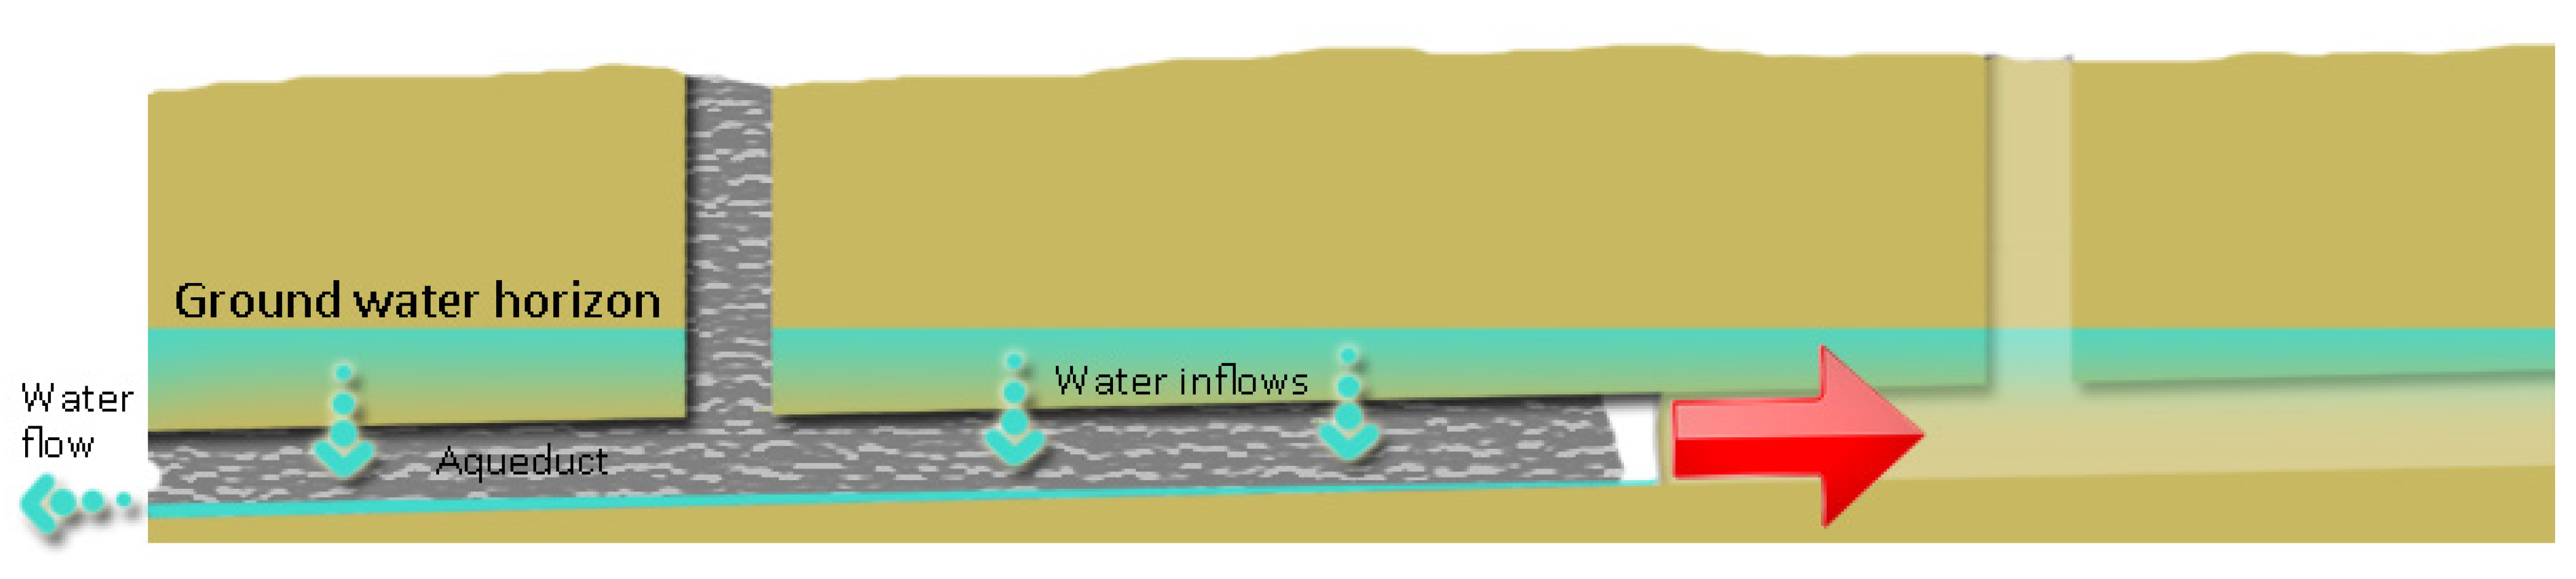
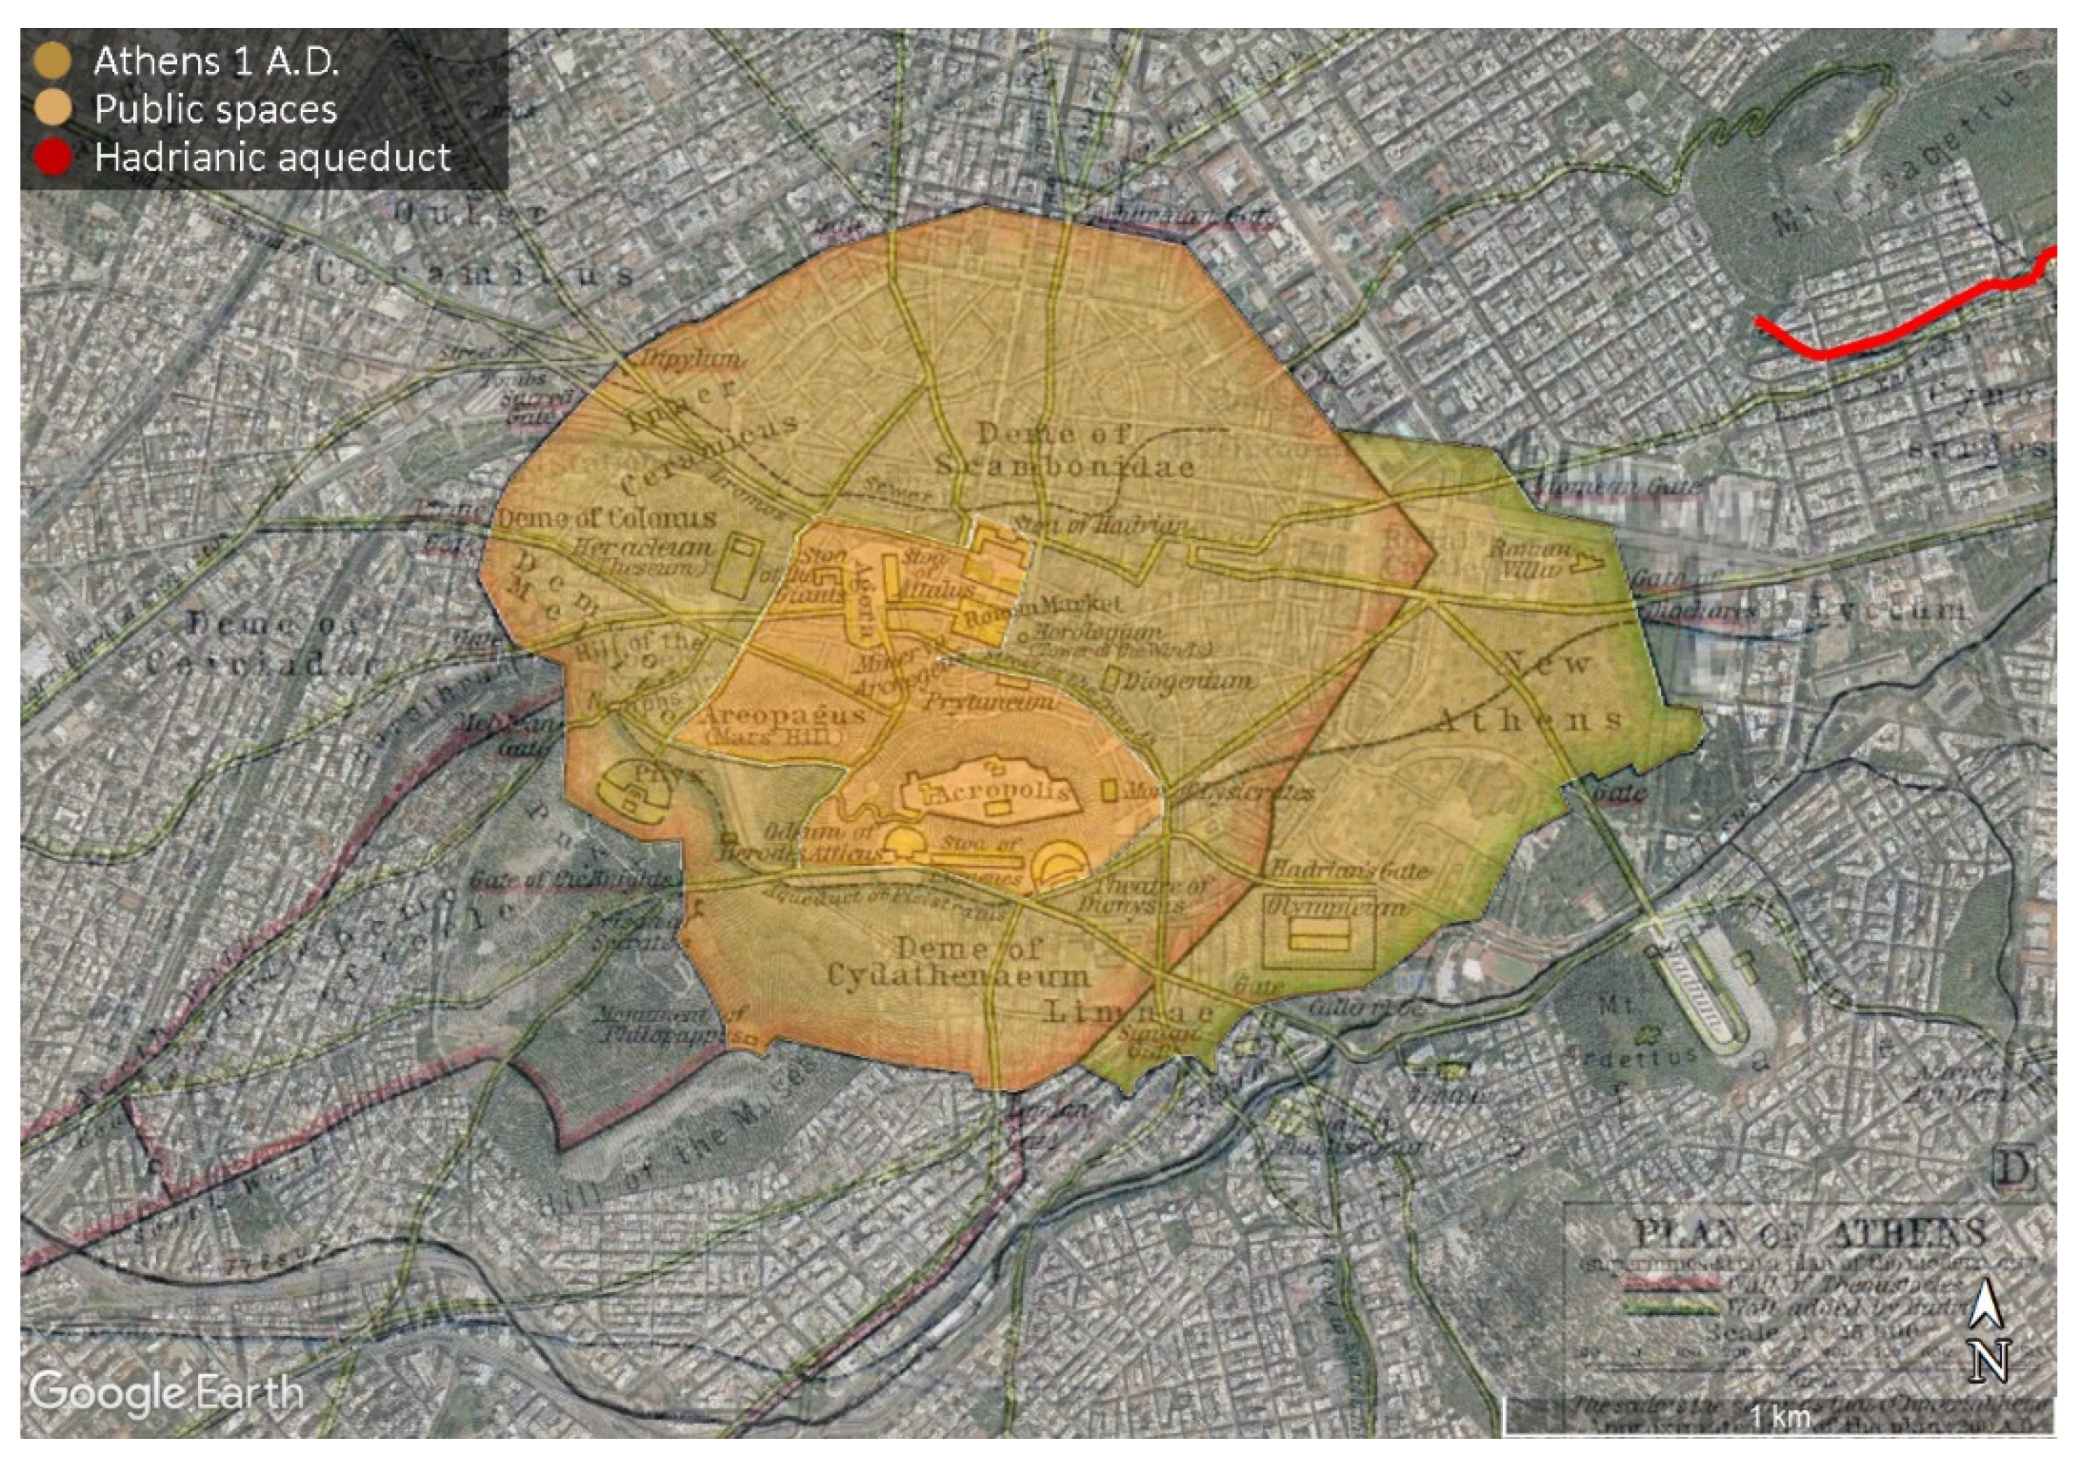
5.2. Description of the Hadrianic Aqueduct

The Hadrianic aqueduct is an underground project [66,67]. The main tunnel of the aqueduct starts from the foothills of Parnitha and ends after 20 km in Kolonaki’s reservoir that is located in the outskirts of the Roman city. It has a maximum height of 2 m and a typical width of 50 cm.
As the tunnel is under the groundwater level, the main volume of the carried water is collected by the aqueduct from an underground linear process called υδρομάστευση (groundwater capture) [68] (Figure 12). However, groundwater capture does not happen along all the length of the aqueduct but in areas with proper geological formation with a high-water level. It is also very impressive that the engineers in antiquity had to design an aqueduct without seeing the water. This can be explained by the note of Koutsoyiannis [69]: “Most principles related to water technology and management were known to ancient Greeks”.
A detailed description of the aqueduct, with photos and .kmz location files, can be found in a related research project [2] (Figure 13 and Figure 14).
The Hadrianic aqueduct was a difficult project, designed by highly skilled engineers, carried out by experienced craftsmen, and supplied Athens with water for 1900 years constantly, and it is still operative [69]. Comparing technological solutions to water problems between ancient and modern Greece, Koutsoyiannis noted [70]:
while the present-day technologies are obviously superior, the underlying design principles are not different in the two cases, while it is questionable whether there has been any progress with respect to durability, sustainability and balance in water technology and management.
In order to approach and describe the construction of the aqueduct, in situ research [2], including underground explorations, are carried out from members of the “Urban Speleology Research Team” under the leadership of the second author, Panos Defteraios. The team was trained in the Training Programs of Hellenic Speleological Society (ESE) and followed all required security measures, methods and equipment (Figure 15, Figure 16 and Figures S1–S4).
Figure 13. Athens 1st c. AD. Hadrianic aqueduct and Kephisos River [2,71].
World 03 00014 g013
Figure 14. Profile of the aqueduct from Olympic Village to Agios Demetrios. Horizontal axis, the length of the aqueduct in meters; vertical axis, the altitude in meters.
World 03 00014 g014
Figure 15. In situ research inside the Hadrianic aqueduct. (a) Second author, Panos Defteraios, in an operative and narrow part of the tunnel. (b) Member of the “Urban Speleology Research Team” in the tunnel of the aqueduct. (c) Fourth author, Prof. Nikοs Mamassis, in the tunnel of the aqueduct.
World 03 00014 g015
Figure 16. (ad) Different views of the tunnel of the Hadrianic aqueduct.
World 03 00014 g016
The Hadrianic aqueduct followed the technological knowledge of the Greeks [72,73,74,75,76,77,78], as the Romans preferred to build aqueducts like bridges to transfer water. Table 1 and Figure 17 and Figure 18 compare the Hadrianic aqueduct with the so-called Peisistratean (Hymettus) aqueduct, showing impressive similarities.
The first construction phase of the original aqueduct of Peisistratos was 6th c. B.C. This aqueduct had a network of clay pipes and unknown feed. The archaeologist Olga Voyatzoglou noted that, around 5th c. B.C., the archaic installations were dismantled in most places, and the aqueduct was reconstructed (second construction phase). In 4th c. century BC, a big-scale reconstruction of the aqueduct happened (third construction phase). This was the last extension of the Peisistratean aqueduct [79], and during this period, the aqueduct was dug into the tunnel. As the final aqueduct is an extension and reconstruction of Peisistratean, the term Peisistratean is often used for this aqueduct [80,81]. However, Chiotis and Ziller referred to it as the National Garden-Hymettus aqueduct [67,82]. Considering the above, we used the term “the so-called Peisistratean (Hymettus)” aqueduct.
Related research [68] estimate the maximum annual outflows of Hadrianic, equal to 5.6 hm3/y. The mean daily discharge during the Roman era was estimated to be about 10,000 m3 (3.65 hm3/y). Today, the mean annual discharge (not fully functional) has been measured as 1.7 hm3/y [83,84].

5.3. The Human Resources in the Roman era

Hadrianic aqueduct construction is a complex project. The construction team should have a hierarchy as follows: header team of the construction, “engineers”—special laborers and supportive laborers.
Hanson et al. noted about the division of labor in the Roman era [85]:
The starting point of our analysis is Adam Smith’s famous statement that ‘the division of labour is set by the extent of the market’ [86,87]. The standard interpretation of this observation is that larger markets support larger levels of production which, in turn, demand increasing separation of this production into discrete components and the increasing concentration of individuals on specific tasks [88,89,90,91] … Roman cities did not exist in isolation but were linked to wider systems, hierarchies and networks.
In the Roman Empire, there was no rest in a week. However, Jongman assumed that an unskilled rural laborer worked not more than 250 days a year. Most Romans worked six hours per day [92,93,94,95].

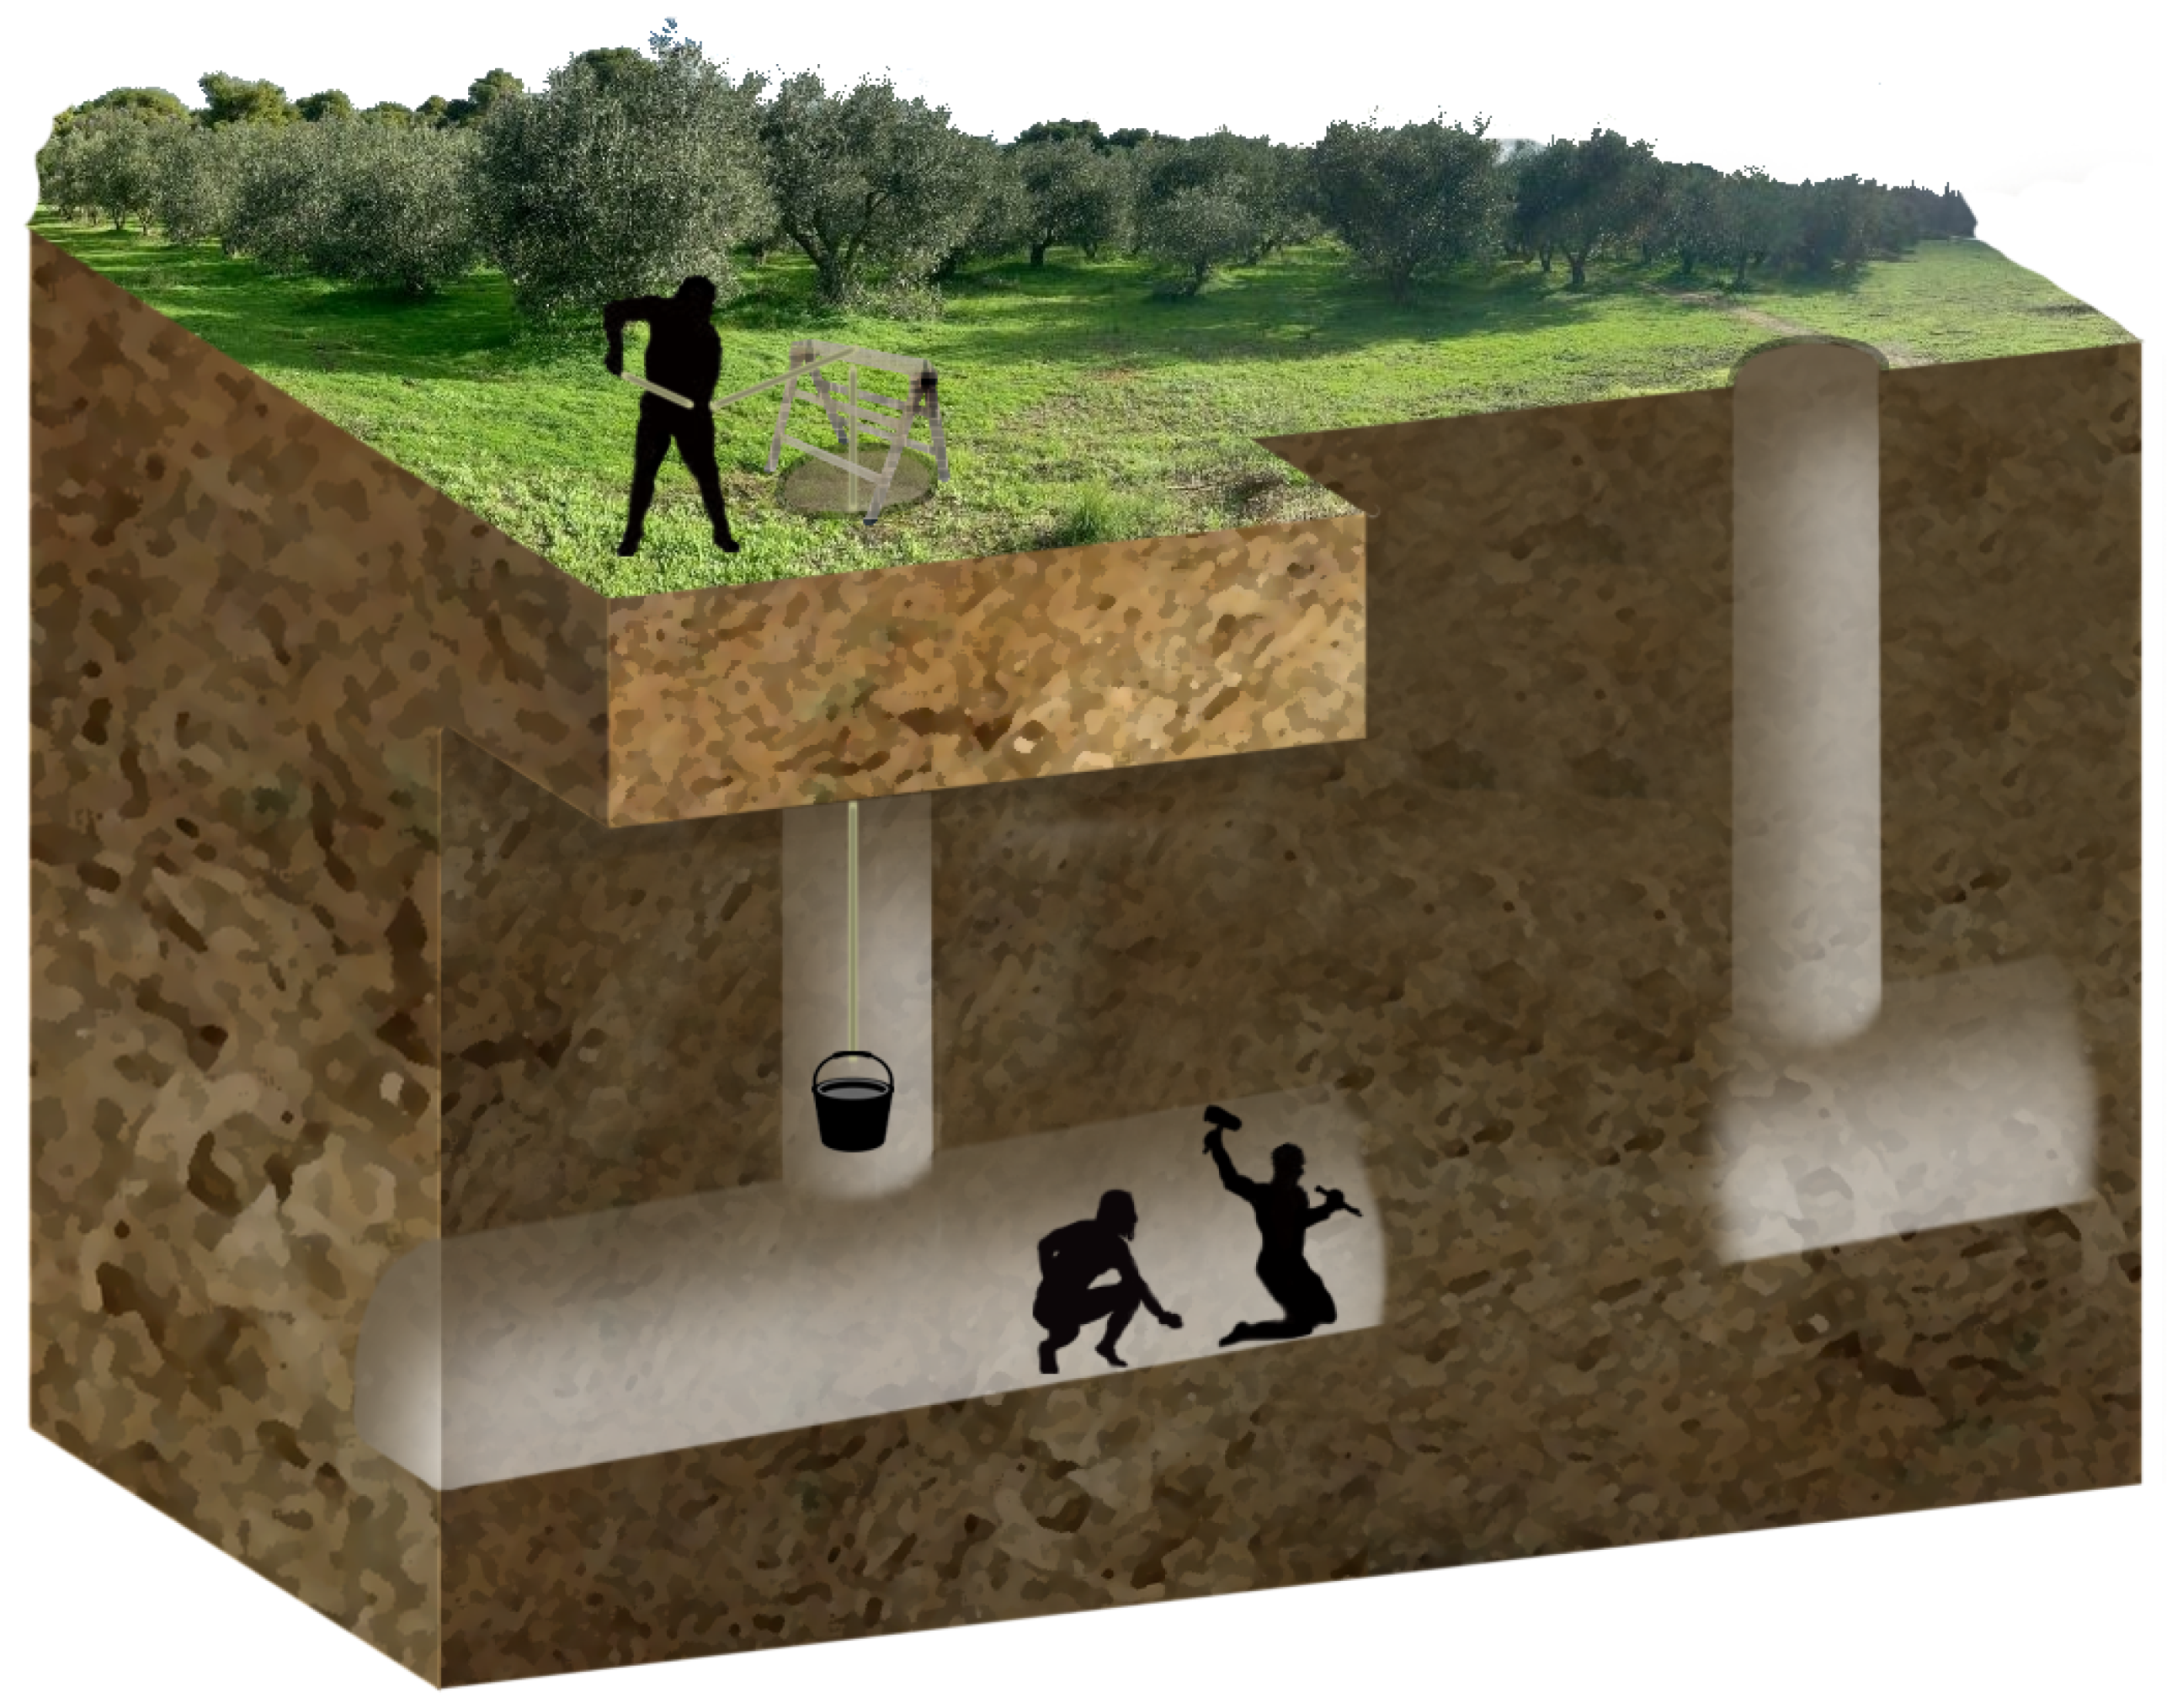
5.4. Description of the Construction of Hadrianic Aqueduct

Tassios [96] noted that: “remnants of ancient Greek Technology lying even under “dark” conditions, are of a paramount archeological importance”. Therefore, is important to describe how and with what resources the applied technology (i.e., large-scale infrastructures) in ancient Greece were created.
To estimate the time and the effort of the project, a significant source is the work of Konofagos [97]. The book describes the procedures for digging wells and tunnels and exploiting silver and lead in ancient Laurion mines [98], an area that prevails marble.
Konofagos considered the used tools and the ability of the worker at the front of the tunnel and estimated that he can excavate about 0.008 m3/h. As the worker must be shifted every few hours, several workers are necessary for a 24-h operation [99]. Konofagos hypothesized 12 h for a worker that can work at the front for 5 h (Figure 19). However, Laurion mines used slaves in contrast to the construction of Hadrianic; therefore, smaller labor times should be considered.
Using the term “continuous worker”, Konofagos described a procedure where the front was dug 24 h per day 30 days per month. Finally, a quantity of an excavation is estimated to be about 0.008 m3/h*24 h*30 d = 5.76 m3 per month. Konofagos also mentioned estimations of Ardaillon [100] of 7.2 m3/month.

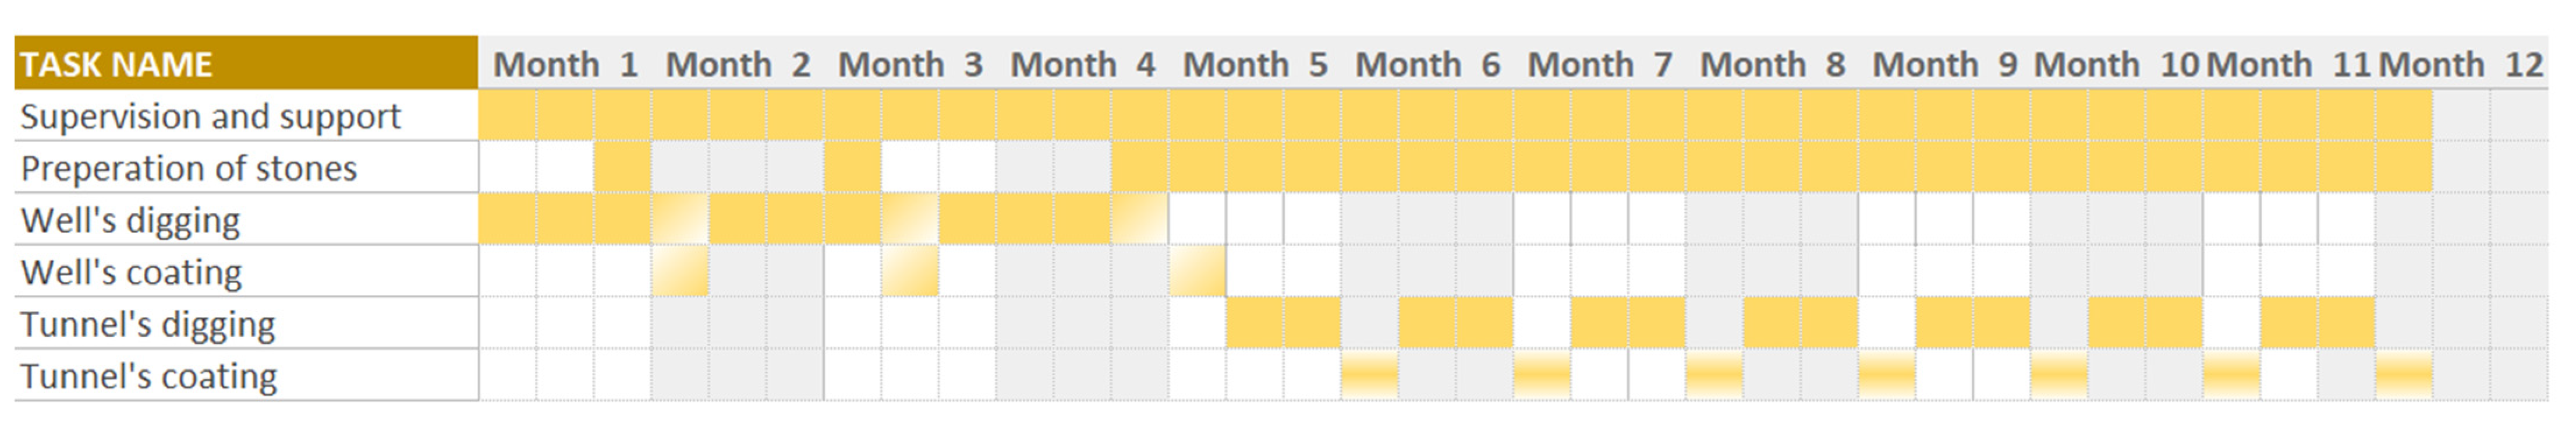
5.5. Simulation of the Construction

Estimating the average dimensions by the analytical profile of the Hadrianic aqueduct, we simulated it with a hypothetical tunnel 20 km long with a mean cross-section 0.5 × 1 m, 400 wells of the mean area and depth 1 m2 and 20 m, respectively. Therefore, the construction could be separated into the following 400 modules described in Figure 20. Considering that the width of the coating is about 0.2 m and the coated area is 100% (60% with stones and 40% with slabs), the total volumes of the excavations for the tunnel and wells were 16,800 and 8640 m3, respectively. The total coated areas for the tunnel and wells were 32,000 and 48,000 m2, respectively.

5.6. Duration of the Construction of Hadrianic Aqueduct

For the construction of an aqueduct, a feasibility study would be obviously needed. We consider that a team of 5 officials, 30 high skilled workers (engineers) and 60 workers would be occupied for 12 months.
We consider also a team for supervision as follows: leaders equal to (number of workers/100), high skilled workers (engineers) equal to (number of fronts) and people working to logistics equal to (number of workers/20).
In order to estimate the duration of the construction, it is important to show the interdependencies and the limitations at the construction site.
The wells should be dug first [101] (Figure 21). After, the wells should be coated in order to be functional (Figure 22). The digging of the tunnel will start after (Figure 23), as it would be impossible for the teams to work together. The digging should be interrupted in phases in order to be coated (Figure 24).
We know that the part after Kephisos is under the level of the groundwater horizon. In addition, digging wells, they would find water in some places. These parts of the aqueduct should be constructed linearly when the lower parts are finished (Figure 25).
Analytical descriptions of the efficiency of workers in different phases are given in the Supplementary Materials.
The description of the general idea of the time schedule of the modulus is presented in Figure 26.
The maximum laborers that could work on this construction should be about 4000 people and will end the construction in less than two years. However, it is assumed a longer duration of construction. Leigh noted [102]:
Hadrian’s first Imperial visit in 125 C.E., and therefore took fifteen years to complete. It is equally possible, however that he began the project during his second visit, in 128 C.E., or that the water system was an addendum to the more elaborate architectural project which he dedicated during his third visit in 131/2 C.E. The inscription I.G. II2 1102 is dated to the latter year and records the award of funds for a gymnasium in the city. We know, therefore, that Hadrian was still making gifts to the city late in his reign. Unfortunately, there is not enough data available about the lengths of time involved in building aqueducts to strongly influence the choice of one date over another, but the latest may be too close to the completion date of 140 C.E. for acceptance.
After analytical calculations, we found that the aqueduct could be constructed in 15 years approximately by 500 workers, considering a supervision team of: 5 leaders and 40 highly skilled workers (engineers). In addition, we assumed 25 people working on the logistics.
We also found that the aqueduct could be constructed in 6 years approximately by 1200 workers, considering a supervision team of: 12 leaders and 100 high skilled workers (engineers). In addition, we assumed 60 people working on the logistics.
The above calculations assume continuous workers (24 h, four shifts) and perfect coordination. Therefore, an added time value should be considered.

5.7. Estimation of the Cost of Hadrianic Aqueduct

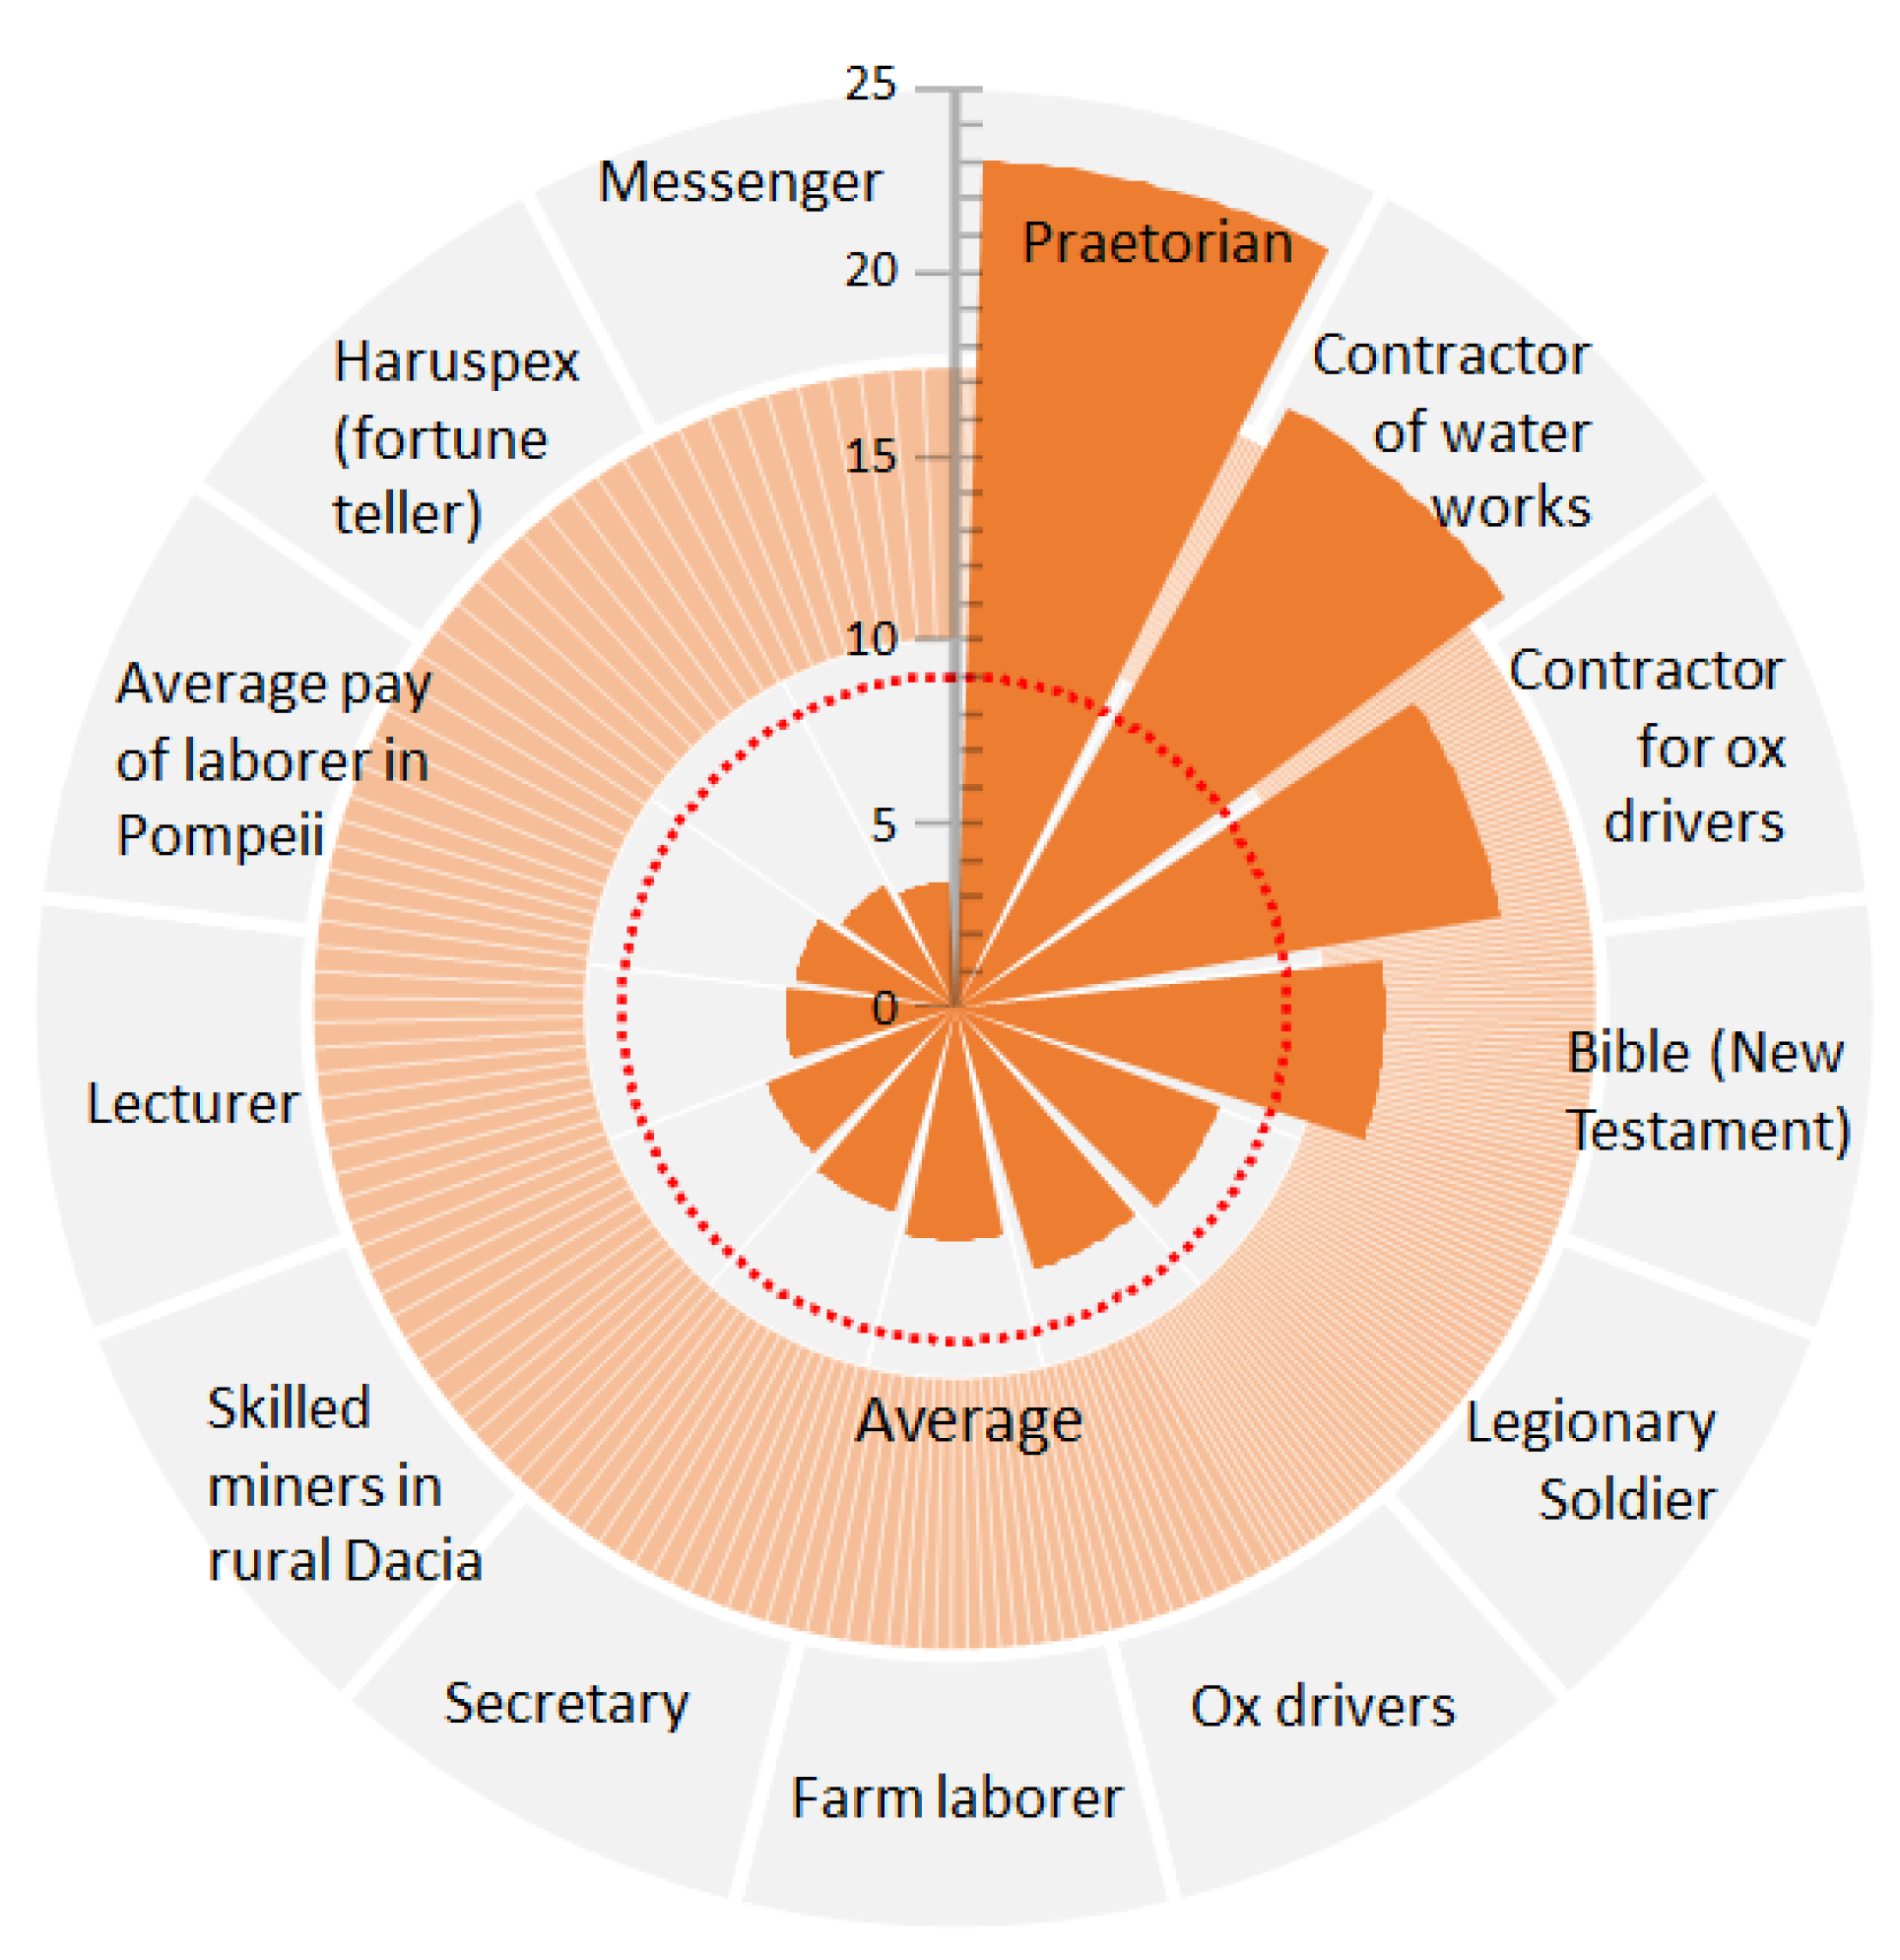
5.7.1. Daily Wage in the Roman Empire 1st c. AD

In order to evaluate the cost of the Hadrianic aqueduct, we have to take a closer look at the wages in the Roman Empire around 1st c. AD. [103,104].
In “The Cost of Living in Roman Egypt” [105], West approached the wages in Ancient Egypt with drachma. In his recent study, Van Heesch estimated 1 drachmae = 0.25 silver denarii = 1 sestertius = 4 asses; 1 drachmae = 6 obols [106]. Other rates of these currencies based on archeological inscriptions have been proposed, but they do not end up in logical results [107].
The unit of volume in ancient Rome was the modius. According to the elder Pliny, a modius of wheat weighed 6.5–7 kg [108]. One atrabae was equal to 4.5 modius [109].
West estimates the cost of one kg of wheat in ancient Egypt approximately 1.15 asses. Williams [110] referred to that the price per kg in Egypt was the lower price in the Roman Empire and estimated as about 1.38 asses, where the wheat price per kg in Italy was 1.83 asses. Cavaignac [111] estimated the average cost of wheat in the Roman Empire during the first century at 3 sestertii per modius or 1.37 asses per kg.
An interesting fact is that, from the earliest times, the supply of wheat in Rome was considered one of the duties of the government. In 123 AD, C. Sempronius Gracchus brought forward the first Lex Frumentaria, by which each citizen was entitled to receive every month a certain quantity of wheat at the price of 1.1 asses for kg (much lower than the price markets in Rome) [109].
Between several estimations of wealth and wages in different eras in the Roman Empire [112], we adopted the values referred to in the period of construction of the Hadrianic aqueduct [105,106,113,114,115,116,117,118,119,120,121,122] (Table 2 and Figure 27). We also adopted the values referred to in the New Testament, which was written around this period [1] (Matthew 20:2; Κατά Ματθαίο 20:2):
καὶ συμφωνήσας μετὰ τῶν ἐργατῶν ἐκ δηναρίου τὴν ἡμέραν ἀπέστειλεν αὐτοὺς εἰς τὸν ἀμπελῶνα αὐτοῦ. (He agreed to pay them a denarius for the day and sent them into his vineyard)
Table 2. Daily wages in asses and wheat in Rome Empire 1st c. AD [105,106,113,114,115,116,117,118,119,120,121,122].
Type of Work Daily Wage (Assarius)Daily Wheat Wage (Liters)
Messenger4.73.4
Haruspex (fortune teller)5.23.8
Average pay of laborer in Pompeii8.04.4
Lecturer6.34.6
Skilled miners in rural Dacia10.05.5
Secretary7.95.7
Farm laborer7.26.3
Ox drivers8.57.4
Legionary Soldier (Private)13.27.6
New Testament, Matthew (Κατά Ματθαίο) 20:2)16.011.6
Contractor for ox drivers17.114.9
Contractor in charge of water works21.318.6
Praetorian (guard in Rome)31.522.9
Legionary Soldier (Centurion)157.38114.49
Figure 27. Visualization of Table 1. Daily wages in wheat in the Roman Empire in the 1st c. AD.
World 03 00014 g027

5.7.2. Coinage in the Roman Empire 1st c. AD

In the beginning of the first century, Roman denarius had 100% purity and 3.9 g weight [122]. A brief review of the denarius’ history in 1 c. AD was given by Butcher and Ponting in their paper “The Beginning of the End? The Denarius in the Second Century” [123]:
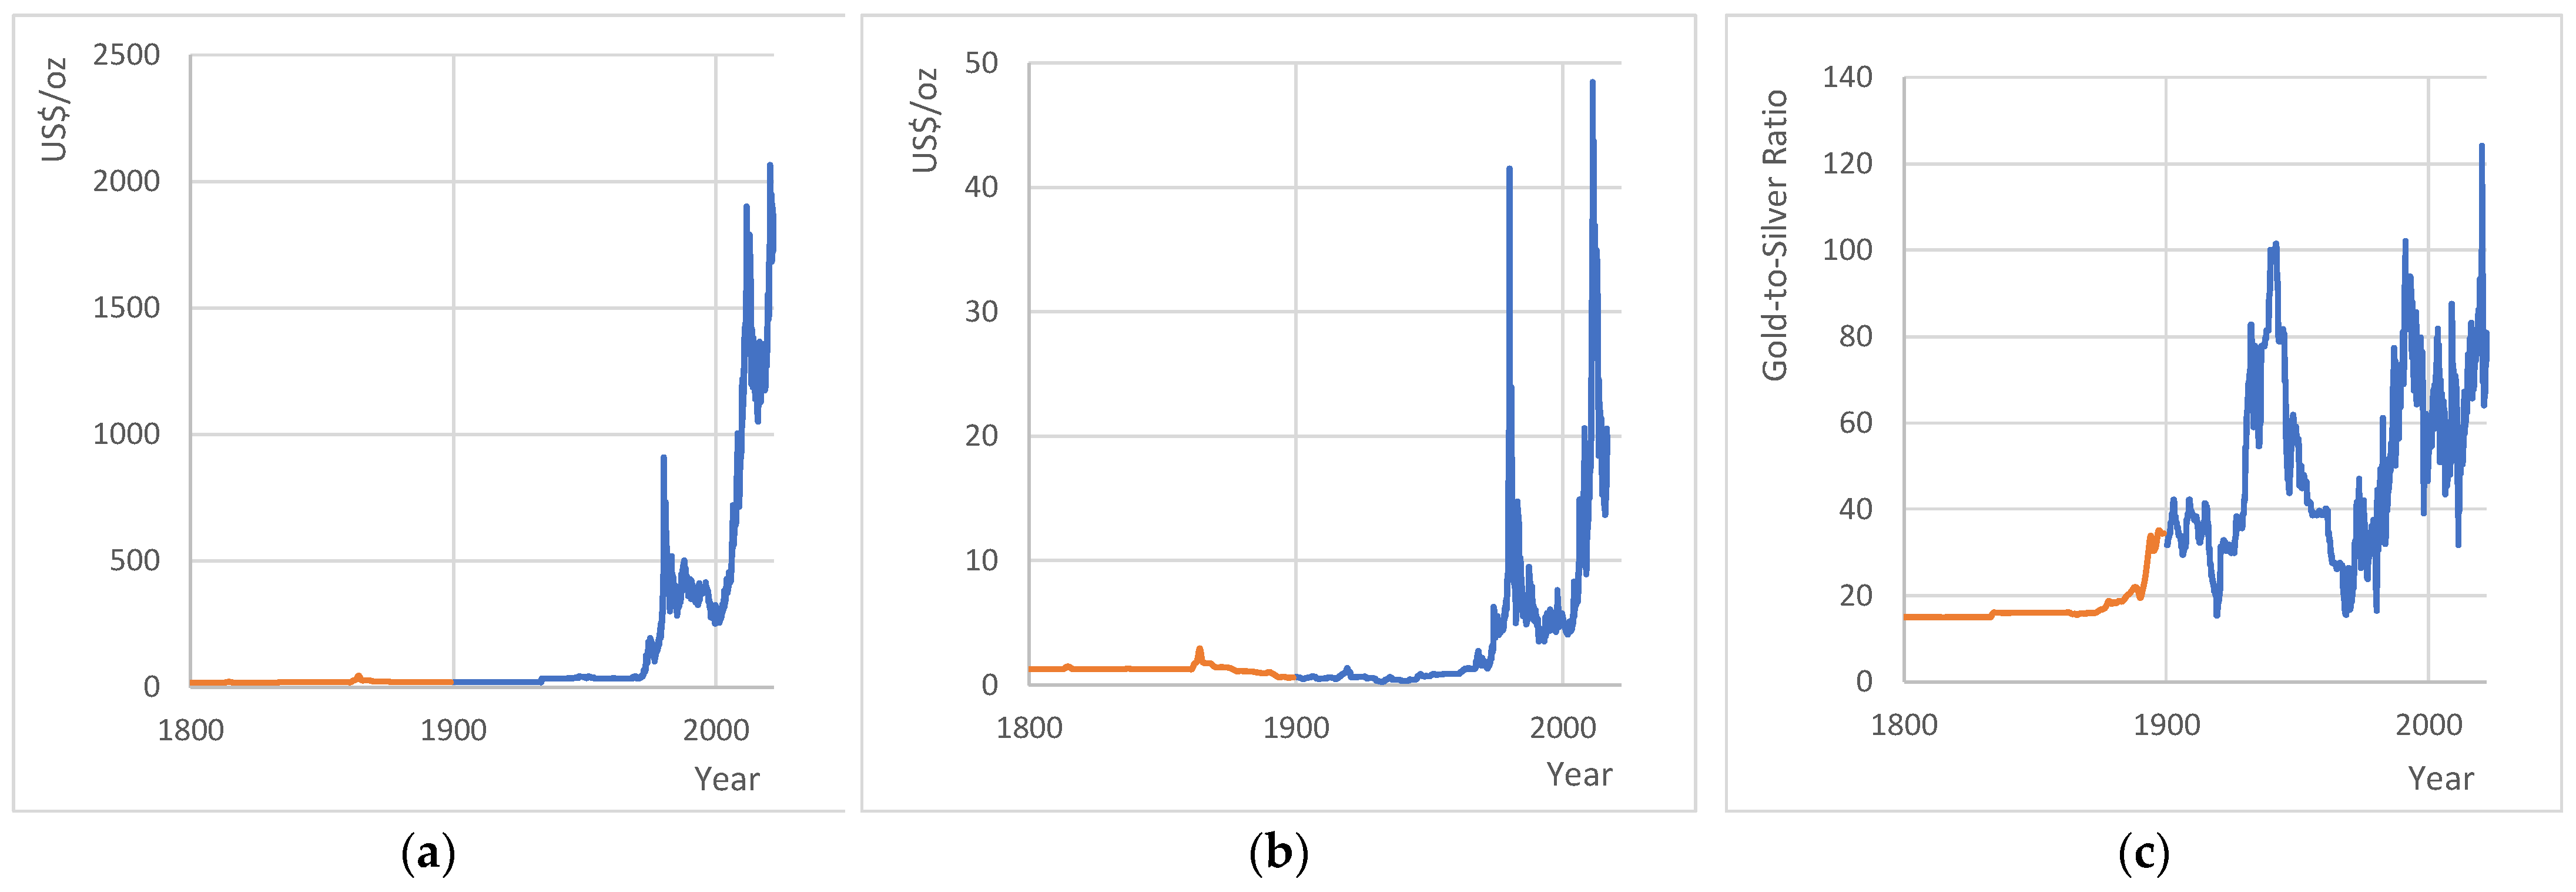
…in about AD 64, Nero reduce its weight [3.45 g] and issued it at about 80% fine. In AD 68 he raised the silver content to 90% but continued to use the reduced weight of about 3.45 g. The following year, during his conflict with Vitellius, Otho lowered the finesses back to 80% when it stayed until AD 82, when Domitian again issued denarii made of pure silver bullion. In AD 85 Domitian reduced it back to the revised Neronian standard of 90% where it stayed until AD 99. In this year, Trajan lowered silvers’ purity back to the first Neronian standard to 80%…. The rein of Hadrian is generally regarded as a period without changes to the coinage, with the denarius remaining at the Trajanic standard, or else falling very slightly below it.
The visualization of this paragraph is given in Figure 28. Hadrian silver denarius contains about 2.59 g silver.

5.8. The Cost of Hadrianic Aqueduct in Cotemporary Prices and the Cost with Modern Technologies

In order to simulate the quantification of today’s values to antiquity in the same place of the Hadrianic aqueduct construction, we studied the daily wages in modern Greece (2021). Today, the minimum wages in Greece are formulated by the Greek Laws 4046/2012, 6/28-2-2012 and the interpretative circular 4601/304/12-3-2012 [124], with recent adaptations [125], which determine the minimum worker’s daily wage between 29.62 EUR and 38.51 EUR. It is estimated that the average wage is 54.32 EUR. According to global price markets with minimum wage, one could buy 0.02 oz of gold, 1.35 oz of silver, 0.41 barrels of oil or 150 kg of wheat. Even the prices of metals are stable; unfortunately, the prices of gas and wheat differ from the prices of oil and wheat in global markets [126]. Adopting the local market price, the average daily wheat wage corresponds to about 54 kg of wheat.
Analyzing the labor hours, we estimate that 1,650,000 daily wages were needed for the digging and coating of the wells and the aqueduct. For this daily wage, we adjusted the daily wage of a skilled miner. In addition, we considered daily wages for: leaders of the construction’s site equal to Centurion, highly skilled workers (engineers) equal to contractors in charge of waterworks and people working on logistics equal to the average pay of laborers in Pompei.
  • The cost of the Hadrianic aqueduct in wheat wages in antiquity was estimated to be about 14,250,000 kg. The cost in denarius was estimated at about 1,450,000 and, in silver, was estimated at about 3800 kg. Note that the costs of tools, animals and supplementary sources were not included.
  • In today’s prices in Greece (February 2022), the wheat wages of antiquity (14,250,000 kg) cost about 7,150,000 EUR, and the wages in silver (3800 kg) cost about 2,500,000 EUR.
  • If we constructed the Hadrianic as in antiquity, but paying with modern daily wages (in 2021 Greek prices), the cost would be more than 80,000,000 EUR for wages.
  • If the aqueduct would be constructed with modern ways, the cost would be about 20,000,000 EUR.

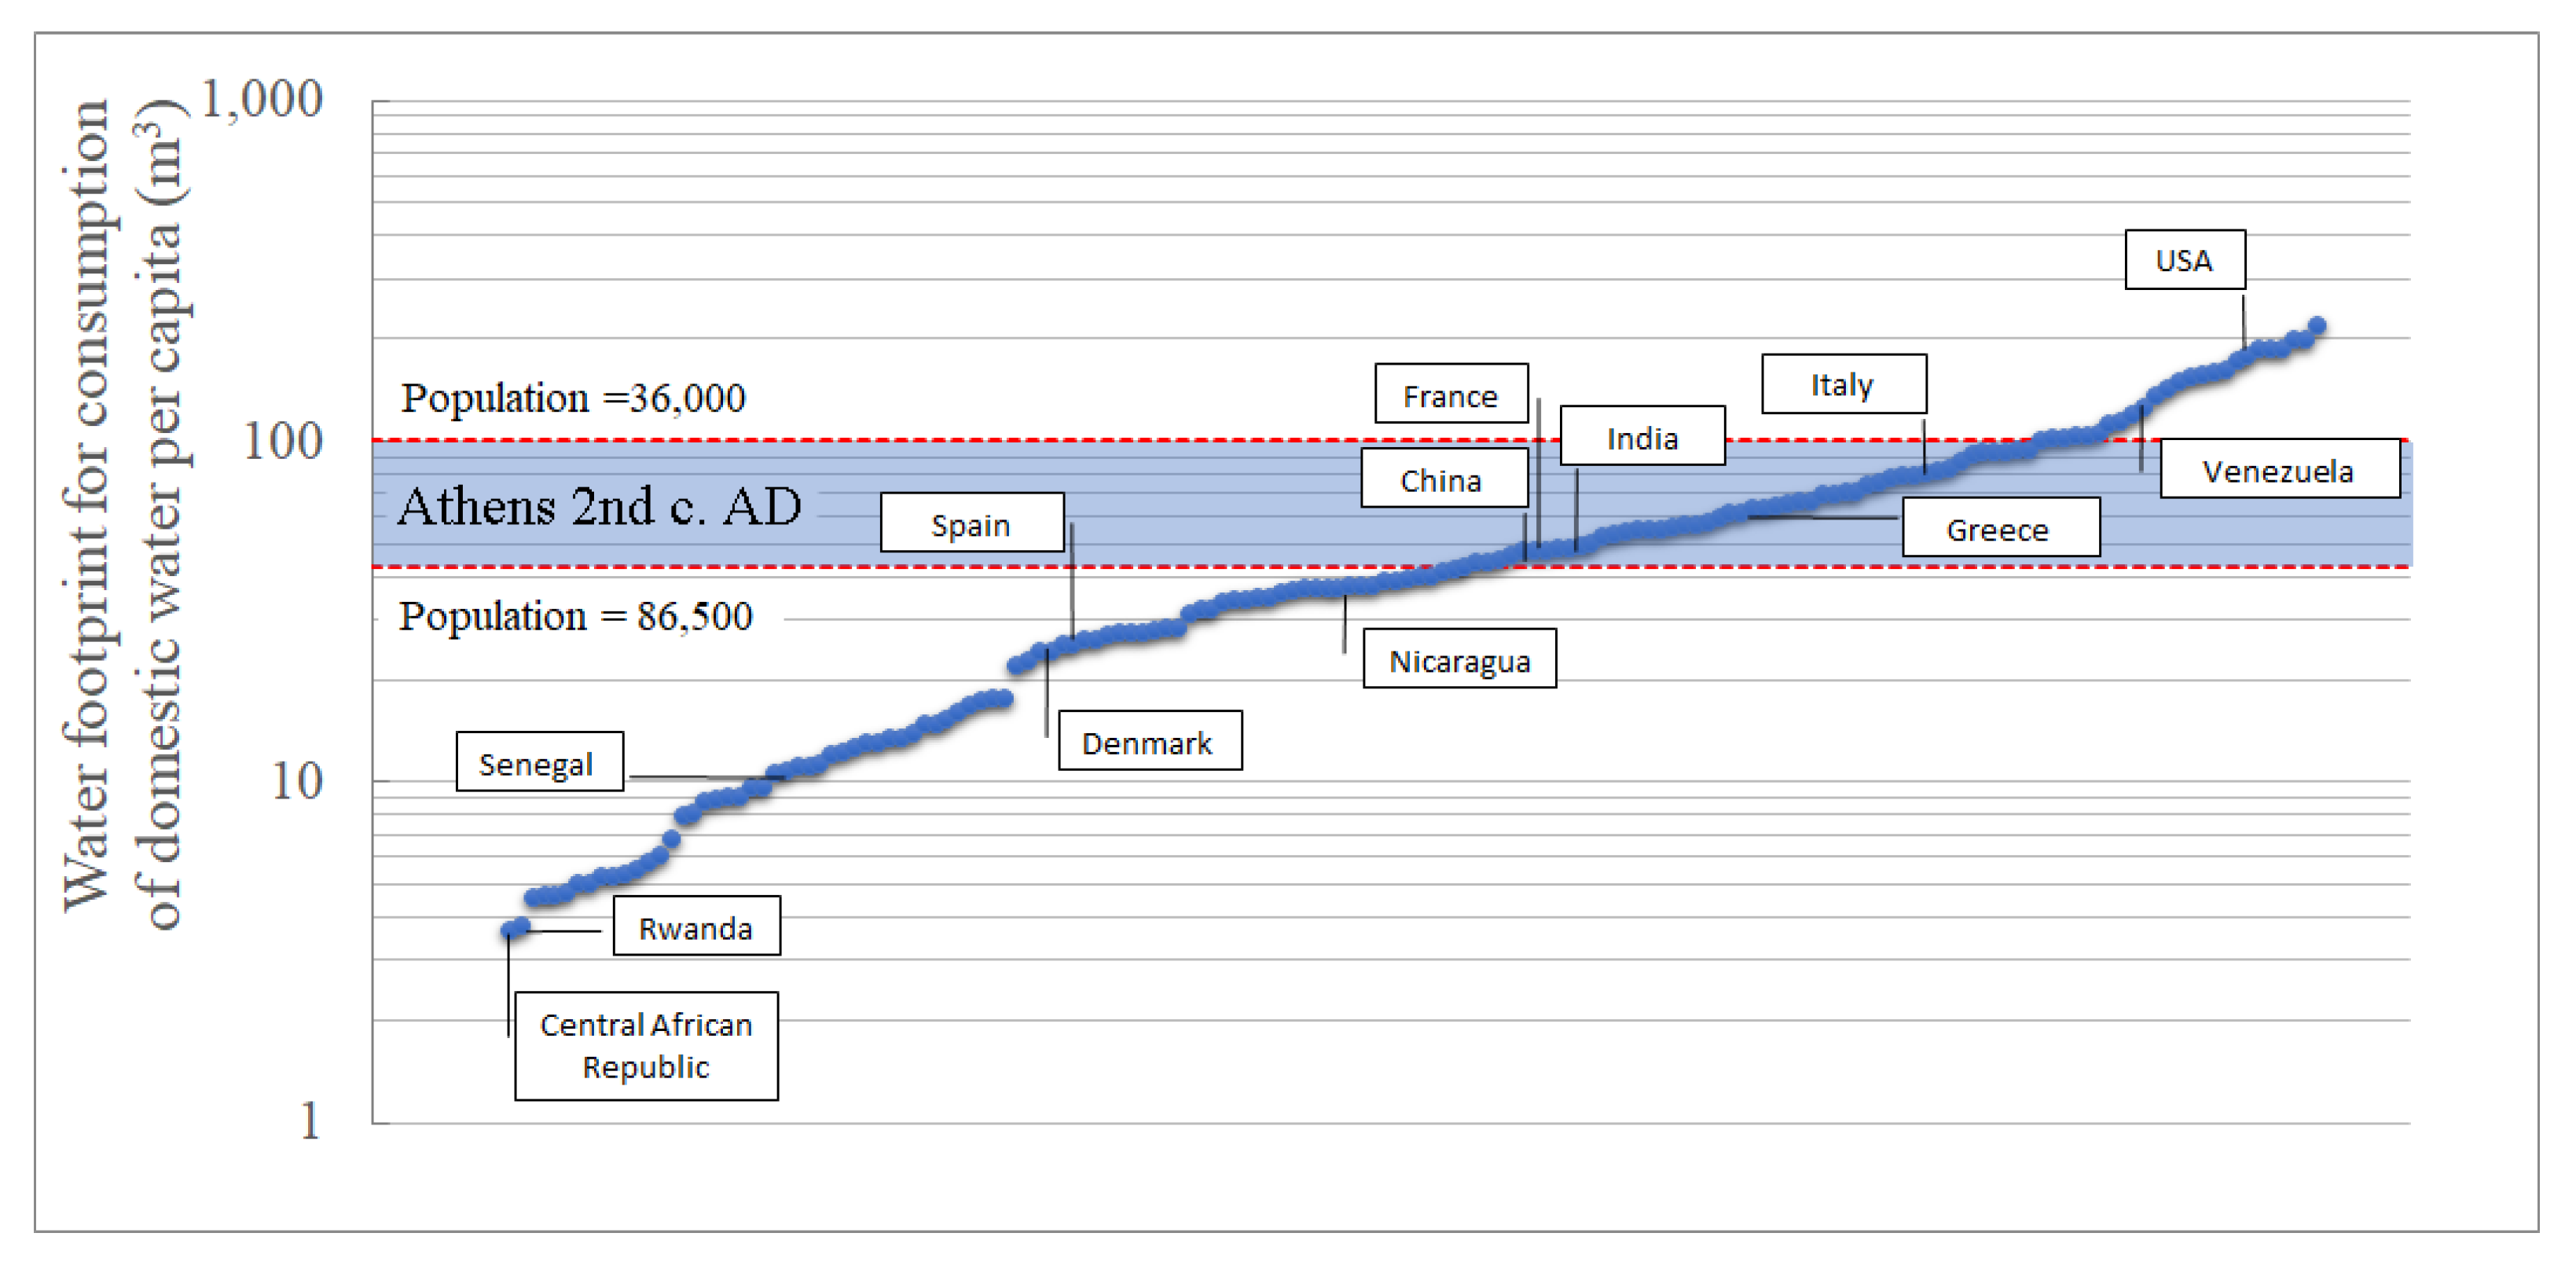
6. Access to Water: From Antiquity to Contemporary World

According to Mays [127], the water consumption in ancient communities that had no direct access to a water resource was estimated as 10–20 L/cap/d and, especially for the city of Jerusalem in 1000 BC, was estimated as 20 L/cap/d. A minimum requirement of 40 L/d per household resulted from the legislation of Solon [128] in the beginning of the 6th century BC [71].
“Since the area is not sufficiently supplied with water, either from continuous flow rivers, or lakes or rich springs, but most people used artificial wells, Solon made a law, that, where there was a public well within a hippicon, that is, four stadia [710 m], all should use that; but when it was farther off, they should try and procure water of their own; and if they had dug ten fathoms [18.3 m] deep and could find no water, they had liberty to fetch a hydria (pitcher) of six choae [20 L] twice a day from their neighbours; for he thought it prudent to make provision against need, but not to supply laziness.”
In Ancient Rome, total water consumption was estimated as 14,018 quinariae (about 550,000 m3) per day. The domestic consumption in these lower class neighborhoods was estimated as 85 L/day per capita, but in addition, the lower classes also had access to public water consumption (baths, fountains and battleships), which corresponded to another 200 L/day per capita [129].
Several estimations can be found in the literature that correlate the area of the city with population in capita per hectare (population density) [130]. Indicative were: Ancient Mesopotamia, 300–500 people/ha [131]; Alexandria, 326 people/ha (estimated by the descriptions of Diodorus Siculus [132]); Pompeii, 160 people/ha [133]. Russel [134] noted that the population density of most ancient settlements would have been “about 100–120 persons per ha”, although he acknowledged that some settlements might have had up to 200 people per ha. In Medieval Europe, the density was estimated to be about 100–200 people/ha [134]. According to the Hippodameian system in Piraeus, a block of eight residences in the Hellenistic period with total 40 dwellers had an area of 0.2 ha. That gives a population density of 200 people/ha [135]. Hanson and Ortman estimated average population densities of 1st AD for about 180 people/ha [136]; however, we estimated the population density of Athens as 429 people/ha.
Morris [137] held that, by 150 BCE, Athens had declined to less than 10,000 inhabitants. Others hold that 10,000 is too low and suggest that Athens in Roman times may have had up to 20,000 inhabitants [138]. Russell et al. estimated that the population in Athens in 1 AD was about 25,000 inhabitants [139].
Archeological evidence shows that the area of the City of Athens in the Roman period was 234 ha (about 200 ha if we exclude public places such as Acropolis and Agora) (Figure 29). Piraeus (the city nearby), therefore, considering the population density by the Hanson and Ortman estimations, we assumed the possible range of Athens inhabitants between 36,000 and 85,800 people.
When it was fully functional, the Hadrianic aqueduct even during dry periods transferred daily at least 10,000 m3 [67]; therefore (excluding the so-called Peisistratean (Hymettus) aqueduct and wells), we could consider that the water footprint for the consumption of domestic uses of an Athenian was between 42 and 101 m3/year per capita. Interestingly, about two billion people have less available water for domestic uses than the minimum water level assumed for the Athenians in the early 2nd century (Figure 30).

7. Conclusions

We showed that wealth as the GDP per capita is a prosperity of humanity that increases the life expectancy. However, true wealth is the availability of the WEF, which is also related to the life expectancy and GDP, showing that the coverage of real needs is what prosperity is. A data analysis confirmed our hypothesis.
We also showed that the values of the commonly used symbols of wealth (gold and silver) changed throughout history by social issues, as the demand for gold and silver can vary wildly with a fixed supply, which can lead to equally wild swings in their prices.
Therefore, we estimated the values of wages in antiquity and the present as wages in wheat which are an important cross-cultural comparison of economic wellbeing. Analyzing global data, we showed that about 1.4 billion people live in present under the average lower wages in antiquity.
We know that humanity hunts real wealth (WEF), with large-scale infrastructures and economies of the scale making this more efficient.
In the presented a case study that we consider a great large-scale infrastructure in antiquity: the Hadrianic aqueduct.
We described the frame of the social conditions when the Hadrianic aqueduct was build. An analytical technical description with volumes of excavations and coating areas was also presented.
Assuming the same technological methods for underground projects as in ancient Laurion mines, we gave a first estimation of the total humans needed in the efforts for the construction. The estimated value was about 2,000,000 labor days for different specialties. Inspecting the social aspects and salaries in the Roman era, we assumed the stratification and the organization of the construction site.
We made an optimum hypothetical construction site, and we organized the workers in shifts as continuous workers (24 h constantly).
According to our approach, we found that the maximum number of laborers that could work on this construction should be about 4000 people and will end the construction in less than two years. However, in the literature, it is referred that the time of construction is between 6 and 15 years. We estimated that the aqueduct could be constructed in 15 years approximately by 500 workers or in 6 years approximately by 1200 workers.
Analyzing the daily wages of different specialties, we estimated that the total daily wages for the construction of the Hadrianic aqueduct in antiquity in wheat was 14,250,000 kg, and silver was 3800 kg. However, we did not include the costs of tools, animals and supplementary sources. We estimated that, using today’s prices in Greece (February 2022), the wheat wages of antiquity (14,250,000 kg) cost about 7,150,000 EUR, and the wages in silver (3800 kg) cost about 2,500,000 EUR. Further research could examine the project funding scheme in antiquity.
Finally, we showed that the Hadrianic aqueduct changed the life of Athenians, giving them daily at least 10,000 m3. We investigated the range of the population in Roman Athens, and we estimated a range of the water footprint of the consumption of domestic use per Athenian. We found that, according to the global standards, there are about two billion people with less water footprint for consumption of domestic uses than the minimum water footprint of an Athenian in the Roman era.
Overall, we showed that, with present technological innovations, the cost of the Hadrianic aqueduct would be less than in antiquity. However, we noted that humanity has not made great progress in the last 2000 years, as about one-third of the population lives with less food and water than Athenians during the Roman era.

Supplementary Materials

The following supporting information can be downloaded at: https://www.mdpi.com/article/10.3390/world3020014/s1, Figure S1: In situ research inside the Hadrianic aqueduct (a) Prof. Nikοs Mamassis prepares to enter in the aqueduct by a well; (b,c) Members of the “Urban Speleology Research Team” entering to the aqueduct by wells. Figure S2: In situ research inside the Hadrianic aqueduct (a) Second author, Panos Defteraios and Prof. Nikos Mamasis inside the tunnel of the aqueduct; (b) Prof. Nikos Mamasis inside the tunnel of the aqueduct (c) Member of the “Urban Speleology Research Team” in the tunnel of the aqueduct. Figure S3: In situ research inside the Hadrianic aqueduct (a) Research team; (b) Forth author, Prof. Nikοs Mamassis prepares to enter in the aqueduct by a well. Figure S4: In situ research inside the Hadrianic aqueduct. (a–c) The tunnel of the aqueduct. Section 2: Description of the phases of the construction of Hadrianean aqueduct. Section 3: The efficiency of workers in different phases [97,98,99,100,101,141,142,143,144].

Author Contributions

Conceptualization N.M.; methodology N.M., P.D. and G.-F.S.; validation N.M., P.D. and G.-F.S.; formal analysis, G.-F.S.; investigation, N.M., P.D. and G.-F.S.; data curation, G.-F.S.; writing—original draft preparation, G.-F.S.; writing—review and editing N.M., P.D. and N.D.L. and G.-F.S.; visualization, G.-F.S.; supervision, N.M.; project administration, N.M. All authors have read and agreed to the published version of the manuscript.

Funding

This research received no external funding.

Institutional Review Board Statement

Not applicable.

Informed Consent Statement

Not applicable.

Data Availability Statement

The databases that were used are referred to in detail in the citations given in the text and are publicly available.

Acknowledgments

We thank Effie Nestorides and George Sachinis from Water Supply and Sewage Company of Athens for the continues support to Handrianic Aqueduct issues and Demetris Koutsoyiannis for his notable comments.

Conflicts of Interest

The authors declare no conflict of interest.

References

  1. Holy Bible, New Testament. Available online: http://apostoliki-diakonia.gr/bible/bible.asp?contents=new_testament/contents.asp&main (accessed on 25 January 2022).
  2. Research Project: Exploration of Hadrian Aqueduct of Athens and Recording of Current State of Specific Underground Parts. Duration: September 2017–April 2019. Project Director: Mamassis, N. Available online: https://www.itia.ntua.gr/en/projinfo/197/ (accessed on 25 January 2022).
  3. Defteraios, P.; Mamassis, N. Exploration of Hadrian Aqueduct of Athens and Recording of Current State of Specific Underground Parts; Geographic and Photographic Data File; Contractor: National Technical University of Athens (NTUA): Athens, Greece, 2019. [Google Scholar]
  4. Bao, X.D. The conception of healthcare in Confucianism. Zhonghua Yi Shi Za Zhi 2003, 33, 24–26. (In Chinese) [Google Scholar] [PubMed]
  5. Guo, Z. Chinese Confucian culture and the medical ethical tradition. J. Med. Ethics 1995, 21, 239–246. [Google Scholar] [CrossRef] [PubMed] [Green Version]
  6. Life Expectancy. Available online: https://ourworldindata.org/life-expectancy (accessed on 5 October 2020).
  7. Maddison Project Database 2018. Available online: https://www.rug.nl/ggdc/historicaldevelopment/maddison/releases/maddison-project-database-2018 (accessed on 25 January 2022).
  8. Bank of England, Home Statistics Research Datasets. Available online: https://www.bankofengland.co.uk/statistics/research-datasets (accessed on 25 January 2022).
  9. Sargentis, G.-F.; Siamparina, P.; Sakki, G.-K.; Efstratiadis, A.; Chiotinis, M.; Koutsoyiannis, D. Agricultural Land or Photovoltaic Parks? The Water–Energy–Food Nexus and Land Development Perspectives in the Thessaly Plain, Greece. Sustainability 2021, 13, 8935. [Google Scholar] [CrossRef]
  10. Human Energy Requirements. Report of a Joint Fao/Who/Unu Expert Consultation, Food and Nutrition Technical Reports Series. 2001. Available online: https://www.fao.org/3/y5686e/y5686e.pdf (accessed on 25 January 2022).
  11. FAOSTAT. United Nations Food and Agricultural Organization (FAO). Available online: http://www.fao.org/faostat/en/#data/FBS (accessed on 25 January 2022).
  12. Ostwald, W. Energetische Grundlagen Der Kulturwissenschaft; Klinkhardt: Leipzig, Germany, 1909. [Google Scholar]
  13. Kohler, T.; Smith, M.; Bogaard, A.; Feinman, G.M.; Peterson, C.E.; Betzenhauser, A.; Pailes, M.; Stone, E.C.; Prentiss, A.M.; Dennehy, T.J.; et al. Greater post-Neolithic wealth disparities in Eurasia than in North America and Mesoamerica. Nature 2017, 551, 619–622. [Google Scholar] [CrossRef] [PubMed] [Green Version]
  14. Koutsoyiannis, D.; Sargentis, G.-F. Entropy and Wealth. Entropy 2021, 23, 1356. [Google Scholar] [CrossRef]
  15. Sargentis, G.-F.; Iliopoulou, T.; Dimitriadis, P.; Mamassis, N.; Koutsoyiannis, D. Stratification: An Entropic View of Society’s Structure. World 2021, 2, 153–174. [Google Scholar] [CrossRef]
  16. Koutsoyiannis, D. Stochastics of Hydroclimatic Extremes—A Cool Look at Risk; National Technical University of Athens: Athens, Greece, 2020; 330p, Available online: https://repository.kallipos.gr/handle/11419/6522?locale=en (accessed on 25 January 2022).
  17. Atkinson, A.B. Inequality; Harvard University Press: Cambridge, MA, USA, 2015. [Google Scholar]
  18. BP’s Statistical Review of World Energy. Available online: https://www.bp.com/en/global/corporate/energy-economics/statistical-review-of-world-energy.html (accessed on 25 January 2022).
  19. Sargentis, G.-F.; Dimitriadis, P.; Ioannidis, R.; Iliopoulou, T.; Frangedaki, E.; Koutsoyiannis, D. Optimal utilization of water resources for local communities in mainland Greece (case study of Karyes, Peloponnese). Procedia Manuf. 2020, 44, 253–260. [Google Scholar] [CrossRef]
  20. Mekonnen, M.M.; Hoekstra, A.Y. National Water Footprint Accounts: The Green, Blue and Grey Water Footprint of Production and Consumption; Value of Water Research Report Series No. 50; UNESCO-IHE: Delft, The Netherlands, 2011; Available online: https://www.researchgate.net/publication/254859488_National_water_footprint_accounts_The_green_blue_and_grey_water_footprint_of_production_and_consumption (accessed on 3 April 2022).
  21. WHO/UNICEF. Progress on Sanitation and Drinking Water: 2015 Update. 2015. Available online: https://data.world/adamhelsinger/unicef-drinking-water-database (accessed on 25 January 2022).
  22. Hoekstra, A.Y.; Mekonnen, M.M. The water footprint of humanity. Proc. Natl. Acad. Sci. USA 2012, 109, 3232–3237. [Google Scholar] [CrossRef] [Green Version]
  23. Water Footprint Network. National Water Footprint Statistics. Available online: https://waterfootprint.org/en/resources/waterstat/national-water-footprint-statistics/ (accessed on 25 January 2022).
  24. Rowlatt, J. Why Do We Value Gold? Available online: https://www.bbc.com/news/magazine-25255957 (accessed on 25 January 2022).
  25. Koutsoyiannis, D.; Mamassis, N. From mythology to science: The development of scientific hydrological concepts in Greek antiquity and its relevance to modern hydrology. Hydrol. Earth Syst. Sci. 2021, 25, 2419–2444. [Google Scholar] [CrossRef]
  26. Roller, L.E. The Legend of Midas. Class. Antiq. 1983, 2, 299–313. [Google Scholar] [CrossRef]
  27. Steinlauf, N.T. Review of Gold and Silver Coin Standards in the Roman Empire by Louis C. West. Class. Wkly. 1945, 38, 100–102. [Google Scholar] [CrossRef]
  28. Nussbaum, A. The Law of the Dollar. Colum. Law Rev. 1937, 37, 1057. [Google Scholar] [CrossRef]
  29. Gold Prices (Monthly in USD). Available online: https://datahub.io/AcckiyGerman/gold-prices (accessed on 25 January 2022).
  30. Historical Data: Silver (ozt)/U.S. Dollar 1:1 (XAGUSD). Available online: https://stooq.com/q/d/?s=xagusd (accessed on 25 January 2022).
  31. Ghizoni, S.K. Creation of the Bretton Woods System. Available online: https://www.federalreservehistory.org/essays/bretton-woods-created (accessed on 25 January 2022).
  32. Irwin, D. The Nixon shock after forty years: The import surcharge revisited. World Trade Rev. 2013, 12, 29–56. [Google Scholar] [CrossRef] [Green Version]
  33. Nixon and the End of the Bretton Woods System, 1971–1973. Available online: https://history.state.gov/milestones/1969-1976/nixon-shock (accessed on 25 January 2022).
  34. The, U.S.-Saudi Arabian Joint Commission on Economic Cooperation. Available online: https://www.gao.gov/products/id-79-7 (accessed on 25 January 2022).
  35. US Energy Information Administration (EIA). PETROLEUM & OTHER LIQUIDS. Spot Prices. Available online: https://www.eia.gov/dnav/pet/pet_pri_spt_s1_m.htm (accessed on 25 January 2022).
  36. van Wees, H. Mass and Elite in Solon’s Athens: The Property Classes Revisited. In Solon of Athens; Blok, J., Lardinois, A., Eds.; Brill: Leiden, The Netherlands, 2006. [Google Scholar] [CrossRef] [Green Version]
  37. Scheidel, W. Real Wages in Early Economies: Evidence for Living Standards from 1800 BCE to 1300 CE. J. Econ. Soc. Hist. Orient 2010, 53, 425–462. Available online: http://www.jstor.org/stable/20789801 (accessed on 25 January 2022). [CrossRef]
  38. Milanovic, B.; Lindert, P.H.; Williamson, J.G. Measuring Ancient Inequality; NBER Working Paper, No. 13550 October 2007 JEL No. D3,N3,O1; National Bureau of Economic Research: Cambridge, MA, USA, 2007. [Google Scholar] [CrossRef] [Green Version]
  39. Jursa, M. Aspects of the Economic History of Babylonia in the First Millennium BC; Ugarit-Verlag: Münster, Germany, 2010. [Google Scholar]
  40. Loomis, W.T. Wages, Welfare Costs, and Inflation in Classical Athens; University of Michigan Press: Ann Arbor, MI, USA, 1998. [Google Scholar]
  41. International Institute of Social History. Value of the Guilder versus Euro. A Comparison of the Purchasing Power of the Guilder from the Year 1450 to Another Year. Available online: https://iisg.amsterdam/en/research/projects/hpw/calculate.php#Europe (accessed on 25 January 2022).
  42. Milanovic, B. An Estimate of Average Income and Inequality in Byzantium Around Year 1000. Rev. Income Wealth 2006, 52, 449–470. [Google Scholar] [CrossRef]
  43. Van Zanden, J. Wages and the standard of living in Europe, 1500–1800. Eur. Rev. Econ. Hist. 1999, 3, 175–197. [Google Scholar] [CrossRef]
  44. Malanima, P. When did England overtake Italy? Medieval and early modern divergence in prices and wages. Eur. Rev. Econ. Hist. 2013, 17, 45–70. [Google Scholar] [CrossRef]
  45. Boyne, W. A Manual of Roman Coins: From the Earliest Period to the Extinction of the Empire; W.H. Johnston: London, UK, 1865; Available online: https://books.google.gr/books?id=ZqdPAAAAYAAJ (accessed on 25 January 2022).
  46. International Monetary Fund. IMF DATA Access to Macroeconomic and Financial Data. Available online: https://data.imf.org/ (accessed on 25 January 2022).
  47. Global Extreme Poverty. Available online: https://ourworldindata.org/extreme-poverty (accessed on 25 January 2022).
  48. Gapminder. Income Mountains. Available online: https://www.gapminder.org/fw/income-mountains/ (accessed on 25 January 2022).
  49. Tassios, T.P. Technology as a Possible Contributor to Ionian Rationality. In Proceedings of the Ex Ionia Scientia—‘Knowledge’ in Archaic Greece, International Conference at the National and Kapodistrian University of Athens, Athens, Greece, 11–14 December 2016; Available online: https://enlightenedionia.siu.edu/wp-content/uploads/2016/11/Tassios-essay.pdf (accessed on 25 January 2022).
  50. Mamassis, N.; Koutsoyiannis, D. Chapter 6: A Web Based Information System for the Inspection of the Hydraulic Works in Ancient Greece. In Ancient Water Technolgies; Mays, L.W., Ed.; Springer: Dordrecht, The Netherlands; Heidelberg, Germany; London, UK; New York, NY, USA, 2010. [Google Scholar] [CrossRef]
  51. Zarkadoulas, N.; Koutsoyiannis, D.; Mamassis, N.; Angelakis, A.N. A brief history of urban water management in ancient Greece. In Evolution of Water Supply through the Millenia; Angelakis, A., Mays, L.W., Eds.; IWA Publishing: London, UK, 2019. [Google Scholar]
  52. De Feo, G.; Angelakis, A.N.; Antoniou, G.P.; El-Gohary, F.; Haut, B.; Passchier, C.W.; Zheng, X.Y. Historical and Technical Notes on Aqueducts from Prehistoric to Medieval Times. Water 2013, 5, 1996–2025. [Google Scholar] [CrossRef] [Green Version]
  53. Krasilnikoff, J.; Angelakis, A.N. Water management and its judicial contexts in ancient Greece: A review from the earliest times to the Roman period. Water Policy 2019, 21, 245–258. [Google Scholar] [CrossRef]
  54. MacMullen, R. Roman Social Relations: 50 B.C. to A.D. 284; Yale University Press: London, UK, 1974. [Google Scholar]
  55. Leveau, P. Aqueduct Building: Financing and Costs. In Frontinus’ Legacy Essays on Frontinus’ de Aquis Urbis Romae; Blackman, D.R., Trevor Hodge, A., Eds.; The University of Michigan Press: Ann Arbor, MI, USA, 2001. [Google Scholar]
  56. Costs of an Aqueduct. Available online: http://www.romanaqueducts.info/technicalintro/costs.htm (accessed on 25 January 2022).
  57. Boatwright, M.T. Hadrian and the Cities of the Roman Empire; Princeton University Press: Princeton, NJ, USA, 2018. [Google Scholar]
  58. Christou, D. Water Supply Networks in Roman Period—The Case of Athens. Master Diploma Thesis, School of Civil Engineering, National Technical University of Athens, Athens, Greece, November 2020. [Google Scholar]
  59. Kritsotakis, D. Hadrian and the Greek East: Imperial Policy and Communication. Ph.D. Thesis, The Ohio State University, Columbus, OH, USA, 2008. Available online: https://etd.ohiolink.edu/apexprod/rws_etd/send_file/send?accession=osu1205903125&disposition=inline (accessed on 25 January 2022).
  60. Rogers, D. Roman Athens. In The Cambridge Companion to Ancient Athens Cambridge Companions to the Ancient World; Neils, J., Rogers, D., Eds.; Cambridge University Press: Cambridge, UK, 2021; pp. 421–436. [Google Scholar] [CrossRef]
  61. Sargentis, G.-F.; Ioannidis, R.; Karakatsanis, G.; Sigourou, S.; Lagaros, N.D.; Koutsoyiannis, D. The Development of the Athens Water Supply System and Inferences for Optimizing the Scale of Water Infrastructures. Sustainability 2019, 11, 2657. [Google Scholar] [CrossRef] [Green Version]
  62. Hadrian. Available online: https://en.wikipedia.org/wiki/Hadrian (accessed on 25 January 2022).
  63. Hopkins, K. Conquerors and Slaves; Cambridge University Press: Cambridge, UK, 1978. [Google Scholar]
  64. Ando, C. The Administration of the Provinces. In The Roman Empire; Potter, D.S., Ed.; Blackwell Publishing: Oxford, UK, 2006. [Google Scholar]
  65. Wittfogel, K. Oriental Despotism: A Comparative Study of Total Power; Random House: New York, NY, USA, 1957; ISBN 978-0-394-74701-9. [Google Scholar]
  66. Christaki, M.; Stouornaras, G.; Nastos, P.; Mamassis, N. The Majestic Hadrianic Aqueduct of the City of Athens. Glob. NEST J. 2016, 18, 559–568. [Google Scholar] [CrossRef]
  67. Chiotis, E.D. The Hadrianic aqueduct of Athens and the underlying tradition of hydraulic engineering. In Great Waterworks in Roman Greece; Aristodemou, G.A., Tassios, T.P., Eds.; Archeopress: Oxford, UK, 2018. [Google Scholar]
  68. Tsiouri, C. Hydraulic Investigation of the Adrian Aqueduct. Master Diploma Thesis, Department of Water Resources and Environment, Shool of Civil Engineering, National Technical University of Athens, Athens, Greece, October 2018. Available online: https://www.itia.ntua.gr/el/docinfo/1913/ (accessed on 25 January 2022).
  69. Koutsoyiannis, D. Water Technology and Management in Ancient Greece: Legacies and Lessons; National Technical University of Athens: Athens, Greece, 20 January 2007; 28p. [Google Scholar] [CrossRef]
  70. Koutsoyiannis, D.; Mamassis, N. The water supply of Athens through the centuries. In Proceedings of the 16th Conference Cura Aquarum, Athens, German Water History Association, German Archaeological Institute in Athens, Athens, Greece, 15–16 July 2015. [Google Scholar] [CrossRef]
  71. Google Earth Pro; Version 7.3.3.7786; National Oceanic and Atmospheric Administration: Washington, DC, USA, 2021.
  72. Koutsoyiannis, D. Past and modern water problems: Progress or regression? (Invited). In Proceedings of the IWA Regional Symposium on Water, Wastewater & Environment: Traditions & Culture, International Water Association, Patras, Greece, 22–24 March 2014. [Google Scholar] [CrossRef]
  73. Koutsoyiannis, D.; Angelakis, A.N. Agricultural Hydraulic Works in Ancient Greece, Encyclopedia of Water Science, 2nd ed.; Trimble, S.W., Ed.; CRC Press Taylor & Francis Group: London, UK; New York, NJ, USA, 2007; pp. 24–27. [Google Scholar] [CrossRef]
  74. Zanakis, S.H.; Theofanides, S.; Kontaratos, A.N.; Tassios, T.P. Ancient Greeks’ Practices and Contributions in Public and Entrepreneurship Decision Making. Interfaces 2003, 33, 72–88. [Google Scholar] [CrossRef]
  75. Angelakis, A.N.; Koutsoyiannis, D. Urban water engineering and management in ancient Greece. In Encyclopedia of Water Science; Stewart, B.A., Howell, T., Eds.; Dekker: New York, NY, USA, 2003; pp. 999–1007. [Google Scholar] [CrossRef]
  76. Koutsoyiannis, D.; Patrikiou, A. Water control in Ancient Greek cities. In A History of Water: Water and Urbanization; Tvedt, T., Oestigaard, T., Eds.; I.B. Tauris: London, UK, 2014; pp. 130–148. [Google Scholar]
  77. Koutsoyiannis, D.; Angelakis, A.N. Hydrologic and hydraulic science and technology in ancient Greece. In Encyclopedia of Water Science; Stewart, B.A., Howell, T., Eds.; Dekker: New York, NY, USA, 2003; pp. 415–417. [Google Scholar] [CrossRef]
  78. Angelakis, A.N.; Spyridakis, D.S. A brief history of water supply and wastewater management in ancient Greece. Water Supply 2010, 10, 618–628. [Google Scholar] [CrossRef]
  79. Dakoura-Voyatzoglou, O. Myriad Water Voices …The Water That Unites Us; Ministry of Culture and Tourism, Environment and Culture: Athens, Greece, 7–10 October 2010.
  80. Jones, J.E. (R.) Tölle-Kastenbein Das archaische Wasserleitungsnetz für Athen. Mainz: Zabern, 1994. Pp. iv 120 ill. DM 39.80. J. Hell. Stud. 1996, 116, 226–227. [Google Scholar] [CrossRef]
  81. Tassios, T.P. From Pisistrateion to Euinos. The water supply of Athens. Available online: https://e-archimedes.gr/latest/item/6341 (accessed on 1 April 2022).
  82. Ziller, E. Untersuchungen über die Antiken Wasserleitungen Athens. Mitteilungen Des Deutschen Archäologischen Instituts; Athenische Abteilung: Athina, Greece, 1877; Volume 2, pp. 107–131. [Google Scholar]
  83. Christaki, M.; Stournaras, G.; Nastos, P.T.; Mamassis, N. Water supply associated with the development of the city of Athens from the end of the nineteenth century until the present. Water Hist. 2017, 9, 411–431. [Google Scholar] [CrossRef]
  84. Nestoridi, E. Hadrianic Aqueduct: Links from the past in the future and redefinition of its utilitarian role. In Proceedings of the World Water Day, Eydap Workshop, Zappio Megaro, Athina, Greece, 22 March 2012; Available online: https://www.eydap.gr/userfiles/Attachments/2012/Imerida_Programma_2012.pdf (accessed on 25 January 2022).
  85. Hanson, J.W.; Ortman, S.G.; Lobo, J. Urbanism and the division of labour in the Roman Empire. J. R. Soc. Interface 2017, 14, 20170367. [Google Scholar] [CrossRef]
  86. Buchan, J.M. The division of labor in the economy, the polity, and society. In The Return to Increasing Returns; Buchanan, J.M., Yoon, Y.J., Eds.; The University of Michigan Press: Ann Arbor, MI, USA, 1994; Available online: https://books.google.gr/books?hl=en&lr=&id=d4yFu-yVn1AC&oi=fnd&pg=PA3&ots=z46SXomMXl&sig= (accessed on 25 January 2022).
  87. Smith, A. The Wealth of Nations; W. Strahan and T. Cadell: London, UK, 1776. [Google Scholar]
  88. Morgan, K. The Dynamics of Smithian Growth. Q. J. Econ. 1997, 112, 939–964. [Google Scholar] [CrossRef]
  89. Durkheim, E. The Division of Labor in Society; The Free Press: New York, NY, USA, 1984. [Google Scholar]
  90. Henrich, J. Demography and cultural evolution: How adaptive cultural processes can produce maladaptive losses—The Tasmanian case. Am. Antiq. 2004, 69, 197–214. [Google Scholar] [CrossRef] [Green Version]
  91. Kline, M.A.; Boyd, R. Population size predicts technological complexity in Oceania. Proc. R. Soc. B Boil. Sci. 2010, 277, 2559–2564. [Google Scholar] [CrossRef] [Green Version]
  92. Roman Daily Life. World History, Encyclopedia. Available online: https://www.worldhistory.org/article/637/roman-daily-life/# (accessed on 25 January 2022).
  93. Aldrete, G.S. Daily Life in the Roman City: Rome, Pompeii and Ostia; Greenwood Publishing Group: London, UK, 2004. [Google Scholar]
  94. Potter, D.S.; Mattingly, D.J. Life, Death, and Entertainment in the Roman Empire; University of Michigan Press: Ann Arbor, MI, USA, 1999. [Google Scholar]
  95. Joshel, S. Work, Identity, and Legal Status at Rome, a Study of the Occupational Inscriptions; University of Oklahoma Press: London, UK, 1992. [Google Scholar]
  96. Tassios, T.P. Submerged Ancient Greek Technology. In Proceedings of the 4th Biennial of Architectural and Urban Restoration, Nikosia, Cyprus; Catania, Italy; Tunis, Tunis; Athens, Greece; Piraeus, Greece; Rethymno, Greece; Alexandria, Egypt, 15–30 April 2018; Available online: https://books.google.gr/books?hl=en&lr=&id=J0mQDwAAQBAJ&oi=fnd&pg=PA3&dq#v (accessed on 25 January 2022).
  97. Konofagos, K. The Ancient Laurio (Το αρχαίο Λαύριο); National Technical University of Athens: Athens, Greece, 1980. [Google Scholar]
  98. Jones, J.E. The Laurion Silver Mines: A Review of Recent Researches and Results. Greece Rome 1982, 29, 169–183. Available online: http://www.jstor.org/stable/642341 (accessed on 25 January 2022). [CrossRef]
  99. Morin, D.; Rosenthal, P.; Photiades, A.; Delpech, S.; Jacquemot, D. Aegean mining technologies in Antiquity: A traceological approach: The Laurion mines (Greece). In Metallurgy in Numismatics 6 Mines, Metals, and Money Ancient World Studies in Science, Archaeology and History; Sheedy, K.A., Davis, G., Eds.; Australian Centre for Ancient Numismatic Studies, Macquarie University, The Royal Numismatic Society, Special Publication No. 56: London, UK, 2021; Available online: https://hal.archives-ouvertes.fr/hal-02943726 (accessed on 25 January 2022).
  100. Ardaillon, E. Les Mines du Laurion Dans L’Antiquité; Bibliothèque Des Ecoles Françaises D’Athènes ET de Rome, Fasc. 77: Paris, France, 1897. [Google Scholar]
  101. Mamassis, N.; Moustakas, S.; Zarkadoulas, N. Representing the operation of ancient reclamation works at Lake Copais in Greece. Water Hist. 2015, 7, 271–287. [Google Scholar] [CrossRef]
  102. Leigh, S. The Aqueduct of Hadrian and the Water Supply of Roman Athens. Ph.D. Thesis, University of Pennsylvania, Philadelphia, PA, USA, 1998; pp. 116–117. [Google Scholar]
  103. Scheidel, W. New Ways of Studying Incomes in the Roman Economy; Stanford University: Stanford, CA, USA, 2006; Available online: https://www.princeton.edu/~pswpc/pdfs/scheidel/110604.pdf (accessed on 25 January 2022).
  104. Scheidel, W. Roman Real Wages in Context. (23 August 2010). Available online: https://papers.ssrn.com/sol3/papers.cfm?abstract_id=1663559 (accessed on 27 February 2022).
  105. West, L.C. The Cost of Living in Roman Egypt. Class. Philol. 1916, 11, 293–314. Available online: http://www.jstor.org/stable/261854 (accessed on 25 January 2022). [CrossRef]
  106. Van Heesch, J. Some Aspects of Wage Payments and Coinage in Ancient Rome, First to Third Centuries CE; Lang: Bristol, UK, 2007. [Google Scholar]
  107. Jones, J.R.M. Denarii, asses and assaria in the early roman empire. Bull. Inst. Class. Stud. 1971, 18, 99–105. Available online: http://www.jstor.org/stable/43646279 (accessed on 25 January 2022). [CrossRef]
  108. Rickman, G.E. The Grain Trade under the Roman Empire. Mem. Am. Acad. Rome 1980, 36, 261–275. [Google Scholar] [CrossRef]
  109. Smith, D.C.L. LL.D.: A Dictionary of Greek and Roman Antiquities; John Murray: London, UK, 1875; Available online: https://penelope.uchicago.edu/Thayer/E/Roman/Texts/secondary/SMIGRA*/Artaba.html# (accessed on 25 January 2022).
  110. Williams, T.B. Good Works in 1 Peter; Mohr Siebeck: Tubingen, Germany, 2014. [Google Scholar]
  111. Cavaignac, M.A. Population et capital dans le monde méditerranéen antique (publications de la Faculté des lettres de l’Université de Strasbourg, fasc. 18). J. Des Savants 1925, 5, 223–227. Available online: www.persee.fr/doc/jds_0021-8103_1925_num_23_5_5604_t1_0223_0000_3 (accessed on 25 January 2022).
  112. Allen, R.C. How Prosperous Were the Romans? Evidence from Diocletian’s Price Edict (AD 301); Oxford University Press (OUP): Oxford, UK, 2009; pp. 327–345. [Google Scholar]
  113. Harper, K. The Fate of Rome: Climate, Disease, and the End of an Empire; Princeton University Press: Princeton, NJ, USA, 2017. [Google Scholar] [CrossRef]
  114. Harper, K. People, Plagues, and Prices in the Roman World: The Evidence from Egypt. J. Econ. Hist. 2016, 76, 803–839. [Google Scholar] [CrossRef]
  115. Jongman, W.M.; Jacobs, J.P.; Goldewijk, G.M.K. Health and wealth in the Roman Empire. Econ. Hum. Biol. 2019, 34, 138–150. [Google Scholar] [CrossRef]
  116. Jongman, W. Re-Constructing the Roman Economy; Neal, L., Williamson, J., Eds.; The Cambridge History of Capitalism; Cambridge University Press: Cambridge, UK, 2014; Volume 1, pp. 75–100. [Google Scholar]
  117. Jongman, W. Quantifying the Roman Economy. Methods and Problems. In Archaeology, Demography and Roman Economic Growth; Bowman, A., Wilson, A.I., Eds.; Oxford University Press: Oxford, UK, 2009; pp. 115–126. [Google Scholar]
  118. Johnson, A.C. An Economic Survey of Ancient Rome. In Roman Egypt to the Reign of Diocletian; Frank, T., Ed.; Johns Hopkins Press: Baltimore, MD, USA, 1936; Volume II. [Google Scholar]
  119. Kessler, D.; Temin, P. Money and Prices in the Early Roman Empire, Working Paper 05-11, 14 April 2005, Cambridge 2005. Available online: https://dspace.mit.edu/bitstream/handle/1721.1/63816/moneypricesinear00kess.pdf (accessed on 25 January 2022).
  120. Harl, K.W. Coinage in the Roman Economy, 300 BC to AD 700; John Hopkins University Press: Baltimore, MD, USA, 1996. [Google Scholar]
  121. Duncan-Jones, R. Economy of the Roman Empire; Cambridge University Press: London, UK, 1982. [Google Scholar]
  122. Vagi, D. Coinage and History of the Roman Empire; Routledge: New York, NY, USA, 2016. [Google Scholar]
  123. Butcher, K.; Ponting, M. The Beginning of the End? The Denarius in the Second Century. Numis. Chron. (1966-) 2012, 172, 63–83. Available online: http://www.jstor.org/stable/42678930 (accessed on 25 January 2022).
  124. Greek Law 4046/2012, 6/28-2-2012 and Interpretative Circular 4601/304/12-3-2012. Available online: http://epixeirisi.gr/download.php?filepath=files/2012/pdf/egkyeka/&filename=egkyeka_4601_304_12_3_2012&filetype=pdf (accessed on 25 January 2022).
  125. Increase of the Minimum Wage and Daily Wage. 26 July 2021. Hellenic Ministry of Labour and Social Affairs. Available online: https://ypergasias.gov.gr/afxisi-tou-katotatou-misthou-kai-imeromisthiou-kata-2-apo-1is-ianouariou-2022/ (accessed on 25 January 2022).
  126. Prices of Wheat in Greece. Available online: https://www.agronews.gr/ekmetaleuseis/sitira-kai-sporoi/196546/ligo-hamilotera-se-timi-i-agora-tis-tunisias/ (accessed on 25 January 2022).
  127. Mays, L.W. Chapter 11 Lessons from the Ancients on Water Resources Sustainability. In Ancient Water Technologies; Mays, L.W., Ed.; Springer: Dordrecht, The Netherlands; Heidelberg, Germany; London, UK; New York, NY, USA, 2010. [Google Scholar] [CrossRef]
  128. Plutarch, Solon, 23. Translation by John Dryden. Available online: http://classics.mit.edu/Plutarch/solon.html (accessed on 25 January 2022).
  129. Frontinus, S.I. De Aquaeductu Urbis Romae, on the Water Management of the City of Rome; Rodgers, R.H., Translator; The University of Vermont: Burlington, VT, USA, 2003; Available online: http://www.uvm.edu/~rrodgers/Frontinus.html (accessed on 25 January 2022).
  130. Sargentis, G.-F.; Iliopoulou, T.; Sigourou, S.; Dimitriadis, P.; Koutsoyiannis, D. Evolution of Clustering Quantified by a Stochastic Method—Case Studies on Natural and Human Social Structures. Sustainability 2020, 12, 7972. [Google Scholar] [CrossRef]
  131. Frankfort, H. Town planning in ancient mesopotamia. Town Plan. Rev. 1950, 21, 99. Available online: https://www.proquest.com/scholarly-journals/town-planning-ancient-mesopotamia/docview/1302132583/se-2?accountid=28925 (accessed on 25 January 2022). [CrossRef]
  132. Diodorus Siculus (17.52.6). Sextus Julius Frontinus. Available online: https://penelope.uchicago.edu/Thayer/E/Roman/Texts/Diodorus_Siculus/17C*.html (accessed on 25 January 2022).
  133. Goubert Pierre. Roger Mols, Démographie historique des villes d’Europe, du XIVe au XVIIIe siècle. Annales 1959, 14, 373–377. Available online: www.persee.fr/doc/ahess_0395-2649_1959_num_14_2_2837_t1_0373_0000_3 (accessed on 25 January 2022).
  134. Russell, J.C. Late Ancient and Medieval Population. Trans. Am. Philos. Soc. 1958, 48, 1–152. [Google Scholar] [CrossRef]
  135. Mamassis, N.; Chrysoulaki, S.; Bendermacher-Geroussis, E.; Evangelou, T.; Koutis, P.; Peppas, G.; Defteraios, P.; Zarkadoulas, N.; Koutsoyiannis, D.; Griva, E. Representing the operation and evolution of ancient Piraeus’ water supply system. Water History, 2022; under publication. [Google Scholar]
  136. Hanson, J.W.; Ortman, S.G. A systematic method for estimating the populations of Greek and Roman settlements. J. Rom. Archaeol. 2017, 30, 301–324. [Google Scholar] [CrossRef]
  137. Morris, A.E.J. History of Urban Form before the Industrial Revolution; Routledge: London, UK, 2013. [Google Scholar] [CrossRef]
  138. Hin, S. Revisiting Urban Graveyard Theory: Migrant Flows in Hellenistic and Roman Athens. In Migration and Mobility in the Early Roman Empire; Brill: Leiden, The Netherlands, 2016. [Google Scholar] [CrossRef] [Green Version]
  139. Russell, C.; Russell, W.M.S. Population crises and population cycles. Med. Confl. Surviv. 2000, 16, 383–410. [Google Scholar] [CrossRef] [PubMed]
  140. Historical Map of Athens, Superimposed on a Plan of the Modern City. Approximate Date of the Map: 200 A.D. Credits: University of Texas at Austin. Historical Atlas by William Shepherd (1923-26). Available online: http://www.emersonkent.com/map_archive/athens_200_ad.htm (accessed on 25 January 2022).
  141. Lewis, M.J.T. Surveying Instruments of Greece and Rome; Cambridge University Press: Cambridge, UK, 2001. Available online: http://catdir.loc.gov/catdir/samples/cam031/00034262.pdf (accessed on 25 January 2022).
  142. Greek and Roman Surveying and Surveying Instruments. Available online: https://erenow.net/ancient/ancient-perspectives/6.php (accessed on 25 January 2022).
  143. Hoşbaş, R.G.; Pirti, A.; Ata, E. Used the geodetic measuring instruments: The creation of Roman civilization. In Proceedings of the FIG Congress 2018 Embracing Our Smart World Where the Continents Connect: Enhancing the Geospatial Maturity of Societies, Istanbul, Turkey, 6–11 May 2018; Available online: https://www.researchgate.net/publication/341277986_USED_THE_GEODETIC_MEASURING_INSTRUMENTS_THE_CREATION_OF_ROMAN_CIVILIZATION (accessed on 25 January 2022).
  144. Seth, B. Building Mid-Republican Rome; Oxford University Press: Oxford, UK, 2018. [Google Scholar]
Figure 1. Life expectancy related to GDP per capita per year [6]; global average (1870–2011) and 172 countries’ average data (2016) [7] and UK data (1600–2013) [8].
World 03 00014 g001
Figure 2. Life expectancy related to daily caloric supply; global average (1965–2011) and 172 countries’ average data (2016) [11] and UK data (1600–2013) [6,8].
World 03 00014 g002
Figure 3. Life expectancy related to annual energy consumption per capita; global average (1965–2011) and 172 counties’ average data (2016) [6,18].
World 03 00014 g003
Figure 4. Life expectancy related to access to drinking water [21], and the annual water footprint of the consumption of domestic blue water per capita (1996–2005) [6,22,23].
World 03 00014 g004
Figure 5. (a) Values of gold [29]. (b) Values of silver [30]. (c) Gold-to-Silver ratio.
World 03 00014 g005
Figure 6. (a) Values of gold, silver and oil; (b) ratios of gold, silver and oil [35].
World 03 00014 g006
Figure 7. Average wheat wages of unskilled laborers in preindustrial societies.
World 03 00014 g007
Figure 8. (a) Values of gold, silver, oil and wheat, (b) Gold to wheat ratio, silver to wheat ratio, oil to wheat ratio [29,30,46].
World 03 00014 g008
Figure 9. Average wheat wages (2016) related to the average wheat wage of an unskilled laborer in antiquity. Data are presented as an order of magnitude.
World 03 00014 g009
Figure 10. (a) Hadrian January 76–10 July 138 AD. (b) Arch of Hadrian in Jerash, Transjordan, built to honor Hadrian’s visit in 130 [62].
World 03 00014 g010
Figure 11. (a) Location of Greece. (b) Location of Athens.
World 03 00014 g011
Figure 12. The function of the aqueduct.
World 03 00014 g012
Figure 17. (a) Tunnel of the so-called Peisistratean (Hymettus) aqueduct. (b) Well of the so-called Peisistratean (Hymettus) aqueduct.
World 03 00014 g017
Figure 18. (a) Tunnel of the Hadrianic aqueduct. (b) Well of the Hadrianic aqueduct.
World 03 00014 g018
Figure 19. The continuous worker.
World 03 00014 g019
Figure 20. The modules of the aqueduct.
World 03 00014 g020
Figure 21. Well digging.
World 03 00014 g021
Figure 22. Well coating.
World 03 00014 g022
Figure 23. Tunnel digging.
World 03 00014 g023
Figure 24. Tunnel coating.
World 03 00014 g024
Figure 25. Linear construction, where the aqueduct is under the groundwater horizon.
World 03 00014 g025
Figure 26. Indicative Gant chart of the duration of a module.
World 03 00014 g026
Figure 28. Silver weight in one denarius during the 1st and beginnings of the 2nd century AD. The period of Galba, Otho and Aulus Vitellius is depicted with green.
World 03 00014 g028
Figure 29. Athens in the Roman era. Data adapted by [140] to Google Earth [71].
World 03 00014 g029
Figure 30. Footprint of the annual consumption of domestic water per capita (1996–2005) [22,23].
World 03 00014 g030
Table 1. Technical characteristics of the so-called Peisistratean (Hymettus) and Hadrianic aqueducts.
The So-Called Peisistratean (Hymettus) Hadrianic
Construction period6th–4th century BC2nd century AD
Type of functionDraining tunnelDraining tunnel
Beginning of water supplyFed from Hymettus springs and lateral aqueductsFed from Parnitha springs and lateral aqueducts
Length8 km20 km
Maximum depth14 m41 m
OperationSustainable operation (irrigation of National Garden 1875–present)Sustainable operation (Modern Athens water supply 1870–1976)
Publisher’s Note: MDPI stays neutral with regard to jurisdictional claims in published maps and institutional affiliations.

