
Respiratory Syncytial Virus, Influenza and SARS-CoV-2 in Homeless People from Urban Shelters: A Systematic Review and Meta-Analysis (2023)

 ,
,  ,
,  and
and
Abstract
:1. Introduction
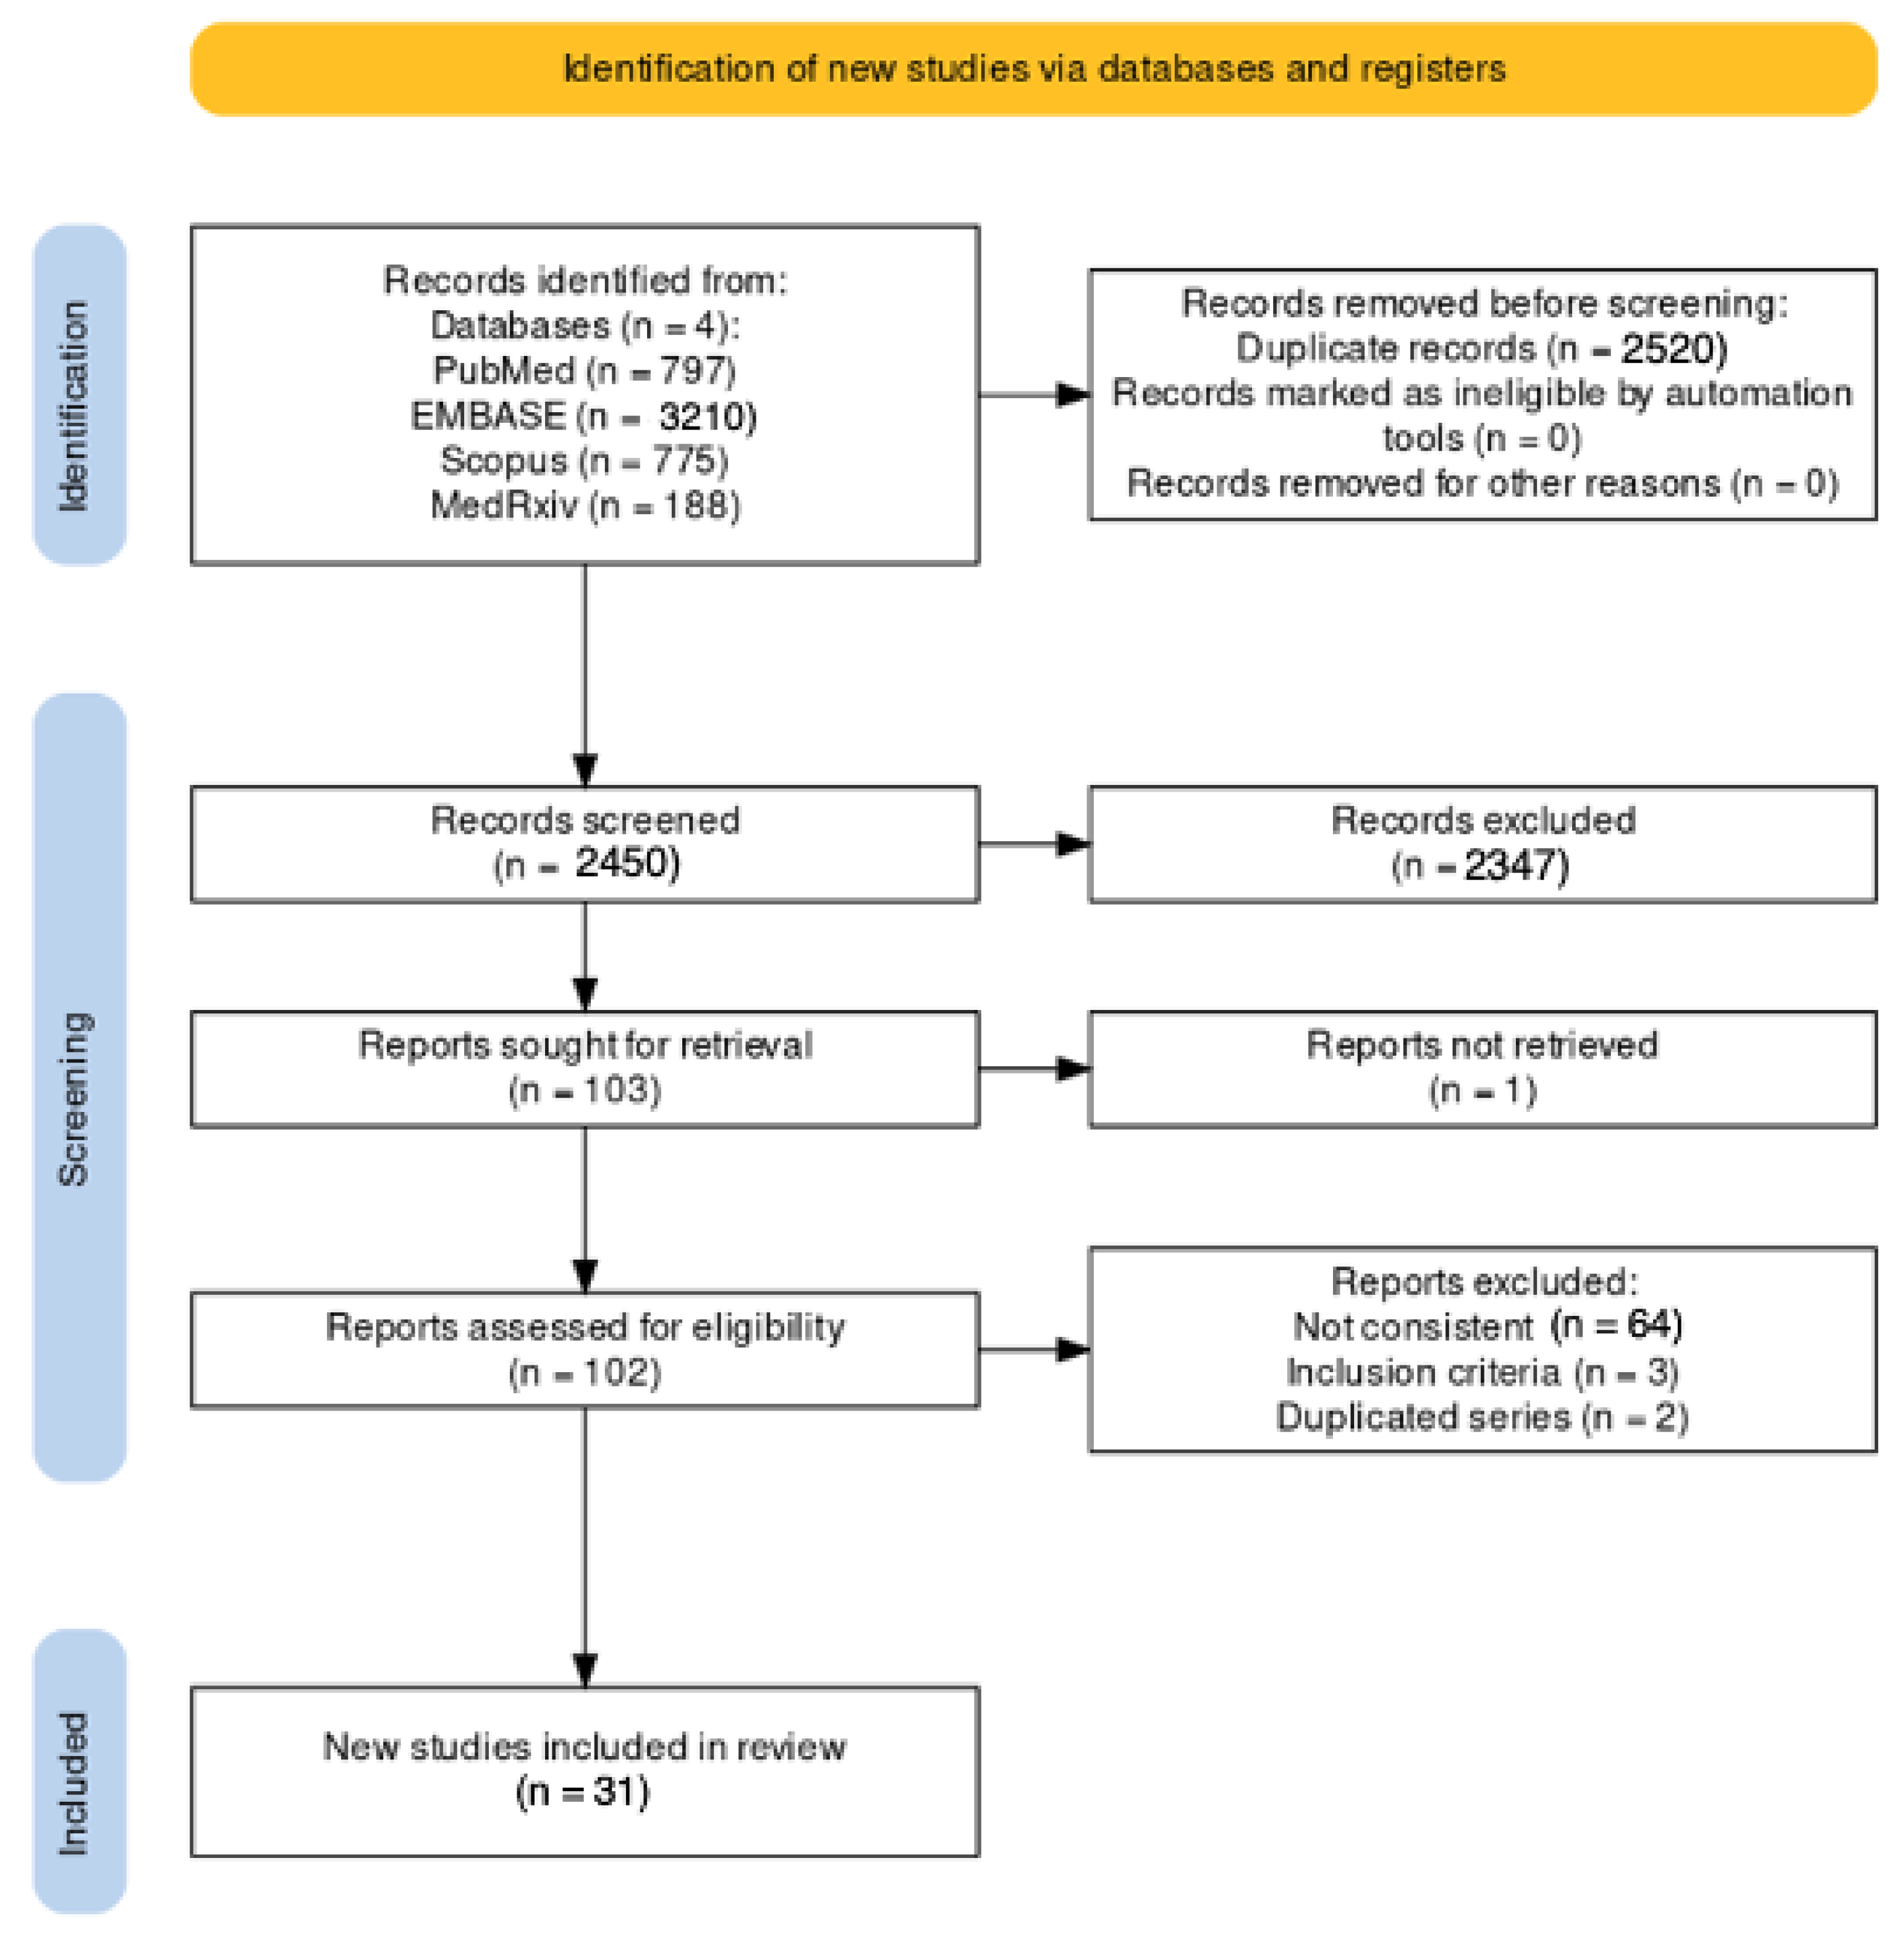
2. Materials and Methods
2.1. Research Concept
2.2. Research Strategy
2.3. Screening
- (1)
- The full text was not available either through online repositories or through inter-library loan or its main text was written in a language other than English, Italian, German, French, Spanish, Portuguese or Farsi;
- (2)
- The study was designed as a case report, a case series, or a review/systematic review;
- (3)
- The study did not mention the geographical setting or corresponding timeframe;
- (4)
- There was a lack of detailed reporting of the sampling approach, including the respective inclusion/exclusion criteria for the collection of samples from potentially participating HP;
- (5)
- Studies carried out in refugee camps and shelters: we deliberately ruled out this specific subgroup of HP because of the presumptively high proportion of female individuals, children and adolescents compared to those usually reported by urban shelters [9];
- (6)
- The total number of sampled HP was not provided;
- (7)
- The laboratory diagnosis of respiratory infections was performed using methods other than RT-qPCR (e.g., clinical features, imaging, seroprevalence studies, etc.).
2.4. Summary of Retrieved Data
- (a)
- The settings of the study: country, region, timeframe of the study and/or observation period(s);
- (b)
- The number of HP potentially included in the estimate(s);
- (c)
- Where available, demographic data and characteristics of the sampled HP (i.e., age, gender, abuse of alcohol, smoking history, abuse of intravenous (IV) drugs, abuse of cannabis);
- (d)
- The number of collected samples (total);
- (e)
- The number of samples with a positive RT-qPCR diagnosis for RSV, influenza and SARS-CoV-2.
2.5. Risk of Bias Analysis
2.6. Data Analysis
3. Results
3.1. Descriptive Analysis
3.2. Characteristics of Prevalence Studies

| Study | Country | Timeframe | Potential Sample (N.) | Total Sample (n./N., %) | Age (Years) | Males (n., %) | FB People (n.,%) | Smoking History (n., %) | Alcohol Consumption (n., %) | Abuse of Cannabis (n.,%) | Abuse of IV Drugs (n.,%) | Sampled Respiratory Viruses |
|---|---|---|---|---|---|---|---|---|---|---|---|---|
| Badiaga et al., 2009 [17] | France (Marseille) | 1 February 2005 3 February 2005 | 540 | 221 (40.92%) | Median: 41 Range: 7 to 76 | 208 (94.11%) | 139 (62.90%) | 169 (76.47%) | 77 (34.84%) | 45 (20.36%) | 4 (1.81%) | RSV, Flu |
| Thiberville et al., 2014 [18] | France (Marseille) | 1 February 2010–4 February 2010 | 540 | 108 (21.60%) | Mean: 48.8 SD: 17.4 | 95 (87.96%) | NA | 67 (62.04%) | 24 (22.22%) | 16 (14.81%) | 1 (0.93%) | RSV, Flu |
| 1 February 2011–3 February 2011 | 540 | 157 (29.07%) | Mean: 46.7 SD: 16.8 | 142 (90.44%) | NA | 90 (57.32%) | 32 (20.38%) | 28 (17.83%) | 5 (3.18%) | |||
| Ly et al.,2019 [4] | France (Marseille) | 17 February 2015 | 600 | 125 (20.83%) | Mean: 43.5 SD: 16.0 | 479 (100%) | 408 (85.18%) | 293 (61.17%) | 52 (10.86%) | 75 (15.66%) | 2 (0.42%) | RSV, Flu |
| 7 February 2016–10 March 2016 | 600 | 156 (26.00%) | ||||||||||
| 6 February 2017–8 February 2017 | 600 | 198 (33.00%) | ||||||||||
| Baggett et al., 2020 [108] | USA (Boston, MS) | 2 April 2020– 3 April 2020 | 430 | 408 (94.88%) | Mean: 51.6 SD: 12.8 | 292 (67.91%) | NA | NA | NA | NA | NA | SARS-CoV-2 |
| Imbert et al., 2020 [107] | USA (San Francisco, CA) | 8 April 2020–9 April 2020 | 255 | 150 (58.82%) | NA | NA | NA | NA | NA | NA | NA | SARS-CoV-2 |
| Karb et al., 2020 [106] | USA (Providence, RI) | 19 April 2020–24 April 2020 | 302 | 299 (99.01%) | Mean: 47.9 Range: 18 to 85 | 249 (83.28%) | NA | NA | NA | NA | NA | SARS-CoV-2 |
| Mosites et al., 2020 [105] | USA (Seattle, WA) | 30 March 2020–8 April 2020 27 March 2020–15 April 2020 | NA | 392 | NA | NA | NA | NA | NA | NA | NA | SARS-CoV-2 |
| USA (San Francisco, CA) | 4 April 2020–15 April 2020 | 255 | 143 (56.08%) | NA | NA | NA | NA | NA | NA | NA | ||
| USA (Atlanta, GE) | 8 April 2020–9 April 2020 | NA | 249 | NA | NA | NA | NA | NA | NA | NA | ||
| Storgaard et al., 2020 [104] | Denmark (Aarhus) | 1 April 2020–30 April 2020 | 295 | 295 (100%) | Median: 50 95%CI: 38 to 59 | 116 (39.32%) | NA | NA | NA | NA | NA | SARS-CoV-2 |
| 1 June 2020–30 June 2020 | 141 | 141 (100%) | Median: 53 95%CI: 42 to 61 | 57 (40.43%) | NA | NA | NA | NA | NA | |||
| Husain et al., 2021 [98] | France (Paris) | 1 March 2020–31 May 2020 | 137 | 100 (72.99%) | Median: 54 IQR: 37 to 64 | 65 (65.00%) | NA | 35 (35.00%) | 28 (28.00%) | NA | 6 (6.00%) | SARS-CoV-2 |
| Kiran et al., 2021 [42] | Canada (Toronto, ON) | 23 April 2020–1 June 2020 | 872 | 504 (57.80%) | Mean: 45.8 SD: 16.3 | 713 (81.77%) | NA | NA | NA | NA | NA | SARS-CoV-2 |
| 9 June 2020–23 July 2020 | 872 | 496 (56.88%) | ||||||||||
| Ly et al., 2021 [5] | France (Marseille) | 31 March 2020–6 April 2020 | 283 | 126 (44.52%) | Mean: 46.2 SD: 16.0 | 126 (100%) | 94 (74.60%) | NA | NA | NA | NA | RSV, Flu, SARS-CoV-2 |
| 22 April 2020–23 April 2020 | 283 | 111 (39.22%) | Mean: 48.5 SD: 15.5 | 111 (100%) | 78 (70.27%) | NA | NA | NA | NA | |||
| 16 July 2020 | 283 | 71 (25.09%) | Mean: 46.6 SD: 16.9 | 71 (100%) | 52 (73.23%) | NA | NA | NA | NA | |||
| Ly et al., 2021 [6] | France (Marseille) | 26 March 2020–17 April 2020 | 716 | 411 (57.40%) | Mean: 40.4 SD: 15.6 | 369 (89.78%) | 312 (75.91%) | NA | NA | NA | NA | SARS-CoV-2 |
| Oette et al., 2021 [100] | Germany (Köln) | 1 May 2021–31 May 2021 | NA | 130 | >40 y.o. = 87 (66.92%) | 118 (90.77%) | 66 (50.77%) | NA | NA | NA | NA | SARS-CoV-2 |
| Roland et al., 2021 [103] | Belgium (Brussels) | 27 April 2020–10 June 2020 | 1994 | 1985 (99.55%) | Mean: 41.9 SD: 14.3 | 1345 (67.76%) | NA | NA | NA | NA | NA | SARS-CoV-2 |
| Oette et al., 2022 [99] | Germany (Düsseldorf) | 7 May 2021–16 May 2021 | 303 | 129 (42.57%) | >40 y.o. = 213 (70.20%) | 268 (88.45%) | 150 (49.50%) | NA | NA | NA | NA | RSV, SARS-CoV-2 |
| 25 August 2021–18 September 2021 | 303 | 143 (47.19%) | ||||||||||
| 11 December 2021–20 December 2021 | 303 | 83 (27.39%) | ||||||||||
| Rowan et al., 2022 [102] | USA (Denver, CO) | 2 June 2020–28 July 2020 | NA | 871 | Median: 46 IQR: 36 to 55 | 716 (82.3%) | NA | NA | NA | NA | NA | SARS-CoV-2 |
| Generaal et al., 2023 [101] | The Netherlands (Amsterdam) | 3 May 2021–21 May 2021 | 138 | 138 (100%) | Median: 44 Range: 37 to 51 | 126 (91.30%) | 127 (92.03%) | NA | 83 (60.14%) | 81 (58.70%) | 7 (5.07%) | SARS-CoV-2 |
| Study | Country | Timeframe | Potential Sample (N.) | Total Sample (N./, %) | Age (Years) | Males (N., %) | FB People (N.,%) | Smoking History (N., %) | Alcohol Consumption (N., %) | Abuse of Cannabis (N.,%) | Abuse of IV Drugs (N.,%) | Total Tests (N.) | Sampled Respiratory Viruses |
|---|---|---|---|---|---|---|---|---|---|---|---|---|---|
| Ralli et al., 2021 [109] | Italy (Rome) | 1 October 2020–5 June 2021 | 1665 | 1052 (63.18%) | NA | 509 (48.38%) | NA | NA | NA | NA | NA | 1052 | SARS-CoV-2 |
| Lindner et al., 2021 [111] | Germany (Berlin) | 9 July 2020–29 July 2020 | 124 | 93 (75.0%) | Median: 47 IQR: 34 to 54 | 74 (79.57%) | NA | NA | NA | NA | NA | 118 | SARS-CoV-2 |
| Richard et al., 2021 [112] | Canada (Toronto, ON) | 1 June 2021–30 April 2022 | 2643 | 415 (15.70%) | Mean: 46.6 SD: 14.5 | 272 (65.54%) | 169 (40.72%) | 287 (69.19%) | 264 (63.61%) | NA | 158 (21.91%) | 721 | SARS-CoV-2 |
| Berner et al., 2022 [113] | USA (Nationwide) | 1 March 2020–30 November 2020 | NA | 11,563 | NA | NA | NA | NA | NA | NA | NA | 11,563 | SARS-CoV-2 |
| Chow et al. 2022 [21] | USA (Seattle, WA) | 1 October 2019–31 May 2021 | NA | 3281 | Median: 37 Range: 0.3 to 85 | 1979 (60.31%) | NA | 1493 (45.50%) | NA | NA | NA | 14,464 | RSV, Flu, SARS-CoV-2 |
| Keller et al., 2022 [115] | USA (Louisville, KY) | 1 March 2019–31 December 2019 1 March 2020–31 December 2020 | 3911 | 711 (18.18%) | Mean: 43.6 SD: 16.4 | NA | NA | NA | NA | NA | NA | 711 | SARS-CoV-2 |
| Luong et al., 2022 [116] | Canada (Toronto, ON) | 17 April 2020–31 July 2020 | NA | 4657 | NA | NA | NA | NA | NA | NA | NA | 4657 | SARS-CoV-2 |
| McCulloch et al., 2023 [20] | USA (King’s County, WA) | 1 January 2019–31 May 2019 | NA | 649 | Median: 41 Range: 0 to 97 | NA | NA | NA | NA | NA | NA | 825 | RSV, Flu |
| 1 October 2019–31 May 2021 | NA | 3281 | NA | NA | NA | NA | NA | NA | 15,289 | ||||
| Morrone et al., 2023 [110] | Italy (Rome) | 1 June 2020–1 January 2022 | NA | 3061 | Median: 44.6 Range: 5 to 86 | 1714 (55.99%) | 2362 (77.16%) | NA | NA | NA | NA | 5442 | SARS-CoV-2 |
| Rogers et al., 2023 [114] | USA (King’s County, WA) | 1 January 2020–31 May 2021 | NA | 2360 | Median: 37 IQR: 32.0 | 1484 (62.88%) | NA | 1101 (46.65%) | NA | NA | NA | 9846 | SARS-CoV-2 |
| Rogers et al., 2023 [44] | USA (King’s County, WA) | 15 November 2019–30 April 2020 2 November 2020–30 April 2021 | NA | 1283 | Median: 45 IQR: 24 | 878 (68.43%) | NA | 814 (63.45%) | NA | NA | NA | 1283 | Flu |
| Rogers et al., 2023 [19] | USA (King’s County, WA) | 21 January 2019–16 May 2019 | NA | 649 | Mean: 53.1 SD: 11.3 | 496 (76.43%) | NA | 508 (78.27%) | NA | NA | NA | 825 | RSV, Flu |
| Study | Country | Timeframe | Sampled Population | Outcome | RSV | Influenza | SARS-CoV-2 | ||||
|---|---|---|---|---|---|---|---|---|---|---|---|
| HP (N.) | Non-HP (N.) | HP (n./N, %) | Non-HP (n./N, %) | HP (n./N, %) | Non-HP (n./N, %) | HP (n./N, %) | Non-HP (n./N, %) | ||||
| Boonyaratanakornkit et al., 2019 [117] | USA (Seattle, WA) | July 2012– June 2017 | 24,452 | 350,220 | Hospital admissions | 50 (0.20%) | 107 (0.03%) | 137 (0.56%) | 571 (0.16%) | NA | NA |
| Richard et al., 2021 [112] | Canada (Toronto, ON) | 23 January 2020 to 31 July 2020 | 8451 | 1,266,716 | Total cases | NA | NA | NA | NA | 274 (3.24%) | 28,430 (2.24%) |
| Hospital admissions | NA | NA | NA | NA | 104 (1.23%) | 3685 (0.29%) | |||||
| ICU | NA | NA | NA | NA | 15 (0.01%) | 1053 (0.08%) | |||||
| Deaths | NA | NA | NA | NA | 10 (0.01%) | 730 (0.06%) | |||||
| Loubiere et al., 2023 [118] | France (Marseille) | 5 June 2020 to 31 March 2021 | 1332 | NA | Total cases | NA | NA | NA | NA | 192 (14.41%) | NA |
| Hospital admissions | NA | NA | NA | NA | 73 (5.48%) | NA | |||||
| Rogers et al., 2023 [19] | USA (Seattle, WA) | 21 January 2019 to 16 May 2019 | 649 | NA | Total cases | 14 (2.16%) | NA | 11 (1.69%) | NA | NA | NA |
| Sought healthcare | 3 (0.46%) | NA | 2 (0.31%) | NA | NA | NA | |||||
3.3. Characteristics of Incidence Studies
3.4. Characteristics of Outcome Studies
3.5. Prevalence Estimates
3.6. Incidence Estimates
3.7. Outcome Estimates
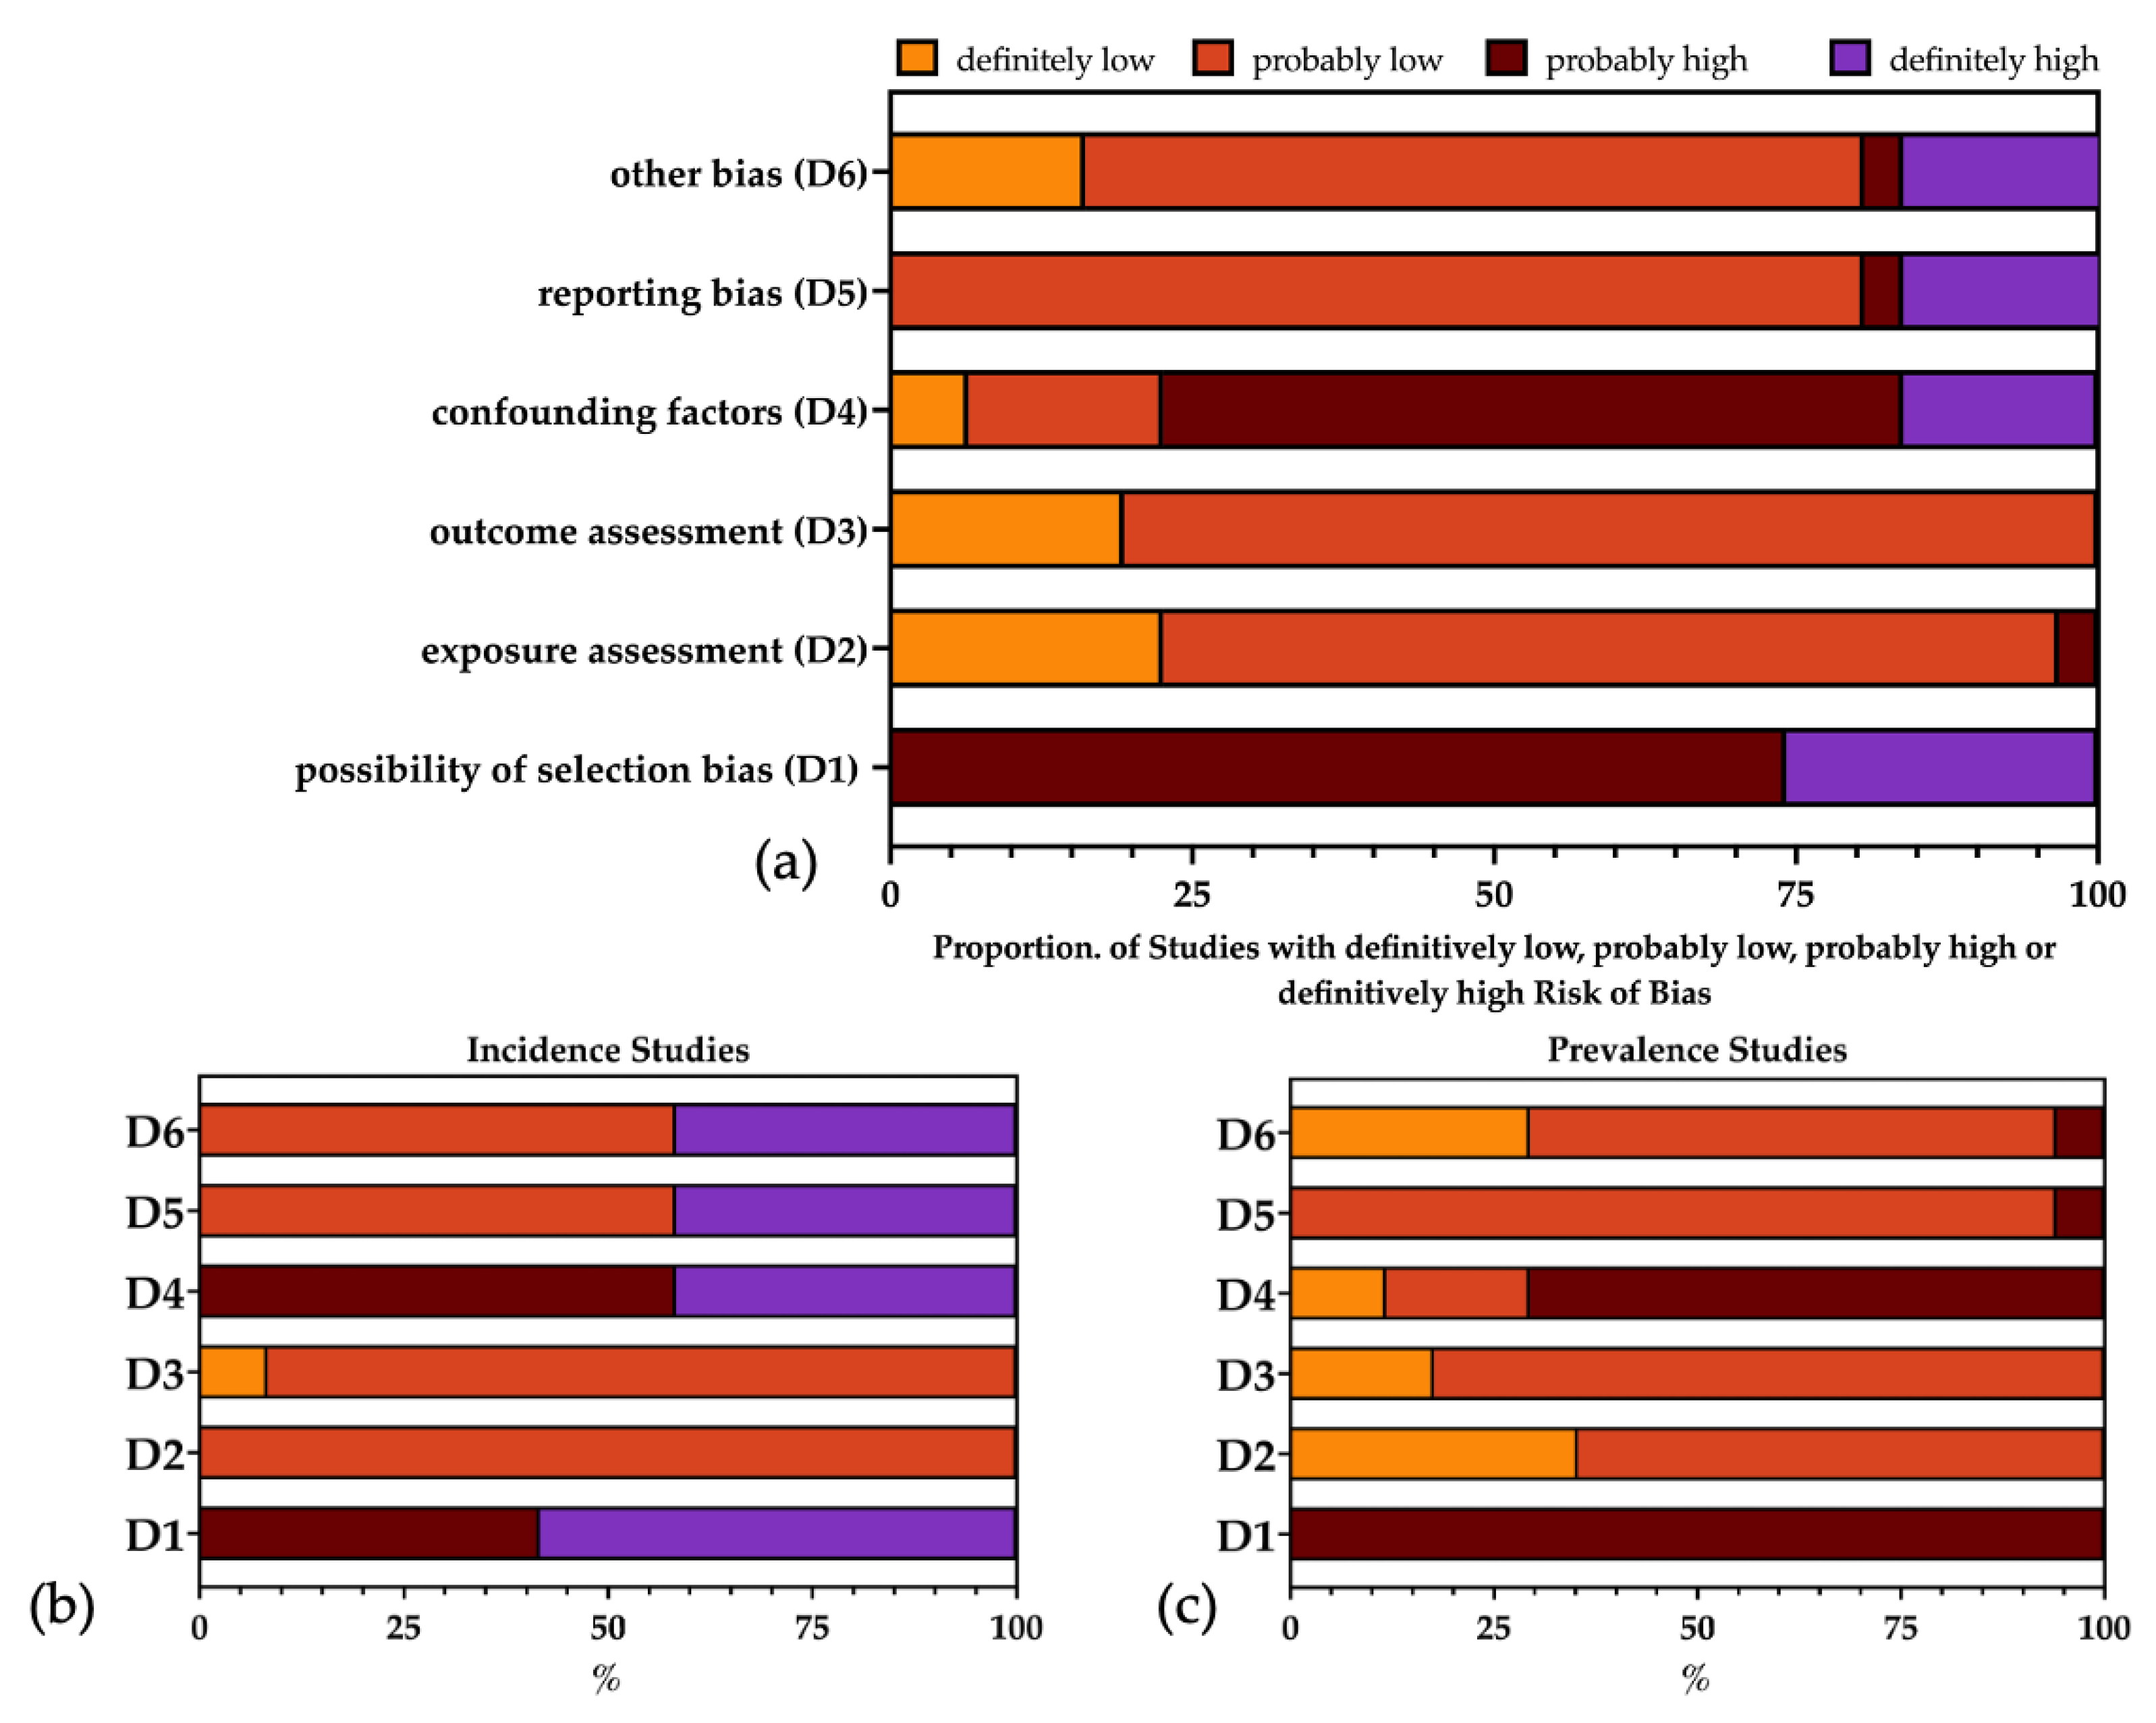
3.8. Risk of Bias
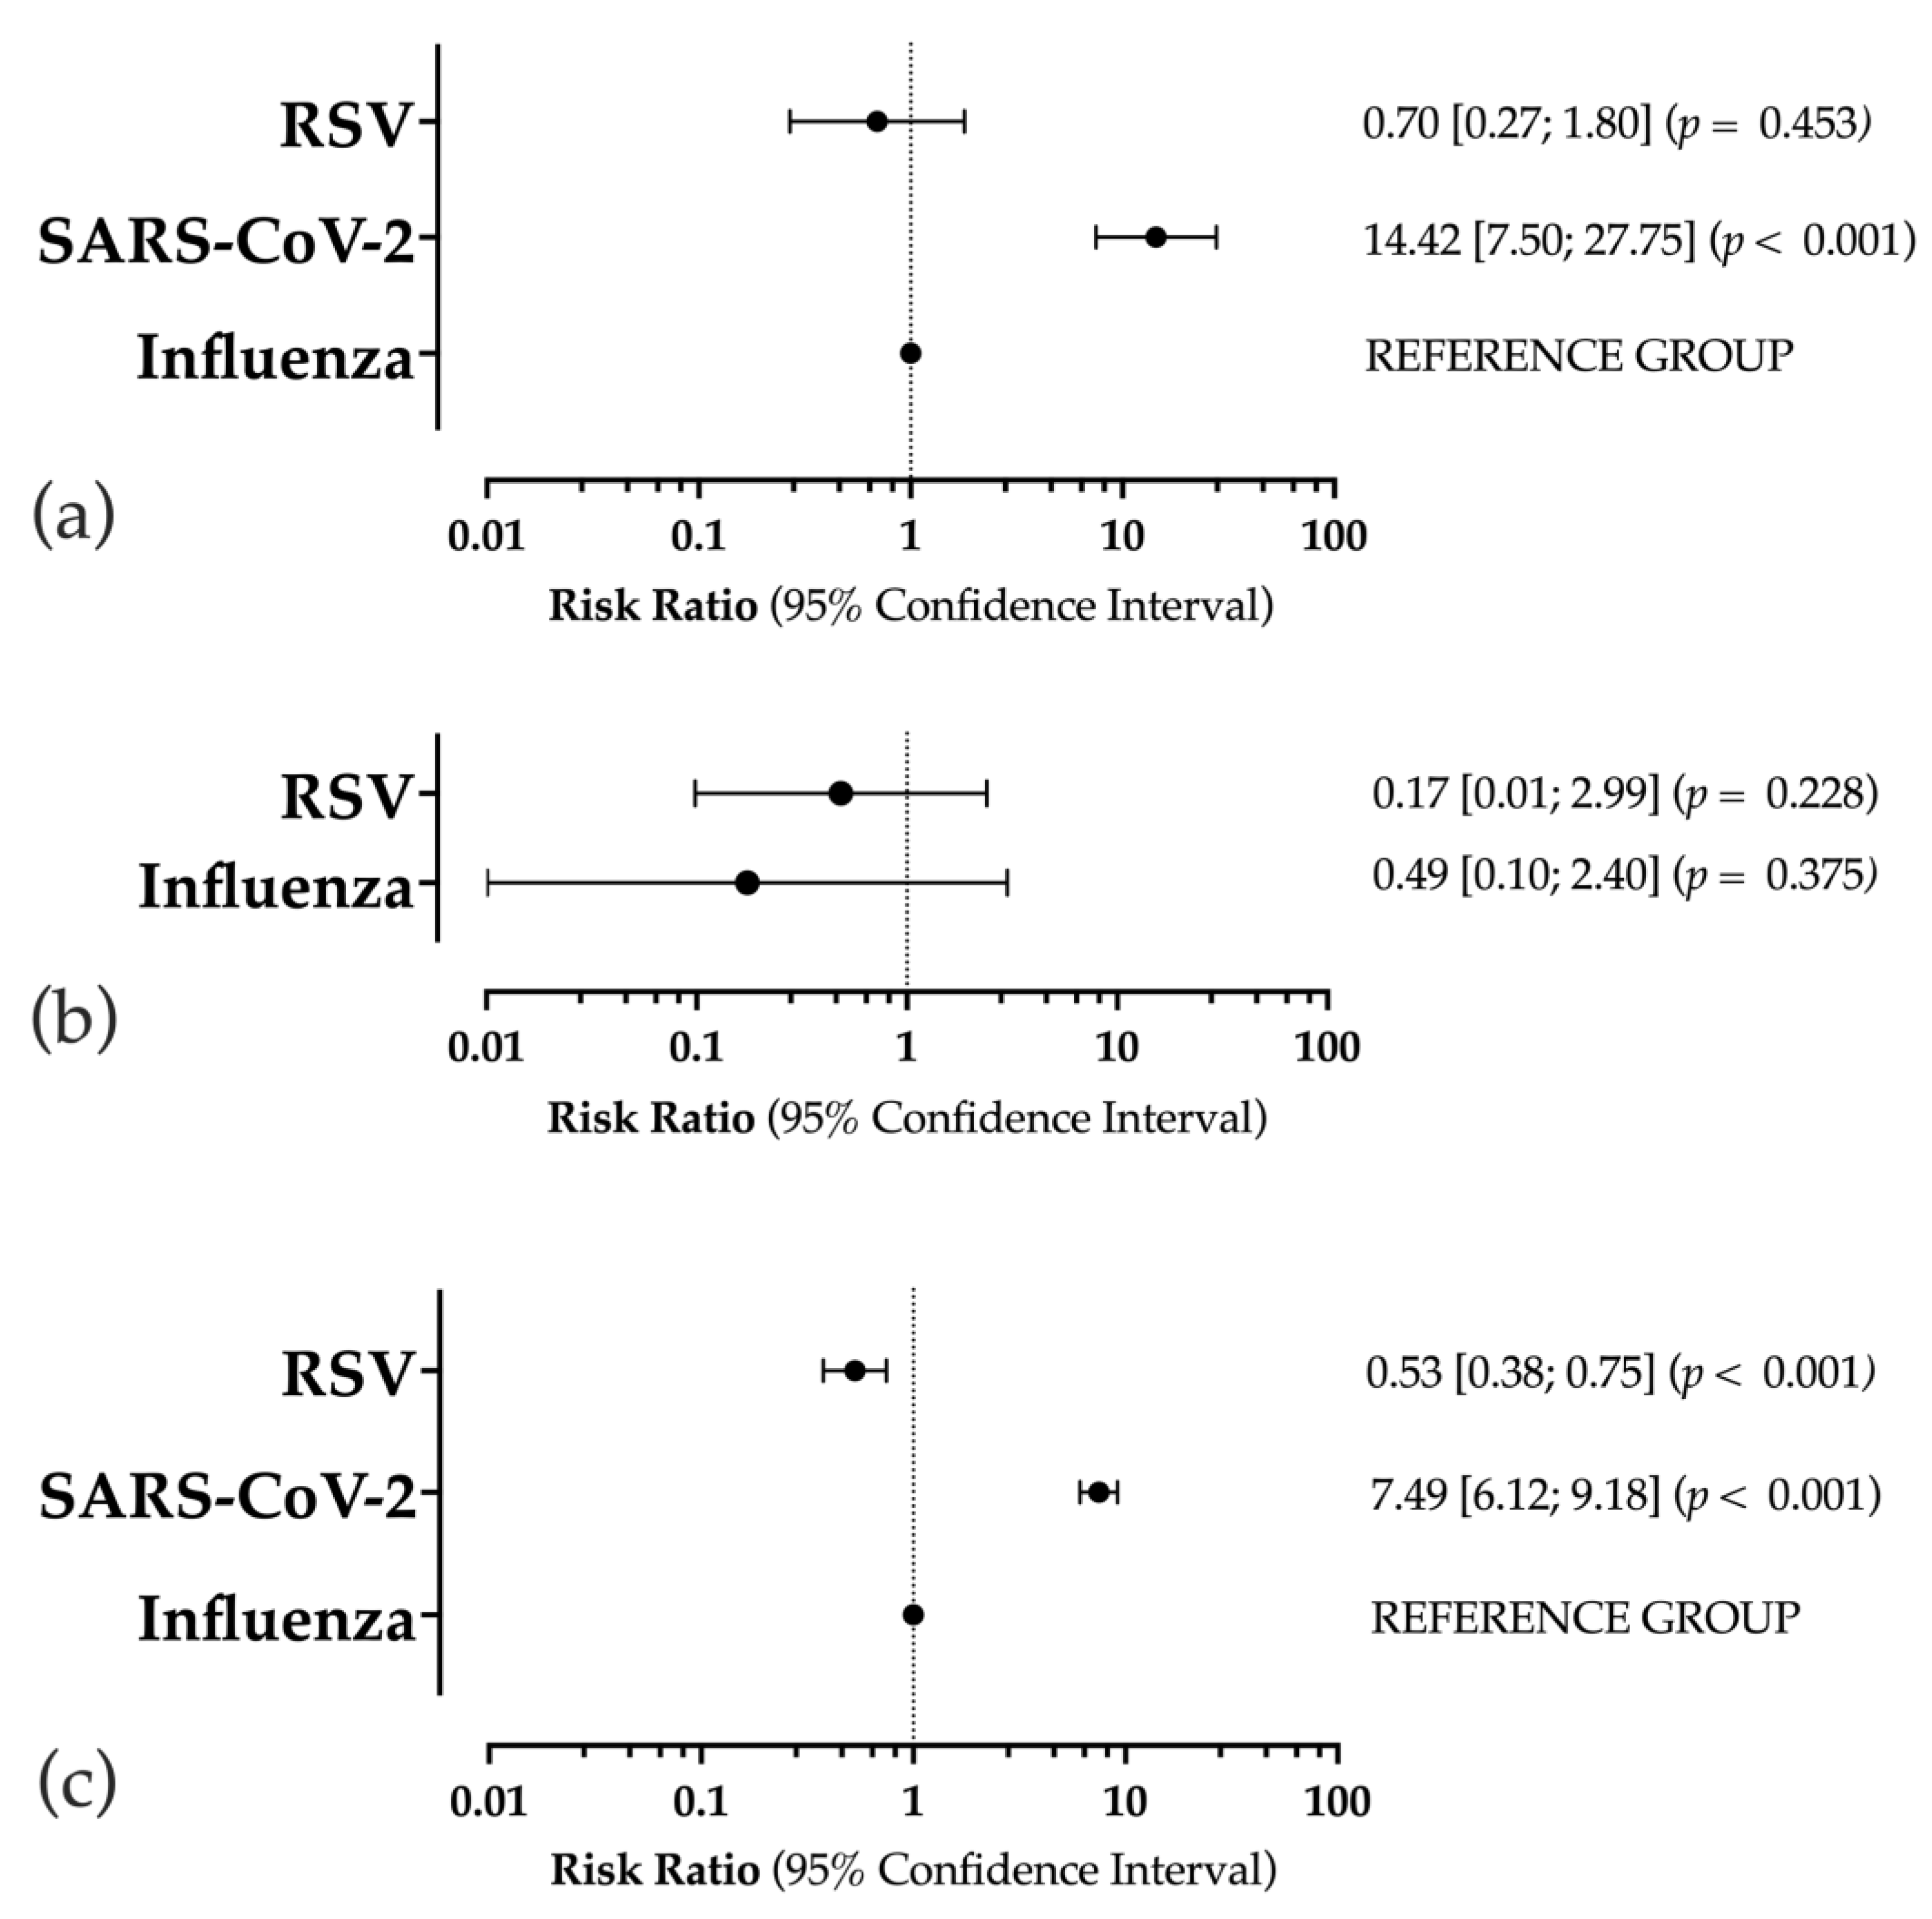
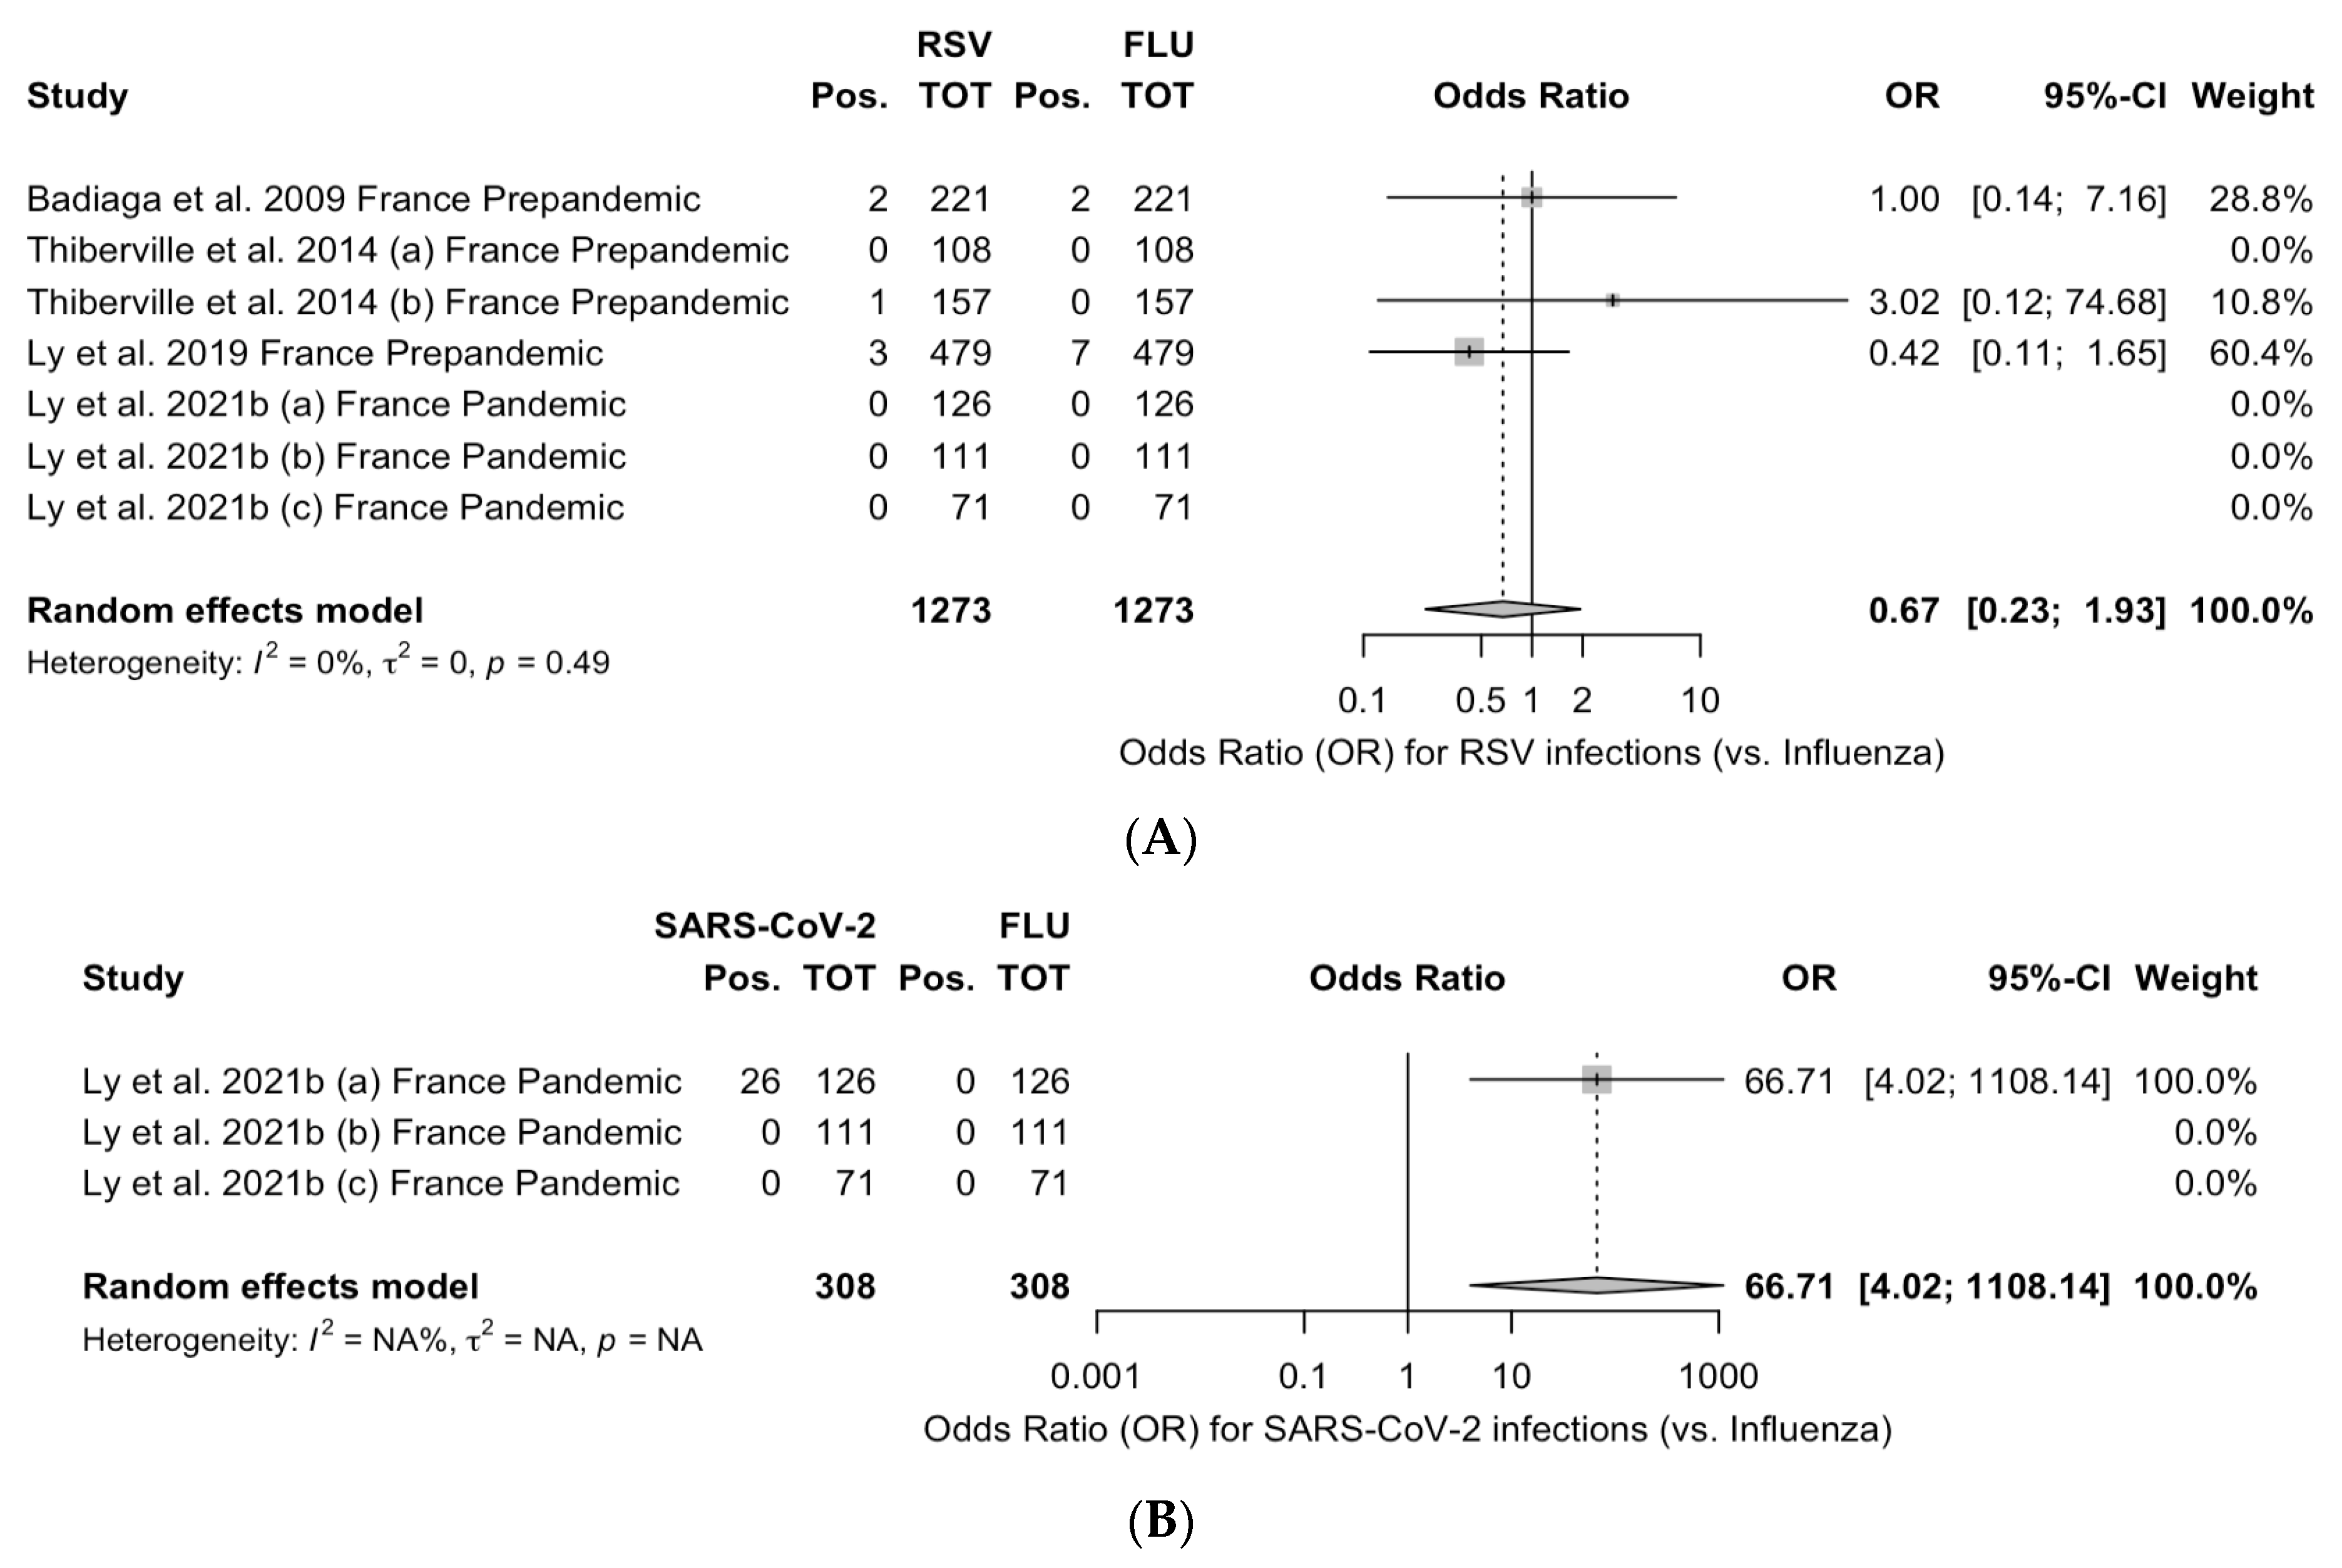
3.9. Meta-Analysis
3.9.1. Prevalence Estimates
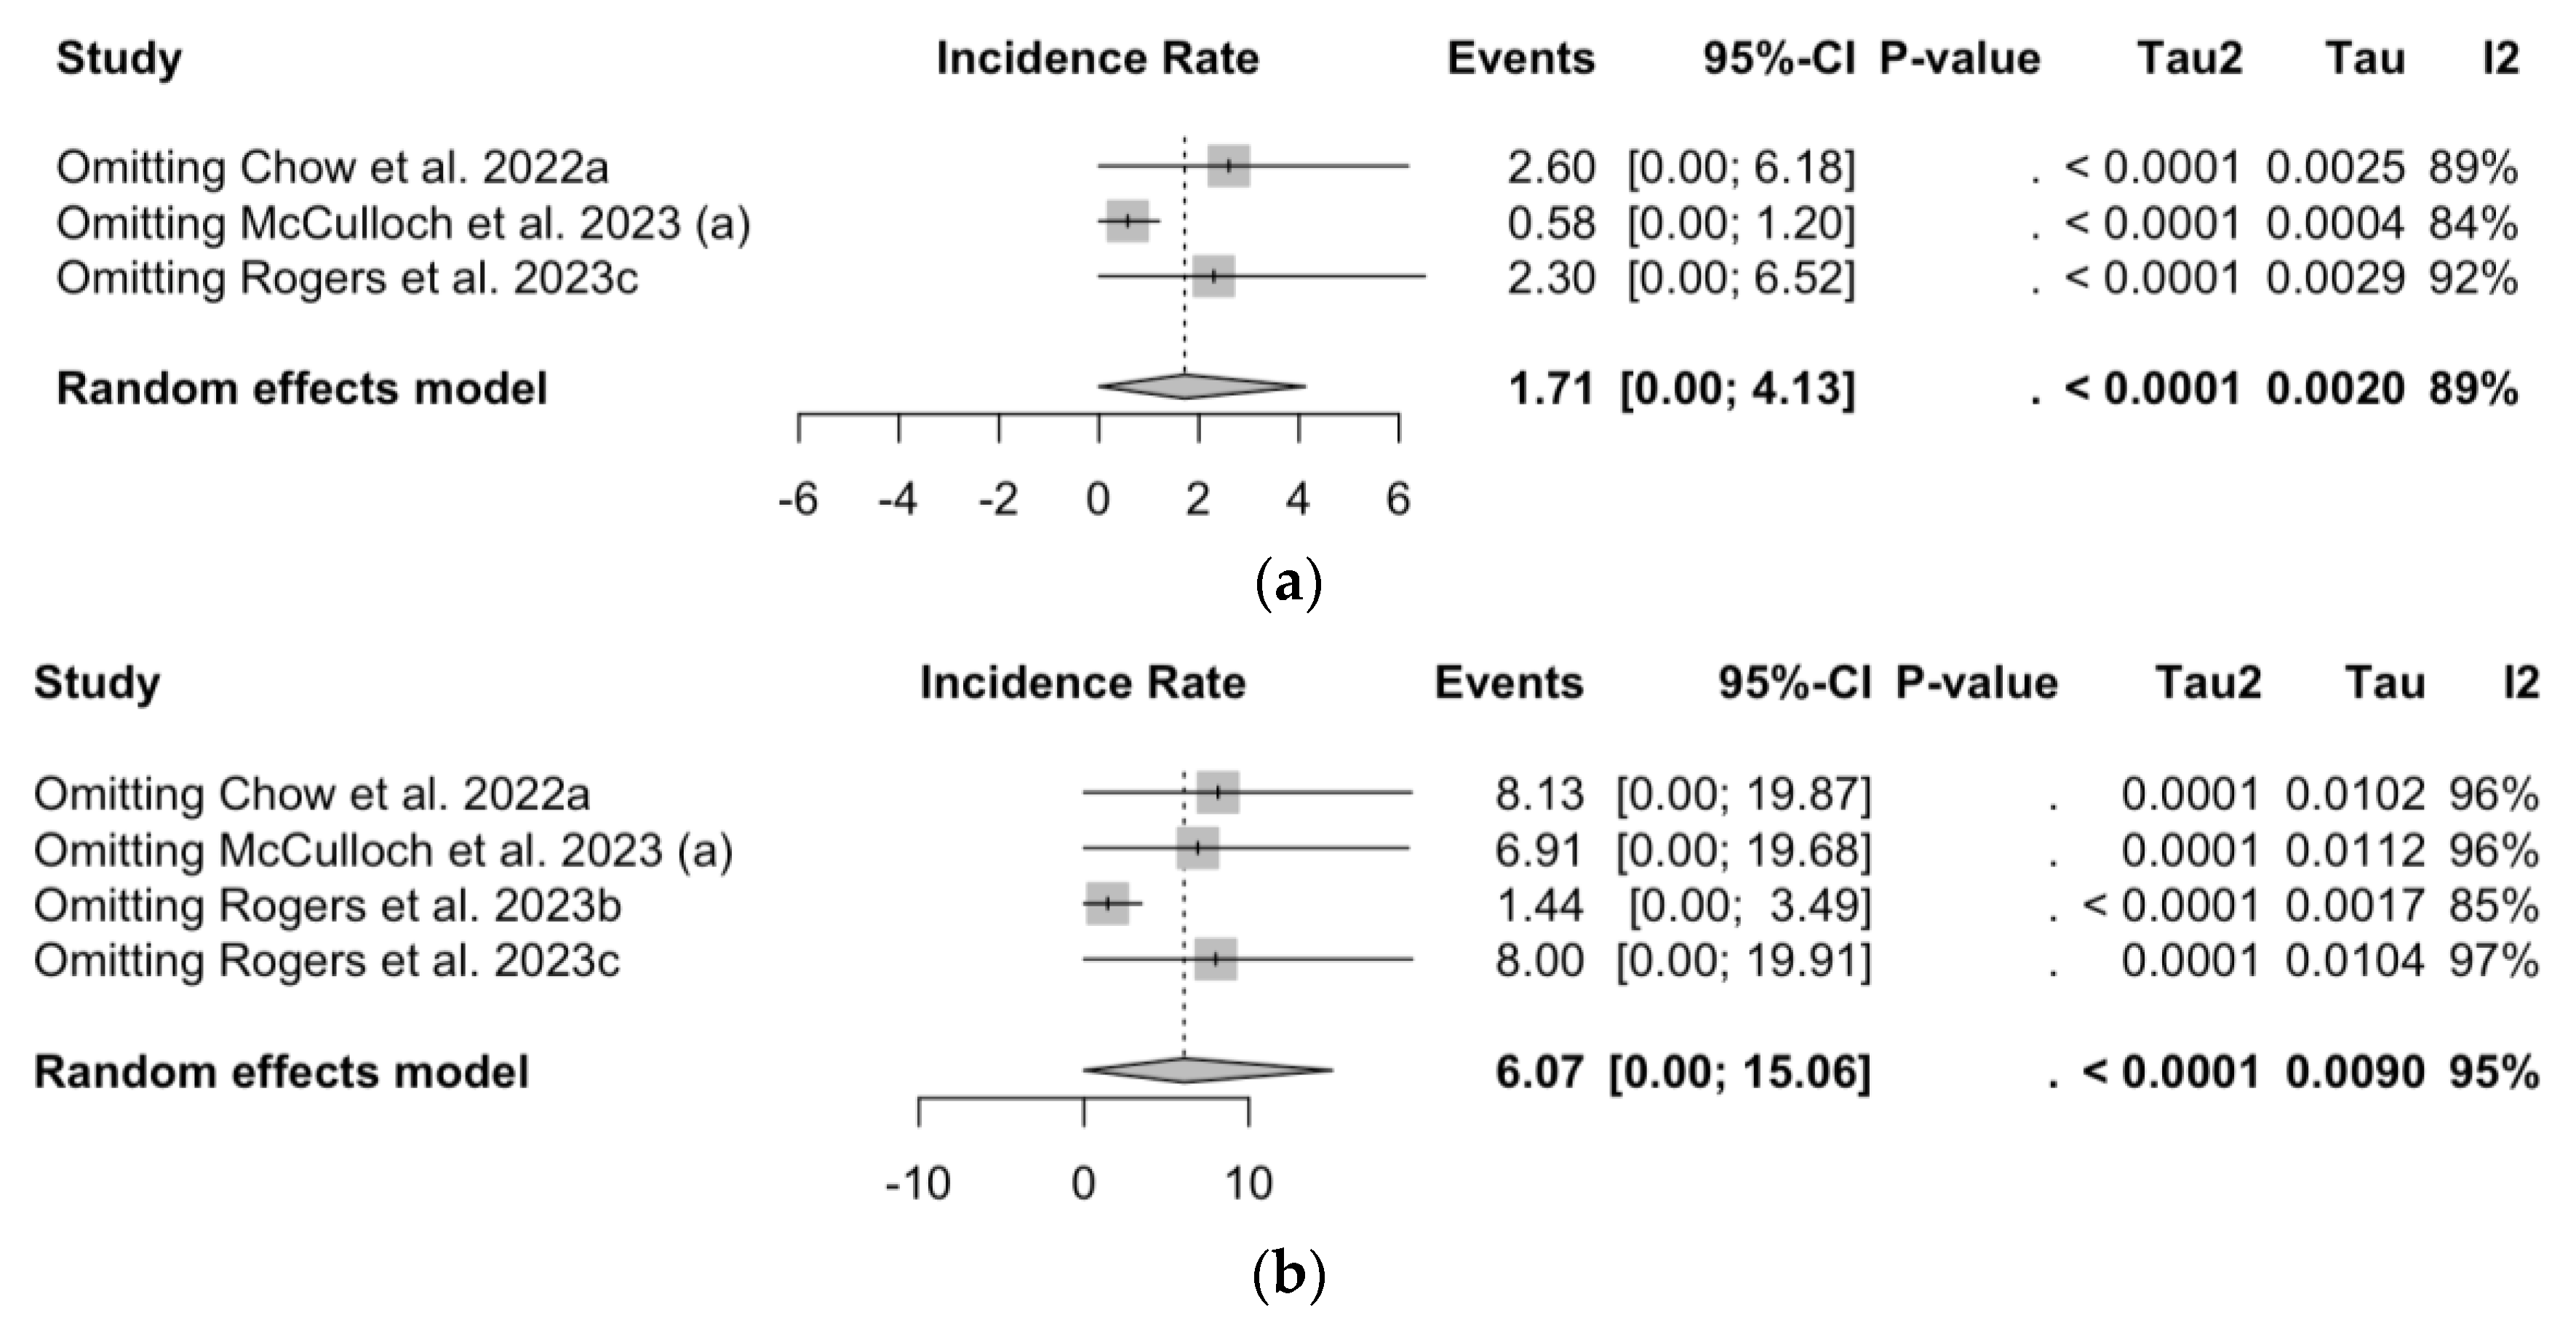
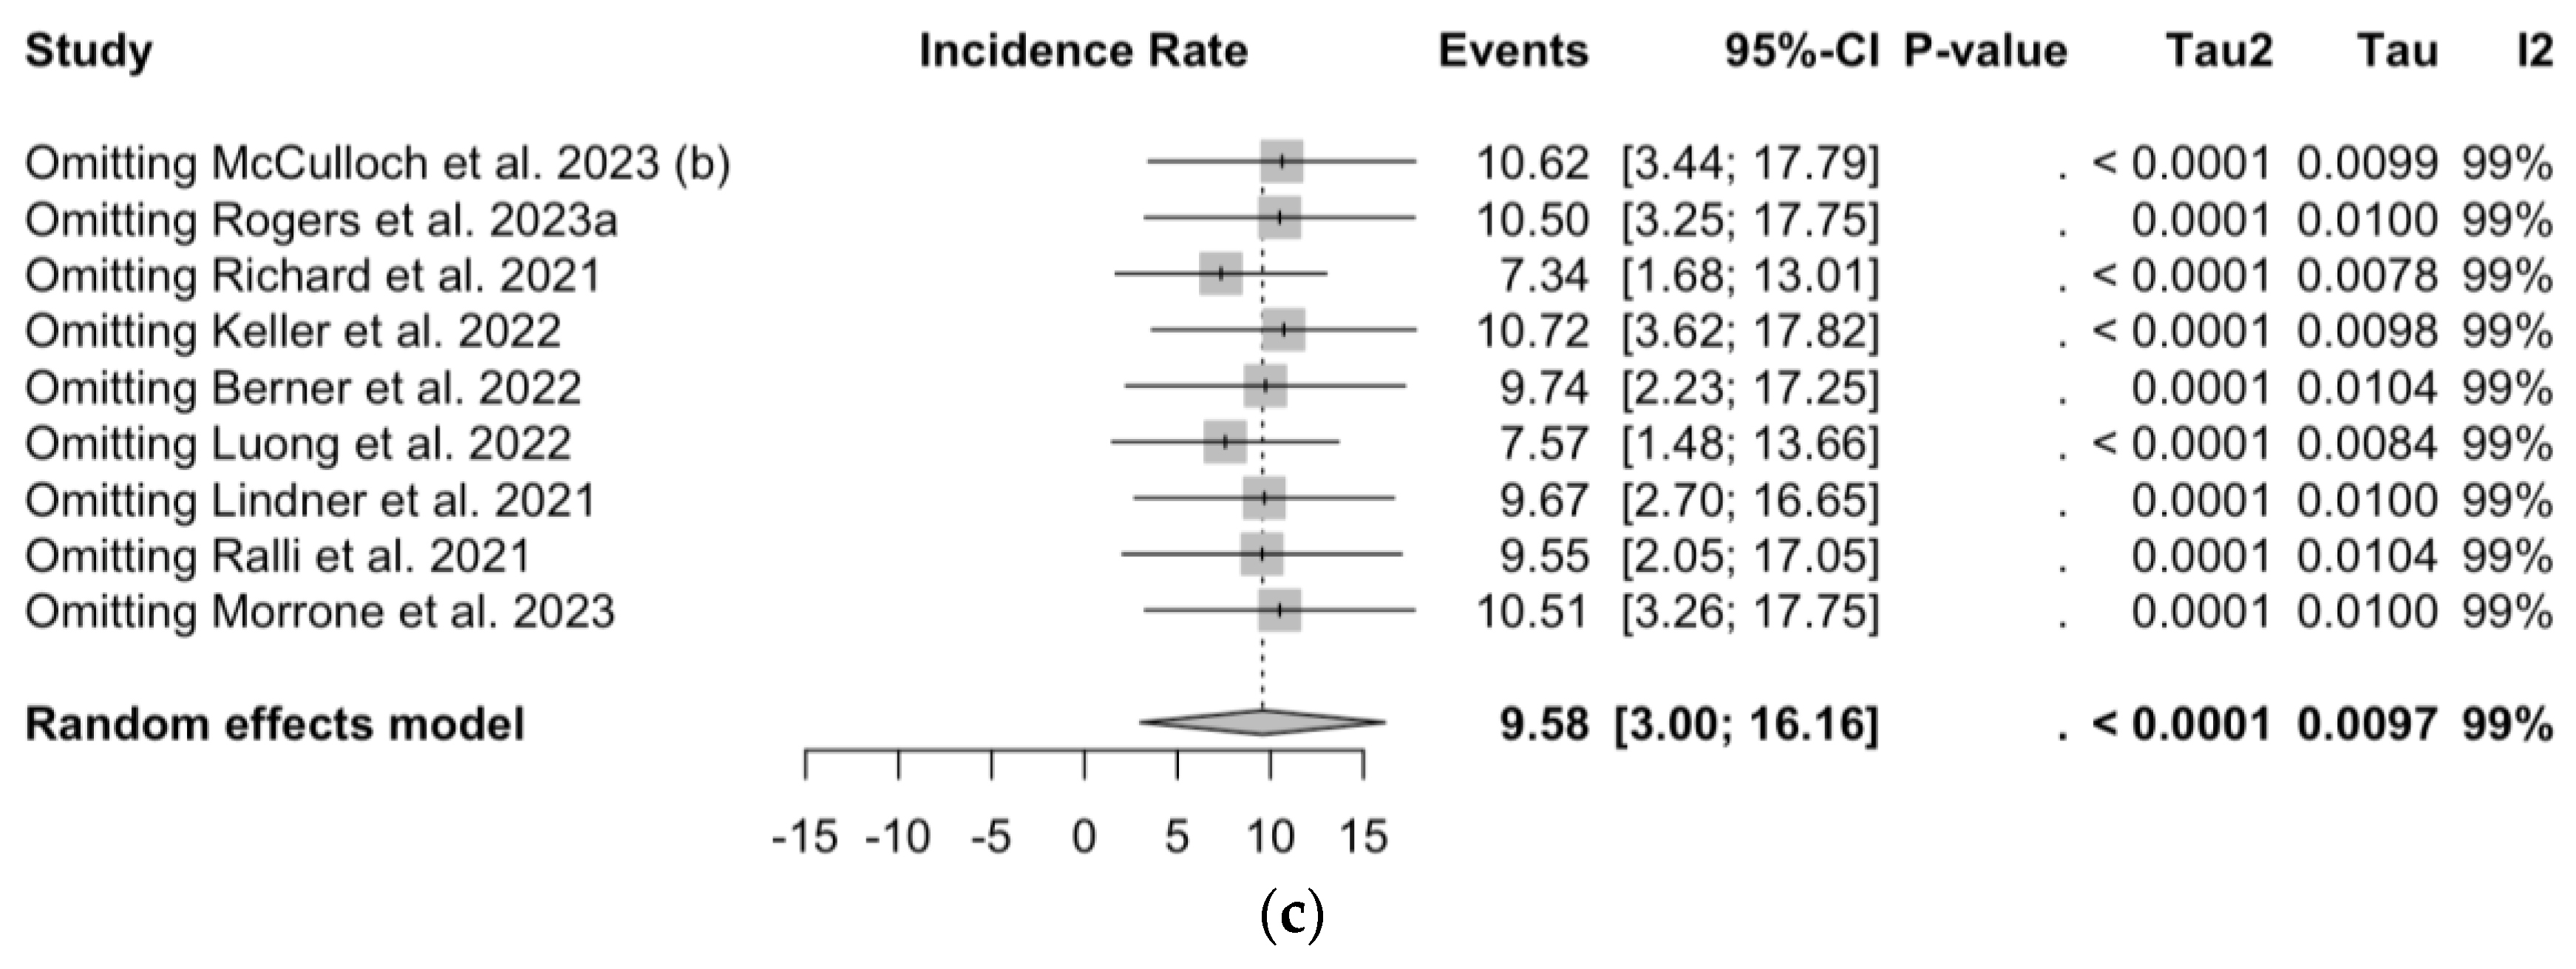
3.9.2. Incidence Estimates
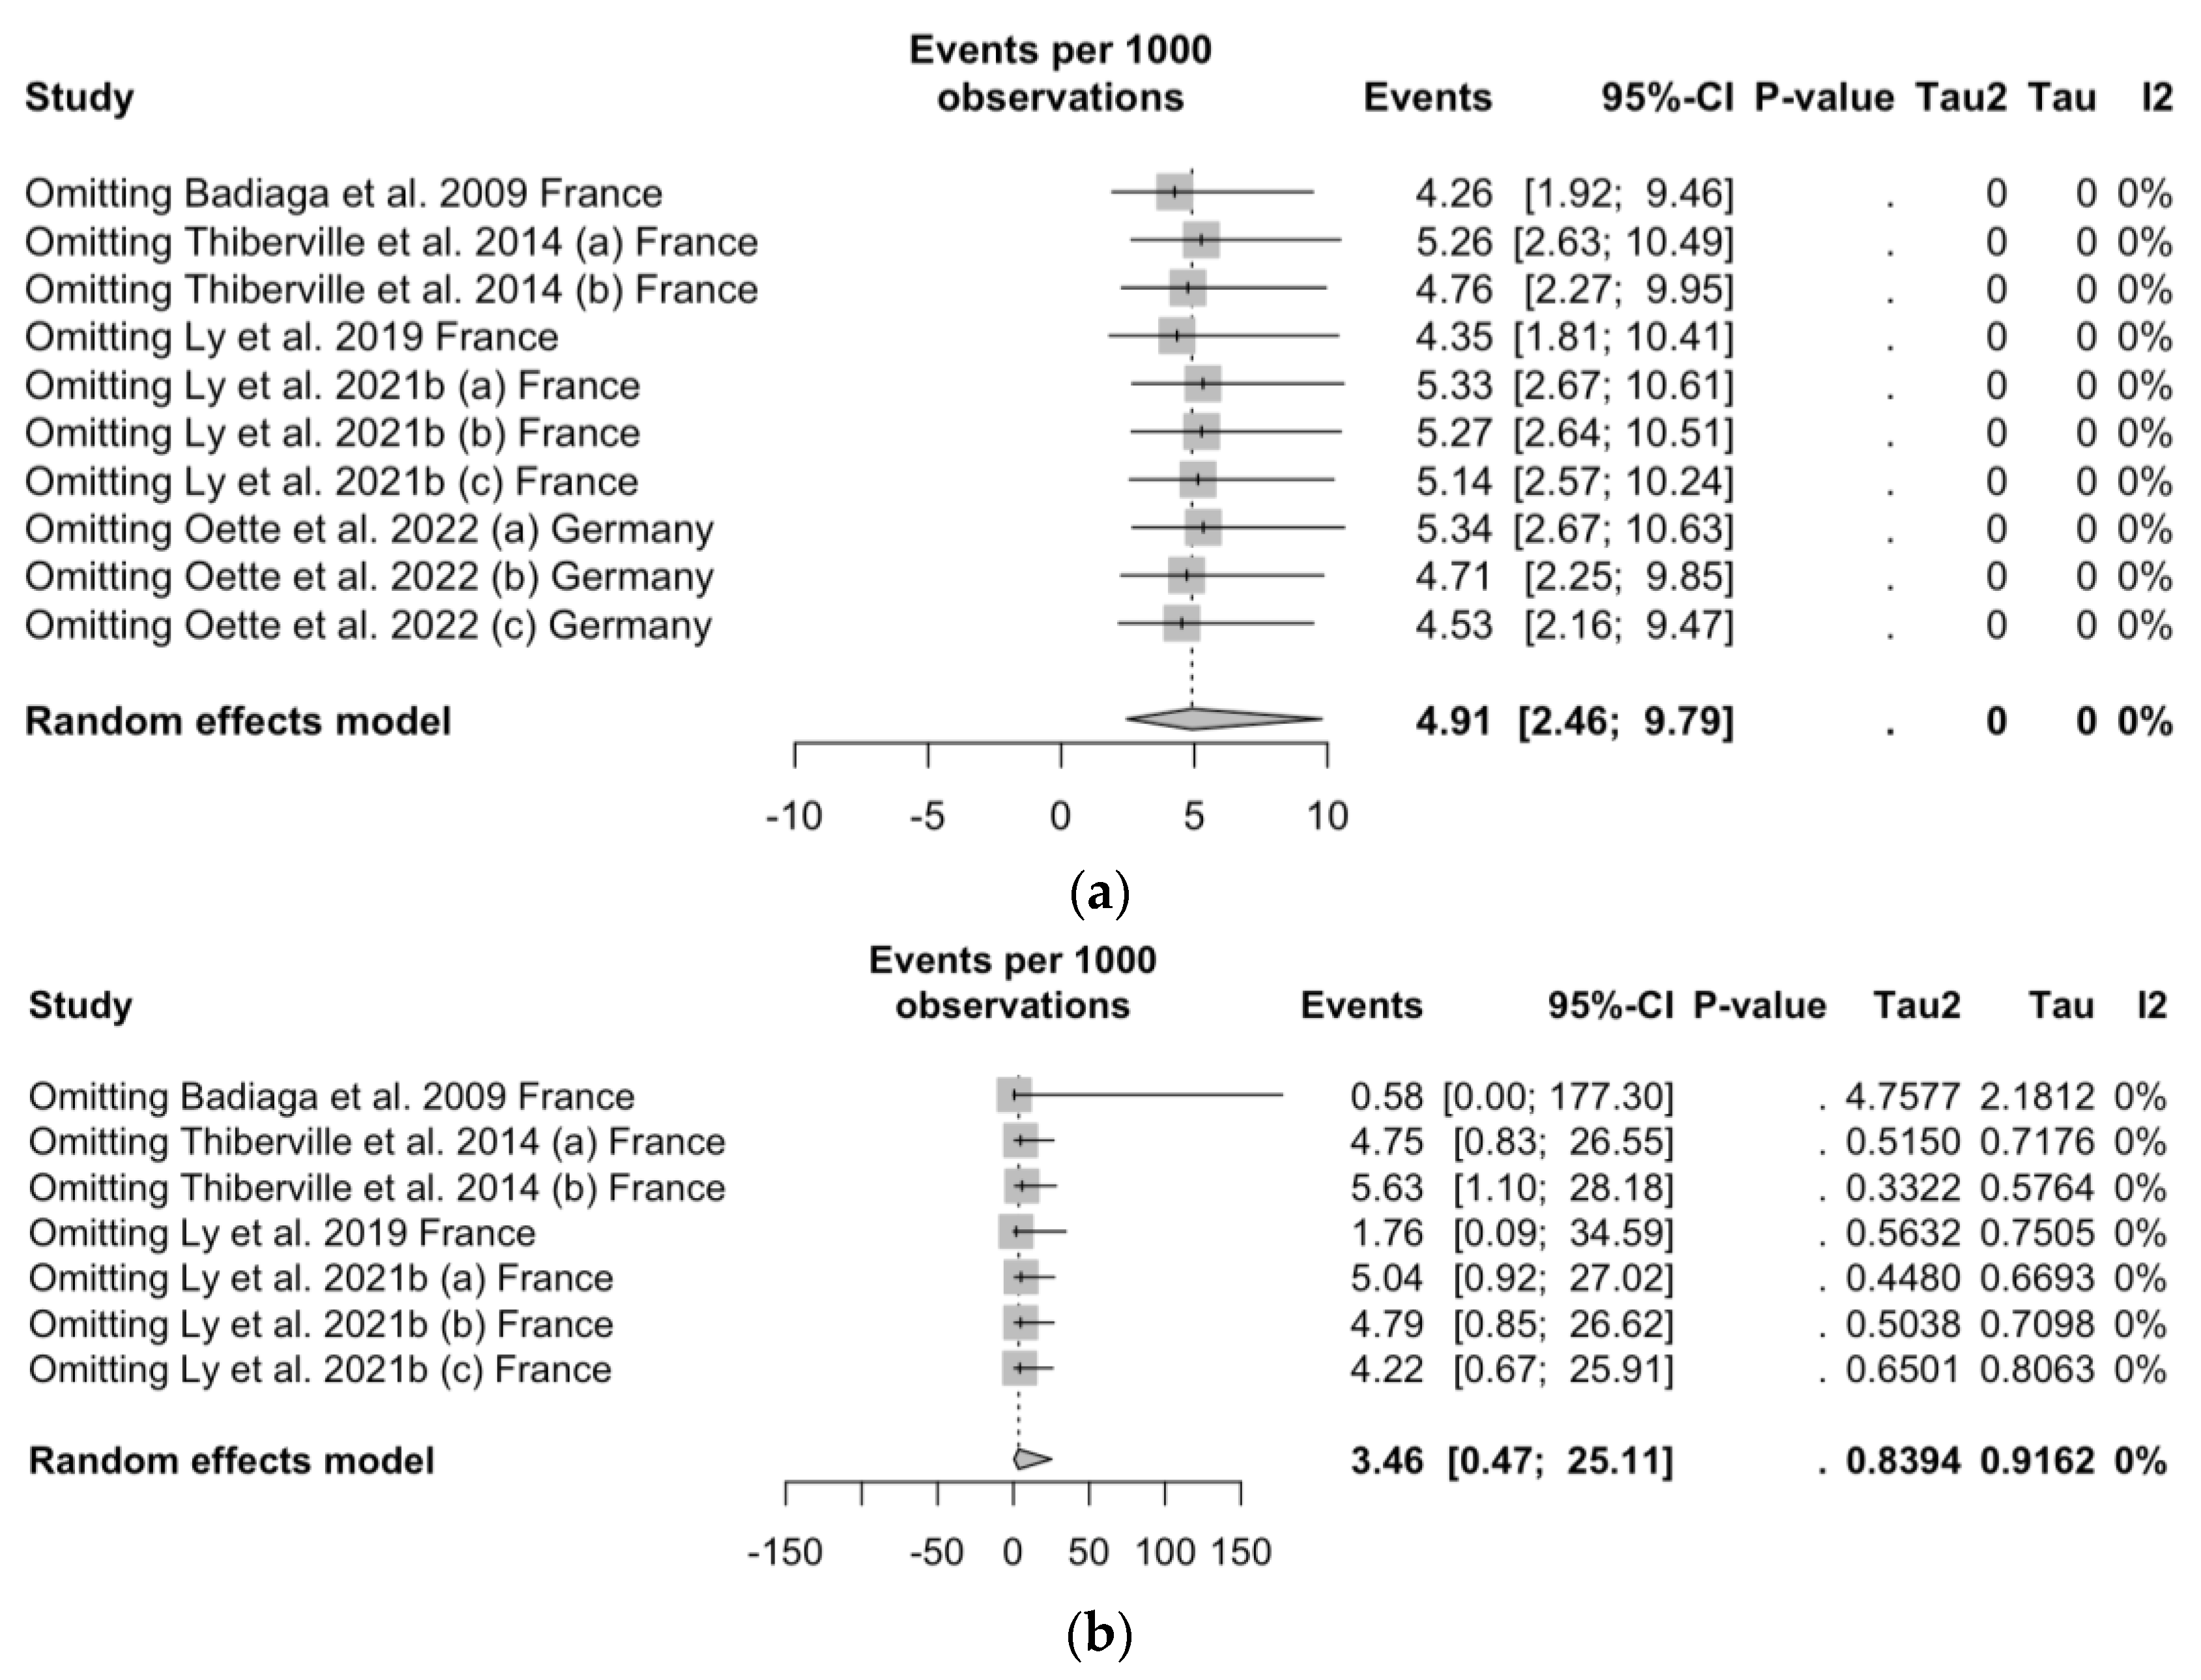
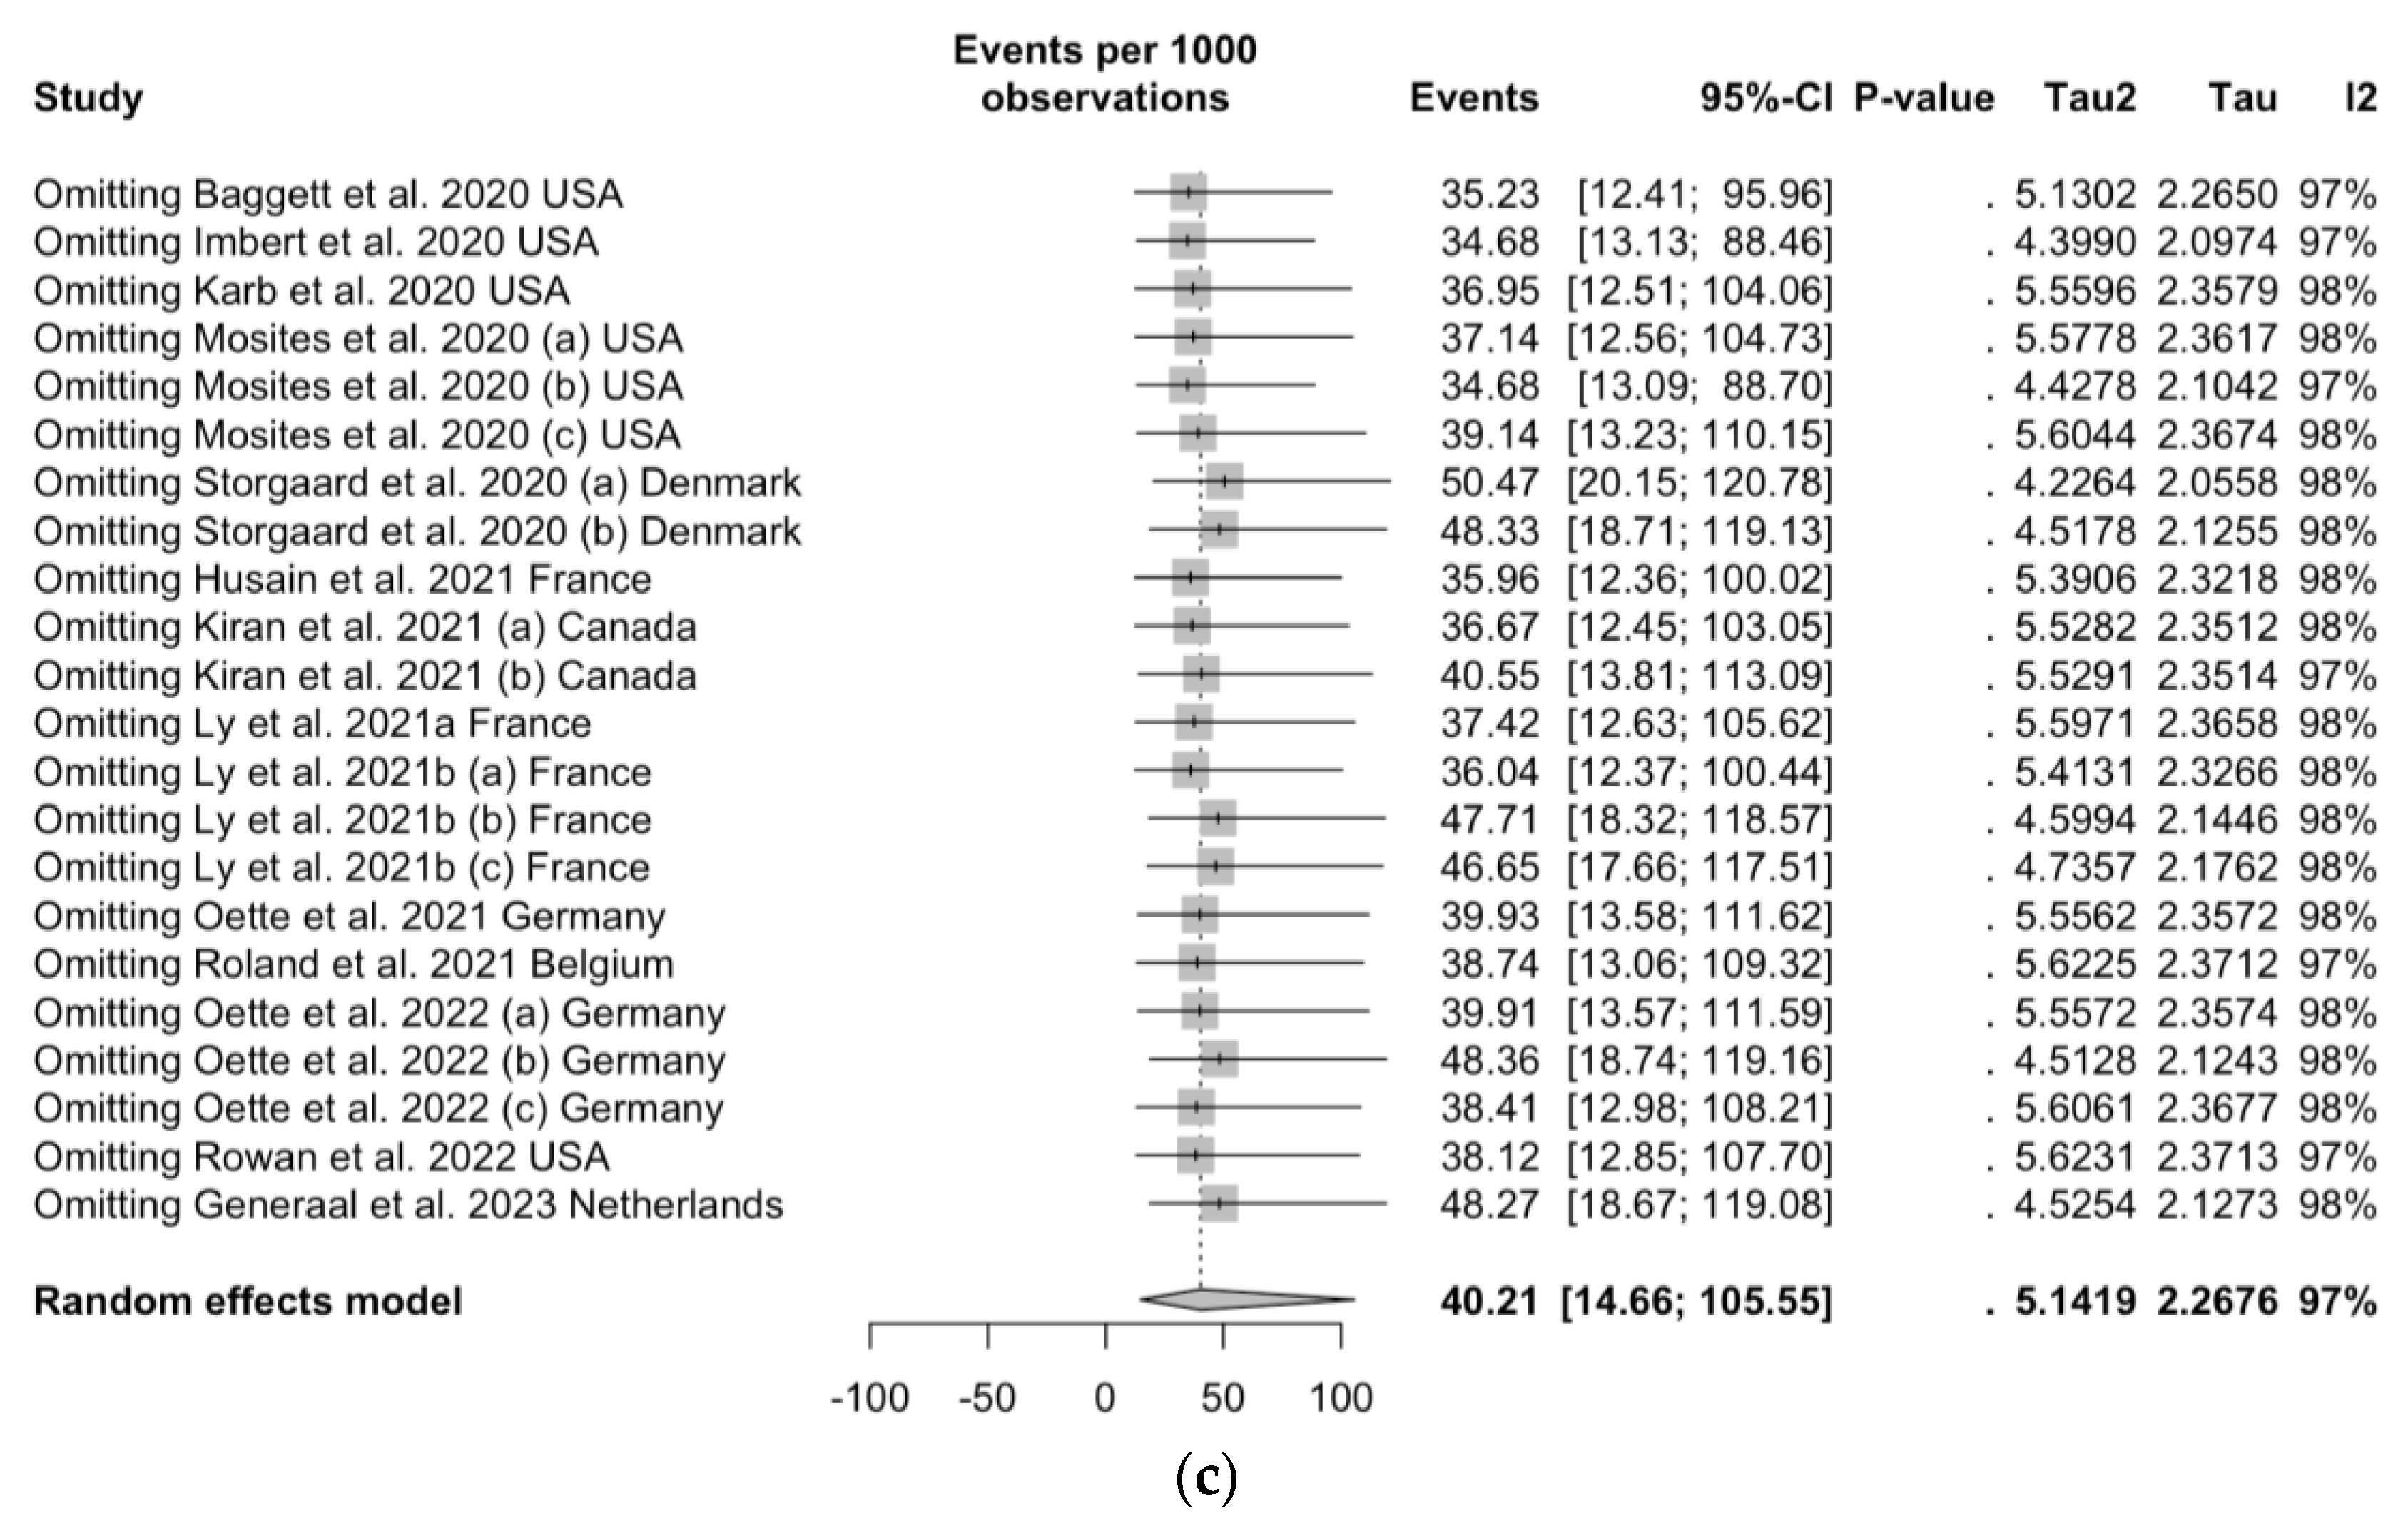
3.10. Sensitivity Analysis
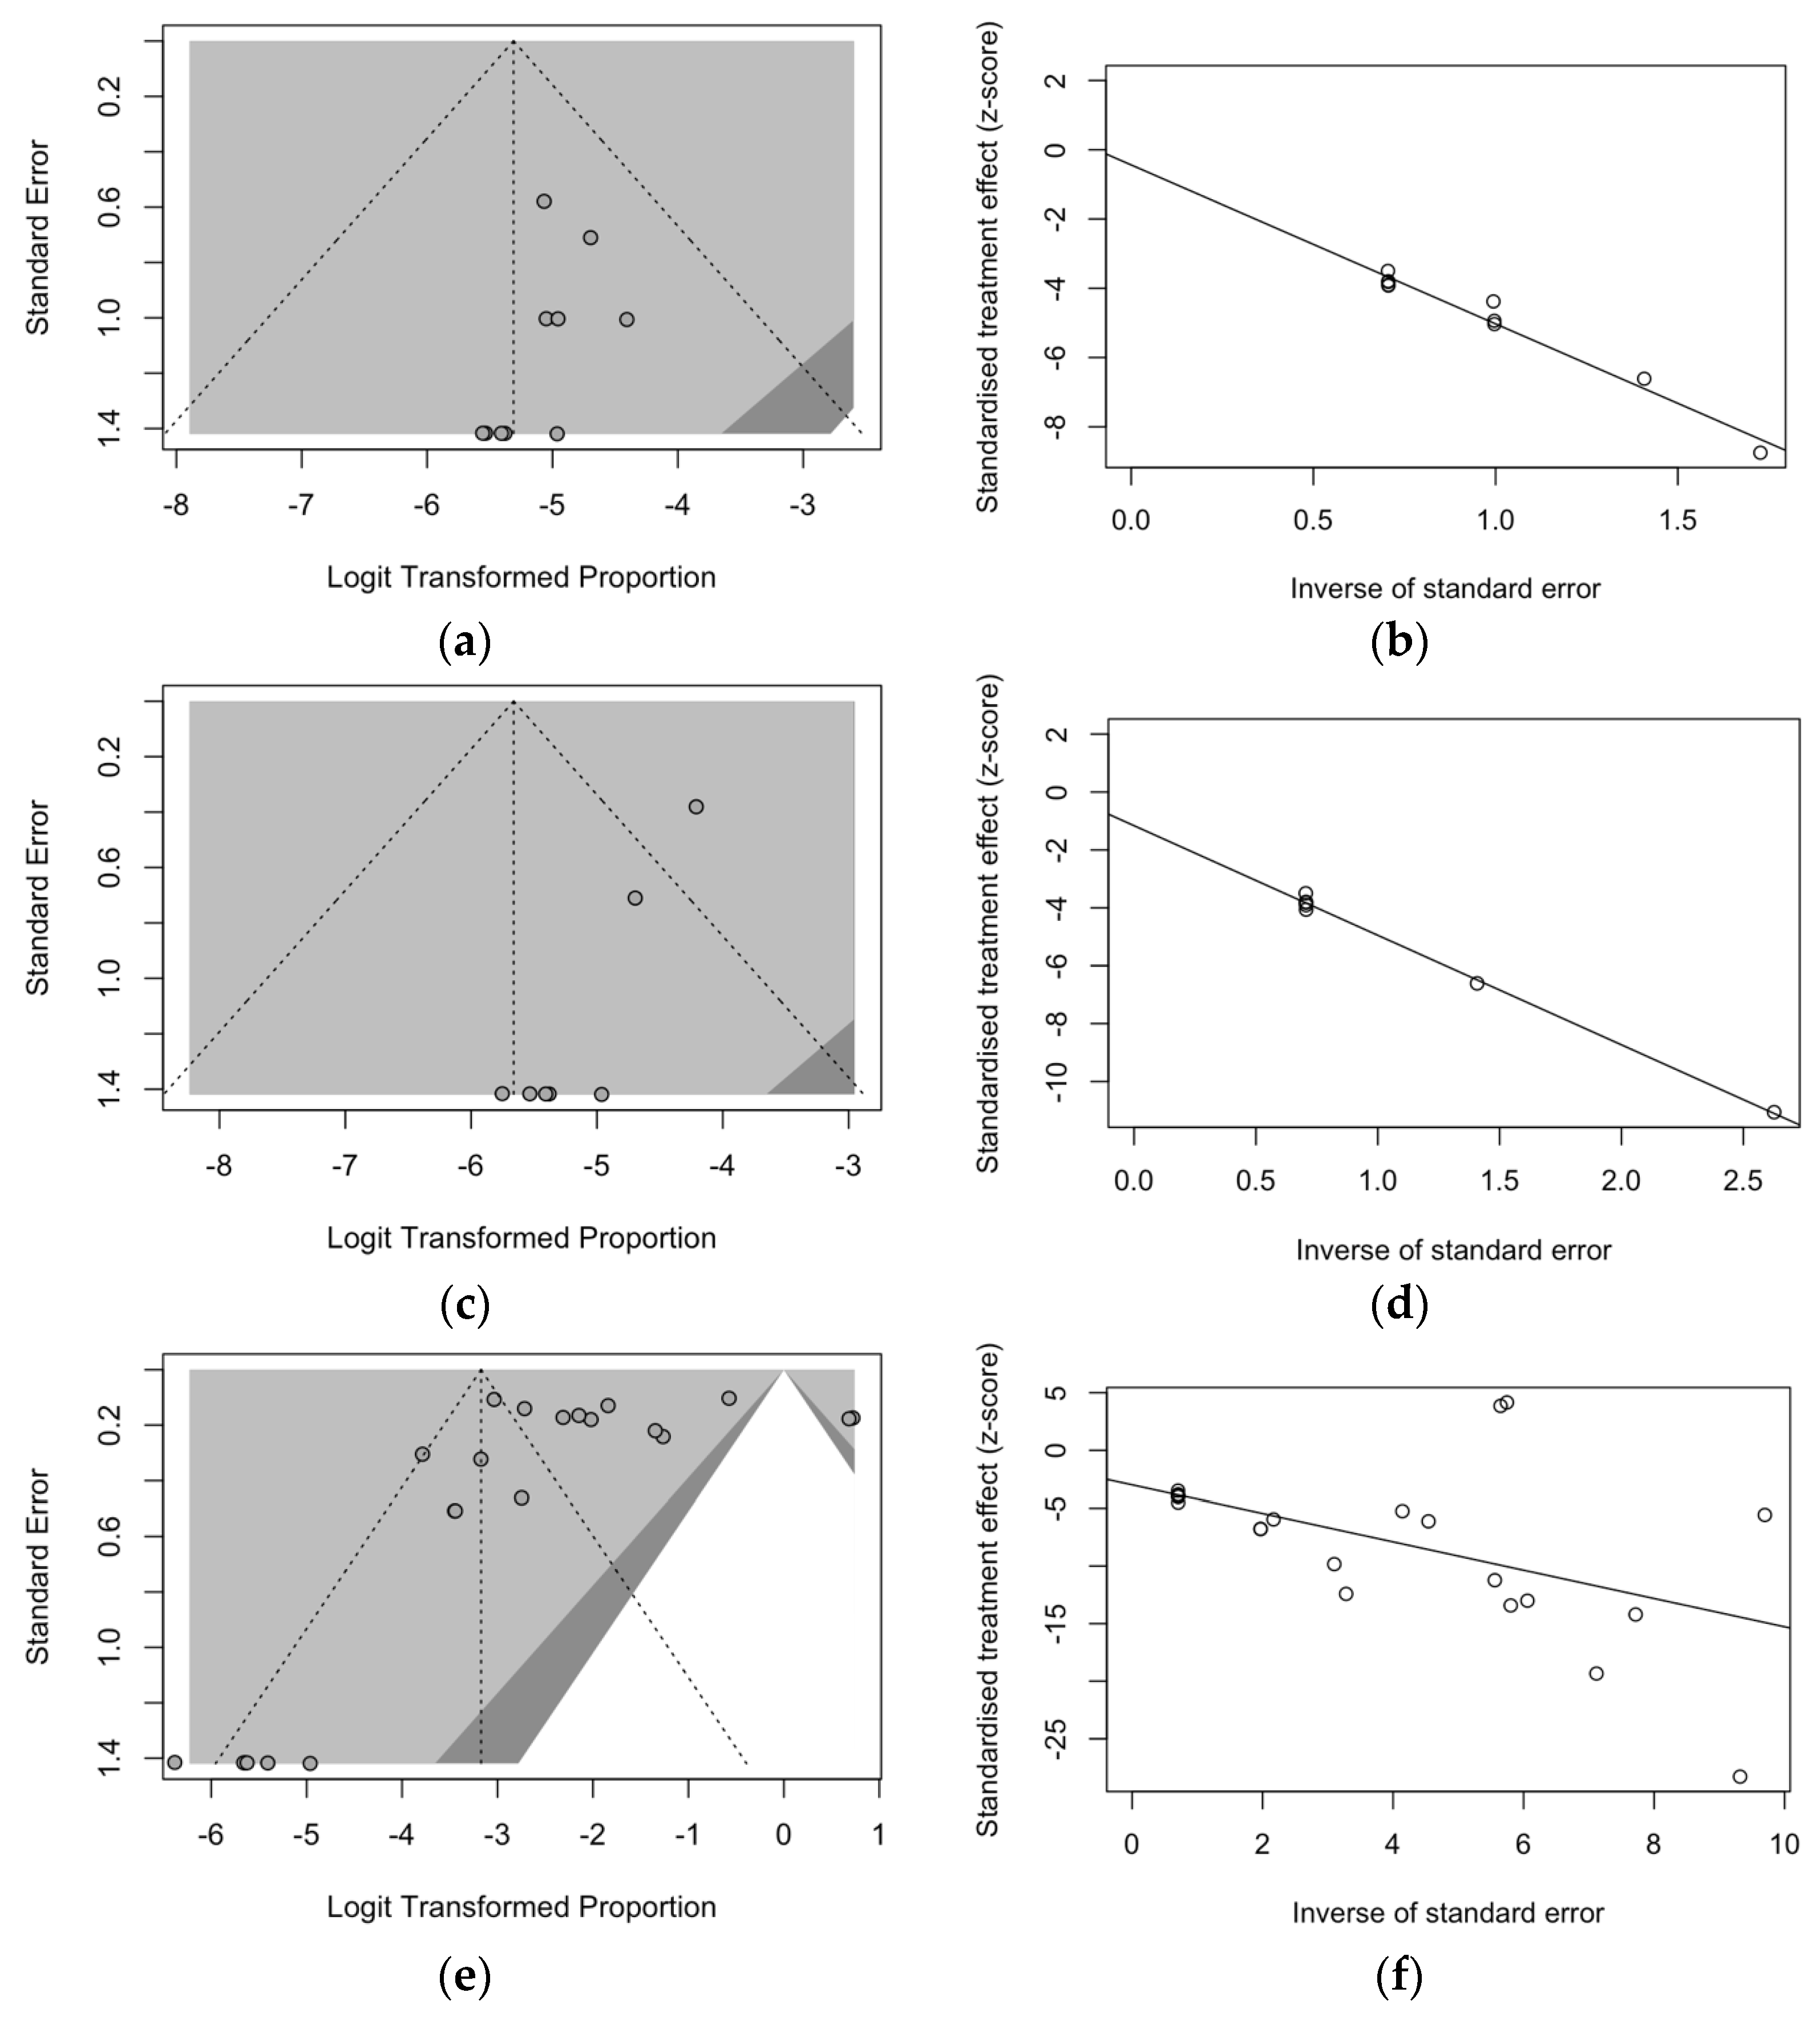
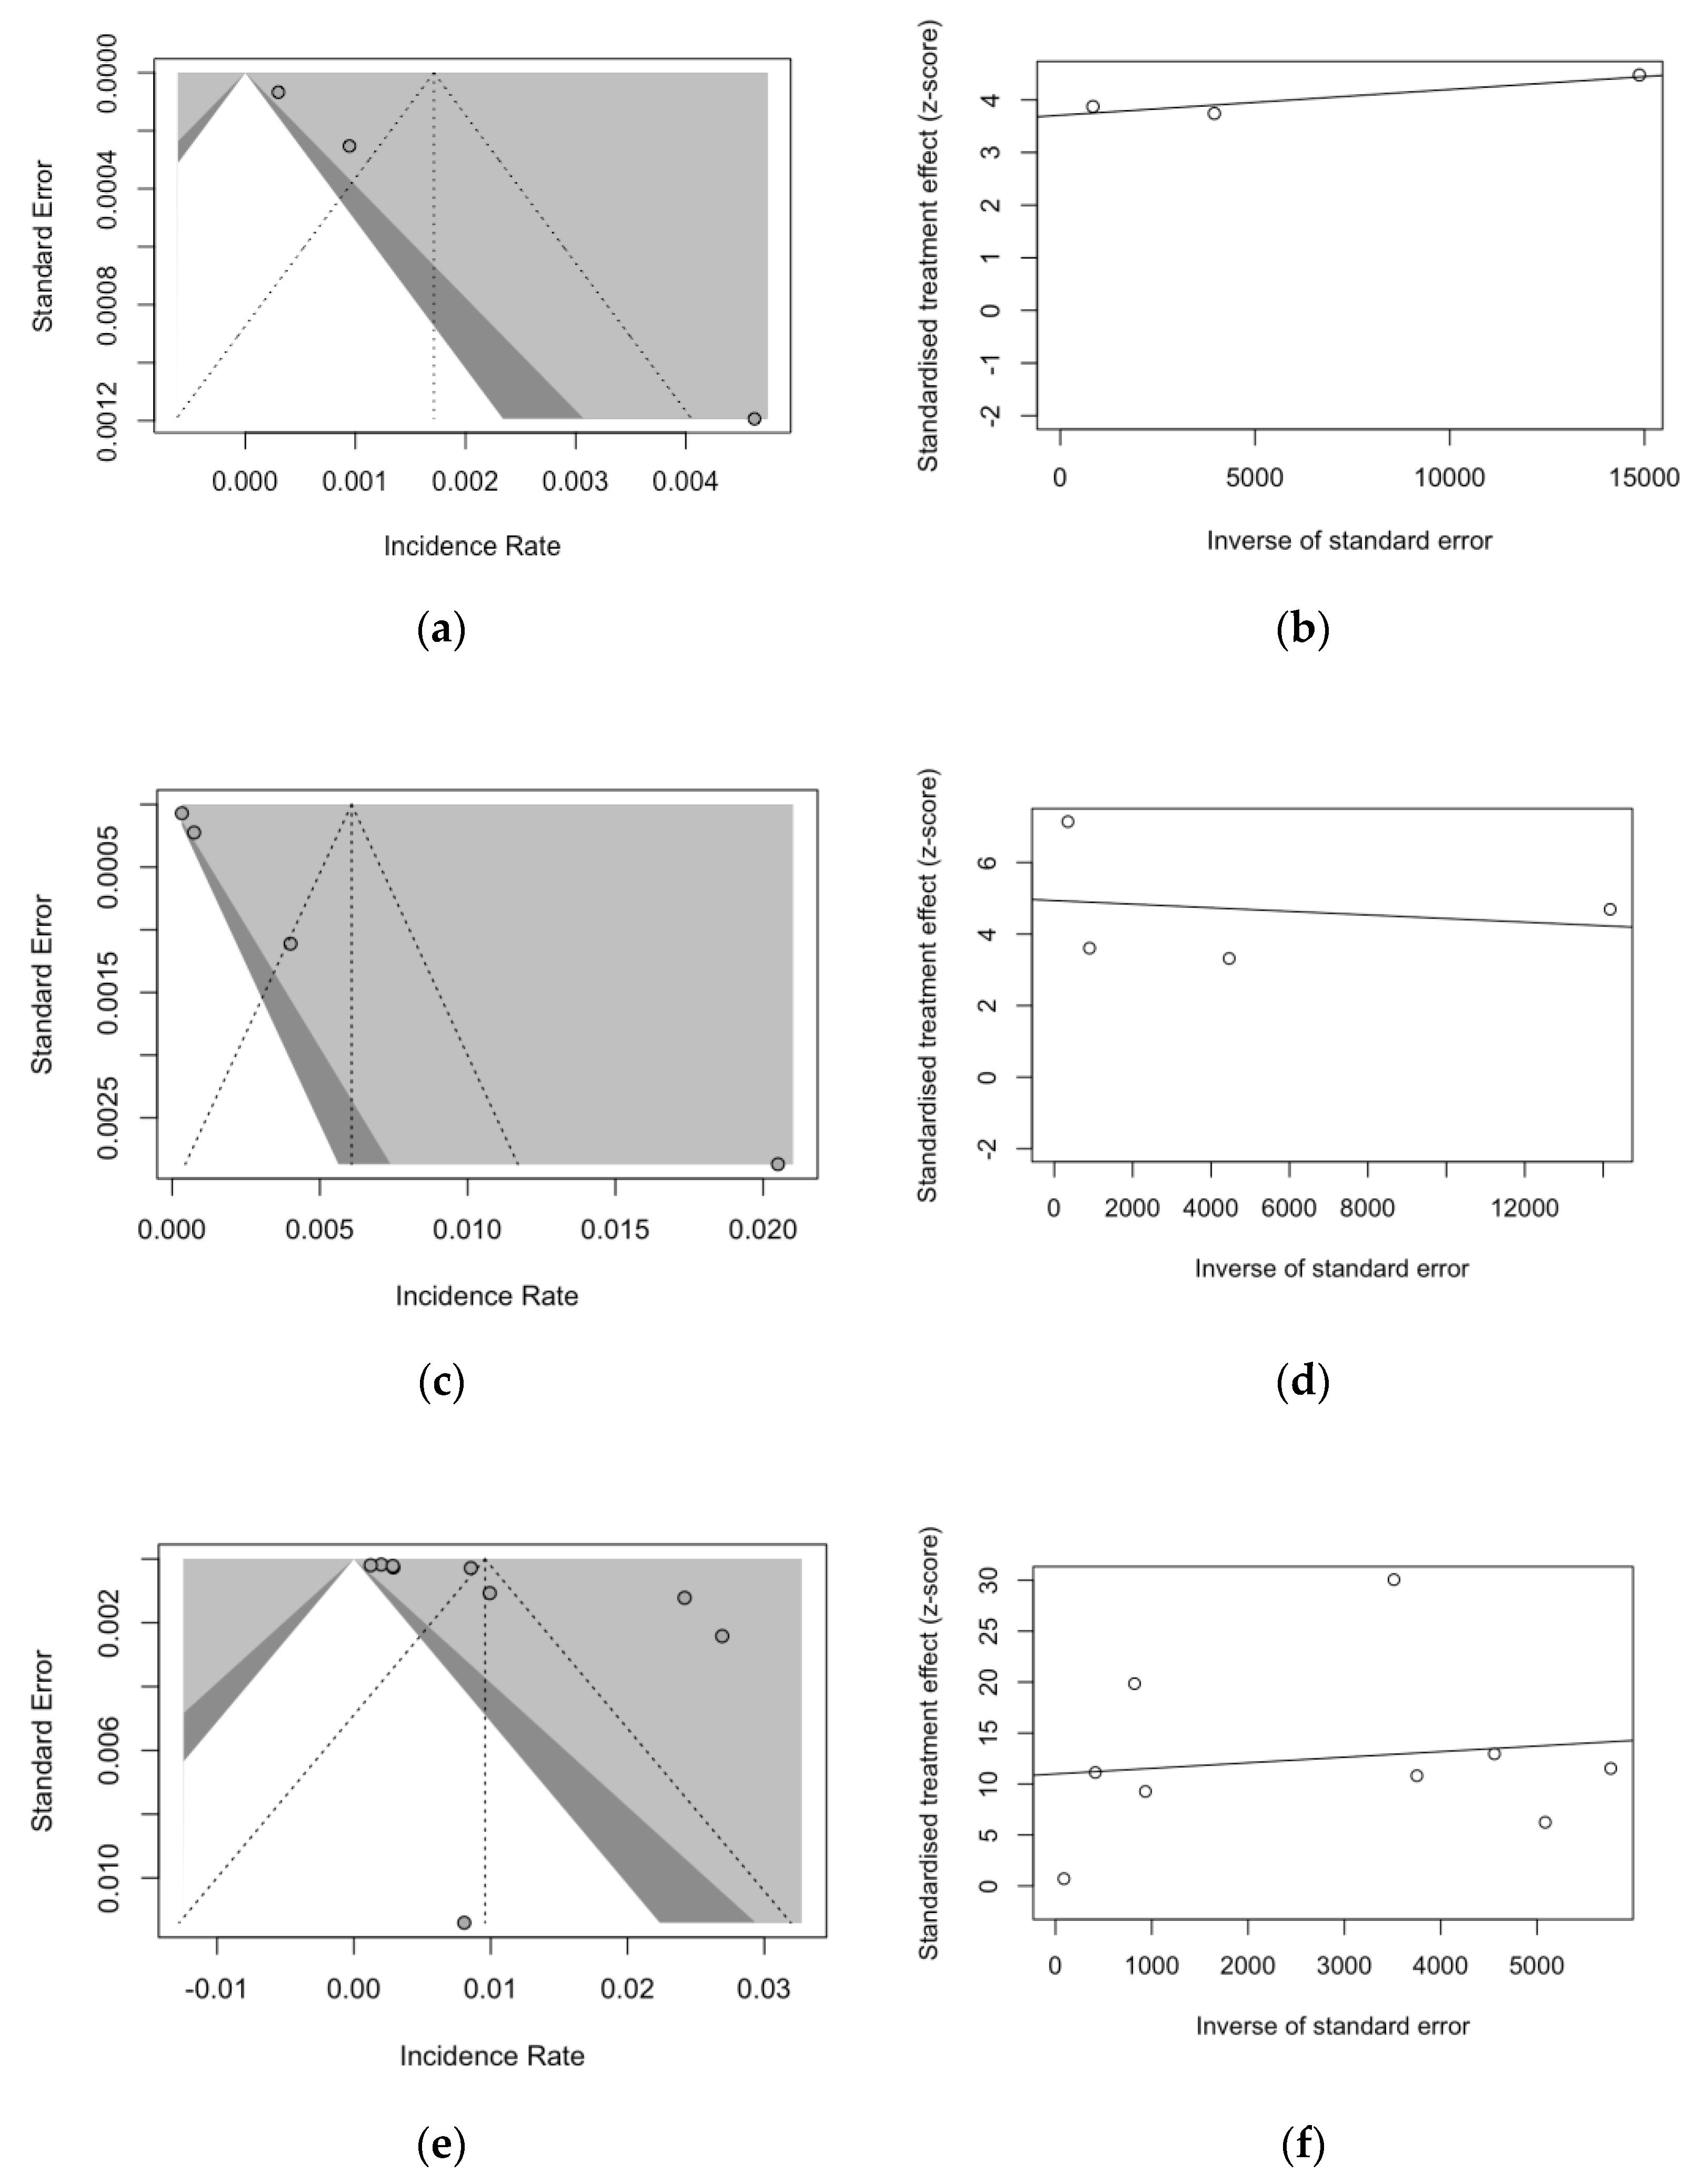
3.11. Analysis of Publication Bias and Small-Study Bias
4. Discussion
4.1. Key Findings
4.2. Generalizability
4.3. Limits and Implications for Future Studies
5. Conclusions
Supplementary Materials
Author Contributions
Funding
Institutional Review Board Statement
Informed Consent Statement
Data Availability Statement
Conflicts of Interest
Appendix A
| Item | Definition |
|---|---|
| Population of interest | Among individuals being assisted in urban shelters for homeless people, |
| Exposure | what is the occurrence (i.e., prevalence and/or incidence) of respiratory syncytial virus infection |
| Control/comparator | in children and adults, compared to influenza virus and SARS-CoV-2 |
| outcome | and the outcome of RSV, influenza and SARS-CoV-2 infections |
| Database | Keywords | N. of Entries |
|---|---|---|
| PubMed | (“Respiratory Syncytial Virus, Human” [Mesh] OR “Respiratory Syncytial Viruses” [Mesh] OR “Respiratory Syncytial Virus Infections” [Mesh] OR “RSV” OR “respiratory infection*” OR “respiratory syncytial virus” OR “Influenza, Human” [Mesh] OR “Influenza B virus” [Mesh] OR “Influenza A virus” [Mesh] OR “Severe acute respiratory syndrome-related coronavirus” [Mesh] OR “Middle East Respiratory Syndrome Coronavirus” [Mesh] OR “Nipah Virus” [Mesh] OR “COVID-19” [Mesh] OR “SARS-CoV-2” [Mesh] OR “COVID-19 Testing” [Mesh] OR “Respiratory Tract Infections” [Mesh]) AND (“Ill-Housed Persons” [Mesh] OR “Homeless Youth” [Mesh] OR “homeless”) | 797 |
| EMBASE | (“pneumovirus’/exp” OR “pneumovirus” OR “pneumovirus infection” OR “human respiratory syncytial virus” OR “respiratory syncytial virus infection” OR “influenza” OR “influenza virus” OR “influenzavirus a” OR “respiratory virus*”) AND (“homelessness” OR “homeless person” OR “homeless youth”) AND (“prevalence” OR “incidence”) | 3210 |
| SCOPUS | (“pneumovirus” OR “pneumovirus infection” OR “human respiratory syncytial virus” OR “respiratory syncytial virus infection” OR “influenza” OR “influenza virus” OR “influenzavirus a” OR “respiratory virus*”) AND (“homelessness” OR “homeless” OR “homeless youth”) AND (prevalence OR incidence) | 775 |
| medRxiv | “respiratory virus*” AND “homeless*” | 188 |
| Item | Definition | Reference |
|---|---|---|
| HP | People who do not have access to accommodation which they can reasonably occupy, whether this accommodation is: (i) legally their own property or whether the property is rented; (ii) provided by institutions; (iii) provided by employers; (iv) occupied rent-free under some contractual or other arrangement. | [1] |
| Homeless Shelter | Temporary residence for HP providing safety conditions and protection from exposure to the weather | [1,4,15,16] |


References
- European Centre for Disease Prevention and Control. Guidance on the Provision of Support for Medically and Socially Vulnerable Populations in EU/EEA Countries and the United Kingdom during the COVID-19 Pandemic Key Messages; European Centre for Disease Prevention and Control: Stockholm, Sweden, 2020. [Google Scholar]
- Ly, T.D.A.; Perieres, L.; Hoang, V.T.; Dao, T.L.; Gautret, P. Pneumococcal Infections and Homelessness. J. Prev. Med. Hyg. 2021, 62, E950–E957. [Google Scholar] [CrossRef]
- Ly, T.D.A.; Dao, T.L.; Hoang, V.T.; Braunstein, D.; Brouqui, P.; Lagier, J.-C.; Parola, P.; Gautret, P. Pattern of Infections in French and Migrant Homeless Hospitalised at Marseille Infectious Disease Units, France: A Retrospective Study, 2017–2018. Travel Med. Infect. Dis. 2020, 36, 101768. [Google Scholar] [CrossRef] [PubMed]
- Ly, T.D.A.; Edouard, S.; Badiaga, S.; Tissot-Dupont, H.; Hoang, V.T.; Pommier de Santi, V.; Brouqui, P.; Raoult, D.; Gautret, P. Epidemiology of Respiratory Pathogen Carriage in the Homeless Population within Two Shelters in Marseille, France, 2015–2017: Cross Sectional 1-Day Surveys. Clin. Microbiol. Infect. 2019, 25, 249.e1–249.e6. [Google Scholar] [CrossRef] [PubMed]
- Ly, T.D.A.; Hoang, V.T.; Goumballa, N.; Louni, M.; Canard, N.; Dao, T.L.; Medkour, H.; Borg, A.; Bardy, K.; Esteves-Vieira, V.; et al. Variations in Respiratory Pathogen Carriage among a Homeless Population in a Shelter for Men in Marseille, France, March–July 2020: Cross-Sectional 1-Day Surveys. Eur. J. Clin. Microbiol. Infect. Dis. 2021, 40, 1579–1582. [Google Scholar] [CrossRef]
- Ly, T.D.A.; Nguyen, N.N.; Hoang, V.T.; Goumballa, N.; Louni, M.; Canard, N.; Dao, T.L.; Medkour, H.; Borg, A.; Bardy, K.; et al. Screening of SARS-CoV-2 among Homeless People, Asylum-Seekers and Other People Living in Precarious Conditions in Marseille, France, March–April 2020. Int. J. Infect. Dis. 2021, 105, 1–6. [Google Scholar] [CrossRef] [PubMed]
- Romaszko, J.; Cymes, I.; Dragańska, E.; Kuchta, R.; Glińska-Lewczuk, K. Mortality among the Homeless: Causes and Meteorological Relationships. PLoS ONE 2017, 12, e0189938. [Google Scholar] [CrossRef]
- Ivers, J.H.; Zgaga, L.; O’Donoghue-Hynes, B.; Heary, A.; Gallwey, B.; Barry, J. Five-Year Standardised Mortality Ratios in a Cohort of Homeless People in Dublin. BMJ Open 2019, 9, e023010. [Google Scholar] [CrossRef]
- Zhu, A.; Bruketa, E.; Svoboda, T.; Patel, J.; Elmi, N.; El-Khechen Richandi, G.; Baral, S.; Orkin, A.M. Respiratory Infectious Disease Outbreaks among People Experiencing Homelessness: A Systematic Review of Prevention and Mitigation Strategies. Ann. Epidemiol. 2023, 77, 127–135. [Google Scholar] [CrossRef]
- Nilsson, S.F.; Hjorthøj, C.R.; Erlangsen, A.; Nordentoft, M. Suicide and Unintentional Injury Mortality among Homeless People: A Danish Nationwide Register-Based Cohort Study. Eur. J. Public Health 2013, 24, 50–56. [Google Scholar] [CrossRef]
- Beijer, U.; Andréasson, A.; Ågren, G.; Fugelstad, A. Mortality, Mental Disorders and Addiction: A 5-Year Follow-Up of 82 Homeless Men in Stockholm. Nord. J. Psychiatry 2007, 61, 363–368. [Google Scholar] [CrossRef]
- Hwang, S.W.; Wilkins, R.; Tjepkema, M.; O’Campo, P.J.; Dunn, J.R. Mortality among Residents of Shelters, Rooming Houses, and Hotels in Canada: 11 Year Follow-up Study. BMJ 2009, 339, 1068. [Google Scholar] [CrossRef] [PubMed]
- Baggett, T.P.; Hwang, S.W.; O’Connell, J.J.; Porneala, B.C.; Stringfellow, E.J.; Orav, E.J.; Singer, D.E.; Rigotti, N.A. Mortality among Homeless Adults in Boston: Shifts in Causes of Death over a 15-Year Period. JAMA Intern. Med. 2013, 173, 189–195. [Google Scholar] [CrossRef]
- Fondation Abbé Pierre. FEANTSA Eight Overview of Housing Exclusion in Europe—2023; Sofiaplan: Brussels, Belgium, 2023. [Google Scholar]
- FEANTSA—The European Federation of National Organisations Working with the Homeless. The State of Emergency Shelters the Magazine of FEANTSA—The European Federation of National Organisations Working with the Homeless AISBL; Homeless in Europe: Brussels, Belgium, 2019. [Google Scholar]
- National Alliance to End Homelessness. State of Homelessness: 2023 Edition; National Alliance to End Homelessness: Washington, DC, USA, 2023. [Google Scholar]
- Badiaga, S.; Richet, H.; Azas, P.; Zandotti, C.; Rey, F.; Charrel, R.; Benabdelkader, E.H.; Drancourt, M.; Raoult, D.; Brouqui, P. Contribution of a Shelter-Based Survey for Screening Respiratory Diseases in the Homeless. Eur. J. Public Health 2009, 19, 157–160. [Google Scholar] [CrossRef]
- Thiberville, S.D.; Salez, N.; Benkouiten, S.; Badiaga, S.; Charrel, R.; Brouqui, P. Respiratory Viruses within Homeless Shelters in Marseille, France. BMC Res. Notes 2014, 7, 81. [Google Scholar] [CrossRef]
- Rogers, J.H.; Hawes, S.E.; Wolf, C.R.; Hughes, J.P.; Englund, J.A.; Starita, L.M.; Chu, H.Y. Care-Seeking Correlates of Acute Respiratory Illness among Sheltered Adults Experiencing Homelessness in Seattle, WA, 2019: A Community-Based Cross-Sectional Study. Front. Public Health 2023, 11, 1090148. [Google Scholar] [CrossRef]
- McCulloch, D.J.; Rogers, J.H.; Wang, Y.; Chow, E.J.; Link, A.C.; Wolf, C.R.; Uyeki, T.M.; Rolfes, M.A.; Mosites, E.; Sereewit, J.; et al. Respiratory Syncytial Virus and Other Respiratory Virus Infections in Residents of Homeless Shelters—King County, Washington, 2019–2021. Influenza Other Respir Viruses 2023, 17, e13166. [Google Scholar] [CrossRef]
- Chow, E.J.; Casto, A.M.; Rogers, J.H.; Roychoudhury, P.; Han, P.D.; Xie, H.; Mills, M.G.; Nguyen, T.V.; Pfau, B.; Cox, S.N.; et al. The Clinical and Genomic Epidemiology of Seasonal Human Coronaviruses in Congregate Homeless Shelter Settings: A Repeated Cross-Sectional Study. Lancet Reg. Health—Am. 2022, 15, 100348. [Google Scholar] [CrossRef] [PubMed]
- Tan De Bibiana, J.; Rossi, C.; Rivest, P.; Zwerling, A.; Thibert, L.; McIntosh, F.; Behr, M.A.; Menzies, D.; Schwartzman, K. Tuberculosis and Homelessness in Montreal: A Retrospective Cohort Study. BMC Public Health 2011, 11, 833. [Google Scholar] [CrossRef] [PubMed]
- Aldridge, R.W.; Hayward, A.C.; Hemming, S.; Yates, S.K.; Ferenando, G.; Possas, L.; Garber, E.; Watson, J.M.; Geretti, A.M.; Mchugh, T.D.; et al. High Prevalence of Latent Tuberculosis and Bloodborne Virus Infection in a Homeless Population. Thorax 2018, 73, 557–564. [Google Scholar] [CrossRef]
- Self, J.L.; McDaniel, C.J.; Bamrah Morris, S.; Silk, B.J. Estimating and Evaluating Tuberculosis Incidence Rates among People Experiencing Homelessness, United States, 2007–2016. Med. Care 2021, 59, S175–S181. [Google Scholar] [CrossRef]
- Tibbetts, K.K.; Ottoson, R.A.; Tsukayama, D.T. Public Health Response to Tuberculosis Outbreak among Persons Experiencing Homelessness, Minneapolis, Minnesota, USA, 2017–2018. Emerg. Infect. Dis. 2020, 26, 420–426. [Google Scholar] [CrossRef] [PubMed]
- Metcalf, B.J.; Chochua, S.; Walker, H.; Tran, T.; Li, Z.; Varghese, J.; Vagnone, P.M.S.; Lynfield, R.; McGee, L.; Li, Y.; et al. Invasive Pneumococcal Strain Distributions and Isolate Clusters Associated with Persons Experiencing Homelessness during 2018. Clin. Infect. Dis. 2021, 72, E948–E956. [Google Scholar] [CrossRef] [PubMed]
- Mosites, E.; Zulz, T.; Bruden, D.; Nolen, L.; Frick, A.; Castrodale, L.; McLaughlin, J.; van Beneden, C.; Hennessy, T.W.; Bruce, M.G. Risk for Invasive Streptococcal Infections among Adults Experiencing Homelessness, Anchorage, Alaska, USA, 2002–2015. Emerg. Infect. Dis. 2019, 25, 1903–1910. [Google Scholar] [CrossRef]
- Steinberg, J.; Bressler, S.S.; Orell, L.; Thompson, G.C.; Kretz, A.; Reasonover, A.L.; Bruden, D.; Bruce, M.G.; Fischer, M. Invasive Pneumococcal Disease and Potential Impact of Pneumococcal Conjugate Vaccines among Adults, including Persons Experiencing Homelessness—Alaska, 2011–2020. Clin. Infect. Dis. 2023, ciad597, Epub ahead of print. [Google Scholar] [CrossRef]
- Beall, B.; Chochua, S.; Li, Z.; Tran, T.; Varghese, J.; McGee, L.; Li, Y.; Metcalf, B.J. Invasive Pneumococcal Disease Clusters Disproportionally Impact Persons Experiencing Homelessness, Injecting Drug Users, and the Western United States. J. Infect. Dis. 2022, 226, 332–341. [Google Scholar] [CrossRef]
- Rudmann, K.C.; Brown, N.E.; Rubis, A.B.; Burns, M.; Ramsey, A.; de Las Nueces, D.; Martin, T.; Barnes, M.; Davizon, E.S.; Retchless, A.C.; et al. Invasive Meningococcal Disease among People Experiencing Homelessness—United States, 2016–2019. J. Infect. Dis. 2022, 226, S322–S326. [Google Scholar] [CrossRef]
- Dellicour, S.; Greenwood, B. Systematic Review: Impact of Meningococcal Vaccination on Pharyngeal Carriage of Meningococci. Trop. Med. Int. Health 2007, 12, 1409–1421. [Google Scholar] [CrossRef]
- Finn, A.; Morales-Aza, B.; Sikora, P.; Giles, J.; Lethem, R.; Marlais, M.; Thors, V.; Pollard, A.J.; Faust, S.; Heath, P.; et al. Density Distribution of Pharyngeal Carriage of Meningococcus in Healthy Young Adults. Pediatr. Infect. Dis. J. 2016, 35, 1080–1085. [Google Scholar] [CrossRef] [PubMed]
- Riccò, M.; Vezzosi, L.; Odone, A.; Signorelli, C. Invasive Meningococcal Disease on the Workplaces: A Systematic Review. Acta Biomed. 2017, 88, 337–351. [Google Scholar] [PubMed]
- Harnisch, J.P.; Tronca, E.; Nolan, C.M.; Turck, M.; Holmes, K.K. Diphtheria among Alcoholic Urban Adults A Decade of Experience in Seattle. Ann. Intern. Med. 1989, 111, 71–82. [Google Scholar] [CrossRef] [PubMed]
- Luo, W.; Liu, Q.; Zhou, Y.; Ran, Y.; Liu, Z.; Hou, W.; Pei, S.; Lai, S. Spatiotemporal Variations of “Triple-Demic” Outbreaks of Respiratory Infections in the United States in the Post-COVID-19 Era. BMC Public Health 2023, 23, 2452. [Google Scholar] [CrossRef]
- Patel, T.A.; Jain, B.; Raifman, J. Revamping Public Health Systems: Lessons Learned from the Tripledemic. Am. J. Prev. Med. 2023, 66, 185–188. [Google Scholar] [CrossRef]
- European Centre for Disease Prevention and Control. European Centre for Disease Prevention and Control Acute Respiratory Infections in the EU/EEA: Epidemiological Update and Current Public Health Recommendations; European Centre for Disease Prevention and Control: Stockholm, Sweden, 2023. [Google Scholar]
- World Health Organization—Regional Office for Europe. How Coronavirus Disease Has Changed the Environment and Health Landscape, 1st ed.; World Health Organization—Regional Office for Europe: Geneva, Switzerland, 2023; ISBN 9789289060189. [Google Scholar]
- World Health Organization (WHO). COVID-19 Epidemiological Update—Edition 162; WHO: Geneva, Switzerland, 2023. [Google Scholar]
- Ghinai, I.; Davis, E.S.; Mayer, S.; Toews, K.A.; Huggett, T.D.; Snow-Hill, N.; Perez, O.; Hayden, M.K.; Tehrani, S.; Landi, A.J.; et al. Risk Factors for Severe Acute Respiratory Syndrome Coronavirus 2 Infection in Homeless Shelters in Chicago, Illinois—March–May, 2020. Open Forum Infect. Dis. 2020, 7, ofaa477. [Google Scholar] [CrossRef]
- Eriksen, A.R.R.; Fogh, K.; Hasselbalch, R.B.; Bundgaard, H.; Nielsen, S.D.; Jørgensen, C.S.; Scharff, B.F.S.S.; Erikstrup, C.; Sækmose, S.G.; Holm, D.K.; et al. SARS-CoV-2 Antibody Prevalence among Homeless People and Shelter Workers in Denmark: A Nationwide Cross-Sectional Study. BMC Public Health 2022, 22, 1261. [Google Scholar] [CrossRef]
- Kiran, T.; Craig-Neil, A.; Das, P.; Lockwood, J.; Wang, R.; Nathanielsz, N.; Rosenthal, E.; Snider, C.; Hwang, S.W. Factors Associated with SARS-CoV-2 Positivity in 20 Homeless Shelters in Toronto, Canada, from April to July 2020: A Repeated Cross-Sectional Study. CMAJ Open 2021, 9, E302–E308. [Google Scholar] [CrossRef]
- Bucher, S.J.; Brickner, P.W.; Vincent, R.L. Influenzalike Illness among Homeless Persons. Emerg. Infect. Dis. 2006, 12, 1162–1163. [Google Scholar] [CrossRef]
- Rogers, J.H.; Casto, A.M.; Nwanne, G.; Link, A.C.; Martinez, M.A.; Nackviseth, C.; Wolf, C.R.; Hughes, J.P.; Englund, J.A.; Sugg, N.; et al. Results from a Test-and-Treat Study for Influenza among Residents of Homeless Shelters in King County, WA: A Stepped-Wedge Cluster-Randomized Trial. Influenza Other Respir. Viruses 2023, 17, e13092. [Google Scholar] [CrossRef] [PubMed]
- Newman, K.L.; Rogers, J.H.; McCulloch, D.; Wilcox, N.; Englund, J.A.; Boeckh, M.; Uyeki, T.M.; Jackson, M.L.; Starita, L.; Hughes, J.P.; et al. Point-of-Care Molecular Testing and Antiviral Treatment of Influenza in Residents of Homeless Shelters in Seattle, WA: Study Protocol for a Stepped-Wedge Cluster-Randomized Controlled Trial. Trials 2020, 21, 956. [Google Scholar] [CrossRef] [PubMed]
- Shi, T.; McAllister, D.A.; O’Brien, K.L.; Simoes, E.A.F.; Madhi, S.A.; Gessner, B.D.; Polack, F.P.; Balsells, E.; Acacio, S.; Aguayo, C.; et al. Global, Regional, and National Disease Burden Estimates of Acute Lower Respiratory Infections Due to Respiratory Syncytial Virus in Young Children in 2015: A Systematic Review and Modelling Study. Lancet 2017, 390, 946–958. [Google Scholar] [CrossRef]
- Shi, T.; Denouel, A.; Tietjen, A.K.; Campbell, I.; Moran, E.; Li, X.; Campbell, H.; Demont, C.; Nyawanda, B.O.; Chu, H.Y.; et al. Global Disease Burden Estimates of Respiratory Syncytial Virus-Associated Acute Respiratory Infection in Older Adults in 2015: A Systematic Review and Meta-Analysis. J. Infect. Dis. 2021, 222, S577–S583. [Google Scholar] [CrossRef] [PubMed]
- Li, Y.; Wang, X.; Blau, D.M.; Caballero, M.T.; Feikin, D.R.; Gill, C.J.; Madhi, S.A.; Omer, S.B.; Simões, E.A.F.; Campbell, H.; et al. Global, Regional, and National Disease Burden Estimates of Acute Lower Respiratory Infections Due to Respiratory Syncytial Virus in Children Younger than 5 Years in 2019: A Systematic Analysis. Lancet 2022, 399, 2047–2064. [Google Scholar] [CrossRef]
- Rima, B.; Collins, P.; Easton, A.; Fouchier, R.; Kurath, G.; Lamb, R.A.; Lee, B.; Maisner, A.; Rota, P.; Wang, L. ICTV Virus Taxonomy Profile: Pneumoviridae. J. Gen. Virol. 2017, 98, 2912–2913. [Google Scholar] [CrossRef]
- Nair, H.; Theodoratou, E.; Rudan, I.; Nokes, D.J.; Ngama HND, M.; Munywoki, P.K.; Dherani, M.; Nair, H.; James Nokes, D.; Gessner, B.D.; et al. Global Burden of Acute Lower Respiratory Infections Due to Respiratory Syncytial Virus in Young Children: A Systematic Review and Meta-Analysis. Lancet 2010, 375, 1545–1555. [Google Scholar] [CrossRef]
- Cong, B.; Koç, U.; Bandeira, T.; Bassat, Q.; Bont, L.; Chakhunashvili, G.; Cohen, C.; Desnoyers, C.; Hammitt, L.L.; Heikkinen, T.; et al. Changes in the Global Hospitalisation Burden of Respiratory Syncytial Virus in Young Children during the COVID-19 Pandemic: A Systematic Analysis. Lancet Infect. Dis. 2023. Epub ahead of print. [Google Scholar] [CrossRef] [PubMed]
- Del Riccio, M.; Spreeuwenberg, P.; Osei-Yeboah, R.; Johannesen, C.K.; Fernandez, L.V.; Teirlinck, A.C.; Wang, X.; Heikkinen, T.; Bangert, M.; Caini, S.; et al. Burden of Respiratory Syncytial Virus in the European Union: Estimation of RSV-Associated Hospitalizations in Children under 5 Years. J. Infect. Dis. 2023, 228, 1528–1538. [Google Scholar] [CrossRef]
- Osei-Yeboah, R.; Spreeuwenberg, P.; del Riccio, M.; Fischer, T.K.; Egeskov-Cavling, A.M.; Bøås, H.; van Boven, M.; Wang, X.; Lehtonen, T.; Bangert, M.; et al. Estimation of the Number of Respiratory Syncytial Virus–Associated Hospitalizations in Adults in the European Union. J. Infect. Dis. 2023, 228, 1539–1548. [Google Scholar] [CrossRef] [PubMed]
- Stamm, P.; Sagoschen, I.; Weise, K.; Plachter, B.; Münzel, T.; Gori, T.; Vosseler, M. Influenza and RSV Incidence during COVID-19 Pandemic—An Observational Study from in-Hospital Point-of-Care Testing. Med. Microbiol. Immunol. 2021, 210, 277–282. [Google Scholar] [CrossRef] [PubMed]
- Riccò, M.; Ferraro, P.; Peruzzi, S.; Zaniboni, A.; Satta, E.; Ranzieri, S. Excess Mortality on Italian Small Islands during the SARS-CoV-2 Pandemic: An Ecological Study. Infect Dis Rep. 2022, 14, 391–412. [Google Scholar] [CrossRef]
- Varela, F.H.; Scotta, M.C.; Polese-Bonatto, M.; Sartor, I.T.S.; Ferreira, C.F.; Fernandes, I.R.; Zavaglia, G.O.; de Almeida, W.A.F.; Arakaki-Sanchez, D.; Pinto, L.A.; et al. Absence of Detection of RSV and Influenza during the COVID-19 Pandemic in a Brazilian Cohort: Likely Role of Lower Transmission in the Community. J. Glob. Health 2021, 11, 05007. [Google Scholar] [CrossRef]
- Du, Y.; Yan, R.; Wu, X.; Zhang, X.; Chen, C.; Jiang, D.; Yang, M.; Cao, K.; Chen, M.; You, Y.; et al. Global Burden and Trends of Respiratory Syncytial Virus Infection across Different Age Groups from 1990 to 2019: A Systematic Analysis of the Global Burden of Disease 2019 Study. Int. J. Infect. Dis. 2023, 135, 70–76. [Google Scholar] [CrossRef]
- Abbas, S.; Raybould, J.E.; Sastry, S.; de la Cruz, O. Respiratory Viruses in Transplant Recipients: More than Just a Cold. Clinical Syndromes and Infection Prevention Principles. Int. J. Infect. Dis. 2017, 62, 86–93. [Google Scholar] [CrossRef] [PubMed]
- Allen, K.E.; Beekmann, S.E.; Polgreen, P.; Poser, S.; St. Pierre, J.; Santibañez, S.; Gerber, S.I.; Kim, L. Survey of Diagnostic Testing for Respiratory Syncytial Virus (RSV) in Adults: Infectious Disease Physician Practices and Implications for Burden Estimates. Diagn. Microbiol. Infect. Dis. 2018, 92, 206–209. [Google Scholar] [CrossRef] [PubMed]
- Quarg, C.; Jörres, R.A.; Engelhardt, S.; Alter, P.; Budweiser, S. Characteristics and outcomes of patients hospitalized for infection with influenza, SARS-CoV-2 or respiratory syncytial virus in the season 2022/2023 in a large German primary care centre. Eur. J. Med. Res. 2023, 28, 568. [Google Scholar] [CrossRef] [PubMed]
- Baraldi, E.; Checcucci Lisi, G.; Costantino, C.; Heinrichs, J.H.; Manzoni, P.; Riccò, M.; Roberts, M.; Vassilouthis, N. RSV Disease in Infants and Young Children: Can We See a Brighter Future? Hum. Vaccin. Immunother. 2022, 18, 2079322. [Google Scholar] [CrossRef] [PubMed]
- Bozzola, E.; Ciarlitto, C.; Guolo, S.; Brusco, C.; Cerone, G.; Antilici, L.; Schettini, L.; Piscitelli, A.L.; Chiara Vittucci, A.; Cutrera, R.; et al. Respiratory Syncytial Virus Bronchiolitis in Infancy: The Acute Hospitalization Cost. Front. Pediatr. 2021, 8, 594898. [Google Scholar] [CrossRef] [PubMed]
- Rha, B.; Curns, A.T.; Lively, J.Y.; Campbell, A.P.; Englund, J.A.; Boom, J.A.; Azimi, P.H.; Weinberg, G.A.; Staat, M.A.; Selvarangan, R.; et al. Respiratory Syncytial Virus-Associated Hospitalizations among Young Children: 2015–2016. Pediatrics 2020, 146, e20193611. [Google Scholar] [CrossRef] [PubMed]
- Leader, S.; Kohlhase, K. Respiratory Syncytial Virus-Coded Pediatric Hospitalizations, 1997 to 1999. Pediatr. Infect. Dis. J. 2002, 21, 629–661. [Google Scholar] [CrossRef]
- Na’amnih, W.; Kassem, E.; Tannous, S.; Kagan, V.; Jbali, A.; Hanukayev, E.; Freimann, S.; Obolski, U.; Muhsen, K. Incidence and Risk Factors of Hospitalisations for Respiratory Syncytial Virus among Children Aged Less than Two Years. Epidemiol. Infect. 2022, 150, e45. [Google Scholar] [CrossRef]
- Jans, J.; Wicht, O.; Widjaja, I.; Ahout, I.M.L.; de Groot, R.; Guichelaar, T.; Luytjes, W.; de Jonge, M.I.; de Haan, C.A.M.; Ferwerda, G. Characteristics of RSV-Specific Maternal Antibodies in Plasma of Hospitalized, Acute RSV Patients under Three Months of Age. PLoS ONE 2017, 12, e0170877. [Google Scholar] [CrossRef]
- Chida-Nagai, A.; Sato, H.; Sato, I.; Shiraishi, M.; Sasaki, D.; Izumi, G.; Yamazawa, H.; Cho, K.; Manabe, A.; Takeda, A. Risk Factors for Hospitalisation Due to Respiratory Syncytial Virus Infection in Children Receiving Prophylactic Palivizumab. Eur. J. Pediatr. 2022, 181, 539–547. [Google Scholar] [CrossRef]
- Esposito, S.; Abu Raya, B.; Baraldi, E.; Flanagan, K.; Martinon Torres, F.; Tsolia, M.; Zielen, S. RSV Prevention in All Infants: Which Is the Most Preferable Strategy? Front. Immunol. 2022, 13, 880368. [Google Scholar] [CrossRef] [PubMed]
- Nowalk, M.P.; D’Agostino, H.; Dauer, K.; Stiegler, M.; Zimmerman, R.K.; Balasubramani, G.K. Estimating the Burden of Adult Hospitalized RSV Infection including Special Populations. Vaccine 2022, 40, 4121–4127. [Google Scholar] [CrossRef]
- Falsey, A.R.; Hennessey, P.A.; Formica, M.A.; Cox, C.; Walsh, E.E. Respiratory Syncytial Virus Infection in Elderly and High-Risk Adults. N. Engl. J. Med. 2005, 352, 1749–1759. [Google Scholar] [CrossRef] [PubMed]
- Surie, D.; Yuengling, K.A.; Decuir, J.; Zhu, Y.; Gaglani, M.; Ginde, A.A.; Keipp Talbot, H.; Casey, J.D.; Mohr, N.M.; Ghamande, S.; et al. Disease Severity of Respiratory Syncytial Virus Compared with COVID-19 and Influenza among Hospitalized Adults Aged ≥60 Years—IVY Network, 20 U.S. States, February 2022–May 2023. Morb. Mortal. Wkly. Rev. 2023, 72, 1083–1088. [Google Scholar] [CrossRef]
- Richard, L.; Nisenbaum, R.; Brown, M.; Liu, M.; Pedersen, C.; Jenkinson, J.I.R.; Mishra, S.; Baral, S.; Colwill, K.; Gingras, A.C.; et al. Incidence of SARS-CoV-2 Infection among People Experiencing Homelessness in Toronto, Canada. JAMA Netw. Open 2023, 6, e232774. [Google Scholar] [CrossRef] [PubMed]
- Knight, K.R.; Duke, M.R.; Carey, C.A.; Pruss, G.; Garcia, C.M.; Lightfoot, M.; Imbert, E.; Kushel, M. COVID-19 Testing and Vaccine Acceptability among Homeless-Experienced Adults: Qualitative Data from Two Samples. J. Gen. Intern. Med. 2022, 37, 823–829. [Google Scholar] [CrossRef]
- McCosker, L.K.; El-Heneidy, A.; Seale, H.; Ware, R.S.; Downes, M.J. Strategies to Improve Vaccination Rates in People Who Are Homeless: A Systematic Review. Vaccine 2022, 40, 3109–3126. [Google Scholar] [CrossRef] [PubMed]
- O’Leary, S.T.; Yonts, A.B.; Gaviria-Agudelo, C.; Kimberlin, D.W.; Paulsen, G.C. Summer 2023 ACIP Update: RSV Prevention and Updated Recommendations on Other Vaccines. Pediatrics 2023, 152, e2023063955. [Google Scholar] [CrossRef]
- Walsh, E.E.; Pérez Marc, G.; Zareba, A.M.; Falsey, A.R.; Jiang, Q.; Patton, M.; Polack, F.P.; Llapur, C.; Doreski, P.A.; Ilangovan, K.; et al. Efficacy and Safety of a Bivalent RSV Prefusion F Vaccine in Older Adults. N. Engl. J. Med. 2023, 388, 1465–1477. [Google Scholar] [CrossRef]
- Vidal Valero, M. “A Good Day”: FDA Approves World’s First RSV Vaccine. Nature 2023, 617, 234–235. [Google Scholar] [CrossRef]
- Bouzid, D.; Visseaux, B.; Ferré, V.M.; Peiffer-Smadja, N.; Le Hingrat, Q.; Loubet, P. Respiratory Syncytial Virus in Adults with Comorbidities: An Update on Epidemiology, Vaccines, and Treatments. Clin. Microbiol. Infect. 2023, 29, 1538–1550. [Google Scholar] [CrossRef] [PubMed]
- Lee, C.Y.F.; Khan, S.J.; Vishal, F.; Alam, S.; Murtaza, S.F. Respiratory Syncytial Virus Prevention: A New Era of Vaccines. Cureus 2023, 15, e45012. [Google Scholar] [CrossRef] [PubMed]
- Melgar, M.; Britton, A.; Roper, L.E.; Keipp Talbot, H.; Long, S.S.; Kotton, C.N.; Havers, F.P. Use of Respiratory Syncytial Virus Vaccines in Older Adults: Recommendations of the Advisory Committee on Immunization Practices-United States, 2023. MMWR Morb. Mortal. Wkly. Rep. 2023, 72, 793–801. [Google Scholar] [CrossRef] [PubMed]
- Fleming-Dutra, K.E.; Jones, J.M.; Roper, L.E.; Prill, M.M.; Ortega-Sanchez, I.R.; Moulia, D.L.; Wallace, M.; Godfrey, M.; Broder, K.R.; Tepper, N.K.; et al. Use of the Pfizer Respiratory Syncytial Virus Vaccine During Pregnancy for the Prevention of Respiratory Syncytial Virus-Associated Lower Respiratory Tract. Disease in Infants: Recommendations of the Advisory Committee on Immunization Practices-United States, 2023. Morb. Mortal. Wkly. Rep. 2023, 72, 1115–1122. [Google Scholar]
- Moher, D.; Liberati, A.; Tetzlaff, J.; Altman, D.G.; Altman, D.; Antes, G.; Atkins, D.; Barbour, V.; Barrowman, N.; Berlin, J.A.; et al. Preferred Reporting Items for Systematic Reviews and Meta-Analyses: The PRISMA Statement. PLoS Med. 2009, 6, e1000097. [Google Scholar] [CrossRef]
- Morgan, R.L.; Whaley, P.; Thayer, K.A.; Schünemann, H.J. Identifying the PECO: A Framework for Formulating Good Questions to Explore the Association of Environmental and Other Exposures with Health Outcomes. Environ. Int. 2018, 121, 1027–1031. [Google Scholar] [CrossRef]
- Mintzker, Y.; Blum, D.; Adler, L. Replacing PICO in Non-Interventional Studies. BMJ Evid. Based Med. 2022, 28, 284. [Google Scholar] [CrossRef] [PubMed]
- Rethlefsen, M.L.; Kirtley, S.; Waffenschmidt, S.; Ayala, A.P.; Moher, D.; Page, M.J.; Koffel, J.B. PRISMA-S: An Extension to the PRISMA Statement for Reporting Literature Searches in Systematic Reviews. Syst. Rev. 2021, 10, 39. [Google Scholar] [CrossRef]
- Von Hippel, P.T. The Heterogeneity Statistic I2 Can Be Biased in Small Meta-Analyses. BMC Med. Res. Methodol. 2015, 15, 35. [Google Scholar] [CrossRef]
- Krumpal, I. Determinants of Social Desirability Bias in Sensitive Surveys: A Literature Review. Qual. Quant. 2013, 47, 2025–2047. [Google Scholar] [CrossRef]
- Office of Health Assessment and Translation (OHAT). Handbook for Conducting a Literature-Based Health Assessment Using OHAT Approach for Systematic Review and Evidence Integration; Office of Health Assessment and Translation (OHAT): Research Triangle Park, NC, USA, 2019. Available online: https://ntp.niehs.nih.gov/sites/default/files/ntp/ohat/pubs/handbookmarch2019_508.pdf (accessed on 17 November 2023).
- Eick, S.M.; Goin, D.E.; Chartres, N.; Lam, J.; Woodruff, T.J. Assessing Risk of Bias in Human Environmental Epidemiology Studies Using Three Tools: Different Conclusions from Different Tools. Syst. Rev. 2020, 9, 249. [Google Scholar] [CrossRef] [PubMed]
- Higgins, J.P.T.; Thompson, S.G.; Spiegelhalter, D.J. A Re-Evaluation of Random-Effects Meta-Analysis. J. R. Stat. Soc. Ser. A Stat. Soc. 2008, 172, 137–159. [Google Scholar] [CrossRef] [PubMed]
- Higgins, J.P.T.; Thompson, S.G.; Deeks, J.J.; Altman, D.G. Measuring Inconsistency in Meta-Analyses. Br. Med. J. 2003, 327, 557–560. [Google Scholar] [CrossRef]
- Begg, C.B.; Mazumdar, M. Operating Characteristics of a Rank Correlation Test for Publication Bias. Biometrics 1994, 50, 1088–1101. [Google Scholar] [CrossRef]
- R Development Core Team. R a Language and Environment for Statistical Computing: Reference Index; R Foundation for Statistical Computing: Vienna, Austria, 2010; ISBN 3900051070. [Google Scholar]
- Haddaway, N.R.; Page, M.J.; Pritchard, C.C.; McGuinness, L.A. PRISMA2020: An R Package and Shiny App for Producing PRISMA 2020-Compliant Flow Diagrams, with Interactivity for Optimised Digital Transparency and Open Synthesis. Campbell Syst. Rev. 2022, 18, e1230. [Google Scholar] [CrossRef] [PubMed]
- Wiersma, P.; Epperson, S.; Terp, S.; LaCourse, S.; Finton, B.; Drenzek, C.; Arnold, K.; Finelli, L. Episodic Illness, Chronic Disease, and Health Care Use among Homeless Persons in Metropolitan Atlanta, Georgia, 2007. South. Med. J. 2010, 103, 18–24. [Google Scholar] [CrossRef]
- Turner, P.; Turner, C.; Watthanaworawit, W.; Carrara, V.; Cicelia, N.; Deglise, C.; Phares, C.; Ortega, L.; Nosten, F. Respiratory Virus Surveillance in Hospitalised Pneumonia Patients on the Thailand-Myanmar Border. BMC Infect. Dis. 2013, 13, 434. [Google Scholar] [CrossRef]
- Yoon, J.C.; Morris, S.; Schmit, K.; Hernandez, A.; Montgomery, M.; Ko, J.; Boyd, A.T.; Buff, A.; Flowers, N.; Jamison, C.; et al. 436. Assessing SARS-CoV-2 Infection among Persons Experiencing—Atlanta, GA, 2020. Open Forum Infect. Dis. 2020, 7, S285–S286. [Google Scholar] [CrossRef]
- Husain, M.; Rachline, A.; Cousien, A.; Rolland, S.; Rouzaud, C.; Ferre, V.M.; Gomez, M.V.; Le Teurnier, M.; Wicky-Thisse, M.; Descamps, D.; et al. Impact of the COVID-19 Pandemic on the Homeless: Results from a Retrospective Closed Cohort in France (March–May 2020). Clin. Microbiol. Infect. 2021, 27, 1520.e1–1520.e5. [Google Scholar] [CrossRef]
- Oette, M.; Corpora, S.; Laudenberg, M.; Bewermeier, F.; Kaiser, R.; Klein, F.; Heger, E. COVID-19 Und Obdachlosigkeit: Niedrige Impfquote, Hohe Prävalenz. Dtsch. Arztebl. Int. 2022, 119, 603–604. [Google Scholar] [CrossRef]
- Oette, M.; Corpora, S.; Baron, M.; Laudenberg, M.; Kaiser, R.; Klein, F.; Heger, E. Kurzmitteilung: Prävalenz von SARS-CoV-2-Infektionen Bei Wohnungslosen Menschen in Köln. Dtsch. Arztebl. Int. 2021, 118, 678–679. [Google Scholar] [CrossRef]
- Generaal, E.; van Santen, D.K.; Campman, S.L.; Booij, M.J.; Price, D.; Buster, M.; van Dijk, C.; Boyd, A.; Bruisten, S.M.; van Dam, A.P.; et al. Low Prevalence of Current and Past SARSCoV-2 Infections among Visitors and Staff Members of Homelessness Services in Amsterdam at the End of the Second Wave of Infections in the Netherlands. PLoS ONE 2023, 18, e0288610. [Google Scholar] [CrossRef]
- Rowan, S.E.; McCormick, D.W.; Wendel, K.A.; Scott, T.; Chavez-Van De Hey, J.; Wilcox, K.; Stella, S.A.; Kamis, K.; Burman, W.J.; Marx, G.E. Lower Prevalence of Severe Acute Respiratory Syndrome Coronavirus 2 (SARS-CoV-2) Infection among People Experiencing Homelessness Tested in Outdoor Encampments Compared with Overnight Shelters: Denver, Colorado, June–July 2020. Clin. Infect. Dis. 2022, 75, E157–E164. [Google Scholar] [CrossRef]
- Roland, M.; Ben Abdelhafidh, L.; Déom, V.; Vanbiervliet, F.; Coppieters, Y.; Racapé, J. SARS-CoV-2 Screening among People Living in Homeless Shelters in Brussels, Belgium. PLoS ONE 2021, 16, e0252886. [Google Scholar] [CrossRef] [PubMed]
- Storgaard, S.F.; Eiset, A.H.; Abdullahi, F.; Wejse, C. First Wave of COVID-19 Did Not Reach the Homeless Population in Aarhus. Dan. Med. J. 2020, 67, A08200594. [Google Scholar] [PubMed]
- Mosites, E.; Parker, E.M.; Clarke, K.E.N.; Gaeta, J.M.; Baggett, T.P.; Imbert, E.; Sankaran, M.; Scarborough, A.; Huster, K.; Hanson, M.; et al. Assessment of SARS-CoV-2 Infection Prevalence in Homeless Shelters—Four U.S. Cities, March 27–April 15, 2020. Morb. Mortal. Wkly. Rep. 2019, 69, 521–522. [Google Scholar] [CrossRef] [PubMed]
- Karb, R.; Samuels, E.; Vanjani, R.; Trimbur, C.; Napoli, A. Homeless Shelter Characteristics and Prevalence of SARS-CoV-2. West. J. Emerg. Med. 2020, 21, 1048–1053. [Google Scholar] [CrossRef] [PubMed]
- Imbert, E.; Kinley, P.M.; Scarborough, A.; Cawley, C.; Sankaran, M.; Cox, S.N.; Kushel, M.; Stoltey, J.; Cohen, S.; Fuchs, J.D. Coronavirus Disease 2019 (COVID-19) Outbreak in a San Francisco Homeless Shelter. Clin. Infect. Dis. 2021, 73, 324–327. [Google Scholar] [CrossRef] [PubMed]
- Baggett, T.P.; Keyes, H.; Sporn, N.; Gaeta, J.M. Prevalence of SARS-CoV-2 Infection in Residents of a Large Homeless Shelter in Boston. JAMA—J. Am. Med. Assoc. 2020, 323, 2191–2192. [Google Scholar] [CrossRef] [PubMed]
- Ralli, M.; de Giorgio, F.; Pimpinelli, F.; Cedola, C.; Shkodina, N.; Morrone, A.; Arcangeli, A.; Ercoli, L. SARS-CoV-2 Infection Prevalence in People Experiencing Homelessness. Eur. Rev. Med. Pharmacol. Sci. 2021, 25, 6425–6430. [Google Scholar]
- Morrone, A.; di Simone, E.; Buonomini, A.R.; Panattoni, N.; Pimpinelli, F.; Pontone, M.; Saraceni, P.; Ercoli, L.; Ralli, M.; Petrone, F.; et al. A Report about the Experience of COVID-19 Active Surveillance of Homeless, Undocumented People, and Shelter Staff in Two Cities of Lazio, Italy. Eur. Rev. Med. Pharmacol. Sci. 2023, 27, 10798–10805. [Google Scholar]
- Lindner, A.K.; Sarma, N.; Rust, L.M.; Hellmund, T.; Krasovski-Nikiforovs, S.; Wintel, M.; Klaes, S.M.; Hoerig, M.; Monert, S.; Schwarzer, R.; et al. Monitoring for COVID-19 by Universal Testing in a Homeless Shelter in Germany: A Prospective Feasibility Cohort Study. BMC Infect. Dis. 2021, 21, 1241. [Google Scholar] [CrossRef]
- Richard, L.; Booth, R.; Rayner, J.; Clemens, K.K.; Forchuk, C.; Shariff, S.Z. Testing, Infection and Complication Rates of COVID-19 among People with a Recent History of Homelessness in Ontario, Canada: A Retrospective Cohort Study. CMAJ Open 2021, 9, E1–E9. [Google Scholar] [CrossRef] [PubMed]
- Berner, L.; Meehan, A.; Kenkel, J.; Montgomery, M.; Fields, V.; Henry, A.; Boyer, A.; Mosites, E.; Vickery, K.D. Clinic- and Community-Based SARS-CoV-2 Testing among People Experiencing Homelessness in the United States, March–November 2020. Public Health Rep. 2022, 137, 764–773. [Google Scholar] [CrossRef] [PubMed]
- Rogers, J.H.; Cox, S.N.; Link, A.C.; Nwanne, G.; Han, P.D.; Pfau, B.; Chow, E.J.; Wolf, C.R.; Boeckh, M.; Hughes, J.P.; et al. Incidence of SARS-CoV-2 Infection and Associated Risk Factors among Staff and Residents at Homeless Shelters in King County, Washington: An Active Surveillance Study. Epidemiol. Infect. 2023, 151, e129. [Google Scholar] [CrossRef]
- Keller, M.; Shreffler, J.; Wilmes, K.; Polites, A.; Huecker, M. Equal Incidence of COVID-19 among Homeless and Non-Homeless ED Patients When Controlling for Confounders. Am. J. Emerg. Med. 2022, 53, 286.e5–286.e7. [Google Scholar] [CrossRef] [PubMed]
- Luong, L.; Beder, M.; Nisenbaum, R.; Orkin, A.; Wong, J.; Damba, C.; Emond, R.; Lena, S.; Wright, V.; Loutfy, M.; et al. Prevalence of SARS-CoV-2 Infection among People Experiencing Homelessness in Toronto during the First Wave of the COVID-19 Pandemic. Can. J. Public Health 2022, 113, 117–125. [Google Scholar] [CrossRef] [PubMed]
- Boonyaratanakornkit, J.; Ekici, S.; Magaret, A.; Gustafson, K.; Scott, E.; Haglund, M.; Kuypers, J.; Pergamit, R.; Lynch, J.; Chu, H.Y. Respiratory Syncytial Virus Infection in Homeless Populations, Washington, USA. Emerg. Infect. Dis. 2019, 25, 1408–1411. [Google Scholar] [CrossRef] [PubMed]
- Loubiere, S.; Hafrad, I.; Monfardini, E.; Mosnier, M.; Bosetti, T.; Auquier, P.; Mosnier, E.; Tinland, A. Morbidity and Mortality in a Prospective Cohort of People Who Were Homeless during the COVID-19 Pandemic. Front. Public Health 2023, 11, 1233020. [Google Scholar] [CrossRef] [PubMed]
- Office of Health Assessment and Translation (OHAT). OHAT Risk of Bias Rating Tool for Human and Animal Studies; Office of Health Assessment and Translation (OHAT): Research Triangle Park, NC, USA, 2019. Available online: https://ntp.niehs.nih.gov/sites/default/files/ntp/ohat/pubs/riskofbiastool_508.pdf (accessed on 19 November 2023).
- Partridge, E.; McCleery, E.; Cheema, R.; Nakra, N.; Lakshminrusimha, S.; Tancredi, D.J.; Blumberg, D.A. Evaluation of Seasonal Respiratory Virus Activity Before and After the Statewide COVID-19 Shelter-in-Place Order in Northern California. JAMA Netw. Open 2021, 4, e2035281. [Google Scholar] [CrossRef]
- Self, J.L.; Montgomery, M.P.; Toews, K.A.; Samuels, E.A.; Imbert, E.; McMichael, T.M.; Marx, G.E.; Lohff, C.; Andrews, T.; Ghinai, I.; et al. Shelter Characteristics, Infection Prevention Practices, and Universal Testing for SARS-CoV-2 at Homeless Shelters in 7 US Urban Areas. Am. J. Public Health 2021, 111, 854–859. [Google Scholar] [CrossRef]
- Aranda-Díaz, A.; Imbert, E.; Strieff, S.; Graham-Squire, D.; Evans, J.L.; Moore, J.; McFarland, W.; Fuchs, J.; Handley, M.A.; Kushel, M. Implementation of Rapid and Frequent SARSCoV2 Antigen Testing and Response in Congregate Homeless Shelters. PLoS ONE 2022, 17, e0264929. [Google Scholar] [CrossRef] [PubMed]
- Lippi, G.; Mattiuzzi, C.; Henry, B.M. Is SARS-CoV-2 Omicron (B.1.1.529) Variant Causing Different Symptoms? Res. Sq. 2022, preprint. [Google Scholar] [CrossRef]
- Sarkar, A.; Omar, S.; Alshareef, A.; Fanous, K.; Sarker, S.; Alroobi, H.; Zamir, F.; Yousef, M.; Zakaria, D. The Relative Prevalence of the Omicron Variant within SARS-CoV-2 Infected Cohorts in Different Countries: A Systematic Review. Hum. Vaccin. Immunother. 2023, 19, 2212568. [Google Scholar] [CrossRef] [PubMed]
- Raoult, D.; Foucault, C.; Brouqui, P. Infections in the Homeless. Lancet Infect. Dis. 2001, 1, 77–84. [Google Scholar] [CrossRef]
- Hwang, S.W. Homelessness and Health. CMAJ 2001, 164, 229–233. [Google Scholar]
- Siddik, A.B.; Tanvir, N.A.; Bhuyan, G.S.; Alam, M.S.; Islam, Z.; Bulbul, M.R.H.; Moniruzzaman, M.; Halder, C.E.; Rahman, T.; Endtz, H.; et al. Bacterial and Viral Etiology of Acute Respiratory Infection among the Forcibly Displaced Myanmar Nationals (FDMNs) in Fragile Settings in Cox’s Bazar—A Prospective Case-Control Study. PLoS Negl. Trop. Dis. 2023, 17, e0011189. [Google Scholar] [CrossRef] [PubMed]
- Mohamed, G.A.; Ahmed, J.A.; Marano, N.; Mohamed, A.; Moturi, E.; Burton, W.; Otieno, S.; Fields, B.; Montgomery, J.; Kabugi, W.; et al. Etiology and Incidence of Viral Acute Respiratory Infections among Refugees Aged 5 Years and Older in Hagadera Camp, Dadaab, Kenya. Am. J. Trop. Med. Hyg. 2015, 93, 1371–1376. [Google Scholar] [CrossRef]
- Ahmed, J.A.; Katz, M.A.; Auko, E.; Njenga, M.K.; Weinberg, M.; Kapella, B.K.; Burke, H.; Nyoka, R.; Gichangi, A.; Waiboci, L.W.; et al. Epidemiology of Respiratory Viral Infections in Two Long-Term Refugee Camps in Kenya, 2007–2010. BMC Infect. Dis. 2012, 12, 7. [Google Scholar] [CrossRef]
- Segal, S.P.; Gomory, T.; Silverman, C.J. Health Status of Homeless and Marginally Housed Users of Mental Health Self-Help Agencies. Health Soc. Work. 1998, 23, 45–52. [Google Scholar] [CrossRef]
- Hwang, S.W.; Orav, E.J.; O’Connell, J.J.; Lebow, J.M.; Brennan, T.A. Causes of Death in Homeless Adults in Boston. Ann. Intern. Med. 1997, 126, 625–628. [Google Scholar] [CrossRef] [PubMed]
- Hwang, S.W.; Lebow, J.M.; Bierer, M.F.; O’Connell, J.J.; Orav, E.J.; Brennan, T.A. Risk Factors for Death in Homeless Adults in Boston. Arch. Intern. Med. 1998, 158, 1454–1460. [Google Scholar] [CrossRef] [PubMed]
- Dwyer, B.; Jackson, K.; Raios, K.; Sievers, A.; Wilshire, E.; Ross, B. DNA Restriction Fragment Analysis to Define an Extended Cluster of Tuberculosis in Homeless Men and Their Associates. J. Infect. Dis. 1993, 167, 490–494. [Google Scholar] [CrossRef] [PubMed]
- Gutiérrez, M.C.; Vincent, V.; Aubert, D.; Bizet, J.; Gaillot, O.; Lebrun, L.; Le Pendeven, C.; Le Pennec, M.P.; Mathieu, D.; Offredo, C.; et al. Molecular Fingerprinting of Mycobacterium Tuberculosis and Risk Factors for Tuberculosis Transmission in Paris, France, and Surrounding Area. J. Clin. Microbiol. 1998, 36, 486–492. [Google Scholar] [CrossRef] [PubMed]
- Ralli, M.; Cedola, C.; Urbano, S.; Latini, O.; Shkodina, N.; Morrone, A.; Arcangeli, A.; Ercoli, L. Assessment of Sars-Cov-2 Infection through Rapid Serology Testing in the Homeless Population in the City of Rome, Italy. Preliminary Results. J. Public Health Res. 2020, 9, 556–559. [Google Scholar] [CrossRef] [PubMed]
- Roederer, T.; Mollo, B.; Vincent, C.; Nikolay, B.; Llosa, A.E.; Nesbitt, R.; Vanhomwegen, J.; Rose, T.; Goyard, S.; Anna, F.; et al. Seroprevalence and Risk Factors of Exposure to COVID-19 in Homeless People in Paris, France: A Cross-Sectional Study. Lancet Public Health 2021, 6, e202–e209. [Google Scholar] [CrossRef] [PubMed]
- Ahillan, T.; Emmerson, M.; Swift, B.; Golamgouse, H.; Song, K.; Roxas, A.; Mendha, S.B.; Avramović, E.; Rastogi, J.; Sultan, B. COVID-19 in the Homeless Population: A Scoping Review and Meta-Analysis Examining Differences in Prevalence, Presentation, Vaccine Hesitancy and Government Response in the First Year of the Pandemic. BMC Infect. Dis. 2023, 23, 155. [Google Scholar] [CrossRef]
- Liang, Y.; Sun, Q.; Liu, Q.; Pang, Y.; Tang, S. SARS-CoV-2 Incidence, Seroprevalence, and COVID-19 Vaccination Coverage in the Homeless Population: A Systematic Review and Meta-Analysis. Front. Public Health 2023, 11, 1044788. [Google Scholar] [CrossRef]
- Celante, H.; Oubaya, N.; Fourati, S.; Beaune, S.; Khellaf, M.; Casalino, E.; Ricard, J.D.; Vieillard-Baron, A.; Heming, N.; Mekontso Dessap, A.; et al. Prognosis of Hospitalised Adult Patients with Respiratory Syncytial Virus Infection: A Multicentre Retrospective Cohort Study. Clin. Microbiol. Infect. 2023, 29, 943.e1–943.e8. [Google Scholar] [CrossRef]
- Ali, A.; Lopardo, G.; Scarpellini, B.; Stein, R.T.; Ribeiro, D. Systematic Review on Respiratory Syncytial Virus Epidemiology in Adults and the Elderly in Latin America. Int. J. Infect. Dis. 2020, 90, 170–180. [Google Scholar] [CrossRef]
- Mao, Z.; Li, X.; Dacosta-Urbieta, A.; Billard, M.N.; Wildenbeest, J.; Korsten, K.; Martinón-Torres, F.; Heikkinen, T.; Cunningham, S.; Snape, M.D.; et al. Economic Burden and Health-Related Quality-of-Life among Infants with Respiratory Syncytial Virus Infection: A Multi-Country Prospective Cohort Study in Europe. Vaccine 2023, 41, 2707–2715. [Google Scholar] [CrossRef]
- Korsten, K.; Adriaenssens, N.; Coenen, S.; Butler, C.; Ravanfar, B.; Rutter, H.; Allen, J.; Falsey, A.; Pirçon, J.Y.; Gruselle, O.; et al. Burden of Respiratory Syncytial Virus Infection in Community-Dwelling Older Adults in Europe (RESCEU): An International Prospective Cohort Study. Eur. Respir. J. 2021, 57, 2002688. [Google Scholar] [CrossRef] [PubMed]
- Hwang, W.J.; Kim, M. Work-Related Stress, Health Status and Status of Health Apps Use in Korean Adult Workers. Int. J. Environ. Res. Public Health 2022, 19, 3197. [Google Scholar] [CrossRef] [PubMed]
- Mitchell, E.; Waring, T.; Ahern, E.; O’Donovan, D.; O’Reilly, D.; Bradley, D.T. Predictors and Consequences of Homelessness in Whole-Population Observational Studies That Used Administrative Data: A Systematic Review. BMC Public Health 2023, 23, 1610. [Google Scholar] [CrossRef] [PubMed]
- Van der Leeden, C.; Kaduszkiewicz, H.; Boczor, S.; Kloppe, T.; Lohmann, B.; Mallon, T.; Rakebrandt, A.; Scherer, M. Medical Centres for the Homeless in Hamburg—Consultation Reasons and Diagnoses Compared to Primary Care Patients in the Regular Health Care System. Arch. Public Health 2023, 81, 190. [Google Scholar] [CrossRef] [PubMed]
- Rose, E.B.; Wheatley, A.; Langley, G.; Gerber, S.; Haynes, A. Respiratory Syncytial Virus Seasonality-United States, 2014–2017. Morb. Mortal. Wkly. Rep. 2018, 67, 71–76. [Google Scholar] [CrossRef] [PubMed]
- Janet, S.; Broad, J.; Snape, M.D. Respiratory Syncytial Virus Seasonality and Its Implications on Prevention Strategies. Hum. Vaccin. Immunother. 2018, 14, 234–244. [Google Scholar] [CrossRef] [PubMed]
- Morley, C.; Grimwood, K.; Maloney, S.; Ware, R.S. Meteorological Factors and Respiratory Syncytial Virus Seasonality in Subtropical Australia. Epidemiol. Infect. 2018, 146, 757–762. [Google Scholar] [CrossRef] [PubMed]
- Atamna, A.; Babich, T.; Froimovici, D.; Yahav, D.; Sorek, N.; Ben-Zvi, H.; Leibovici, L.; Bishara, J.; Avni, T. Morbidity and Mortality of Respiratory Syncytial Virus Infection in Hospitalized Adults: Comparison with Seasonal Influenza. Int. J. Infect. Dis. 2021, 103, 489–493. [Google Scholar] [CrossRef]
- Alagna, E.; Santangelo, O.E.; Raia, D.D.; Gianfredi, V.; Provenzano, S.; Firenze, A. Health Status, Diseases and Vaccinations of the Homeless in the City of Palermo, Italy. Ann. Ig. 2019, 31, 21–34. [Google Scholar] [CrossRef]
- Ogbonna, O.; Bull, F.; Spinks, B.; Williams, D.; Lewis, R.; Edwards, A. The Impact of Being Homeless on the Clinical Outcomes of COVID-19: Systematic Review. Int. J. Public Health 2023, 68, 1605893. [Google Scholar] [CrossRef]
- Australian Technical Advisory Group on Immunisation (ATAGI). The Australian Immunisation Handbook; ATAGI: Camberra, Australia, 2022.
- Papi, A.; Ison, M.G.; Langley, J.M.; Lee, D.-G.; Leroux-Roels, I.; Martinon-Torres, F.; Schwarz, T.F.; van Zyl-Smit, R.N.; Campora, L.; Dezutter, N.; et al. Respiratory Syncytial Virus Prefusion F Protein Vaccine in Older Adults. N. Engl. J. Med. 2023, 388, 595–608. [Google Scholar] [CrossRef]
- Schmoele-Thoma, B.; Zareba, A.M.; Jiang, Q.; Maddur, M.S.; Danaf, R.; Mann, A.; Eze, K.; Fok-Seang, J.; Kabir, G.; Catchpole, A.; et al. Vaccine Efficacy in Adults in a Respiratory Syncytial Virus Challenge Study. N. Engl. J. Med. 2022, 386, 2377–2386. [Google Scholar] [CrossRef]
- Falsey, A.R.; Williams, K.; Gymnopoulou, E.; Bart, S.; Ervin, J.; Bastian, A.R.; Menten, J.; de Paepe, E.; Vandenberghe, S.; Chan, E.K.H.; et al. Efficacy and Safety of an Ad26.RSV.PreF–RSV PreF Protein Vaccine in Older Adults. N. Engl. J. Med. 2023, 388, 609–620. [Google Scholar] [CrossRef]
- Nham, E.; Seong, H.; Hyun, H.; Yoon, J.G.; Noh, J.Y.; Cheong, H.J.; Kim, W.J.; Kim, E.; Choi, L.; Lee, J.-M.; et al. Cost-Effectiveness of High-Dose Quadrivalent Influenza Vaccine versus Standard-Dose Quadrivalent Influenza Vaccine for Older People in a Country with High Influenza Vaccination Rate. Hum. Vaccin. Immunother. 2023, 19, 2266233. [Google Scholar] [CrossRef]
- Colombo, L.; Hadigal, S.; Nauta, J.; Kondratenko, A.; Rogoll, J.; van de Witte, S. Influvac Tetra: Clinical Experience on Safety, Efficacy, and Immunogenicity. Expert. Rev. Vaccines 2024, 23, 88–101. [Google Scholar] [CrossRef]
- Hsiao, A.; Yee, A.; Fireman, B.; Hansen, J.; Lewis, N.; Klein, N.P. Recombinant or Standard-Dose Influenza Vaccine in Adults under 65 Years of Age. N. Engl. J. Med. 2023, 389, 2245–2255. [Google Scholar] [CrossRef] [PubMed]
- Riccò, M.; Corrado, S.; Cerviere, M.P.; Ranzieri, S.; Marchesi, F. Respiratory Syncytial Virus Prevention through Monoclonal Antibodies: A Cross-Sectional Study on Knowledge, Attitudes, and Practices of Italian Pediatricians. Pediatr. Rep. 2023, 15, 154–174. [Google Scholar] [CrossRef] [PubMed]
- Madhi, S.A.; Polack, F.P.; Piedra, P.A.; Munoz, F.M.; Trenholme, A.A.; Simões, E.A.F.; Swamy, G.K.; Agrawal, S.; Ahmed, K.; August, A.; et al. Respiratory Syncytial Virus Vaccination during Pregnancy and Effects in Infants. N. Engl. J. Med. 2020, 383, 426–439. [Google Scholar] [CrossRef] [PubMed]


| Study | Total Sample (N./8340., %) | RSV (n./N, %) | Influenza (n./N, %) | SARS-CoV-2 (n./N, %) |
|---|---|---|---|---|
| Badiaga et al., 2009 [17] | 221 (2.65%) | 2 (0.90%) | 2, 0.90% | - |
| Thiberville et al., 2014 [18] | 108 (1.29%) | 0 (-) | 0 (-) | - |
| 157 (1.88%) | 1 (0.64%) | 0 (-) | - | |
| Ly et al., 2019 [4] | 479 (5.74%) | 3 (0.63%) | 7 (1.46%) | - |
| Baggett et al., 2020 [108] | 408 (4.89%) | - | - | 147 (36.03%) |
| Imbert et al., 2020 [107] | 150 (1.80%) | - | - | 101 (67.3%) |
| Karb et al., 2020 [106] | 299 (3.59%) | - | - | 35 (11.71%) |
| Mosites et al., 2020 [105] | 392 (4.70%) | - | - | 41 (10.46%) |
| 143 (1.71%) | - | - | 95 (66.43%) | |
| 249 (2.99%) | - | - | 10 (4.02%) | |
| Storgaard et al., 2020 [104] | 295 (3.54%) | - | - | 0 (-) |
| 141 (1.69%) | - | - | 0 (-) | |
| Husain et al., 2021 | 100 (1.20%) | - | - | 22 (22.00%) |
| Kiran et al., 2021 [42] | 504 (6.04%) | - | - | 69 (13.69%) |
| 496 (5.95%) | - | - | 11 (2.22%) | |
| Ly et al., 2021 [6] | 411 (4.93%) | - | - | 37 (9.00%) |
| Ly et al., 2021 [5] | 126 (1.51%) | 0 (-) | 0 (-) | 26 (20.63%) |
| 111 (1.33%) | 0 (-) | 0 (-) | 0 (-) | |
| 71 (0.85%) | 0 (-) | 0 (-) | 0 (-) | |
| Oette et al., 2021 [100] | 130 (1.56%) | - | - | 4 (3.08%) |
| Roland et al., 2021 [103] | 1985 (23.80%) | - | - | 91 (4.58%) |
| Oette et al., 2022 [99] | 129 (1.55%) | 0 (-) | - | 4 (3.10%) |
| 143 (1.71%) | 1 (0.70%) | - | 0 (-) | |
| 83 (1.00%) | 1 (1.20%) | - | 5 (6.02%) | |
| Rowan et al., 2022 [102] | 871 (10.44%) | - | - | 54 (6.20%) |
| Generaal et al., 2023 [101] | 138 (1.65%) | - | - | 0 (-) |
| TOTAL | 8/1628 (0.49%) | 9/1273 (0.71%) | 752/7375 (10.20%) |
| Study | Sample (N.) | Observation Time (Days) | RSV (n./N, %) | Influenza (n./N, %) | SARS-CoV-2 (n./N, %) |
|---|---|---|---|---|---|
| Ralli et al., 2021 [109] | 1052 | 247 | 86 (8.17%) | ||
| Lindner et al., 2021 [111] | 118 | 20 | 0 (-) | ||
| Richard et al., 2021 [112] | 721 | 333 | 124 (9.66%) | ||
| Berner et al., 2022 [113] | 11,563 | 274 | 903 (7.81%) | ||
| Chow et al., 2022 [21] | 14,464 | 608 | 20 (0.14%) | 22 (0.15%) | |
| Keller et al., 2022 [115] | 712 | 1340 | 39 (5.48%) | ||
| Luong et al., 2022 [116] | 4657 | 105 | 394 (8.46%) | ||
| McCulloch et al., 2023 [20] | 825 | 150 | 15 (1.82%) | 13 (1.58%) | |
| 15,289 | 608 | 133 (0.87%) | |||
| Morrone et al., 2023 [110] | 5442 | 579 | 168 (5.49%) | ||
| Rogers et al., 2023 [114] | 2360 | 516 | 117 (4.96%) | ||
| Rogers et al., 2023 [44] | 1283 | 115 | 51 (3.98%) | ||
| Rogers et al., 2023 [19] | 825 | 346 | 14 (1.70%) | 11 (1.33%) | |
| TOTAL | 49/16,114 (0.30%) | 97/17,3997 (0.56%) | 1946/41,914 (4.69%) |
| Study | D1 | D2 | D3 | D4 | D5 | D6 |
|---|---|---|---|---|---|---|
| Prevalence studies | ||||||
| Badiaga et al., 2009 [17] | ☹ | ☺ | ☺ | ☺ | ☺ | ☺☺ |
| Thiberville et al., 2014 [18] | ☹ | ☺ | ☺ | ☺ | ☺ | ☺☺ |
| Ly et al.,2019 [4] | ☹ | ☺ | ☺☺ | ☺☺ | ☺ | ☺☺ |
| Baggett et al., 2020 [108] | ☹ | ☺ | ☺ | ☹ | ☺ | ☺ |
| Imbert et al., 2020 [107] | ☹ | ☺ | ☺ | ☹ | ☺ | ☺ |
| Karb et al., 2020 [106] | ☹ | ☺ | ☺ | ☹ | ☺ | ☺ |
| Mosites et al., 2020 [105] | ☹ | ☺ | ☺ | ☹ | ☺ | ☺ |
| Storgaard et al., 2020 [104] | ☹ | ☺☺ | ☺ | ☹ | ☺ | ☺ |
| Husain et al., 2021 | ☹ | ☺☺ | ☺ | ☺☺ | ☺ | ☺ |
| Kiran et al., 2021 [42] | ☹ | ☺☺ | ☺ | ☹ | ☺ | ☺ |
| Ly et al., 2021 [6] | ☹ | ☺ | ☺ | ☹ | ☺ | ☺☺ |
| Ly et al., 2021 [5] | ☹ | ☺ | ☺☺ | ☹ | ☺ | ☺☺ |
| Oette et al., 2021 [100] | ☹ | ☺ | ☺ | ☹ | ☺ | ☺ |
| Roland et al., 2021 [103] | ☹ | ☺☺ | ☺ | ☹ | ☺ | ☺ |
| Oette et al., 2022 [99] | ☹ | ☺ | ☺☺ | ☹ | ☹ | ☹ |
| Rowan et al., 2022 [102] | ☹ | ☺☺ | ☺ | ☹ | ☺ | ☺ |
| Generaal et al., 2023 [101] | ☹ | ☺☺ | ☺ | ☺ | ☺ | ☺ |
| Incidence studies | ||||||
| Ralli et al., 2021 [109] | ☹☹ | ☺ | ☺ | ☹ | ☺ | ☺ |
| Lindner et al., 2021 [111] | ☹ | ☺ | ☺ | ☹ | ☺ | ☺ |
| Richard et al., 2021 [112] | ☹ | ☺ | ☺☺ | ☹ | ☺ | ☺ |
| Berner et al., 2022 [113] | ☹ | ☺ | ☺ | ☹ | ☺ | ☺ |
| Chow et al., 2022a [21] | ☹☹ | ☺ | ☺ | ☹☹ | ☹☹ | ☹☹ |
| Keller et al., 2022 [115] | ☹ | ☺ | ☺ | ☹ | ☺ | ☺ |
| Luong et al., 2022 [116] | ☹ | ☺ | ☺ | ☹ | ☺ | ☺ |
| McCulloch et al., 2023 [20] | ☹☹ | ☺ | ☺ | ☹☹ | ☹☹ | ☹☹ |
| Morrone et al., 2023 [110] | ☹☹ | ☺ | ☺ | ☹ | ☺ | ☺ |
| Rogers et al., 2023 [114] | ☹☹ | ☺ | ☺ | ☹☹ | ☹☹ | ☹☹ |
| Rogers et al., 2023 [44] | ☹☹ | ☺ | ☺ | ☹☹ | ☹☹ | ☹☹ |
| Rogers et al., 2023 [19] | ☹☹ | ☺ | ☺ | ☹☹ | ☹☹ | ☹☹ |
| Outcome studies | ||||||
| Boonyaratanakornkit et al., 2019 [117] | ☹☹ | ☹ | ☺☺ | ☺ | ☺ | ☺ |
| Loubiere et al., 2023 [118] | ☹ | ☺☺ | ☺☺ | ☺ | ☺ | ☺ |
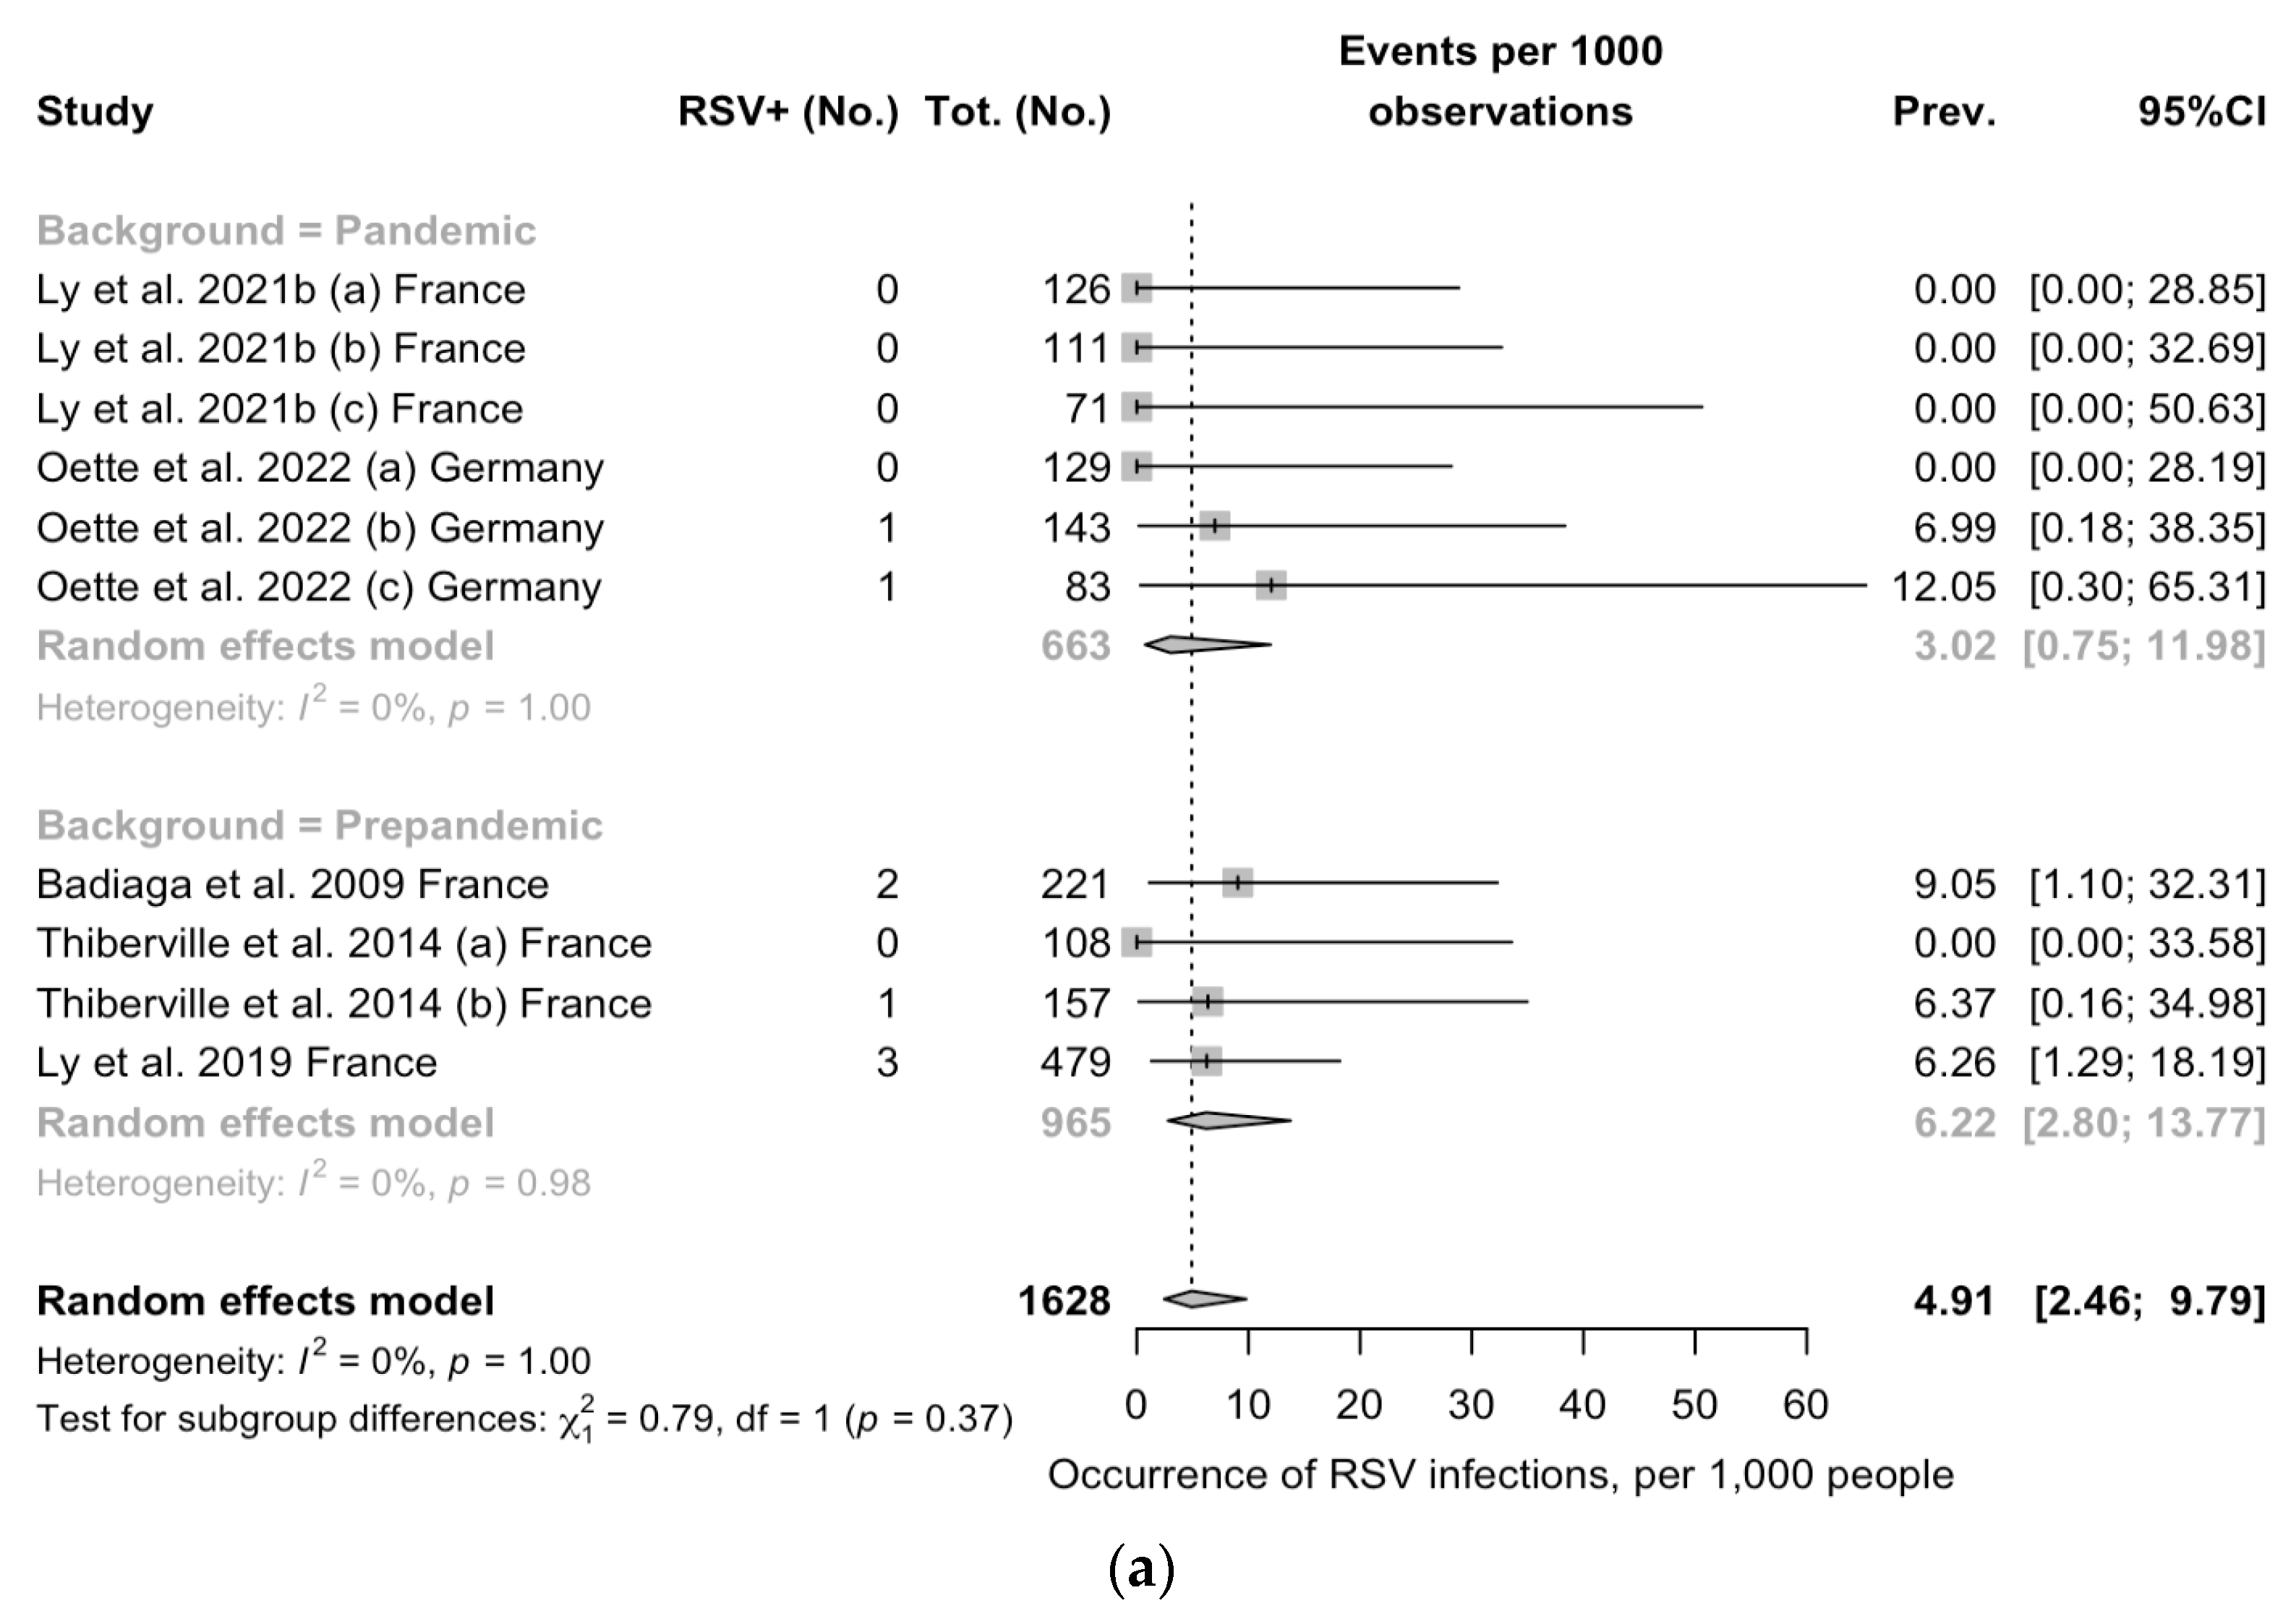
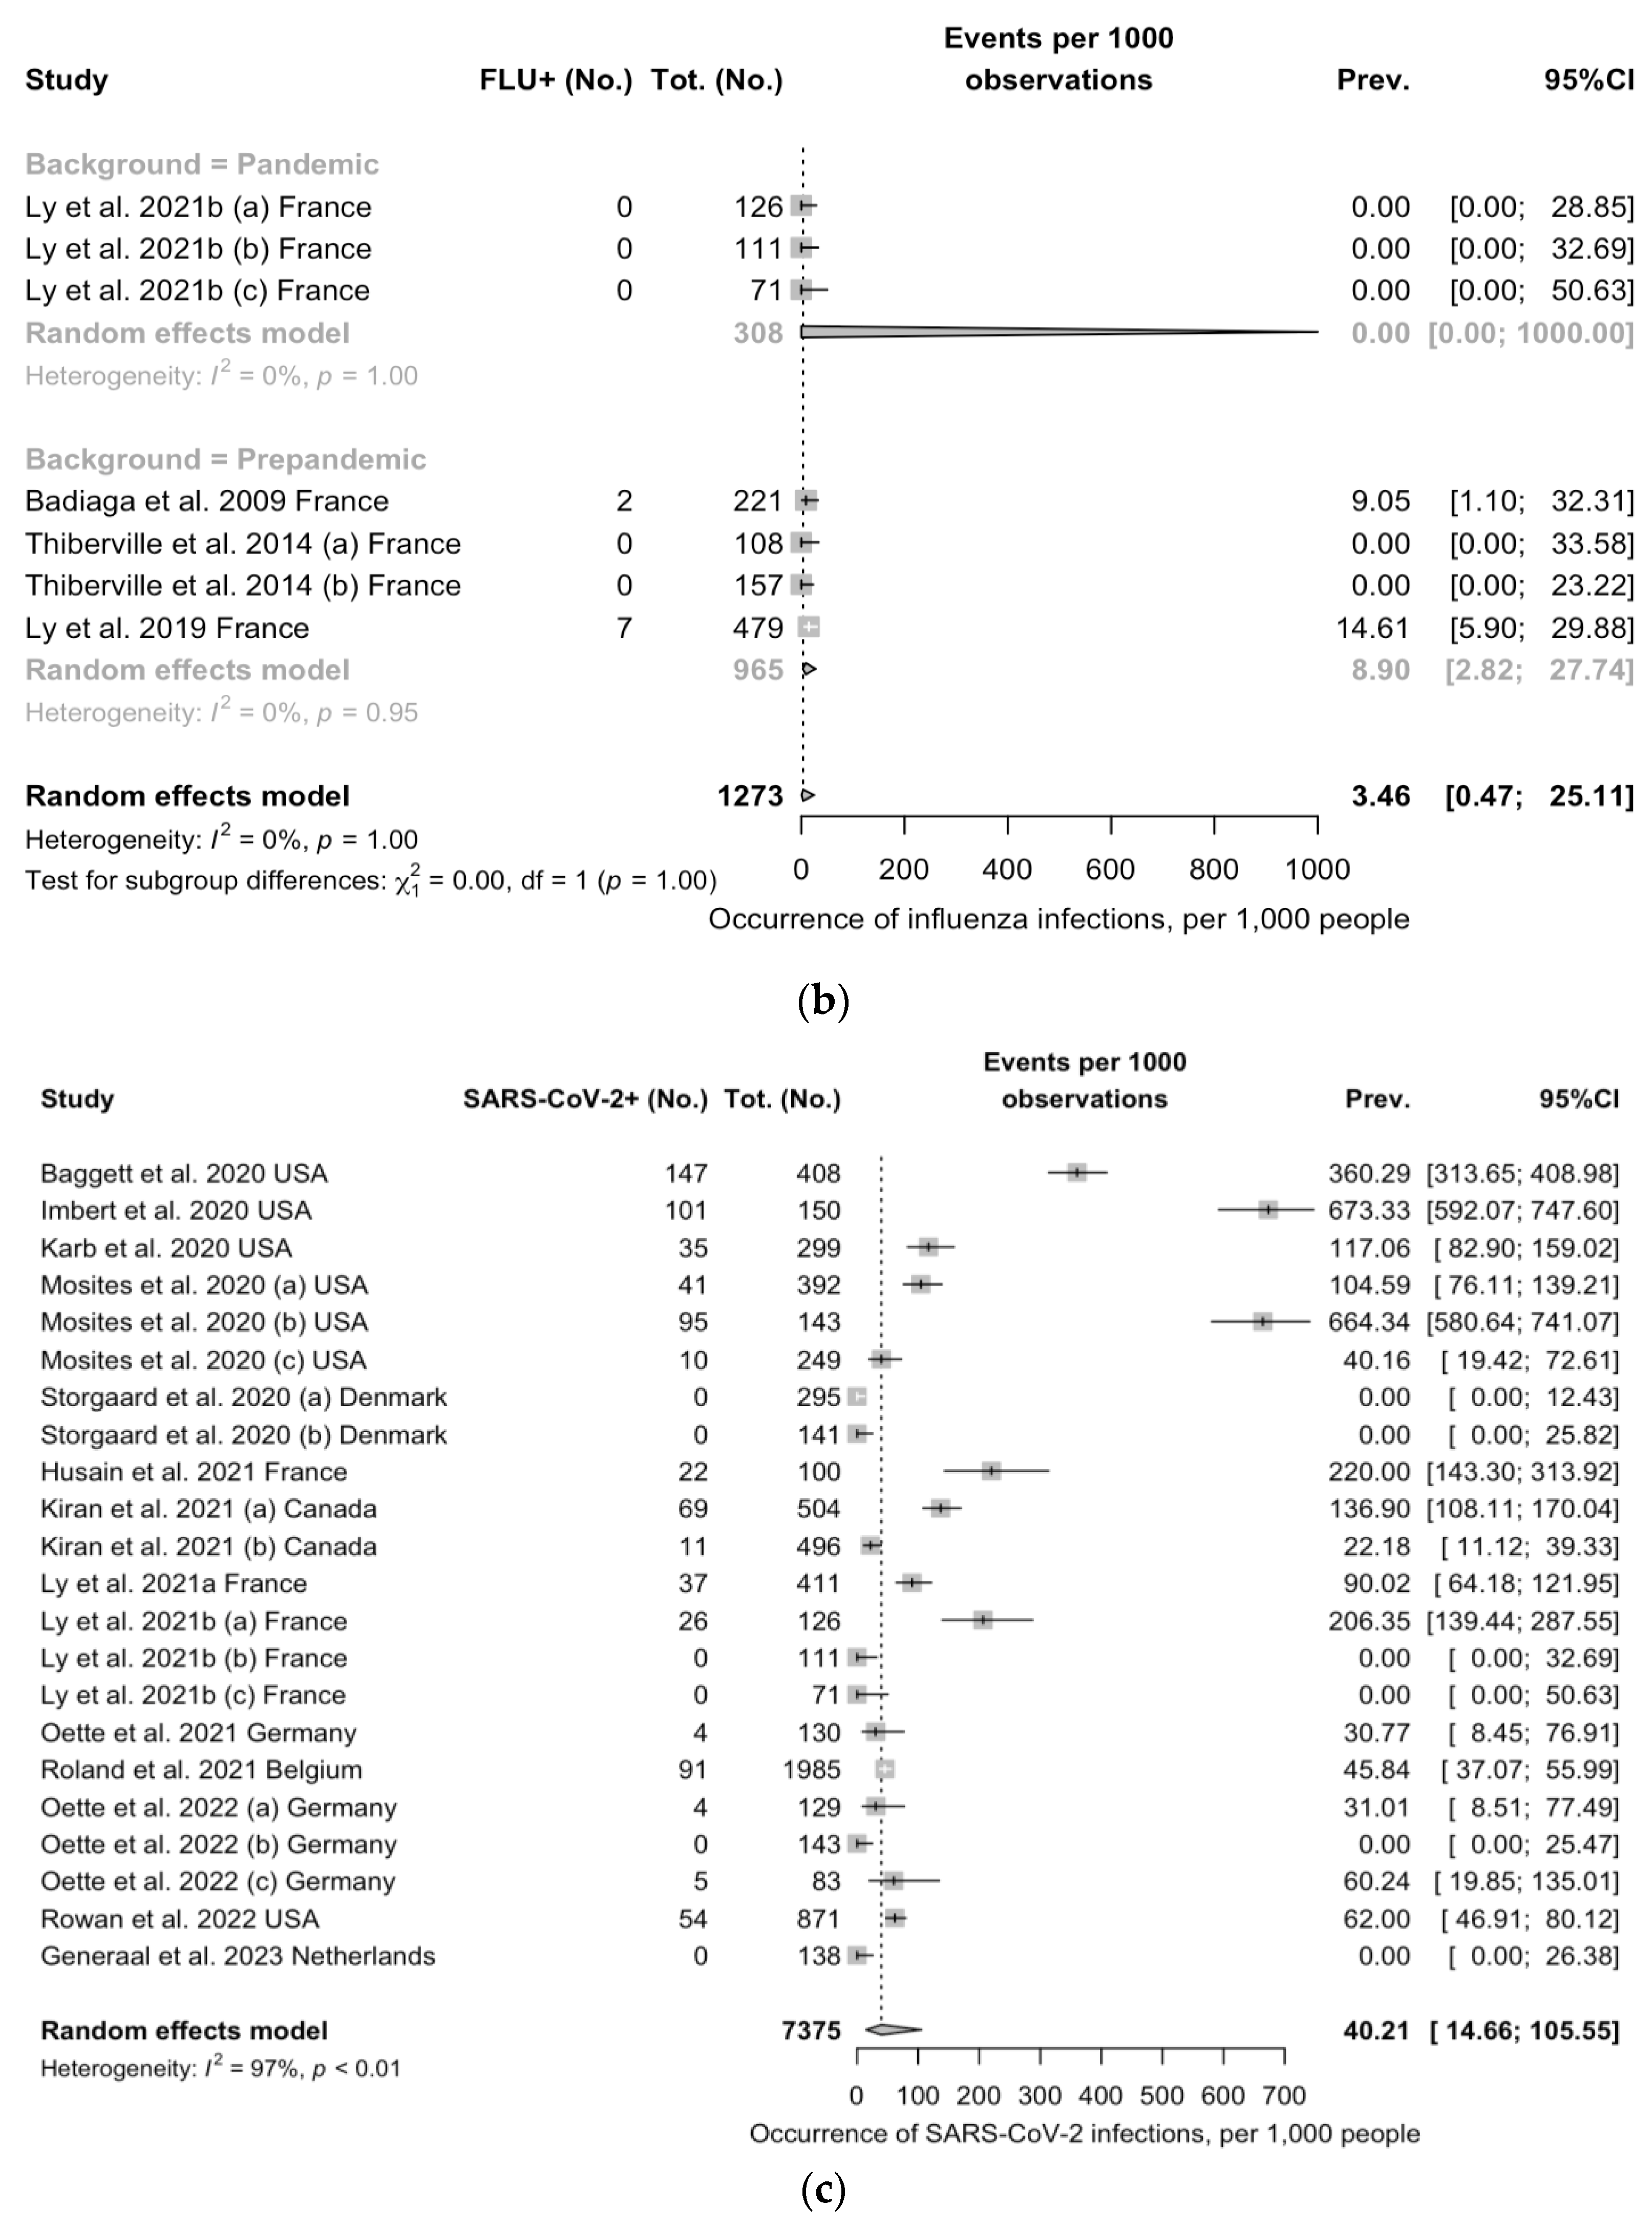
| Pathogen | Time Period | Pooled Prevalence (N./1000 Samples, 95%CI) | τ2; (I2; 95%CI) |
|---|---|---|---|
| RSV | Overall | 4.91 (2.46; 9.80) | 0.000 (0.0%; 0.0 to 62.4) |
| Pre-Pandemic | 6.22 (2.80; 13.77) | 0.000 (0.0%) | |
| Pandemic | 3.02 (0.76; 11.98) | 0.000 (0.0%) | |
| Influenza | Overall | 3.47 (0.47; 25.11) | 0.84 (0.0%; 0.0 to 70.8) |
| Pre-Pandemic | 8.90 (2.82; 27.74) | 0.037 (0.0%) | |
| Pandemic | 0.00 (0.00; 1000) | - | |
| SARS-CoV-2 | Overall | 40.21 (14.66; 105.55) | 5.14 (97.5%; 96.9 to 97.9) |
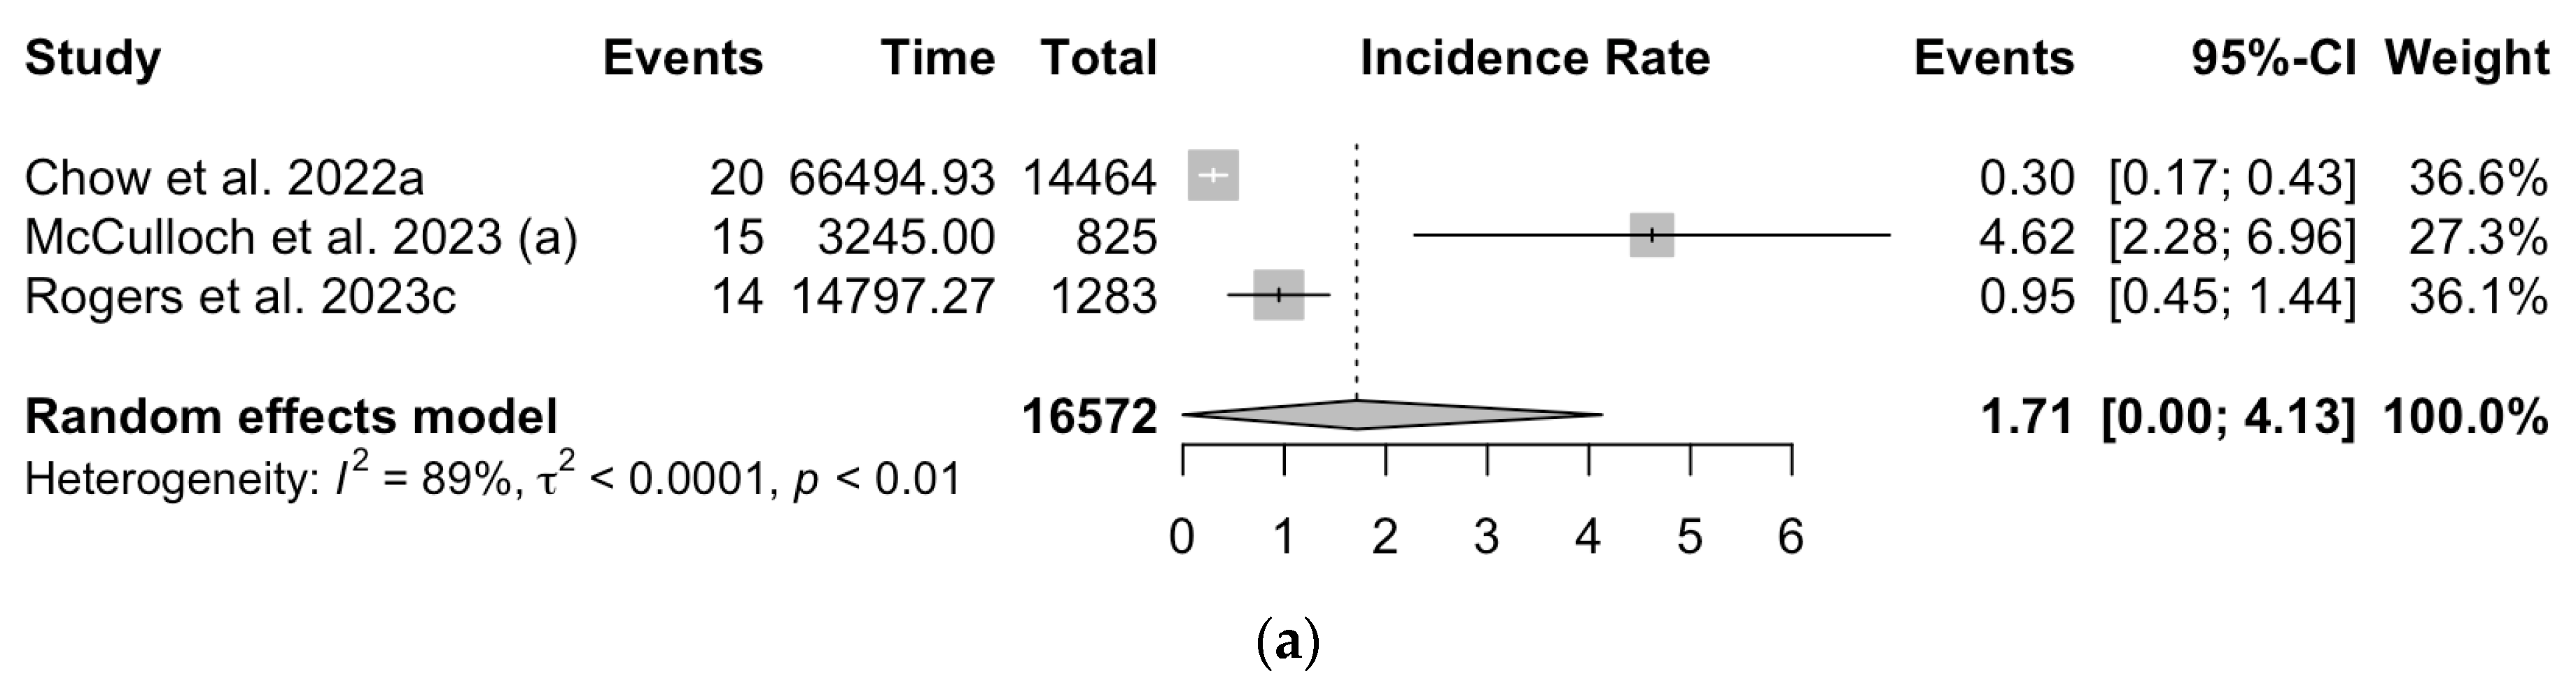
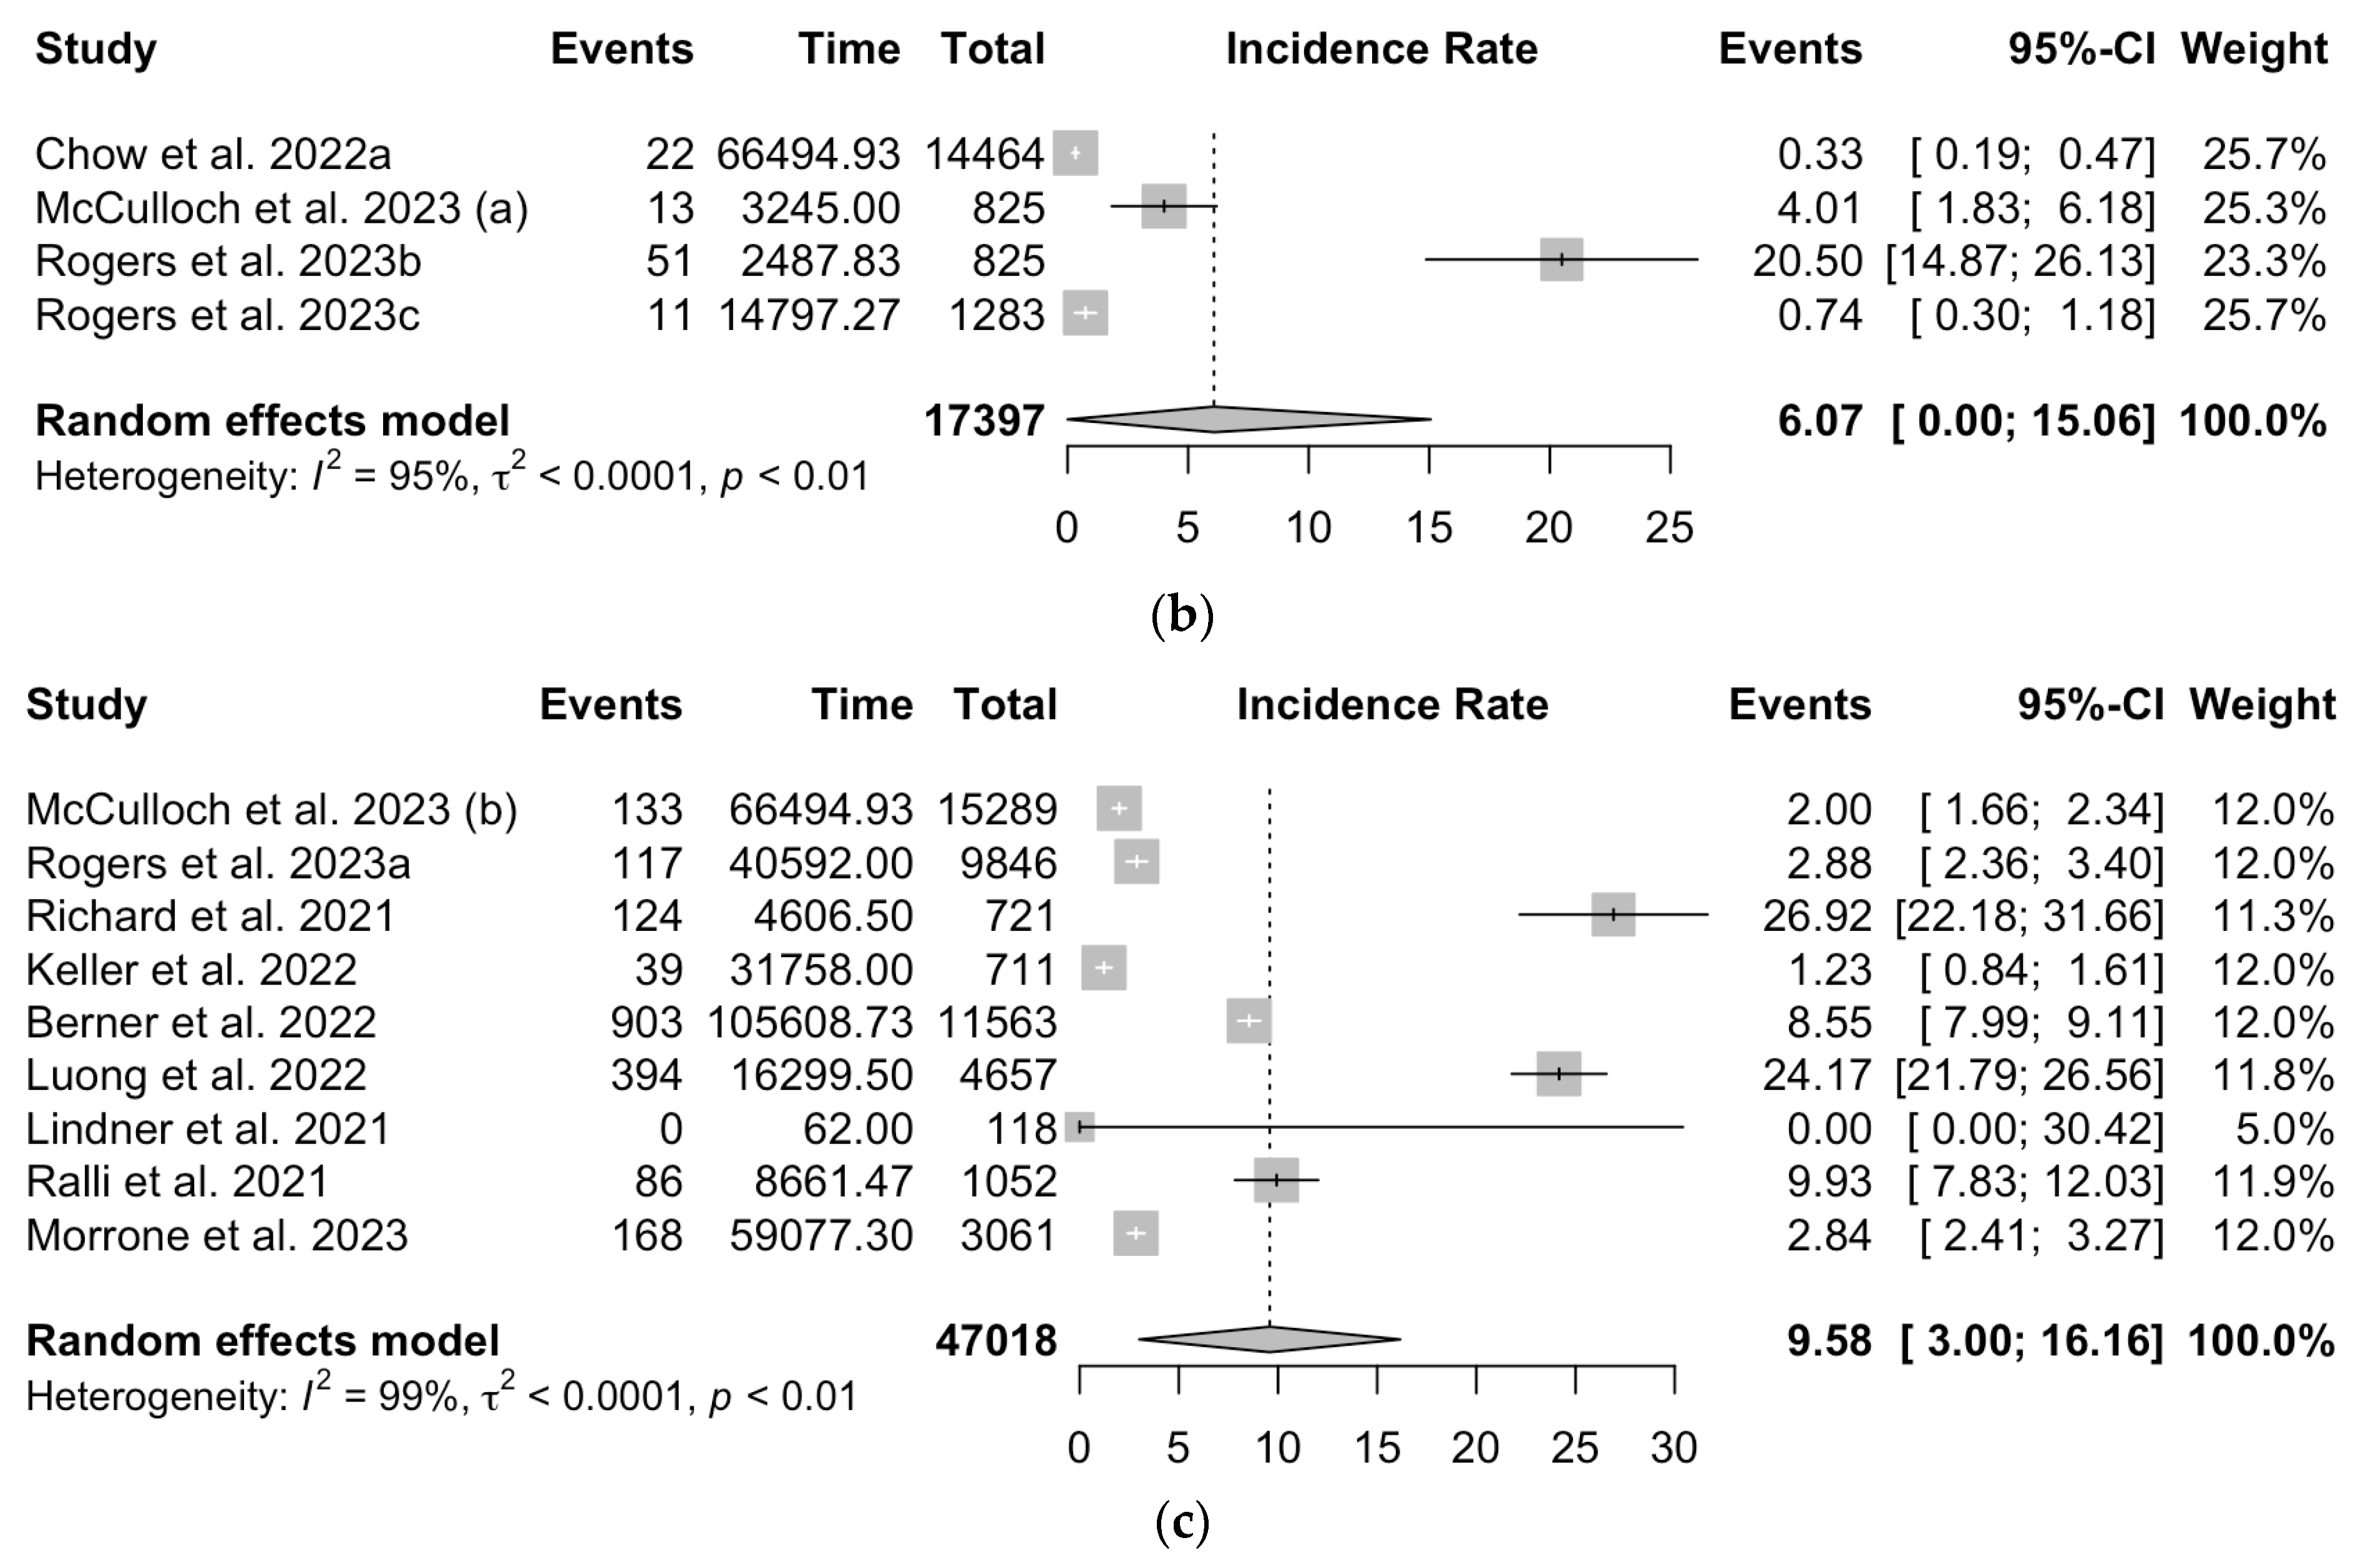
| Pathogen | Number of Estimates | Number of Events | Pooled Incidence (N./1000 Person-Months, 95%CI) | τ2; (I2; 95%CI) |
|---|---|---|---|---|
| RSV | 3 | 49 | 1.71 (0.00; 4.13) | 0.001 (89.4%; 71.3 to 96.1) |
| Influenza | 4 | 97 | 6.07 (0.00; 15.06) | 0.001 (95.2%; 90.7 to 97.5) |
| SARS-CoV-2 | 9 | 1964 | 9.58 (3.00; 16.16) | 0.001 (99.1%; 98.9 to 99.3) |
| Settings | Pathogen | t | df | p Value | Bias (SE) | Intercept (SE) |
|---|---|---|---|---|---|---|
| Prevalence | RSV | −1.42 | 8 | 0.193 | −0.434 (0.305) | −4.592 (0.299) |
| Influenza | −8.46 | 5 | < 0.001 | −1.159 (0.137) | −3.787 (0.108) | |
| SARS-CoV-2 | −1.28 | 20 | 0.216 | −2.989 (2.338) | −1.229 (0.476) | |
| Incidence | RSV | 21.12 | 1 | 0.030 | 3.708 (0.176) | 0.000 (0.000) |
| Influenza | 3.51 | 2 | 0.072 | 4.940 (1.405) | −0.001 (0.001) | |
| SARS-CoV-2 | 2.25 | 7 | 0.060 | 10.994 (4.897) | 0.001 (0.001) |
Disclaimer/Publisher’s Note: The statements, opinions and data contained in all publications are solely those of the individual author(s) and contributor(s) and not of MDPI and/or the editor(s). MDPI and/or the editor(s) disclaim responsibility for any injury to people or property resulting from any ideas, methods, instructions or products referred to in the content. |
© 2024 by the authors. Licensee MDPI, Basel, Switzerland. This article is an open access article distributed under the terms and conditions of the Creative Commons Attribution (CC BY) license (https://creativecommons.org/licenses/by/4.0/).
Share and Cite
Riccò, M.; Baldassarre, A.; Corrado, S.; Bottazzoli, M.; Marchesi, F. Respiratory Syncytial Virus, Influenza and SARS-CoV-2 in Homeless People from Urban Shelters: A Systematic Review and Meta-Analysis (2023). Epidemiologia 2024, 5, 41-79. https://doi.org/10.3390/epidemiologia5010004
Riccò M, Baldassarre A, Corrado S, Bottazzoli M, Marchesi F. Respiratory Syncytial Virus, Influenza and SARS-CoV-2 in Homeless People from Urban Shelters: A Systematic Review and Meta-Analysis (2023). Epidemiologia. 2024; 5(1):41-79. https://doi.org/10.3390/epidemiologia5010004
Chicago/Turabian StyleRiccò, Matteo, Antonio Baldassarre, Silvia Corrado, Marco Bottazzoli, and Federico Marchesi. 2024. "Respiratory Syncytial Virus, Influenza and SARS-CoV-2 in Homeless People from Urban Shelters: A Systematic Review and Meta-Analysis (2023)" Epidemiologia 5, no. 1: 41-79. https://doi.org/10.3390/epidemiologia5010004