

High-Throughput Numerical Investigation of Process Parameter-Melt Pool Relationships in Electron Beam Powder Bed Fusion


Abstract
:1. Introduction
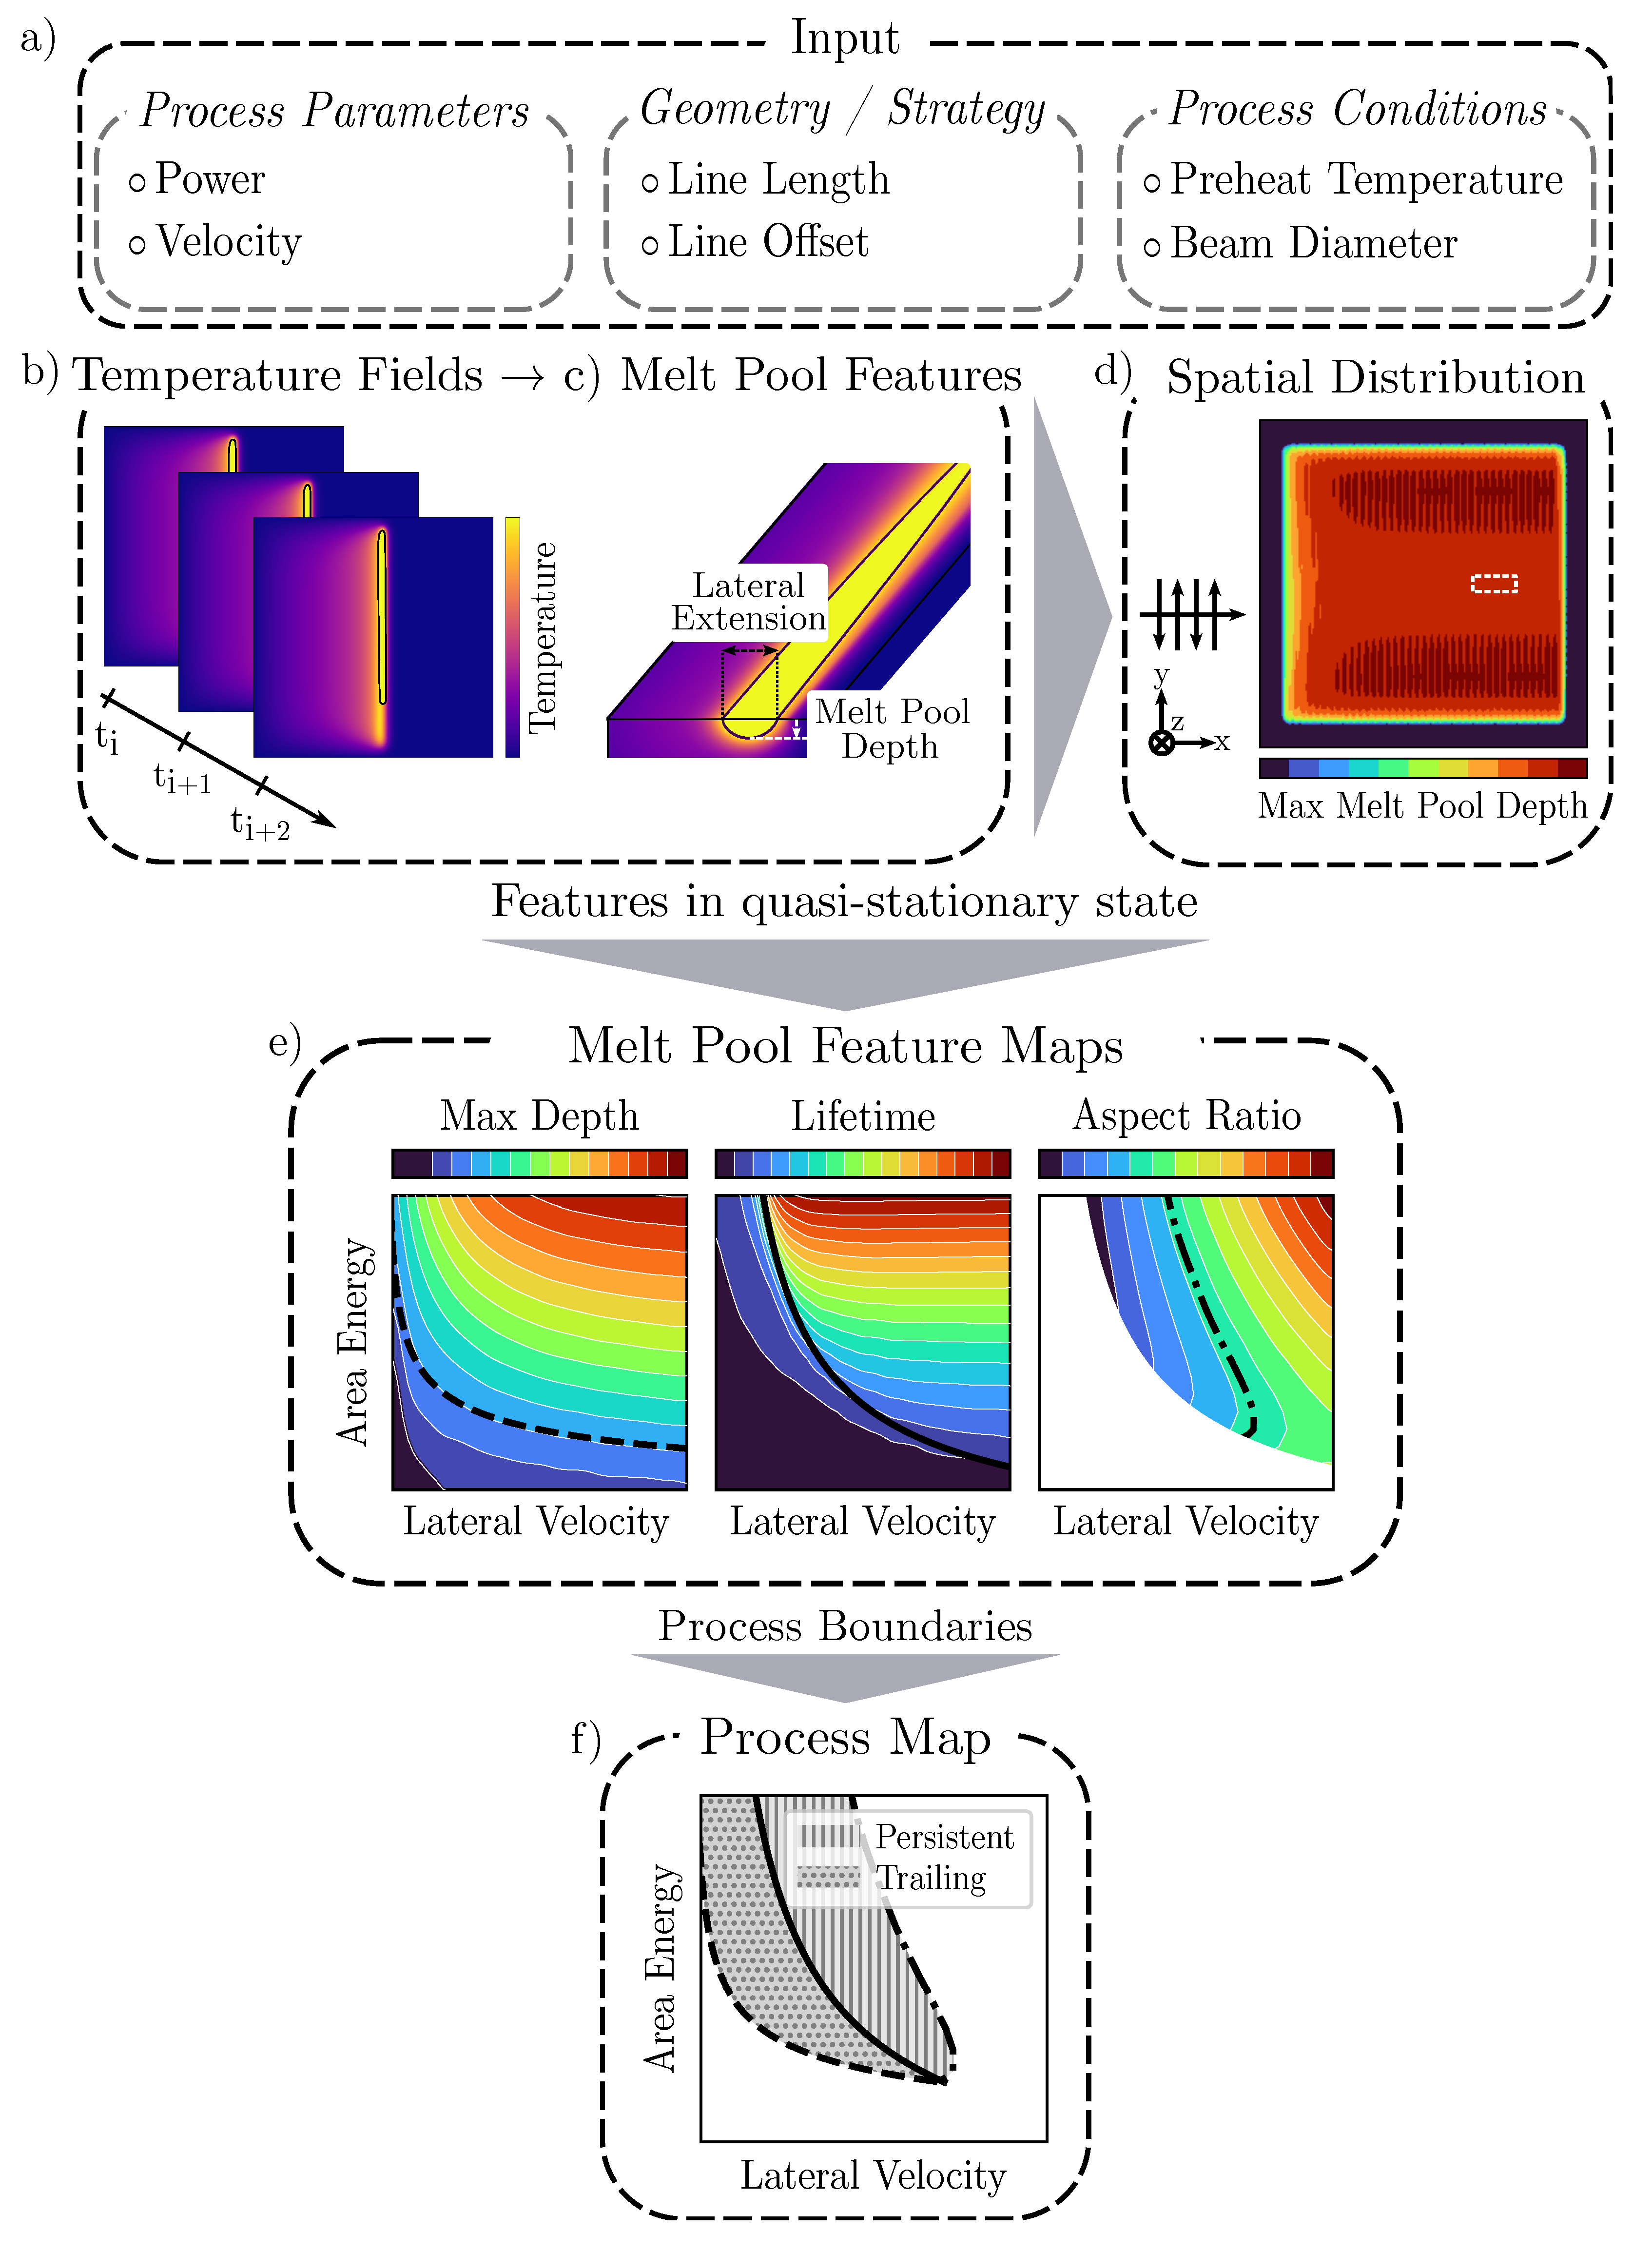
2. Methods
3. Results and Discussion
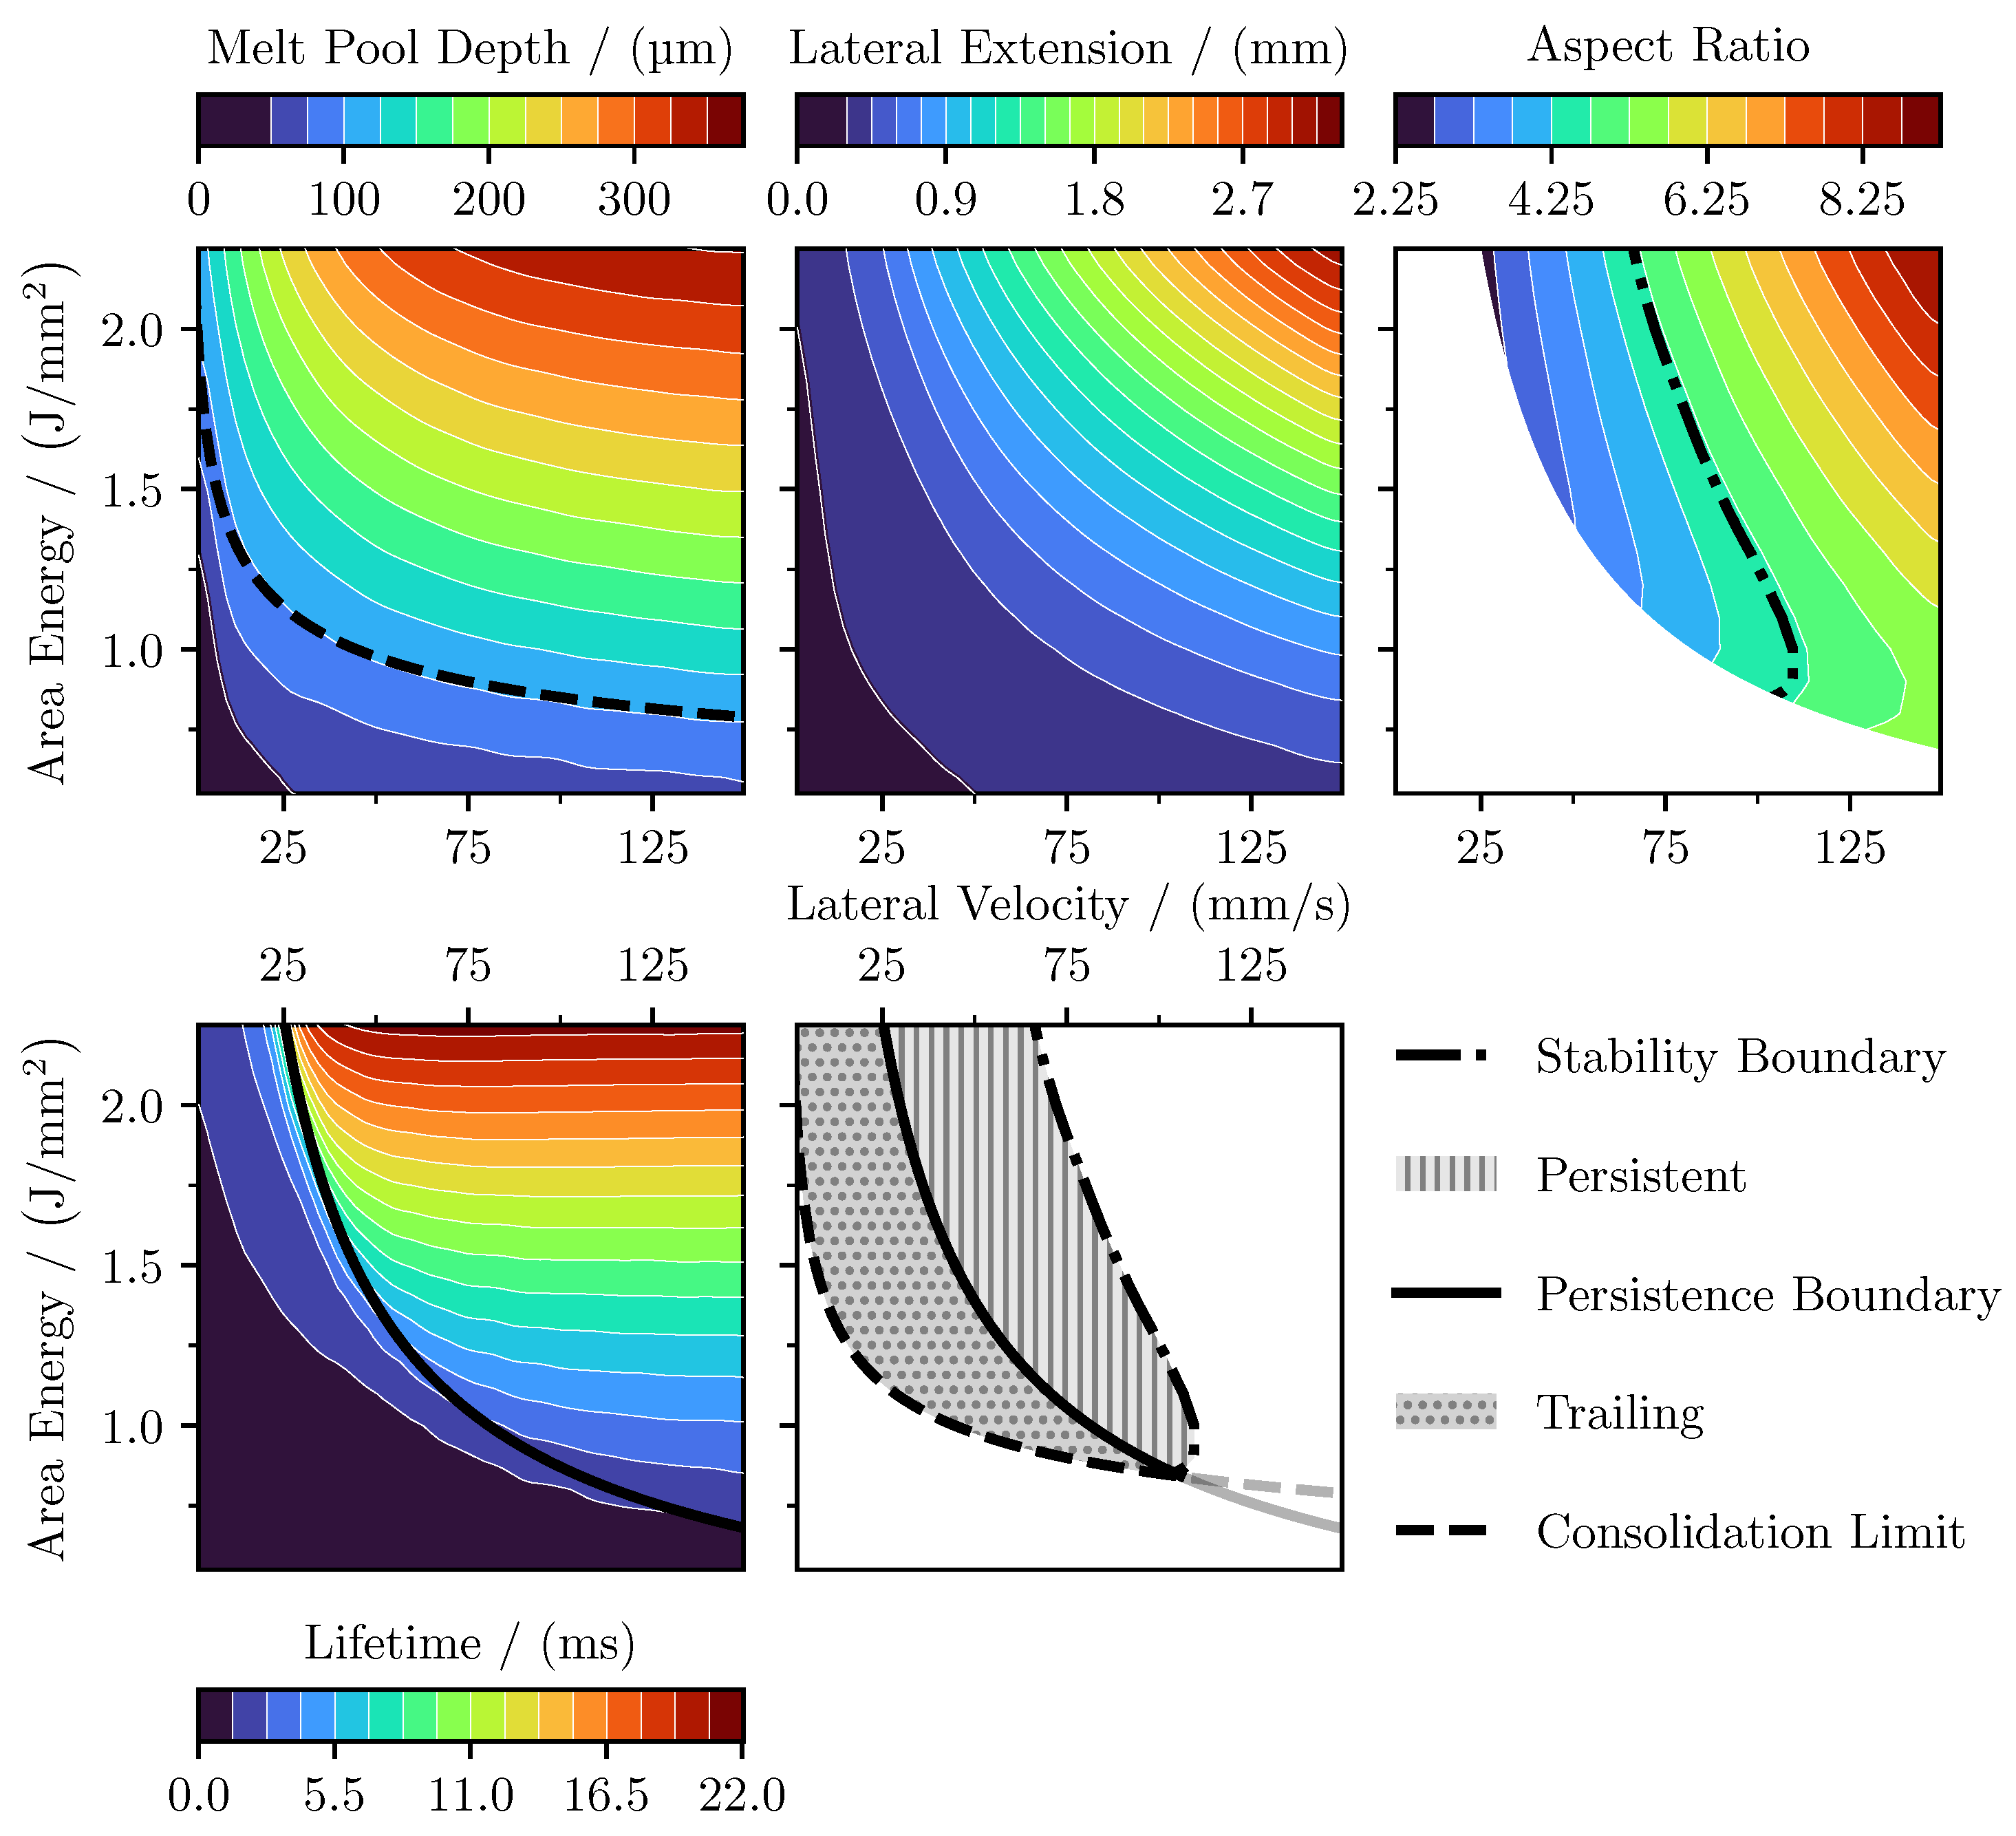
3.1. Process Parameters
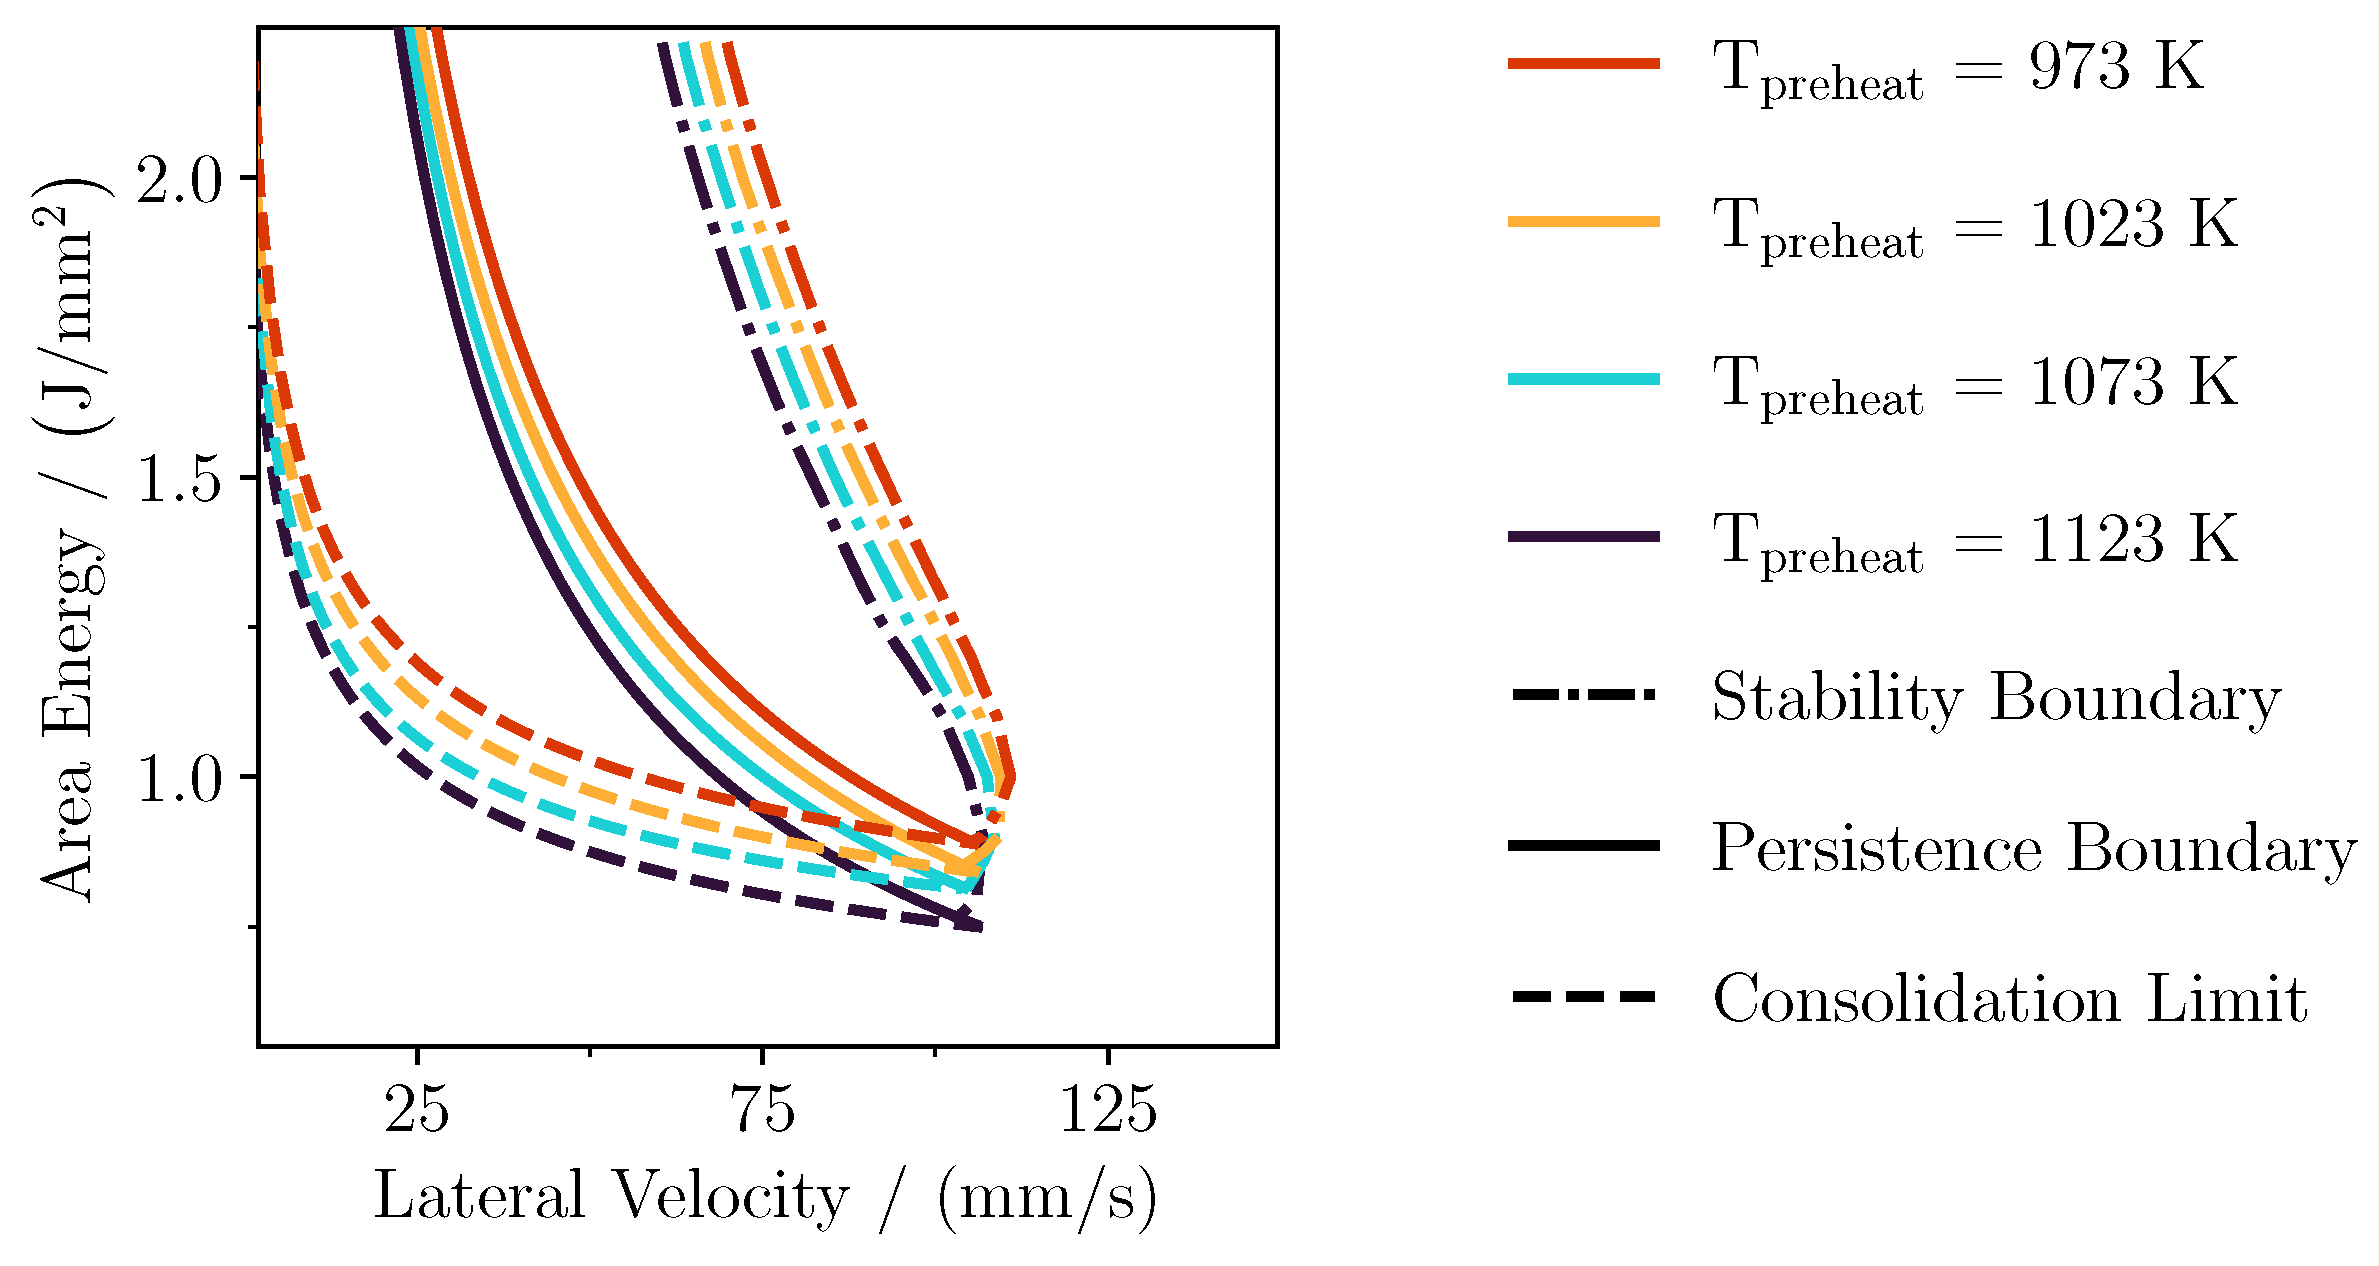
3.2. Processing Conditions-Preheating Temperature
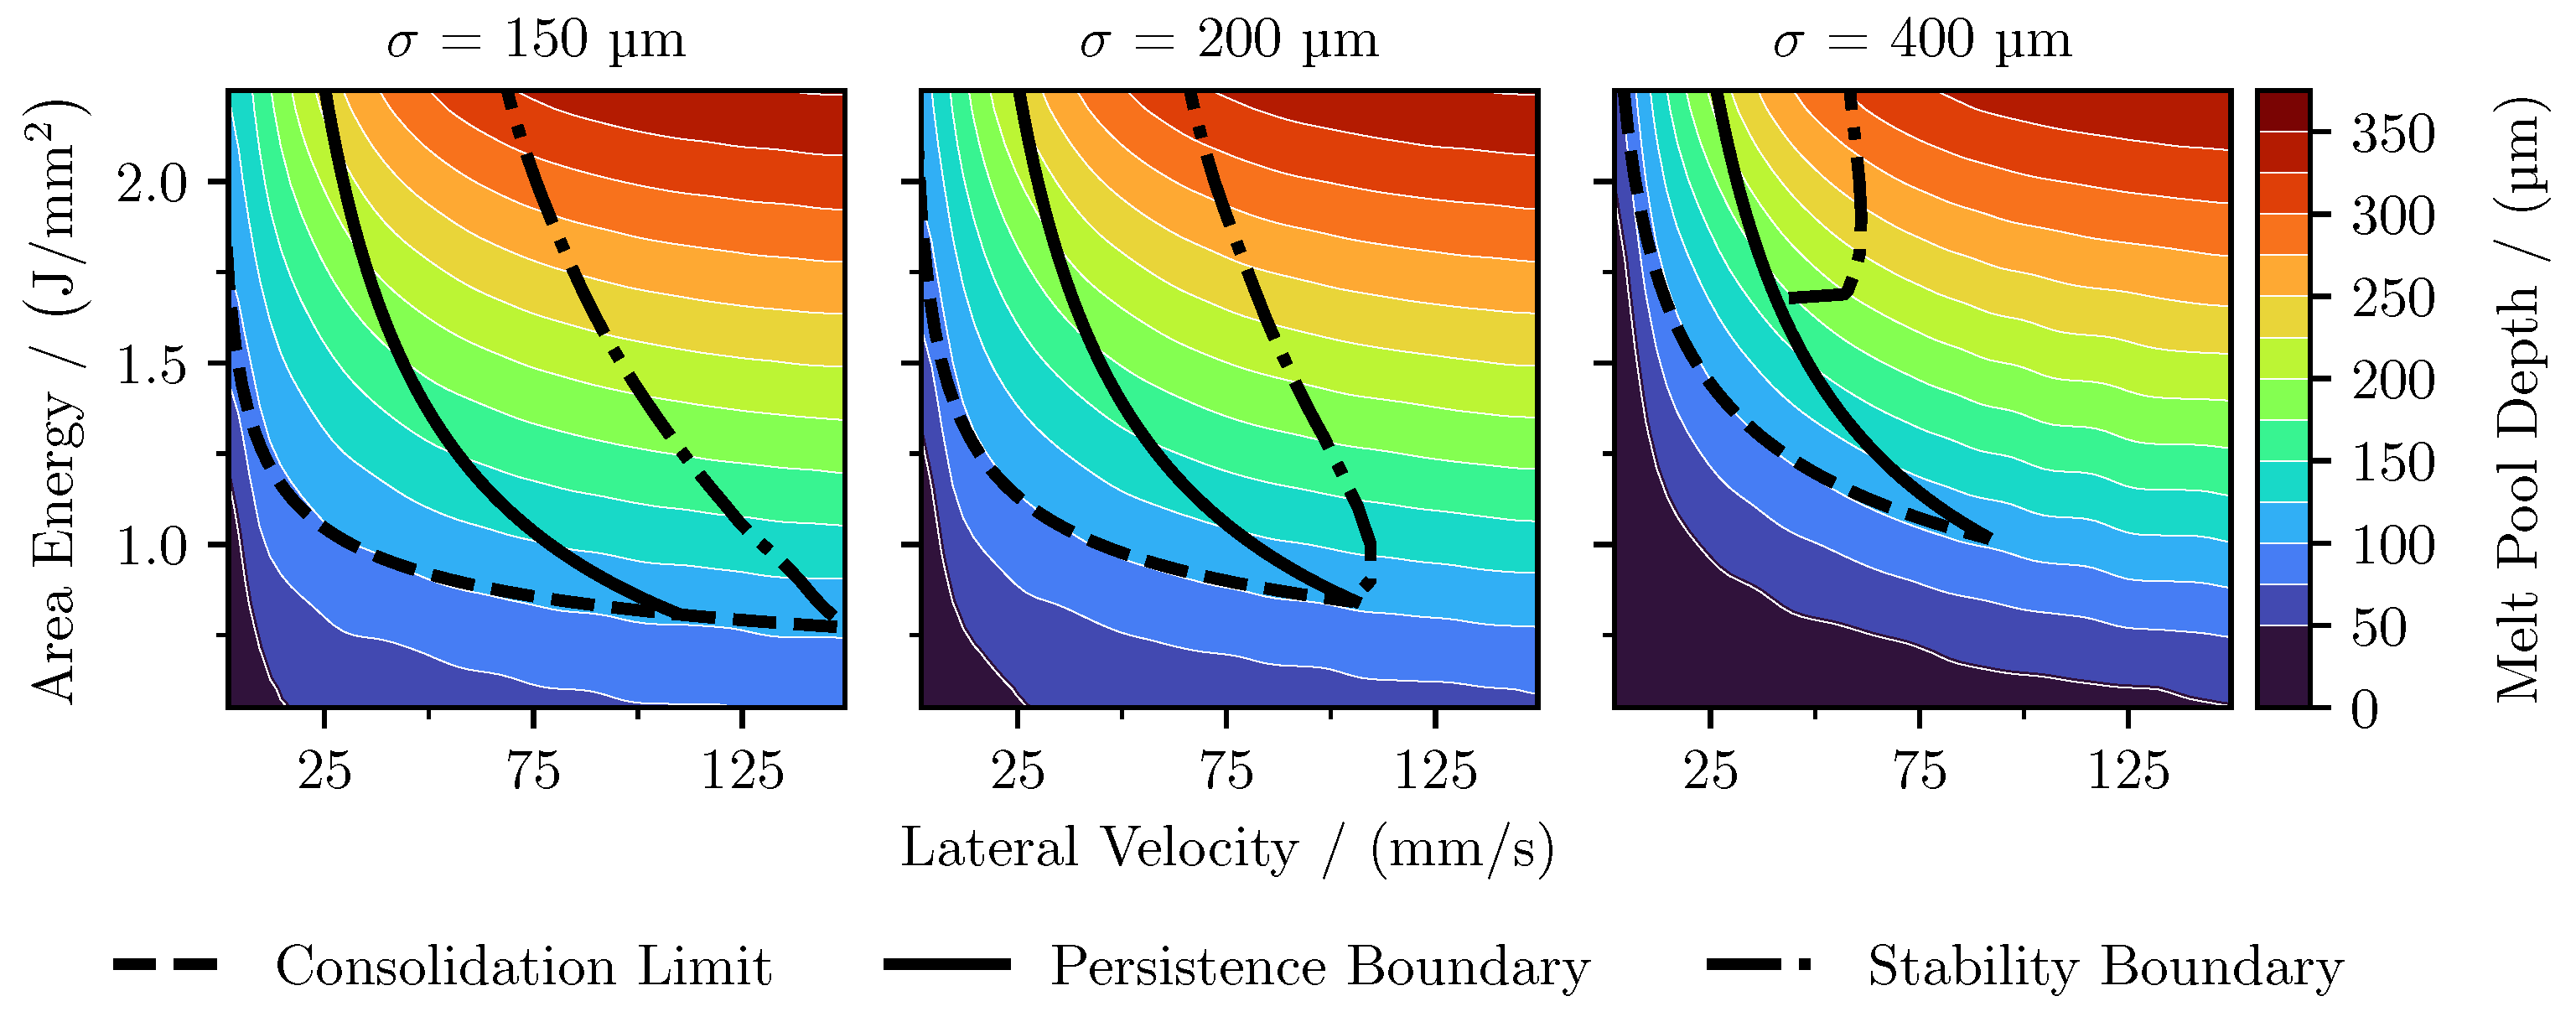
3.3. Processing Conditions-Beam Diameter
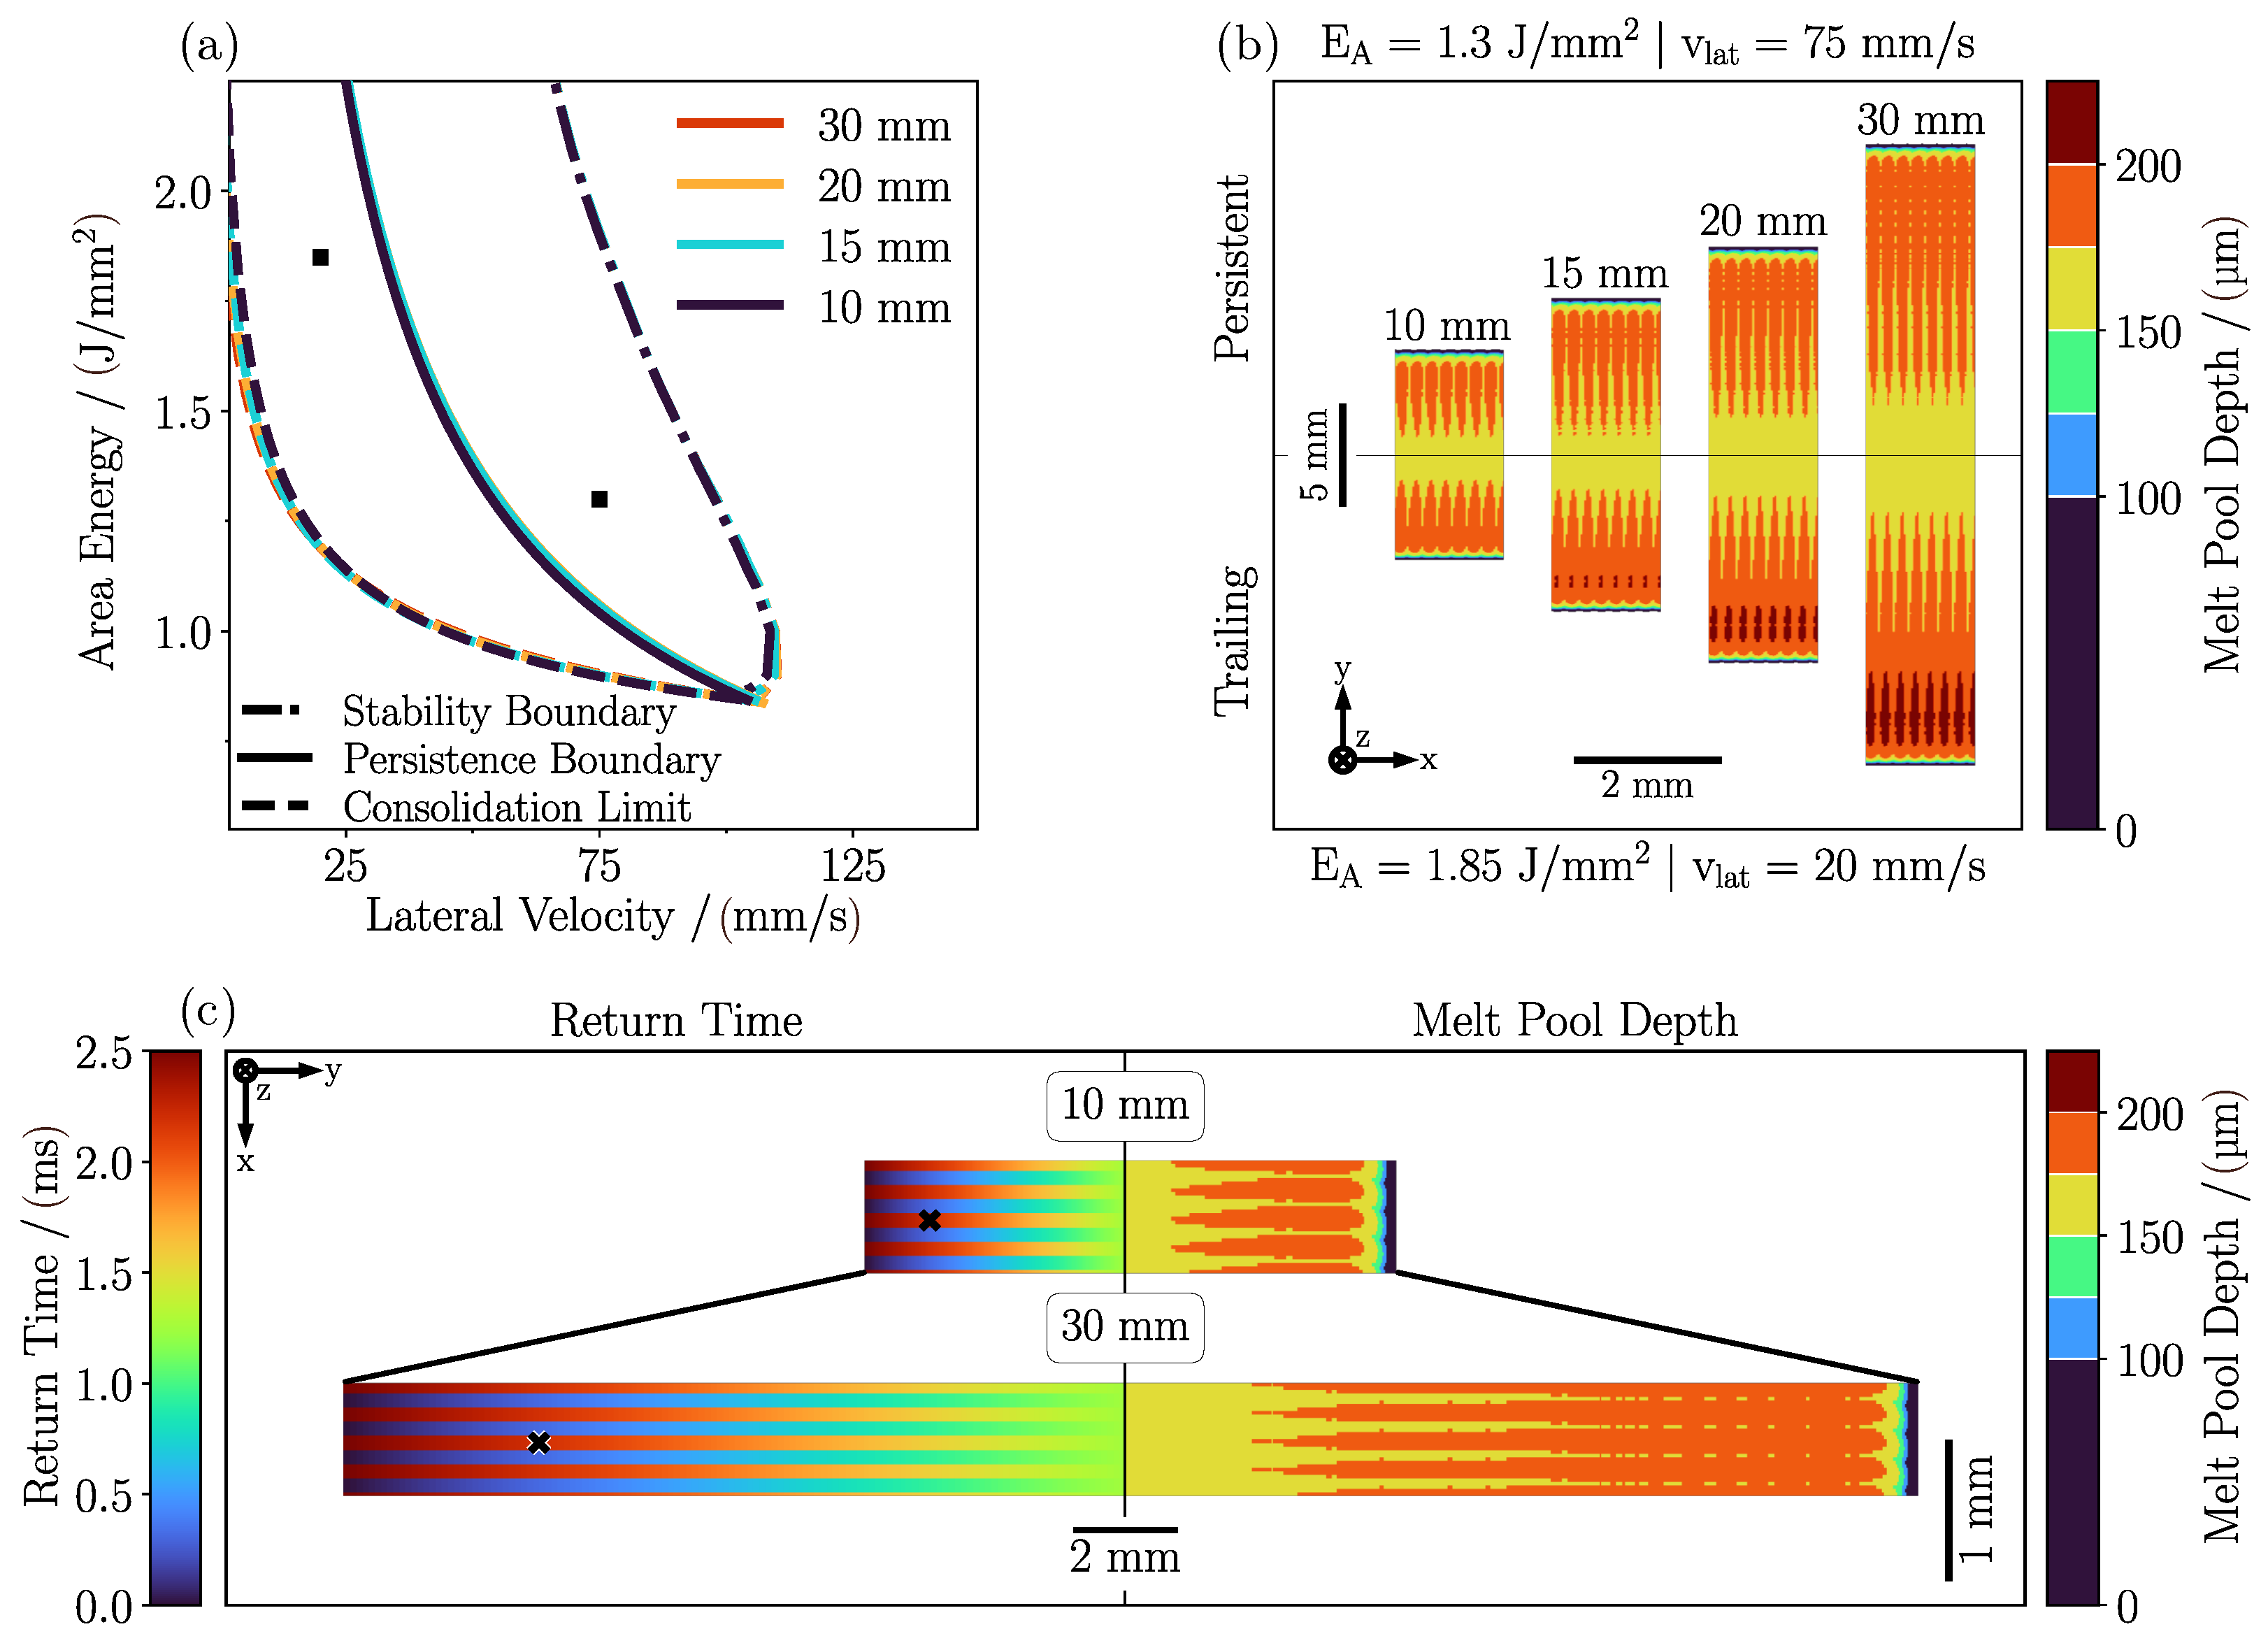
3.4. Scan Length
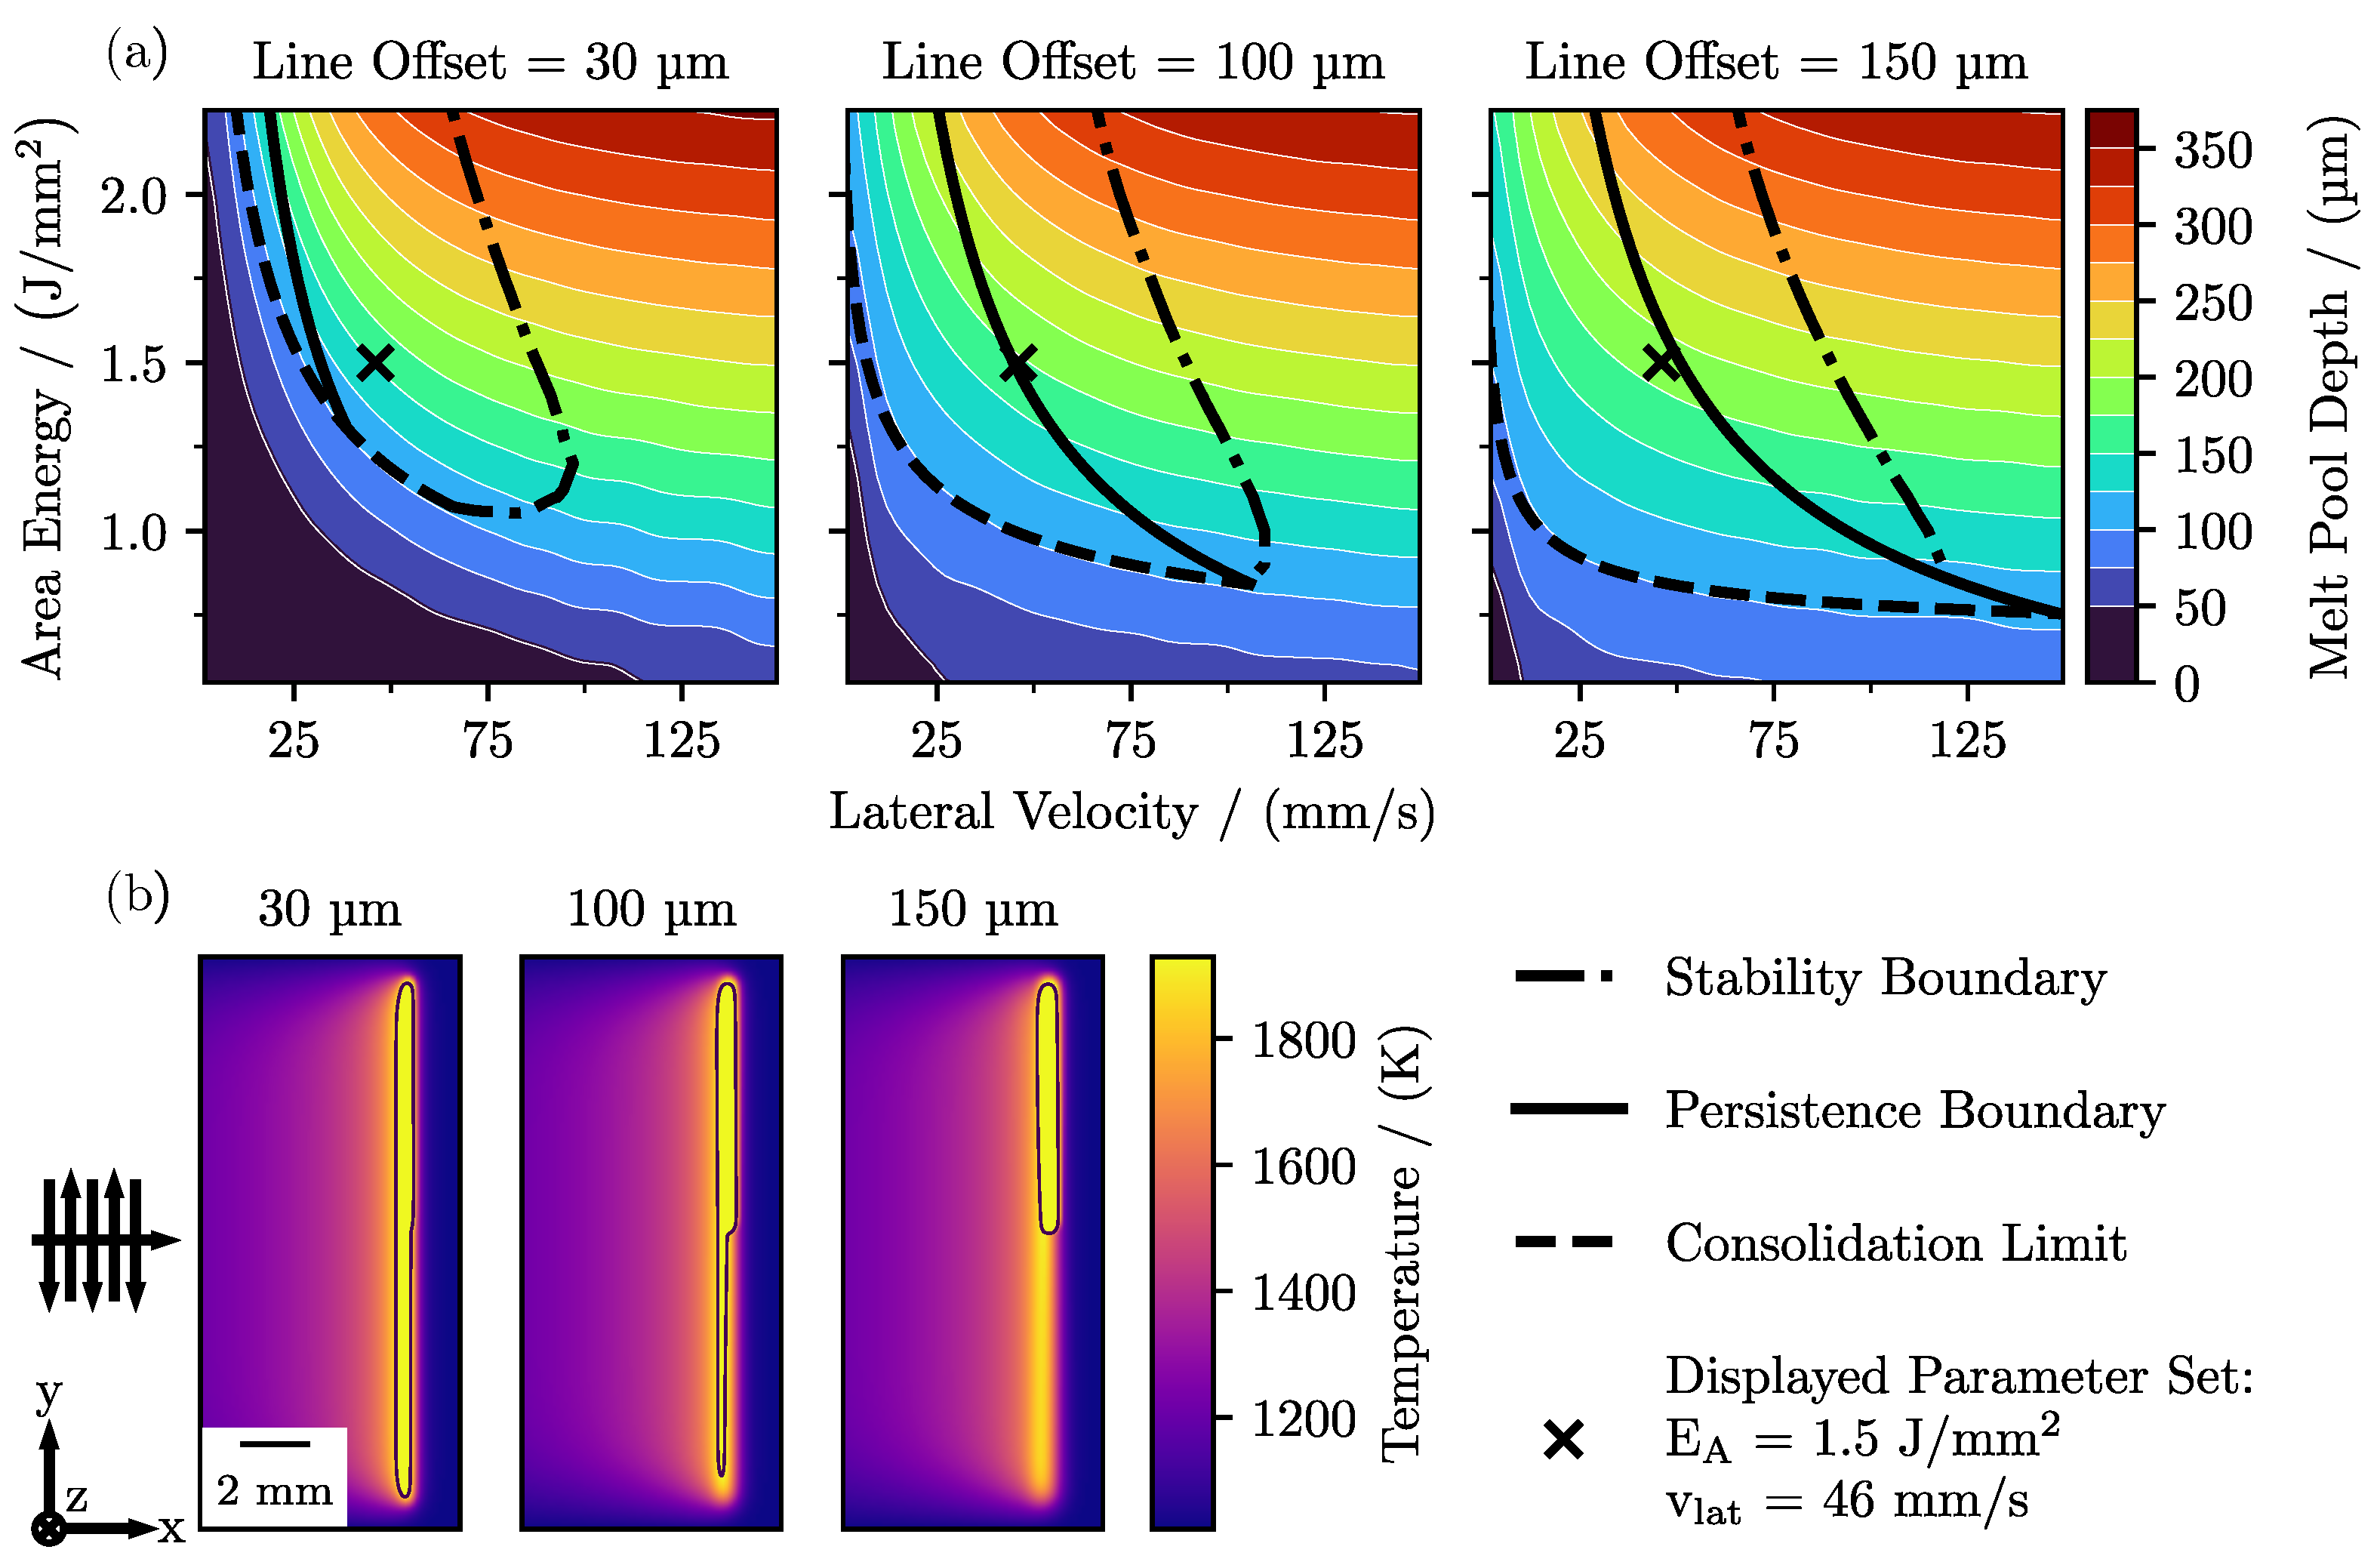
3.5. Line Offset
4. Summary and Conclusions
Author Contributions
Funding
Data Availability Statement
Conflicts of Interest
Appendix A. Material Properties

References
- Del Guercio, G.; Galati, M.; Saboori, A.; Fino, P.; Iuliano, L. Microstructure and Mechanical Performance of Ti–6Al–4V Lattice Structures Manufactured via Electron Beam Melting (EBM): A Review. Acta Metall. Sin. 2020, 33, 183–203. [Google Scholar] [CrossRef]
- Palmquist, A.; Jolic, M.; Hryha, E.; Shah, F.A. Complex geometry and integrated macro-porosity: Clinical applications of electron beam melting to fabricate bespoke bone-anchored implants. Acta Biomater. 2023, 156, 125–145. [Google Scholar] [CrossRef] [PubMed]
- Yang, G.; Yang, P.; Yang, K.; Liu, N.; Jia, L.; Wang, J.; Tang, H. Effect of processing parameters on the density, microstructure and strength of pure tungsten fabricated by selective electron beam melting. Int. J. Refract. Met. Hard Mater. 2019, 84, 105040. [Google Scholar] [CrossRef]
- Terrazas, C.A.; Mireles, J.; Gaytan, S.M.; Morton, P.A.; Hinojos, A.; Frigola, P.; Wicker, R.B. Fabrication and characterization of high-purity niobium using electron beam melting additive manufacturing technology. Int. J. Adv. Manuf. Technol. 2016, 84, 1115–1126. [Google Scholar] [CrossRef]
- Fujieda, T.; Shiratori, H.; Kuwabara, K.; Kato, T.; Yamanaka, K.; Koizumi, Y.; Chiba, A. First demonstration of promising selective electron beam melting method for utilizing high-entropy alloys as engineering materials. Mater. Lett. 2015, 159, 12–15. [Google Scholar] [CrossRef]
- Kirchner, A.; Klöden, B.; Franke-Jurisch, M.; Inarra Rauh-Hain, L.; Weißgärber, T. Manufacturing of Tool Steels by PBF-EB. Metals 2021, 11, 1640. [Google Scholar] [CrossRef]
- Teschke, M.; Moritz, J.; Telgheder, L.; Marquardt, A.; Leyens, C.; Walther, F. Characterization of the high-temperature behavior of PBF-EB/M manufactured γ titanium aluminides. Prog. Addit. Manuf. 2022, 7, 471–480. [Google Scholar] [CrossRef]
- Franke-Jurisch, M.; Mirz, M.; Wenz, T.; Kirchner, A.; Klöden, B.; Weißgärber, T. PBF-EB of Fe-Cr-V Alloy for Wear Applications. Materials 2022, 15, 1679. [Google Scholar] [CrossRef]
- Lei, Y.; Aoyagi, K.; Chiba, A. A method to manipulate non-steady-state columnar-to-equiaxed transition in powder bed fusion additive manufacturing using an electron beam. Acta Mater. 2022, 227, 117717. [Google Scholar] [CrossRef]
- Dehoff, R.R.; Kirka, M.; Sames, W.J.; Bilheux, H.; Tremsin, A.S.; Lowe, L.E.; Babu, S.S. Site specific control of crystallographic grain orientation through electron beam additive manufacturing. Mater. Sci. Technol. 2015, 31, 931–938. [Google Scholar] [CrossRef]
- Raghavan, N.; Stump, B.C.; Fernandez-Zelaia, P.; Kirka, M.M.; Simunovic, S. Influence of geometry on columnar to equiaxed transition during electron beam powder bed fusion of IN718. Addit. Manuf. 2021, 47, 102209. [Google Scholar] [CrossRef]
- Knörlein, J.; Franke, M.; Schloffer, M.; Körner, C. In-situ aluminum control for titanium aluminide via electron beam powder bed fusion to realize a dual microstructure. Addit. Manuf. 2022, 59, 103132. [Google Scholar] [CrossRef]
- Shao, M.; Vijayan, S.; Nandwana, P.; Jinschek, J.R. The effect of beam scan strategies on microstructural variations in Ti-6Al-4V fabricated by electron beam powder bed fusion. Mater. Des. 2020, 196, 109165. [Google Scholar] [CrossRef]
- Karapuzha, A.S.; Fraser, D.; Schliephake, D.; Dietrich, S.; Zhu, Y.; Wu, X.; Huang, A. Microstructure, mechanical behaviour and strengthening mechanisms in Hastelloy X manufactured by electron beam and laser beam powder bed fusion. J. Alloys Compd. 2021, 862, 158034. [Google Scholar] [CrossRef]
- Juechter, V.; Scharowsky, T.; Singer, R.F.; Körner, C. Processing window and evaporation phenomena for Ti-6Al-4V produced by selective electron beam melting. Acta Mater. 2014, 76, 252–258. [Google Scholar] [CrossRef]
- Guo, C.; Ge, W.; Lin, F. Effects of scanning parameters on material deposition during Electron Beam Selective Melting of Ti-6Al-4V powder. J. Mater. Process. Technol. 2015, 217, 148–157. [Google Scholar] [CrossRef]
- Scharowsky, T.; Juechter, V.; Singer, R.F.; Körner, C. Influence of the Scanning Strategy on the Microstructure and Mechanical Properties in Selective Electron Beam Melting of Ti-6Al-4V. Adv. Eng. Mater. 2015, 17, 1573–1578. [Google Scholar] [CrossRef]
- Moritz, J.; Teschke, M.; Marquardt, A.; Stepien, L.; López, E.; Brueckner, F.; Walther, F.; Leyens, C. Influence of Electron Beam Powder Bed Fusion Process Parameters at Constant Volumetric Energy Density on Surface Topography and Microstructural Homogeneity of a Titanium Aluminide Alloy. Adv. Eng. Mater. 2023, 2201871. [Google Scholar] [CrossRef]
- Arnold, C.; Pobel, C.; Osmanlic, F.; Körner, C. Layerwise monitoring of electron beam melting via backscatter electron detection. Rapid Prototyp. J. 2018, 24, 1401–1406. [Google Scholar] [CrossRef]
- Pobel, C.R.; Arnold, C.; Osmanlic, F.; Fu, Z.; Körner, C. Immediate development of processing windows for selective electron beam melting using layerwise monitoring via backscattered electron detection. Mater. Lett. 2019, 249, 70–72. [Google Scholar] [CrossRef]
- Liu, Q.; Wu, H.; Paul, M.J.; He, P.; Peng, Z.; Gludovatz, B.; Kruzic, J.J.; Wang, C.H.; Li, X. Machine-learning assisted laser powder bed fusion process optimization for AlSi10Mg: New microstructure description indices and fracture mechanisms. Acta Mater. 2020, 201, 316–328. [Google Scholar] [CrossRef]
- Tapia, G.; Khairallah, S.; Matthews, M.; King, W.E.; Elwany, A. Gaussian process-based surrogate modeling framework for process planning in laser powder-bed fusion additive manufacturing of 316L stainless steel. Int. J. Adv. Manuf. Technol. 2018, 94, 3591–3603. [Google Scholar] [CrossRef]
- Zhao, M.; Wei, H.; Mao, Y.; Zhang, C.; Liu, T.; Liao, W. Predictions of Additive Manufacturing Process Parameters and Molten Pool Dimensions with a Physics-Informed Deep Learning Model. Engineering 2023, 23, 181–195. [Google Scholar] [CrossRef]
- Zhang, B.; Seede, R.; Xue, L.; Atli, K.C.; Zhang, C.; Whitt, A.; Karaman, I.; Arroyave, R.; Elwany, A. An efficient framework for printability assessment in Laser Powder Bed Fusion metal additive manufacturing. Addit. Manuf. 2021, 46, 102018. [Google Scholar] [CrossRef]
- Aoyagi, K.; Wang, H.; Sudo, H.; Chiba, A. Simple method to construct process maps for additive manufacturing using a support vector machine. Addit. Manuf. 2019, 27, 353–362. [Google Scholar] [CrossRef]
- Breuning, C.; Arnold, C.; Markl, M.; Körner, C. A multivariate meltpool stability criterion for fabrication of complex geometries in electron beam powder bed fusion. Addit. Manuf. 2021, 45, 102051. [Google Scholar] [CrossRef]
- Breuning, C.; Pistor, J.; Markl, M.; Körner, C. Basic Mechanism of Surface Topography Evolution in Electron Beam Based Additive Manufacturing. Materials 2022, 15, 4754. [Google Scholar] [CrossRef]
- Gordon, J.V.; Narra, S.P.; Cunningham, R.W.; Liu, H.; Chen, H.; Suter, R.M.; Beuth, J.L.; Rollett, A.D. Defect structure process maps for laser powder bed fusion additive manufacturing. Addit. Manuf. 2020, 36, 101552. [Google Scholar] [CrossRef]
- Breuning, C.; Markl, M.; Körner, C. A Return Time Compensation Scheme for Complex Geometries in Electron Beam Powder Bed Fusion. Addit. Manuf. 2023; 76, 103767. [Google Scholar]
- Zäh, M.F.; Lutzmann, S. Modelling and simulation of electron beam melting. Prod. Eng. 2010, 4, 15–23. [Google Scholar] [CrossRef]
- Cheng, B.; Chou, K. Melt pool geometry simulations for powder-based electron beam additive manufacturing. In Proceedings of the 2013 International Solid Freeform Fabrication Symposium, Austin, TX, USA, 12–14 August 2013; University of Texas at Austin: Austin, TX, USA, 2013. [Google Scholar]
- Tang, M.; Pistorius, P.C.; Beuth, J.L. Prediction of lack-of-fusion porosity for powder bed fusion. Addit. Manuf. 2017, 14, 39–48. [Google Scholar] [CrossRef]
- Hashemi, S.M.; Parvizi, S.; Baghbanijavid, H.; Tan, A.T.; Nematollahi, M.; Ramazani, A.; Fang, N.X.; Elahinia, M. Computational modelling of process–structure–property–performance relationships in metal additive manufacturing: A review. Int. Mater. Rev. 2022, 67, 1–46. [Google Scholar] [CrossRef]
- Rausch, A.M.; Küng, V.E.; Pobel, C.; Markl, M.; Körner, C. Predictive simulation of process windows for powder bed fusion additive manufacturing: Influence of the powder bulk density. Materials 2017, 10, 1117. [Google Scholar] [CrossRef]
- Markl, M.; Rausch, A.M.; Küng, V.E.; Körner, C. SAMPLE: A Software Suite to Predict Consolidation and Microstructure for Powder Bed Fusion Additive Manufacturing. Adv. Eng. Mater. 2020, 22, 1901270. [Google Scholar] [CrossRef]
- Zakirov, A.; Belousov, S.; Bogdanova, M.; Korneev, B.; Stepanov, A.; Perepelkina, A.; Levchenko, V.; Meshkov, A.; Potapkin, B. Predictive modeling of laser and electron beam powder bed fusion additive manufacturing of metals at the mesoscale. Addit. Manuf. 2020, 35, 101236. [Google Scholar] [CrossRef]
- Plotkowski, A.; Ferguson, J.; Stump, B.; Halsey, W.; Paquit, V.; Joslin, C.; Babu, S.S.; Marquez Rossy, A.; Kirka, M.M.; Dehoff, R.R. A stochastic scan strategy for grain structure control in complex geometries using electron beam powder bed fusion. Addit. Manuf. 2021, 46, 102092. [Google Scholar] [CrossRef]
- Stump, B.; Plotkowski, A. An Adaptive Integration Scheme for Heat Conduction in Additive Manufacturing. Review 2019, 75, 787–805. [Google Scholar] [CrossRef]
- Pistor, J.; Breuning, C.; Körner, C. A single crystal process window for electron beam powder bed fusion additive manufacturing of a cmsx-4 type ni-based superalloy. Materials 2021, 14, 3785. [Google Scholar] [CrossRef] [PubMed]
- Rubenchik, A.M.; King, W.E.; Wu, S.S. Scaling laws for the additive manufacturing. J. Mater. Process. Technol. 2018, 257, 234–243. [Google Scholar] [CrossRef]
- Cacace, S.; Semeraro, Q. Fast optimisation procedure for the selection of L-PBF parameters based on utility function. Virtual Phys. Prototyp. 2022, 17, 125–137. [Google Scholar] [CrossRef]
- Weaver, J.S.; Heigel, J.C.; Lane, B.M. Laser spot size and scaling laws for laser beam additive manufacturing. J. Manuf. Process. 2022, 73, 26–39. [Google Scholar] [CrossRef]
- Plotkowski, A. Geometry-Dependent Solidification Regimes in Metal Additive Manufacturing. Weld. J. 2020, 99, 59S–66S. [Google Scholar] [CrossRef]
- Stump, B.; Plotkowski, A.; Coleman, J. Solidification dynamics in metal additive manufacturing: Analysis of model assumptions. Model. Simul. Mater. Sci. Eng. 2021, 29, 035001. [Google Scholar] [CrossRef]
- Nguyen, N.T.; Ohta, A.; Matsuoka, K.; Suzuki, N.; Maeda, Y. Analytical Solutions for Transient Temperature of Semi-Infinite Body Subjected to 3-D Moving Heat Sources. Weld. J. 1999, 78, 265-s. [Google Scholar]
- Li, J.J.; Johnson, W.L.; Rhim, W.K. Thermal expansion of liquid Ti–6Al–4V measured by electrostatic levitation. Appl. Phys. Lett. 2006, 89, 111913. [Google Scholar] [CrossRef]
- Welsch, G.; Boyer, R.; Collings, E. Materials Properties Handbook: Titanium Alloys; ASM International: Almere, The Netherlands, 1993. [Google Scholar]
- Boivineau, M.; Cagran, C.; Doytier, D.; Eyraud, V.; Nadal, M.H.; Wilthan, B.; Pottlacher, G. Thermophysical properties of solid and liquid Ti-6Al-4V (TA6V) alloy. Int. J. Thermophys. 2006, 27, 507–529. [Google Scholar] [CrossRef]
- Harris, C.R.; Millman, K.J.; van der Walt, S.J.; Gommers, R.; Virtanen, P.; Cournapeau, D.; Wieser, E.; Taylor, J.; Berg, S.; Smith, N.J.; et al. Array programming with NumPy. Nature 2020, 585, 357–362. [Google Scholar] [CrossRef]
- Dalcin, L.; Fang, Y.L.L. Mpi4py: Status Update after 12 Years of Development. Comput. Sci. Eng. 2021, 23, 47–54. [Google Scholar] [CrossRef]
- Pobel, C.R.; Osmanlic, F.; Lodes, M.A.; Wachter, S.; Körner, C. Processing windows for Ti-6Al-4V fabricated by selective electron beam melting with improved beam focus and different scan line spacings. Rapid Prototyp. J. 2019, 25, 665–671. [Google Scholar] [CrossRef]
- Roos, S.; Rännar, L.E. Process window for electron beam melting of 316ln stainless steel. Metals 2021, 11, 137. [Google Scholar] [CrossRef]
- Riensche, A.; Bevans, B.D.; Smoqi, Z.; Yavari, R.; Krishnan, A.; Gilligan, J.; Piercy, N.; Cole, K.; Rao, P. Feedforward Control of Thermal History in Laser Powder Bed Fusion: Toward Physics-based Optimization of Processing Parameters. Mater. Des. 2022, 224, 111351. [Google Scholar] [CrossRef]
- Renner, J.; Breuning, C.; Markl, M.; Körner, C. Surface topographies from electron optical images in electron beam powder bed fusion for process monitoring and control. Addit. Manuf. 2022, 60, 103172. [Google Scholar] [CrossRef]
- Reith, M.; Breuning, C.; Franke, M.; Körner, C. Impact of the Power-Dependent Beam Diameter during Electron Beam Additive Manufacturing: A Case Study with γ-TiAl. Appl. Sci. 2022, 12, 11300. [Google Scholar] [CrossRef]
- Klassen, A.; Forster, V.E.; Juechter, V.; Körner, C. Numerical simulation of multi-component evaporation during selective electron beam melting of TiAl. J. Mater. Process. Technol. 2017, 247, 280–288. [Google Scholar] [CrossRef]
- Gotterbarm, M.R. Kornstrukturmodifikation beim Selektiven Elektronenstrahlschmelzen der Nickelbasis-Superlegierung IN718. Ph.D. Thesis, Friedrich-Alexander-Universität Erlangen-Nürnberg (FAU), Erlangen, Germany, 2022. [Google Scholar]


| Property | Unit | Base Value | Range |
|---|---|---|---|
| Area Energy | J/mm2 | / | [0.6…2.2, 0.1] |
| Lateral Velocity | mm/s | / | [2…149.5, 2.5] |
| Line Offset | µm | 100 | [30, 100, 150] |
| Scan Length | mm | 15 | [10, 15, 20, 30] |
| Beam Diameter (FWHM) | µm | 200 | [150, 200, 400] |
| Preheating Temperature | K | 1023 | [973, 1023, 1073, 1123] |
Disclaimer/Publisher’s Note: The statements, opinions and data contained in all publications are solely those of the individual author(s) and contributor(s) and not of MDPI and/or the editor(s). MDPI and/or the editor(s) disclaim responsibility for any injury to people or property resulting from any ideas, methods, instructions or products referred to in the content. |
© 2023 by the authors. Licensee MDPI, Basel, Switzerland. This article is an open access article distributed under the terms and conditions of the Creative Commons Attribution (CC BY) license (https://creativecommons.org/licenses/by/4.0/).
Share and Cite
Breuning, C.; Böhm, J.; Markl, M.; Körner, C. High-Throughput Numerical Investigation of Process Parameter-Melt Pool Relationships in Electron Beam Powder Bed Fusion. Modelling 2023, 4, 336-350. https://doi.org/10.3390/modelling4030019
Breuning C, Böhm J, Markl M, Körner C. High-Throughput Numerical Investigation of Process Parameter-Melt Pool Relationships in Electron Beam Powder Bed Fusion. Modelling. 2023; 4(3):336-350. https://doi.org/10.3390/modelling4030019
Chicago/Turabian StyleBreuning, Christoph, Jonas Böhm, Matthias Markl, and Carolin Körner. 2023. "High-Throughput Numerical Investigation of Process Parameter-Melt Pool Relationships in Electron Beam Powder Bed Fusion" Modelling 4, no. 3: 336-350. https://doi.org/10.3390/modelling4030019