
EC3-Compatible Methods for Analysis and Design of Steel Framed Structures


Abstract
:1. Introduction
1.1. Nonlinear Behaviour of Steel Structures
1.2. Imperfections
1.3. Modelling–Analysis–Verification
1.4. Advantages and Disadvantages of Different Methods
1.5. Literature Review
1.6. Objectives and Outline
2. Examined Analysis and Design Methods
- GMNIA: Geometrically and Materially Nonlinear Analysis with Imperfections
- GNIA-SD: Geometrically Nonlinear Analysis with Imperfections—Section Design
- GM: General Method
- GNA-SMD: Geometrically Nonlinear Analysis—Section and Member Design
- LA-SMD: Linear Analysis—Section and Member Design
2.1. GMNIA
2.2. GNIA-SD
2.3. General Method
2.4. GNA-SMD
2.5. LA-SMD
3. Examined Frames
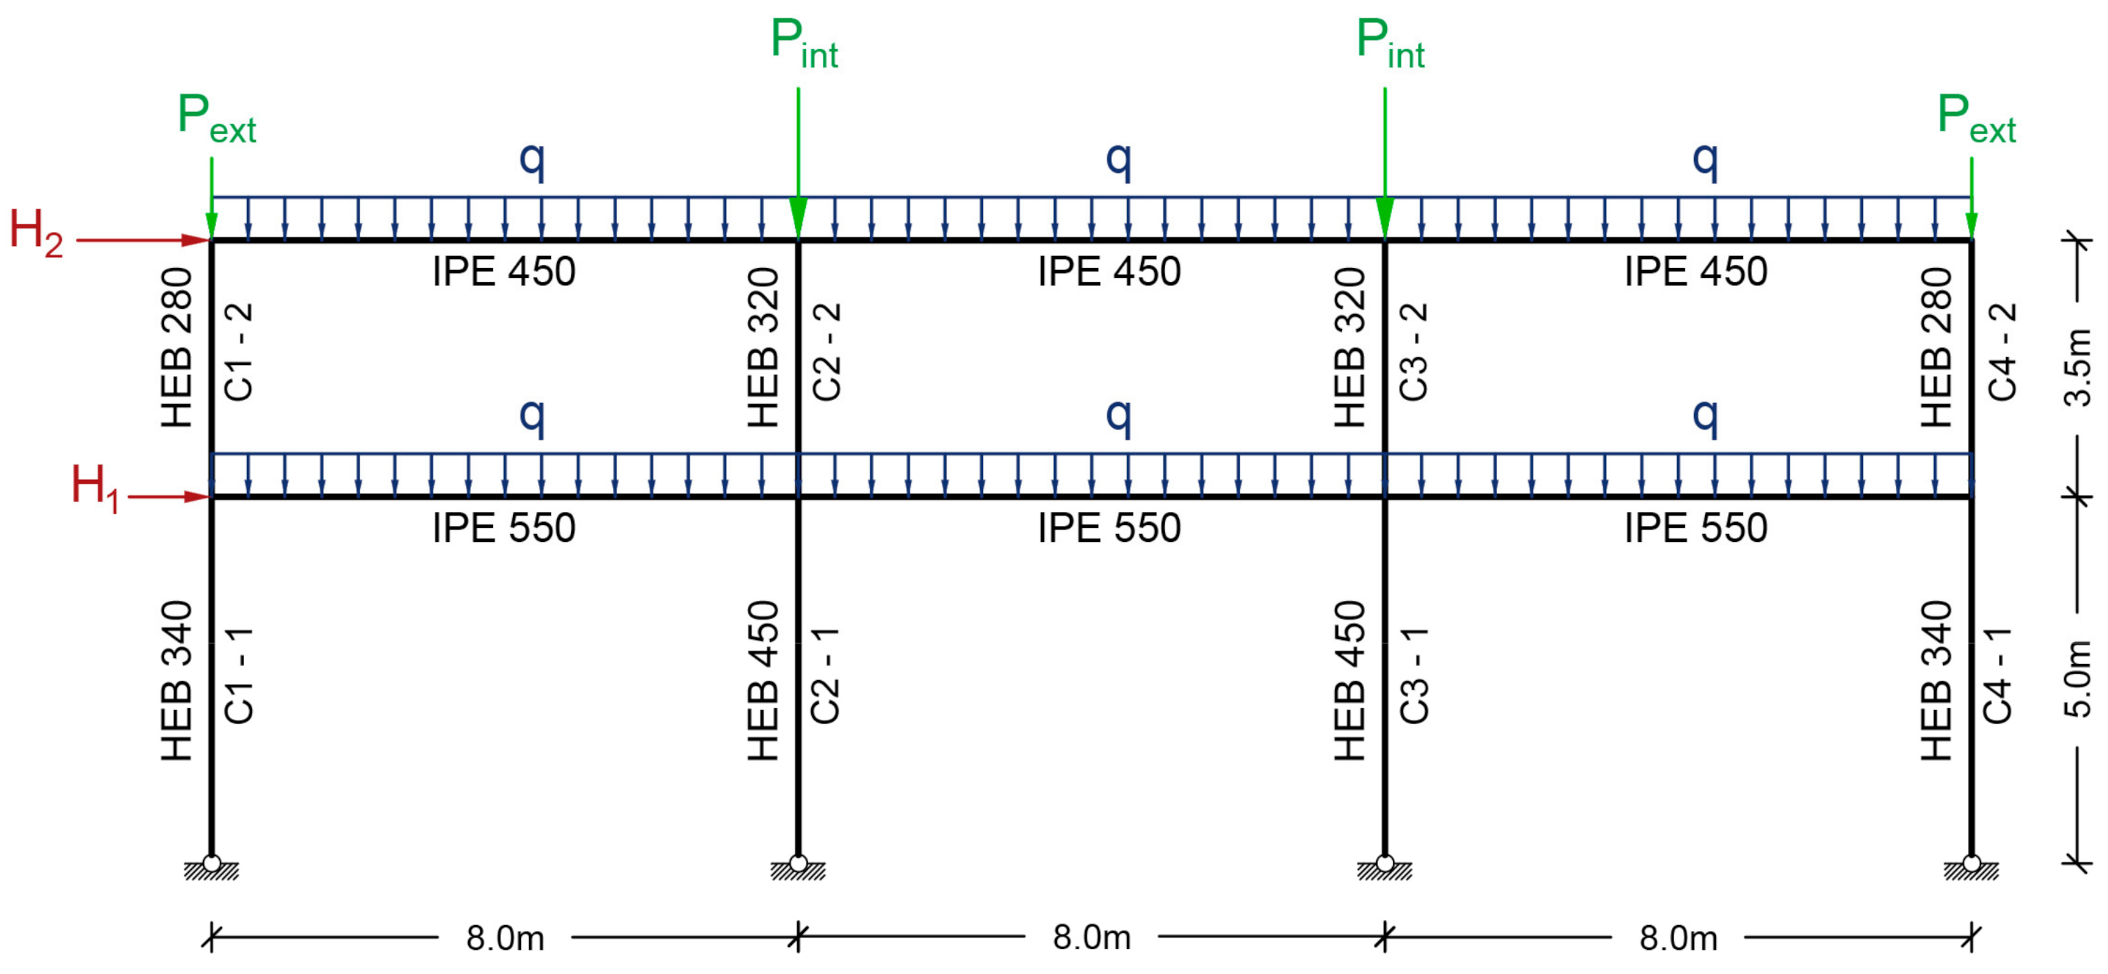
3.1. Geometry and Material
3.2. Loads
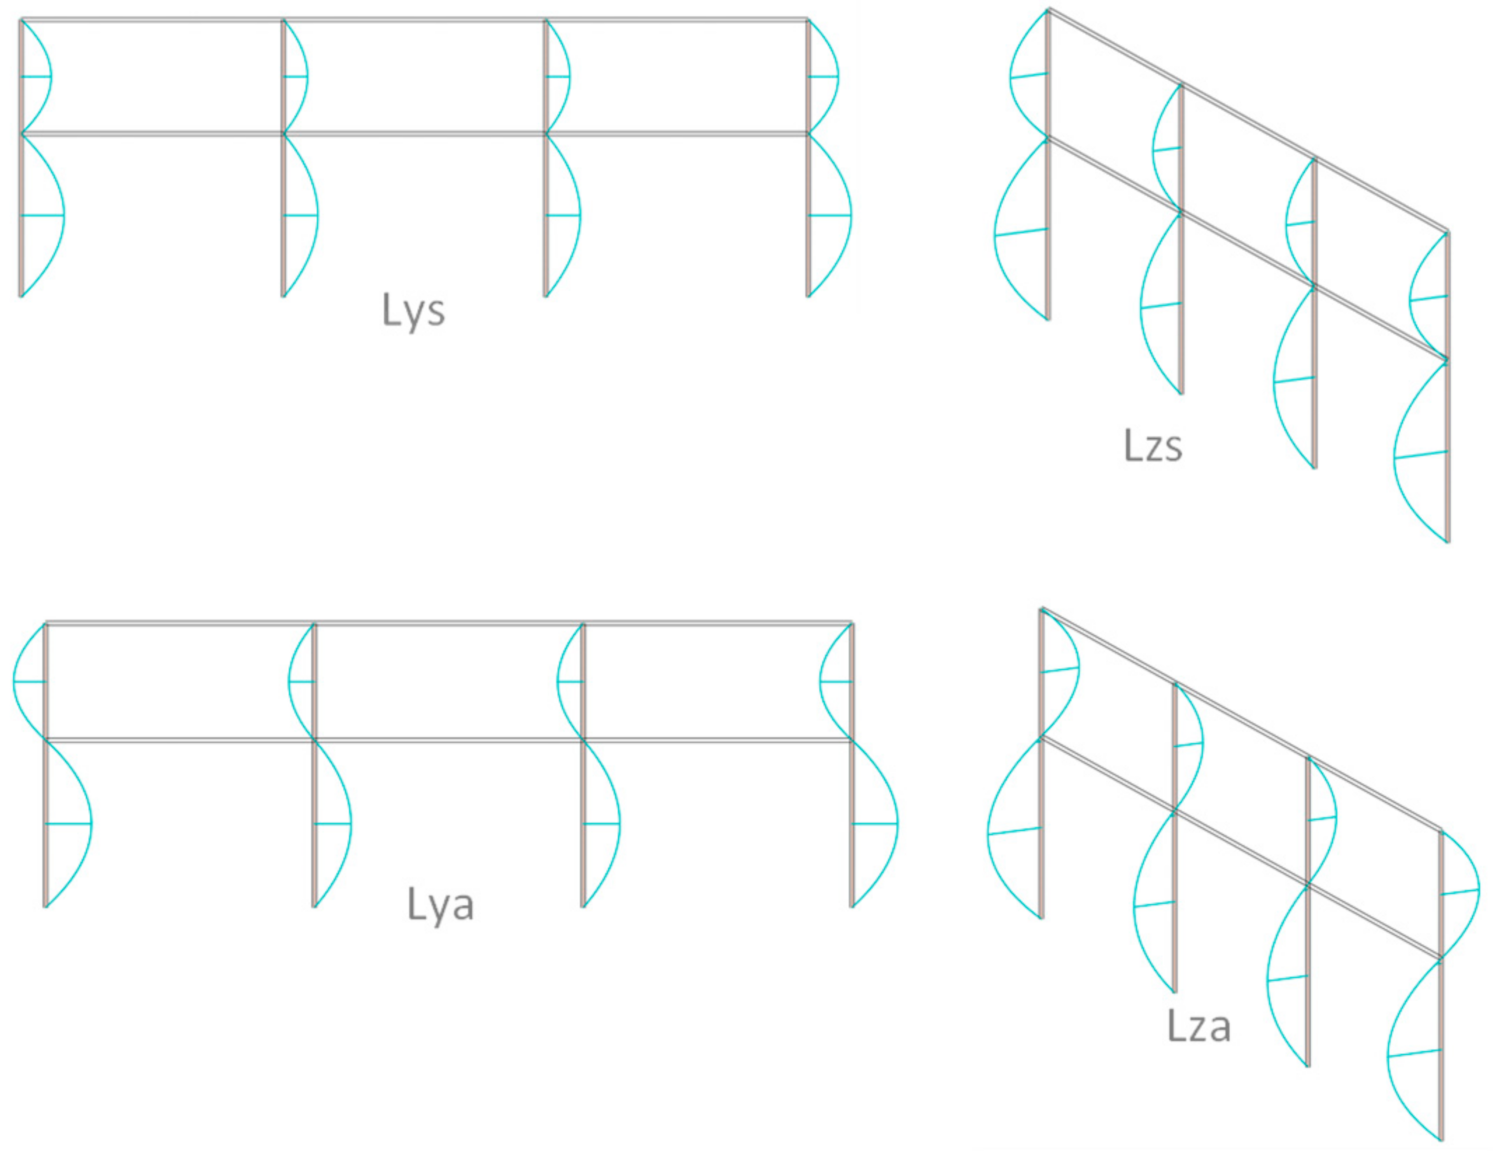
3.3. Imperfections
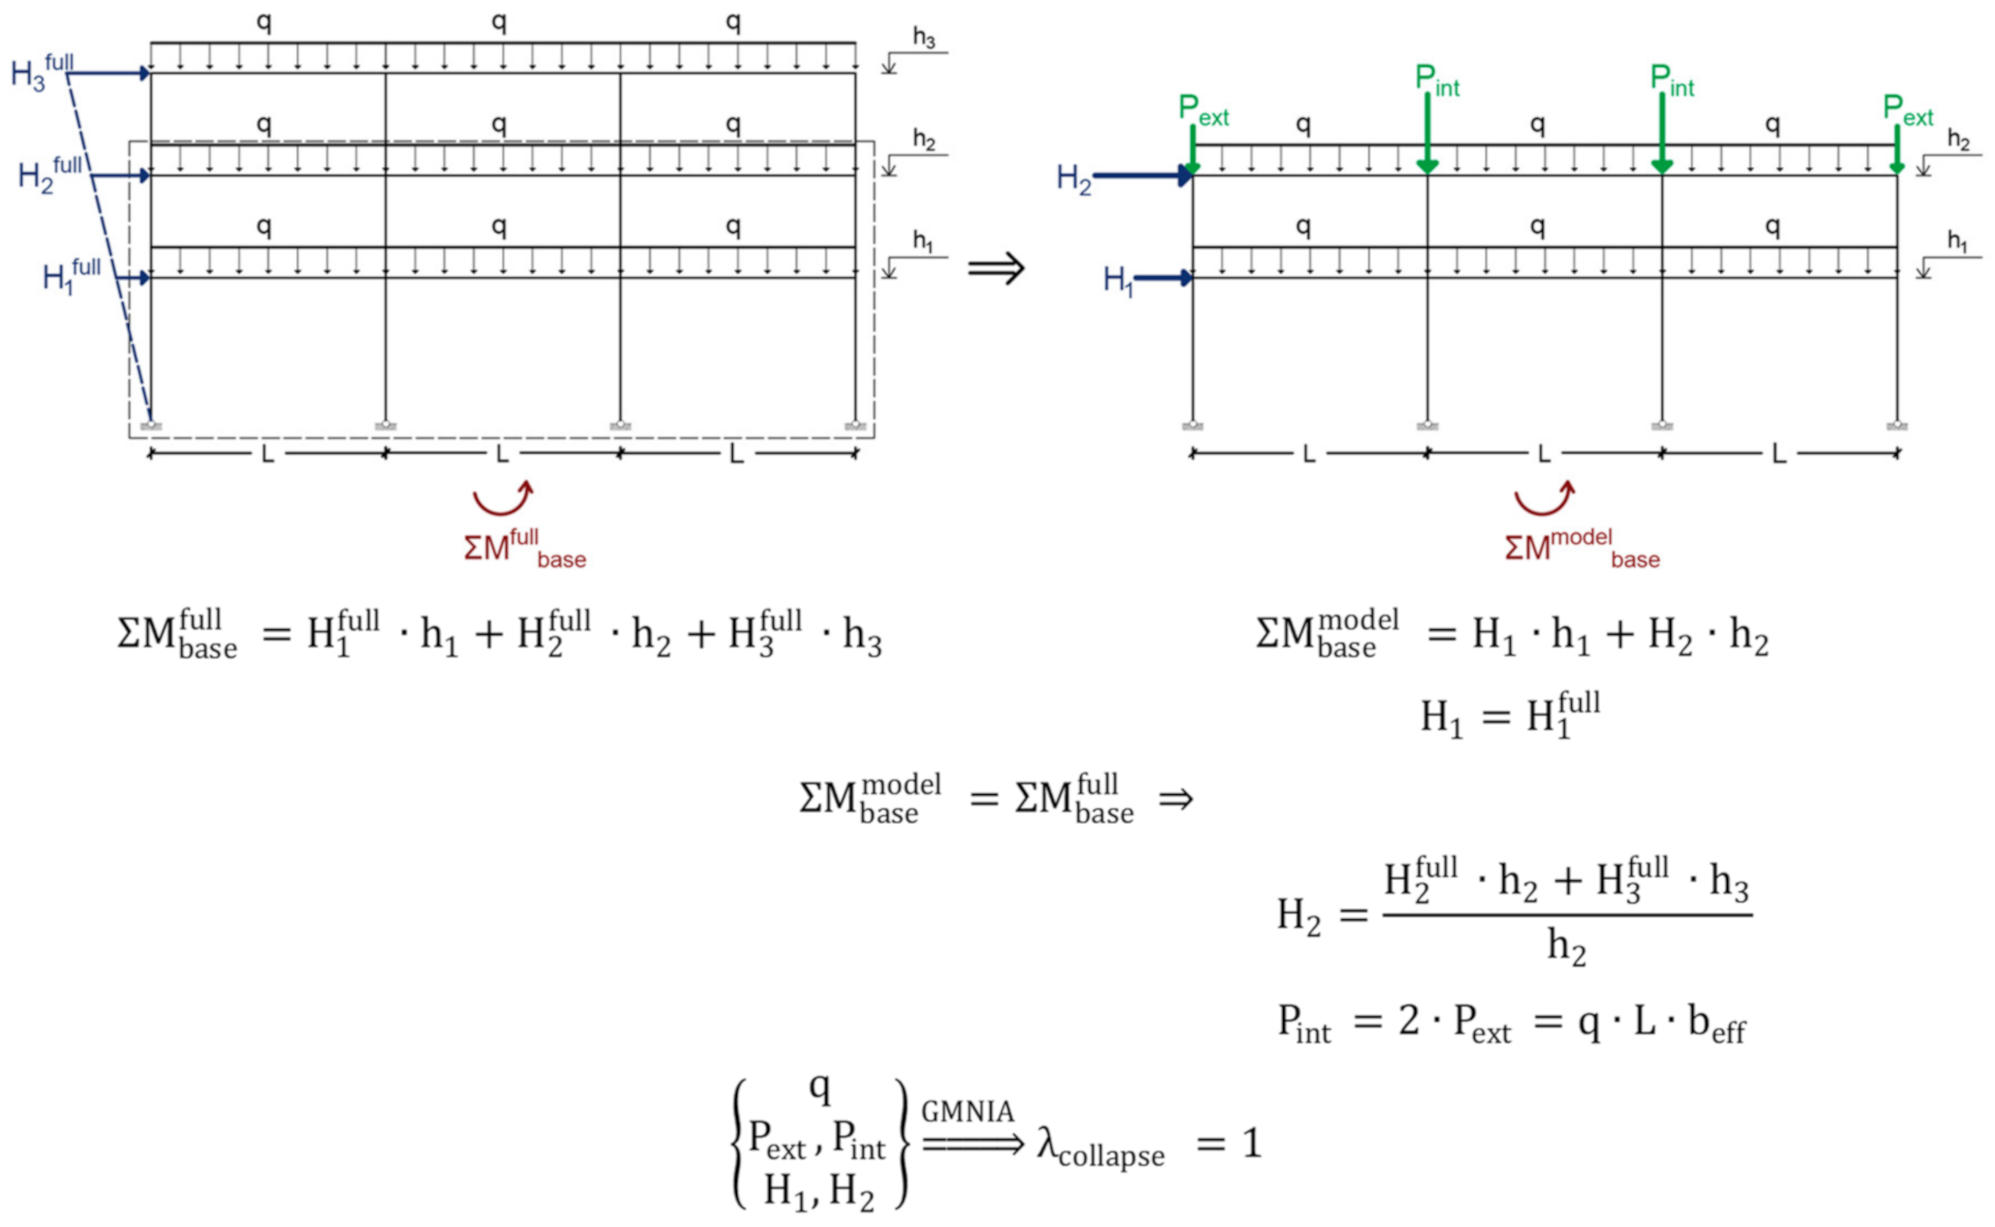
3.4. Modelling
4. Results
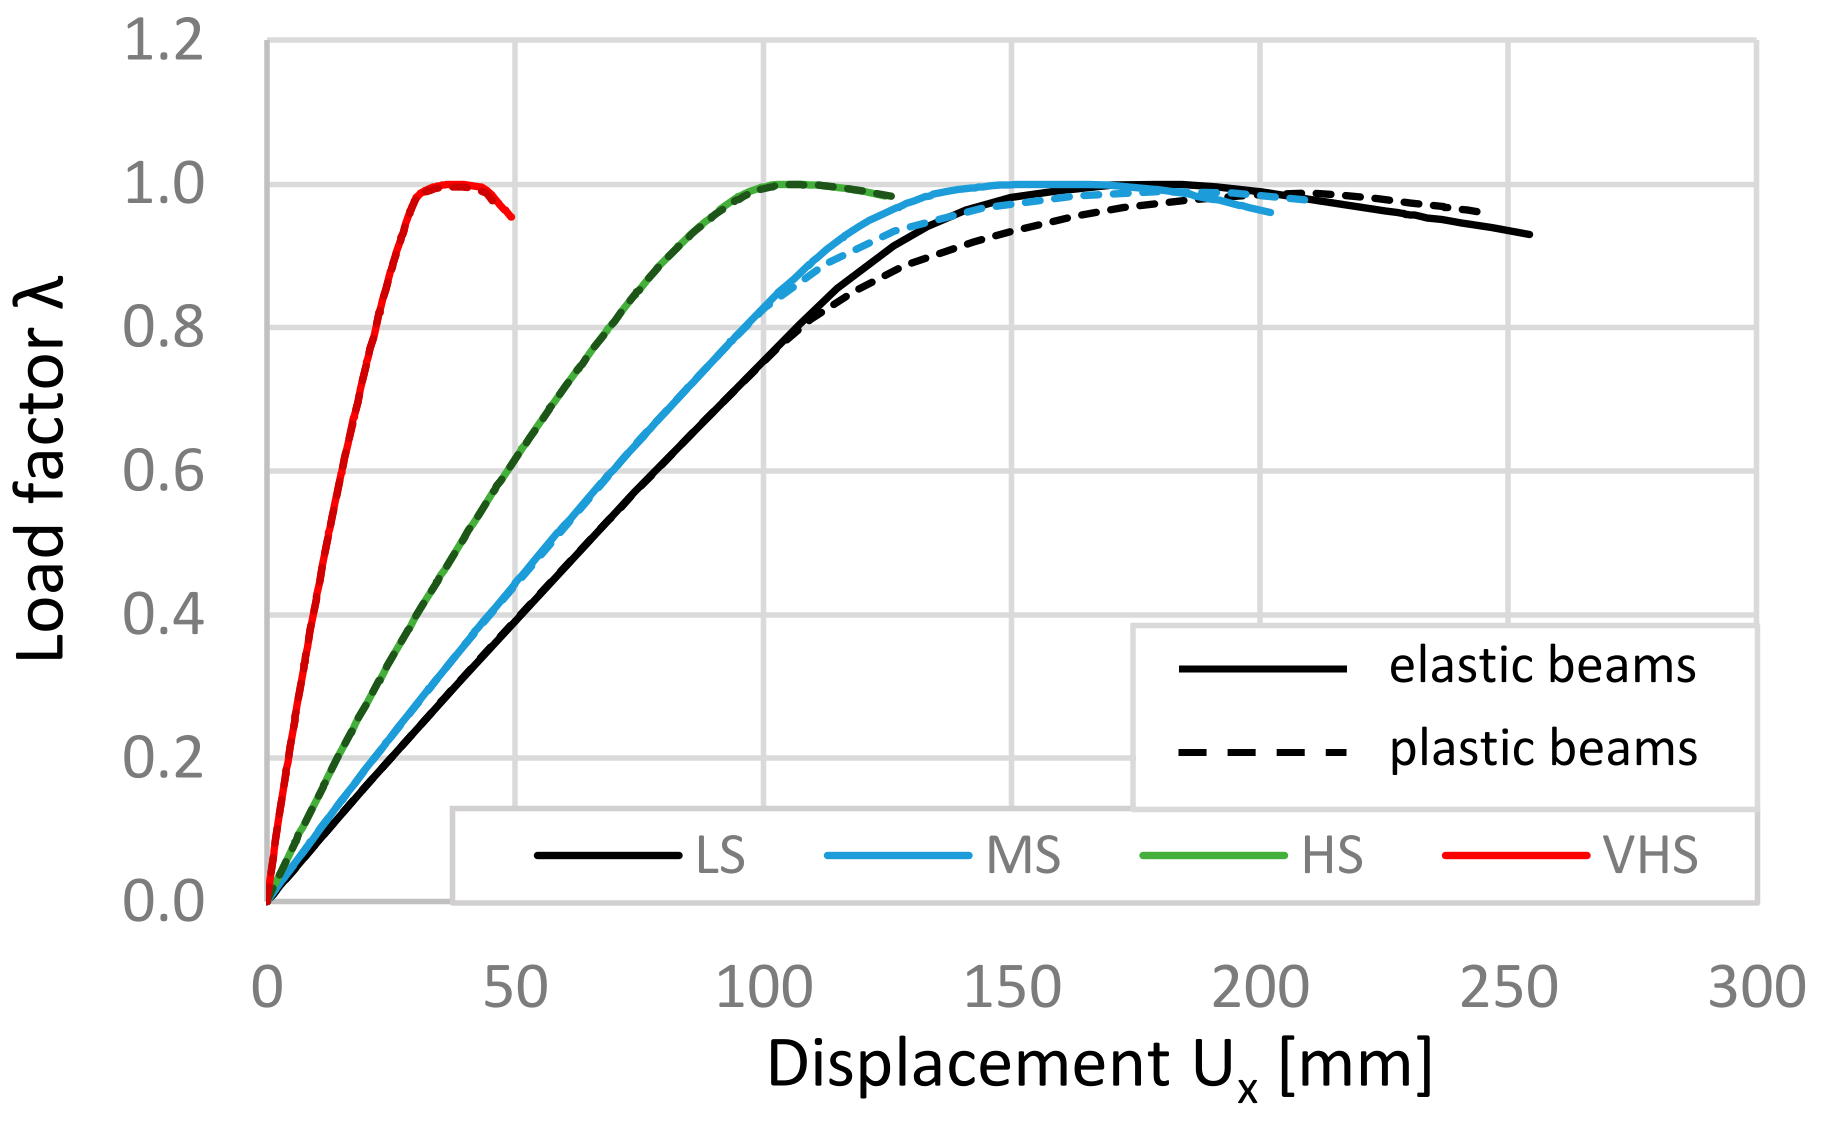
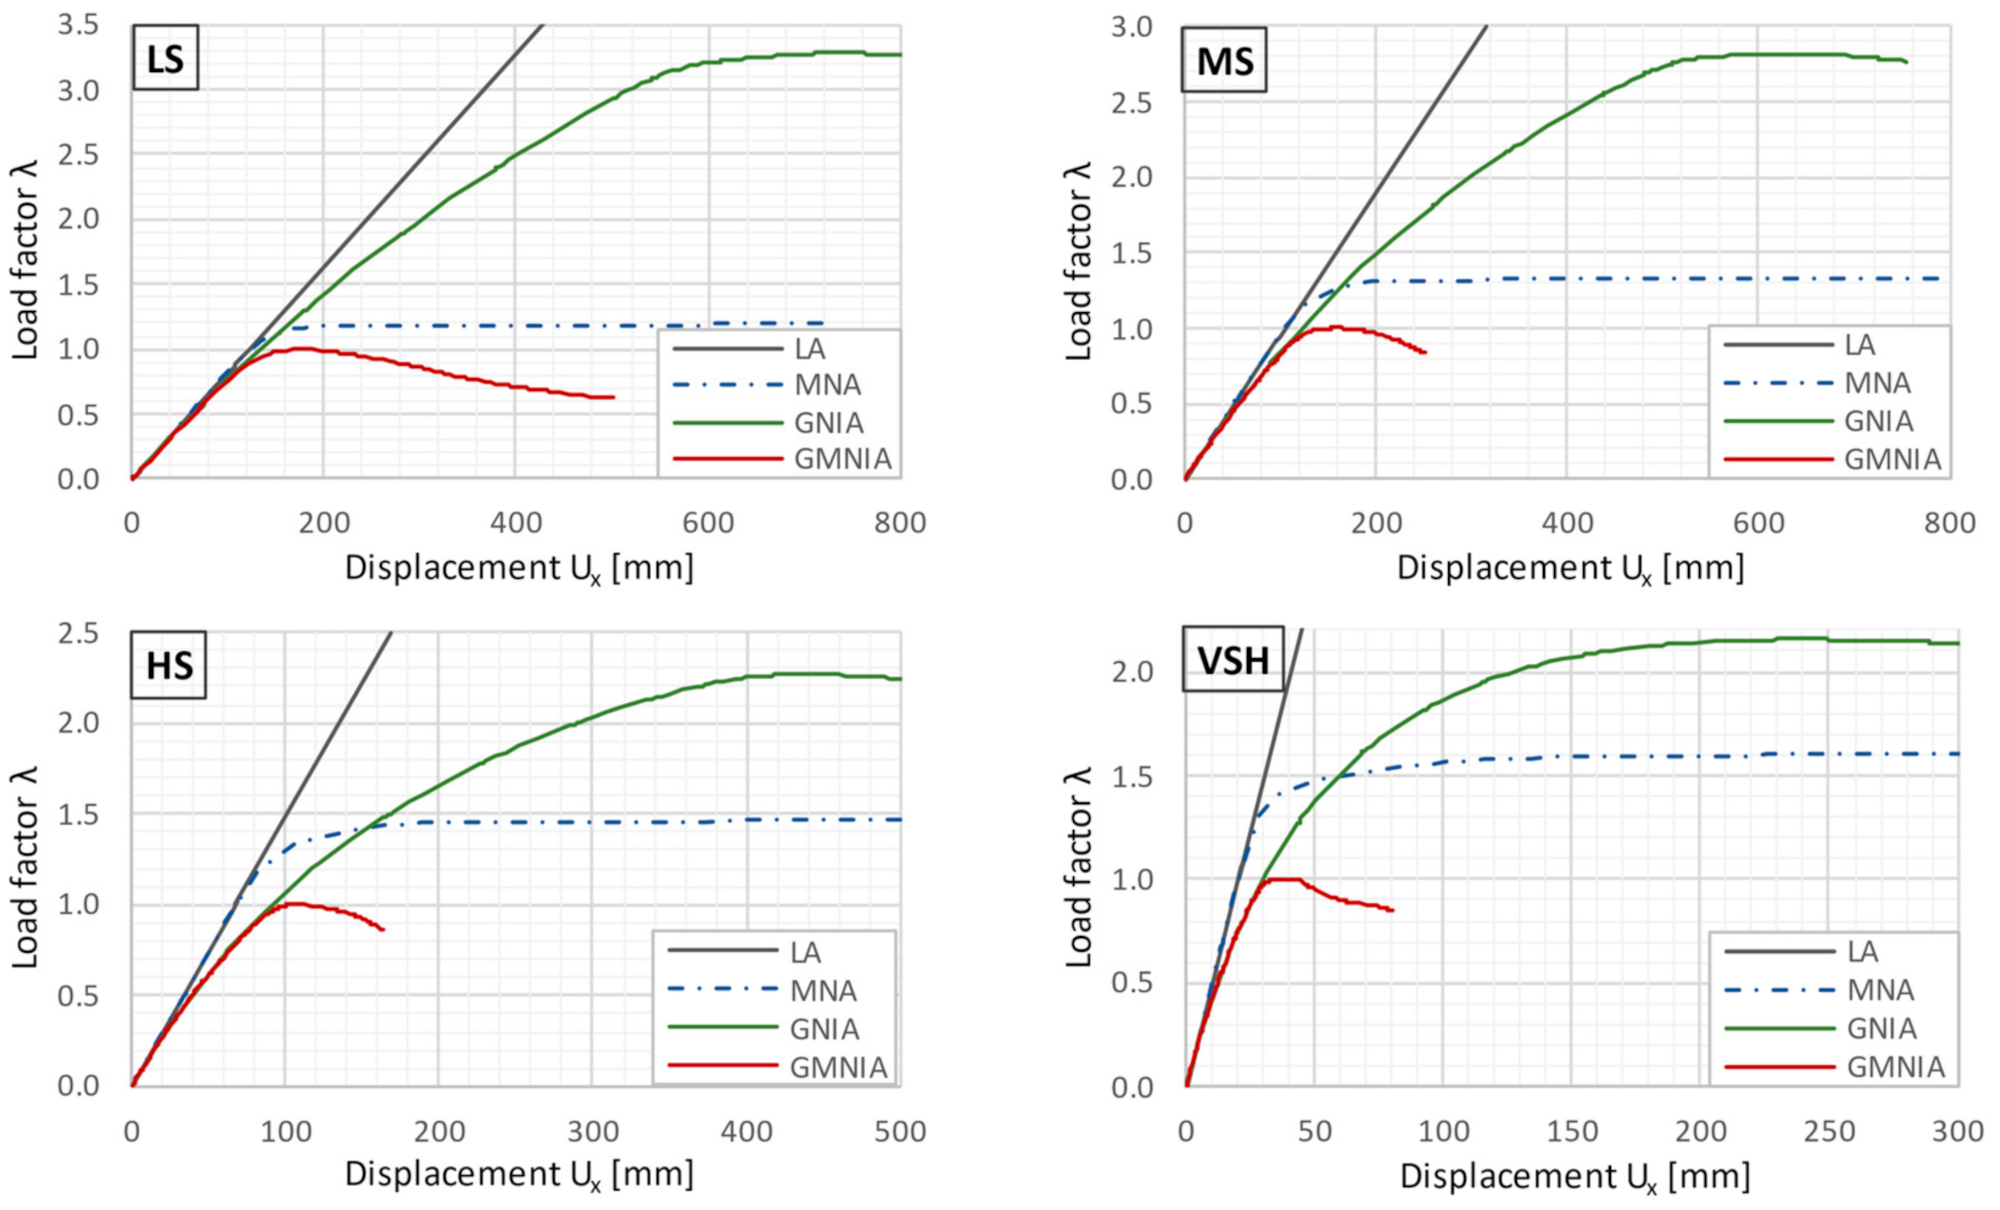
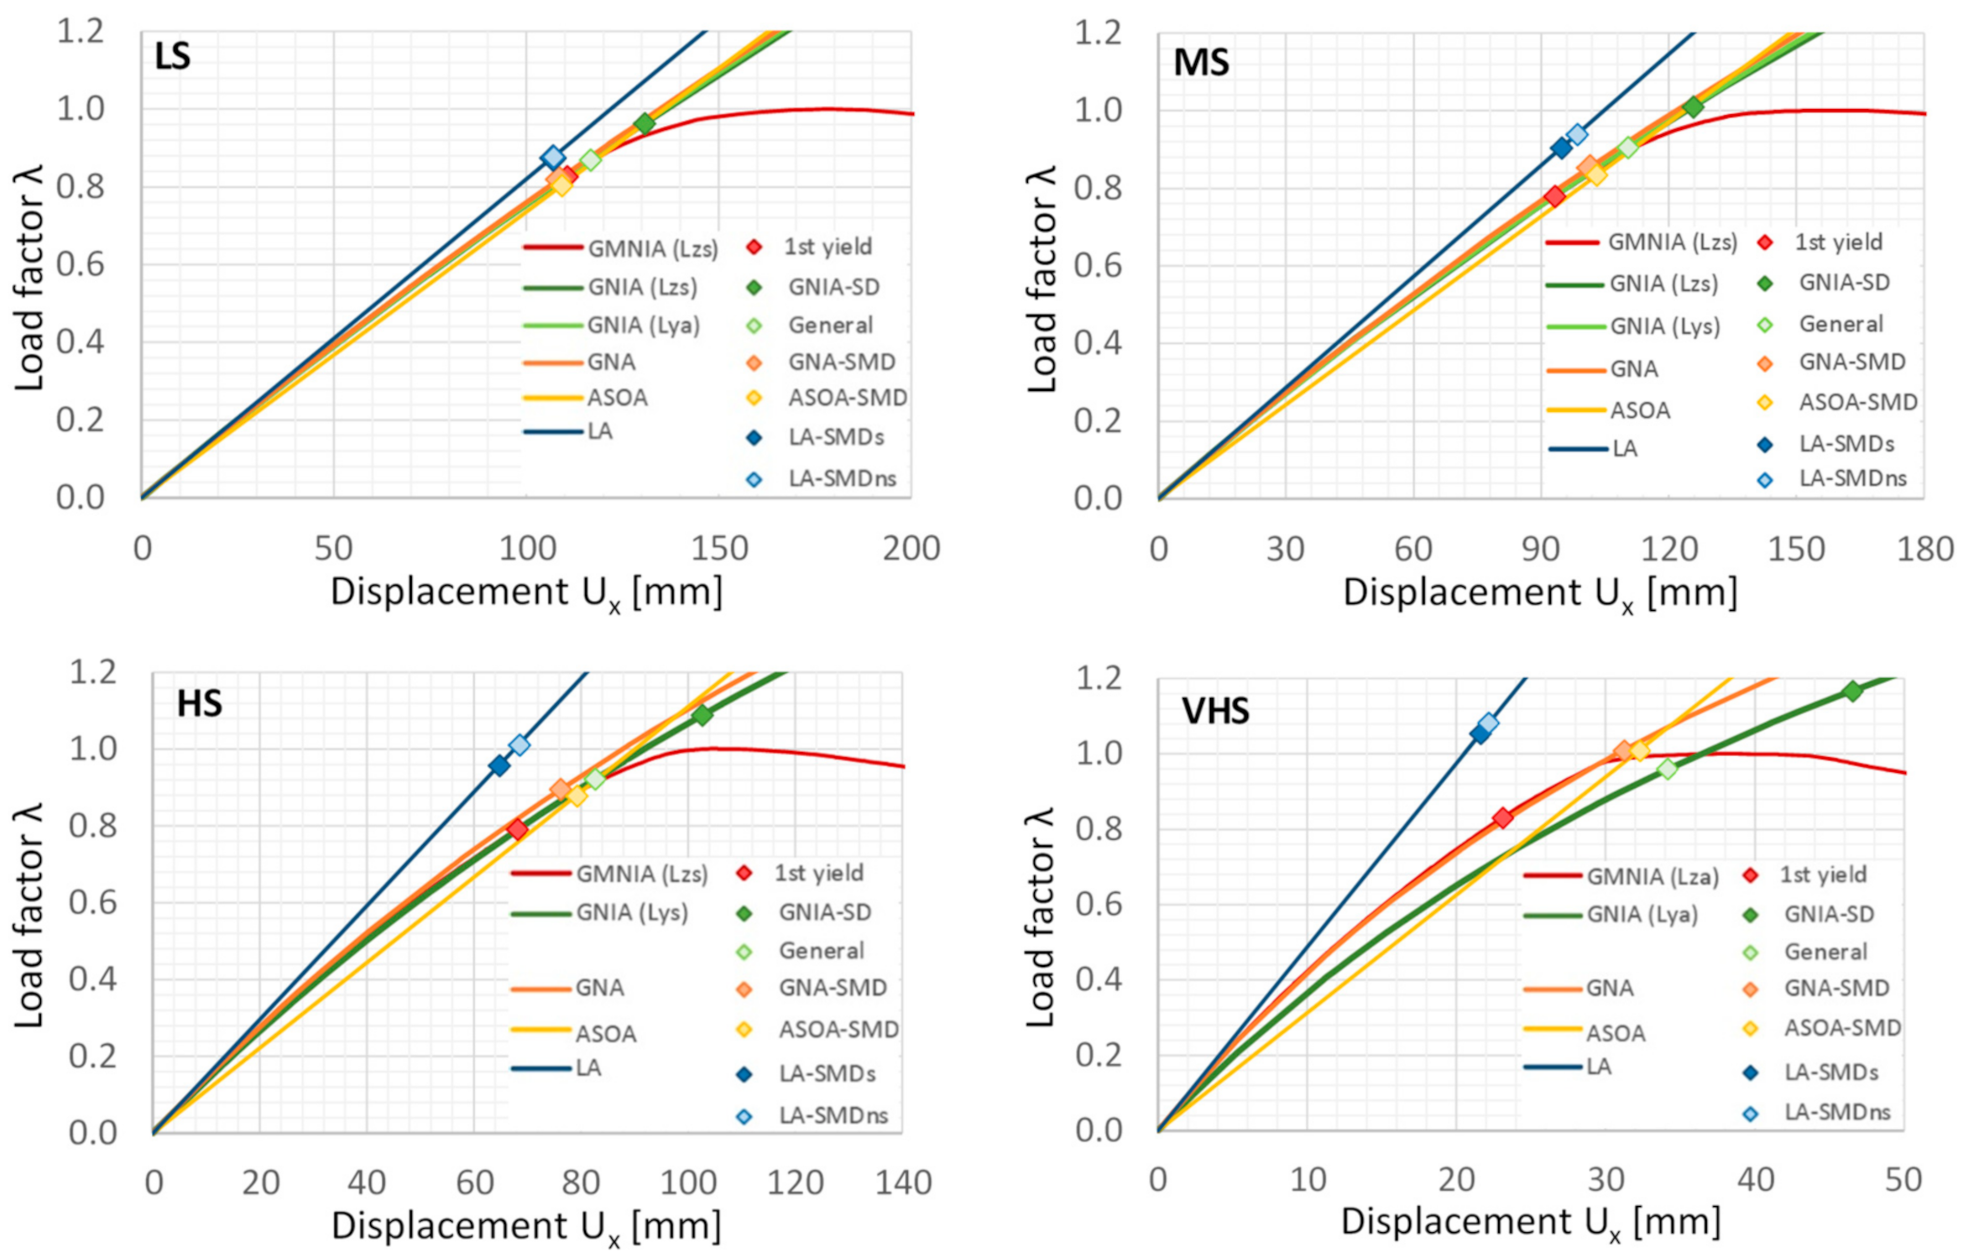
4.1. Influence of Nonlinearities
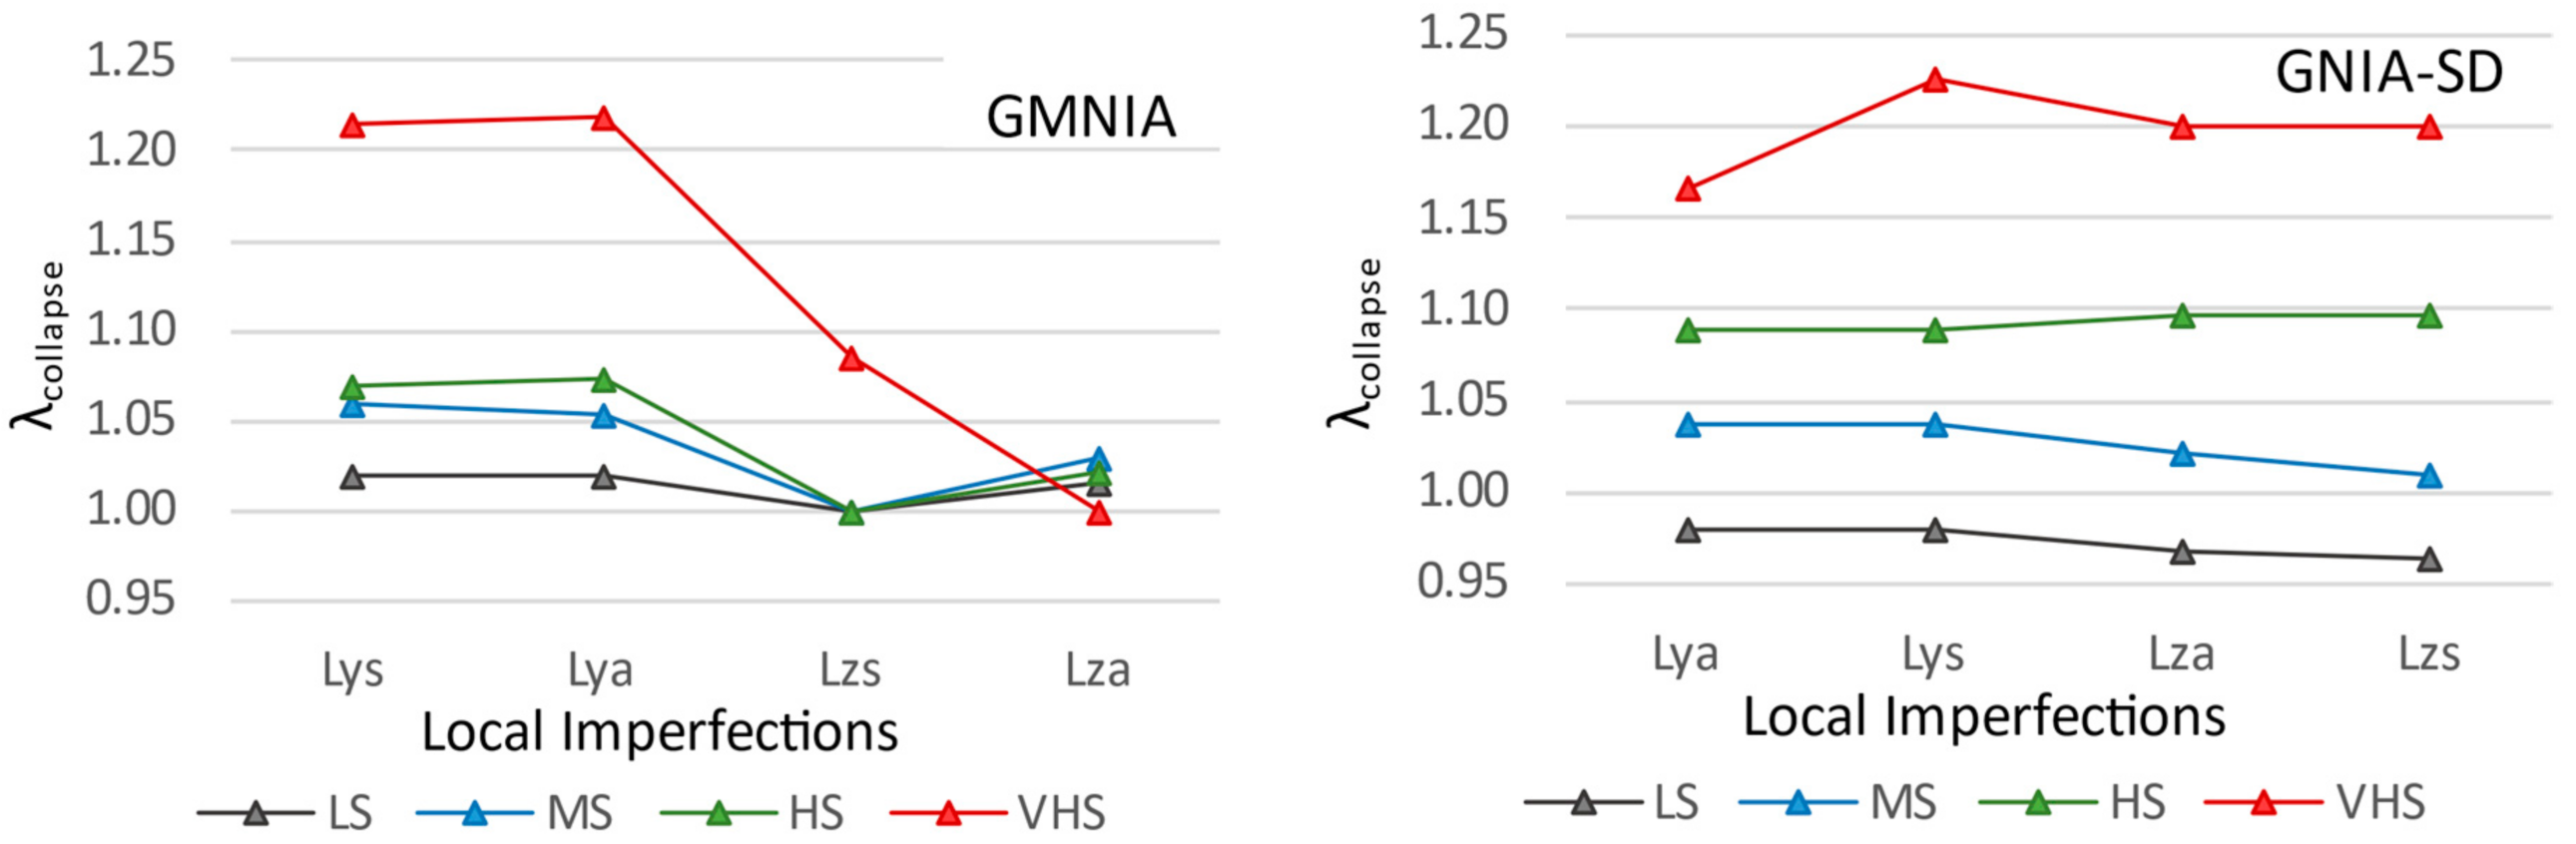
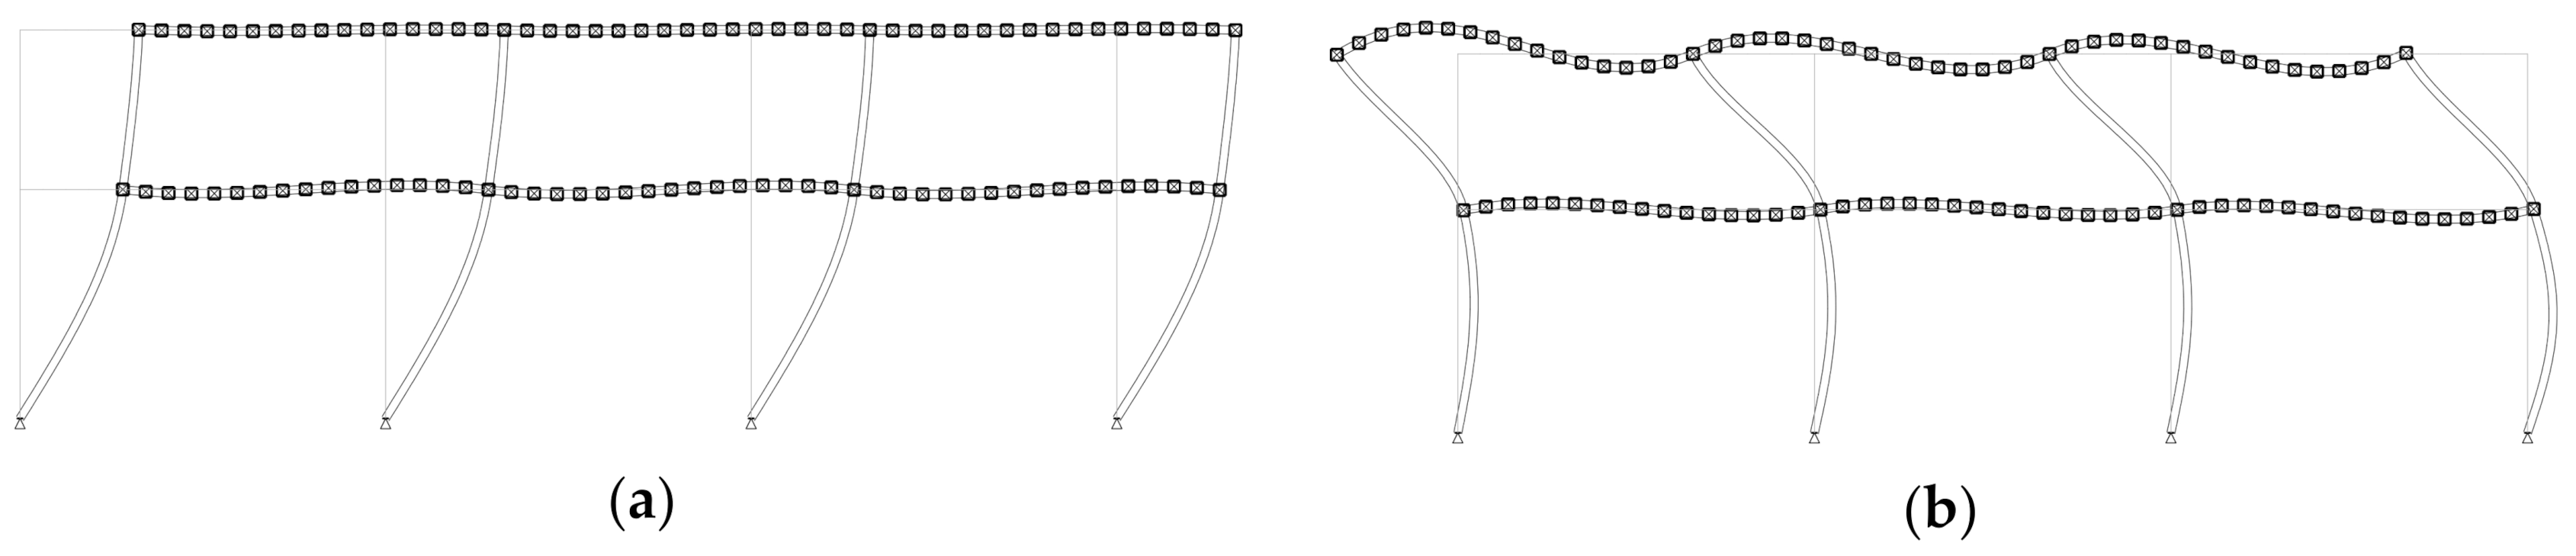
4.2. Influence of the Imperfection Pattern
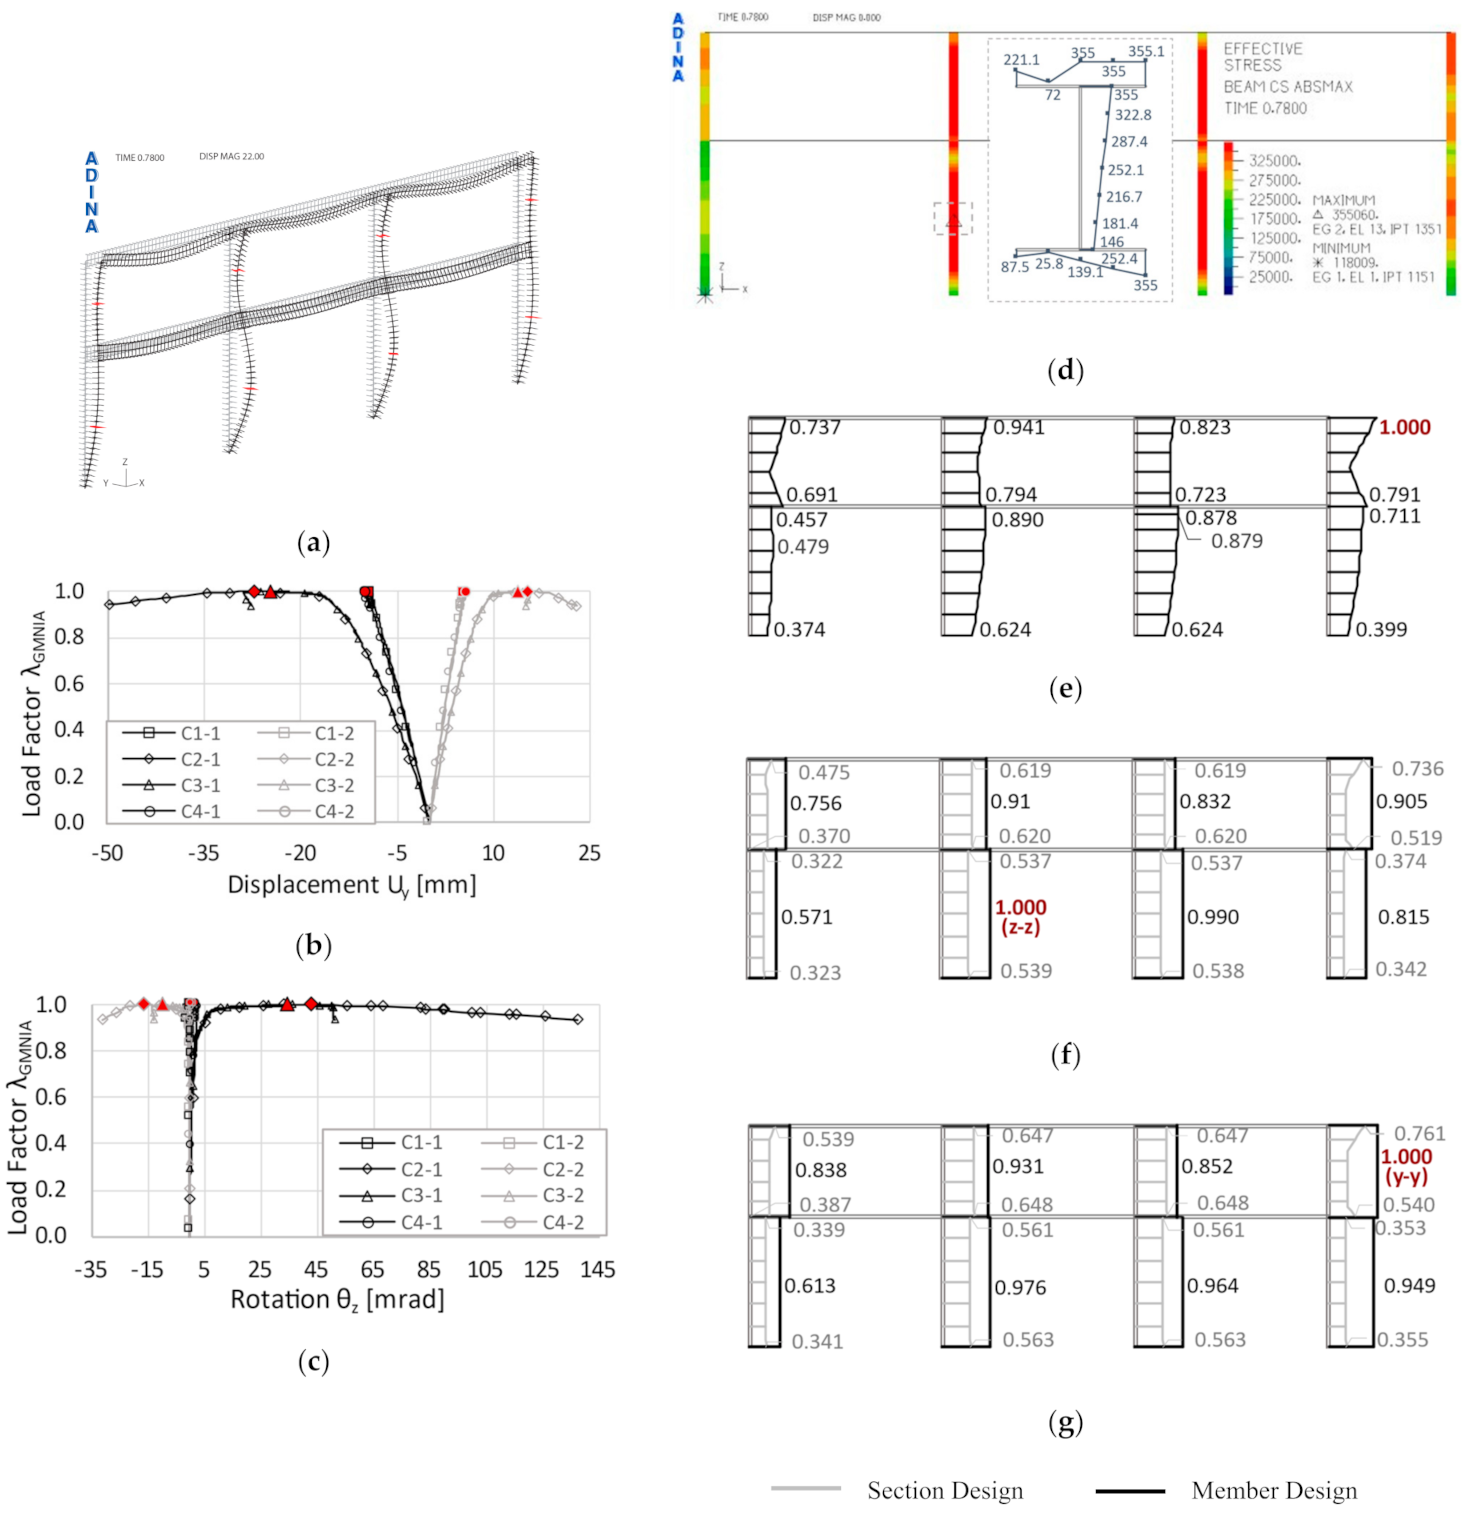
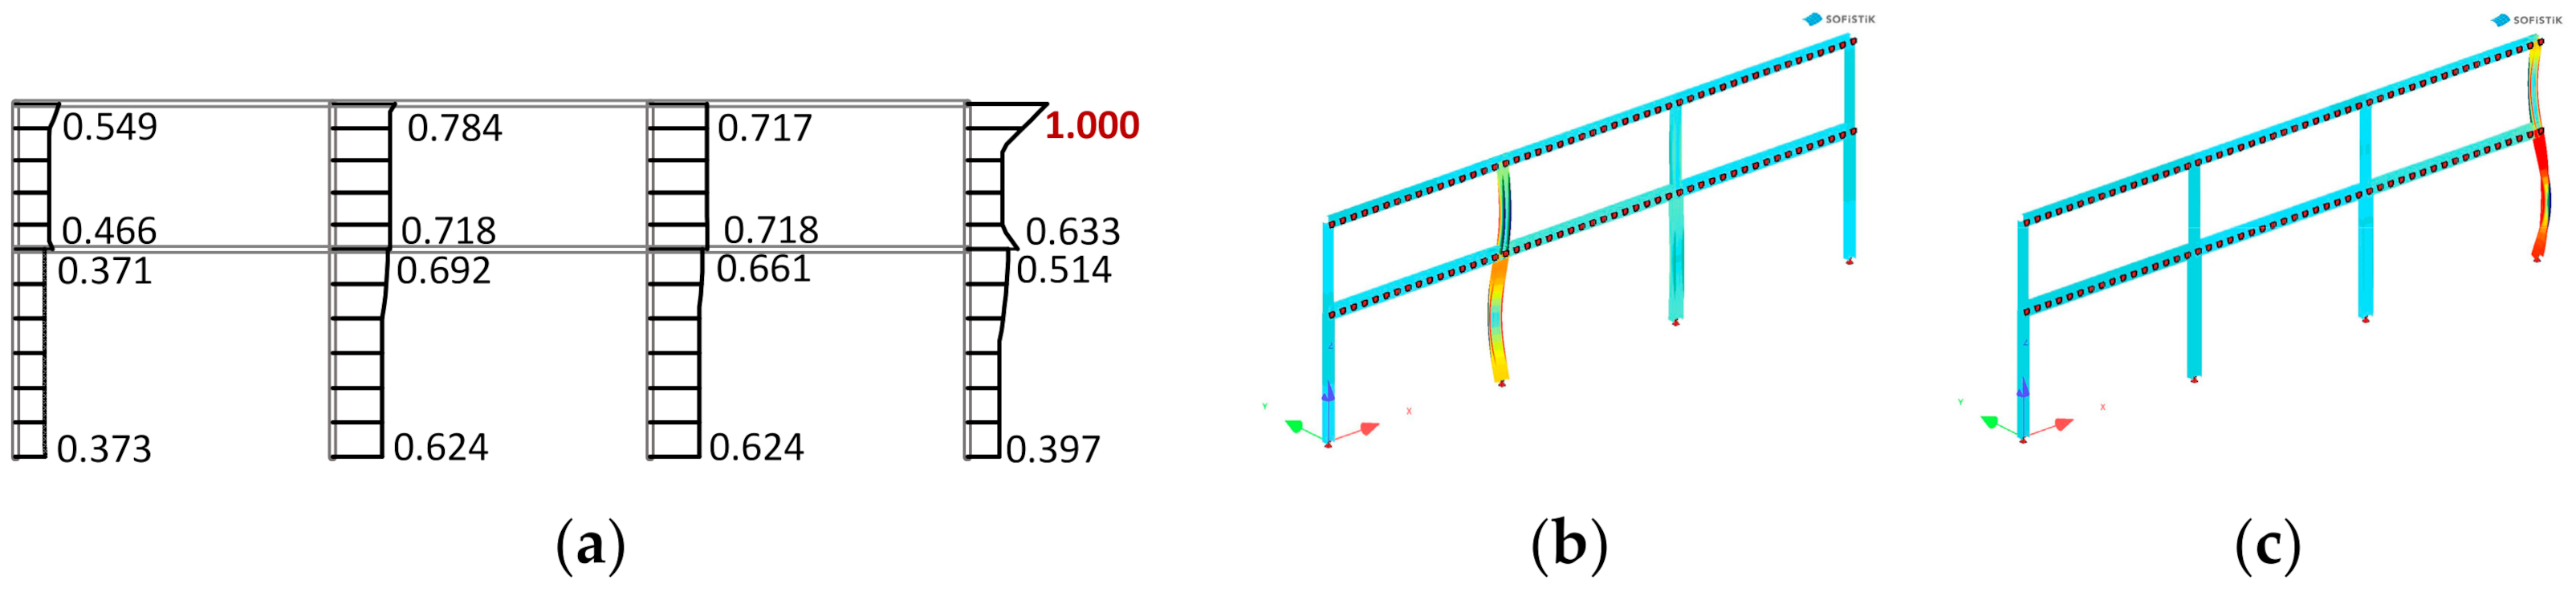
4.3. Collapse Mechanism
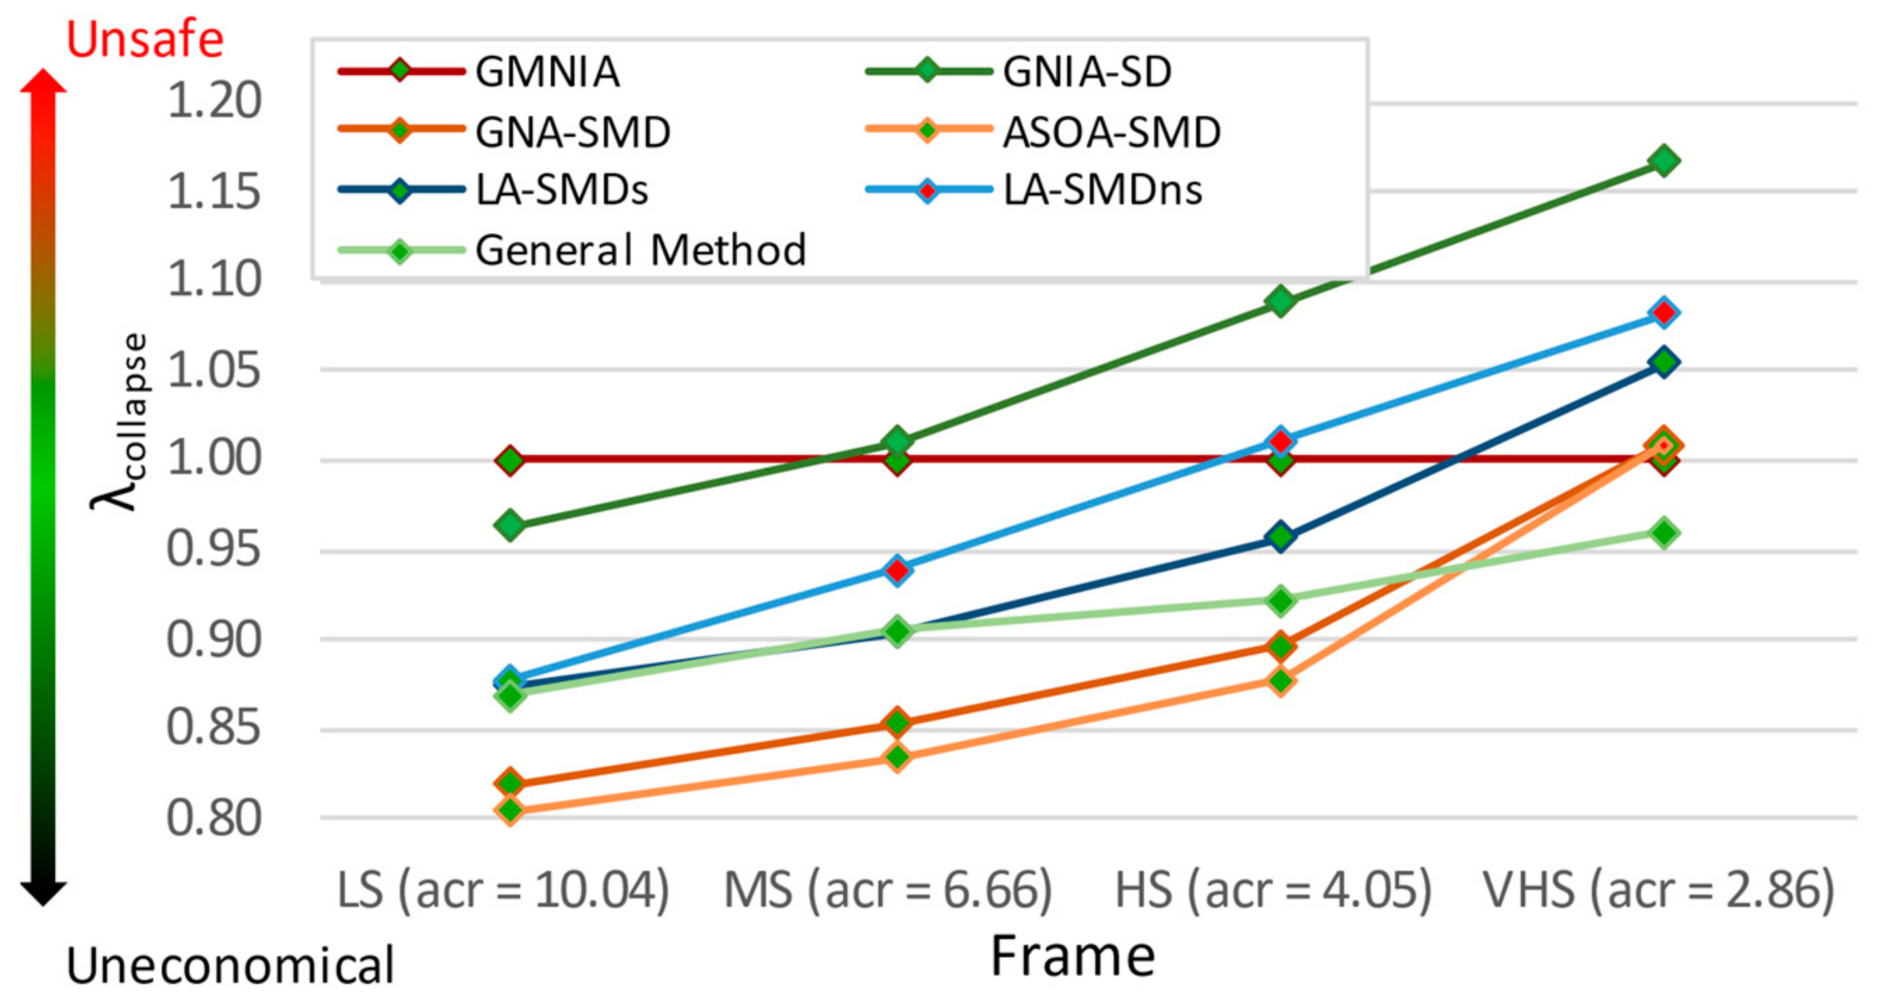
4.4. Ultimate Load Factors
- All methods are on the safe side for the most rigid frame LS, where αcr > 10.
- All methods except for General Method are unsafe for the slenderest frame, where αcr < 3.
- Only the General Method is on the safe side for all frames.
- The commonly used in practice GNIA-SD method is safe only for the LS frame.
- The least conservative method is the GNIA-SD, while the most conservative is the ASOA-SMD, except for the VHS frame where the General Method is the most conservative.
- All methods become less conservative as the slenderness of the structure increases.
- Although for frames that αcr < 10, sway buckling lengths should be considered when a 1st order analysis is executed, results show that by taking them equal to the system lengths (method LA-SMDns) leads to safe results for the MS frame (αcr = 6.66) and slightly (less than 5%) unsafe results for the HS frame (αcr = 4.05).
- The differences between the exact GNA-SMD and the approximate ASOA-SMD method are very small. The approximate method is slightly more conservative for the three more rigid frames, while for the slenderest one, where its application is not permitted, the two methods lead to an identical ultimate load factor.
5. Discussion
5.1. Interaction of Nonlinearities
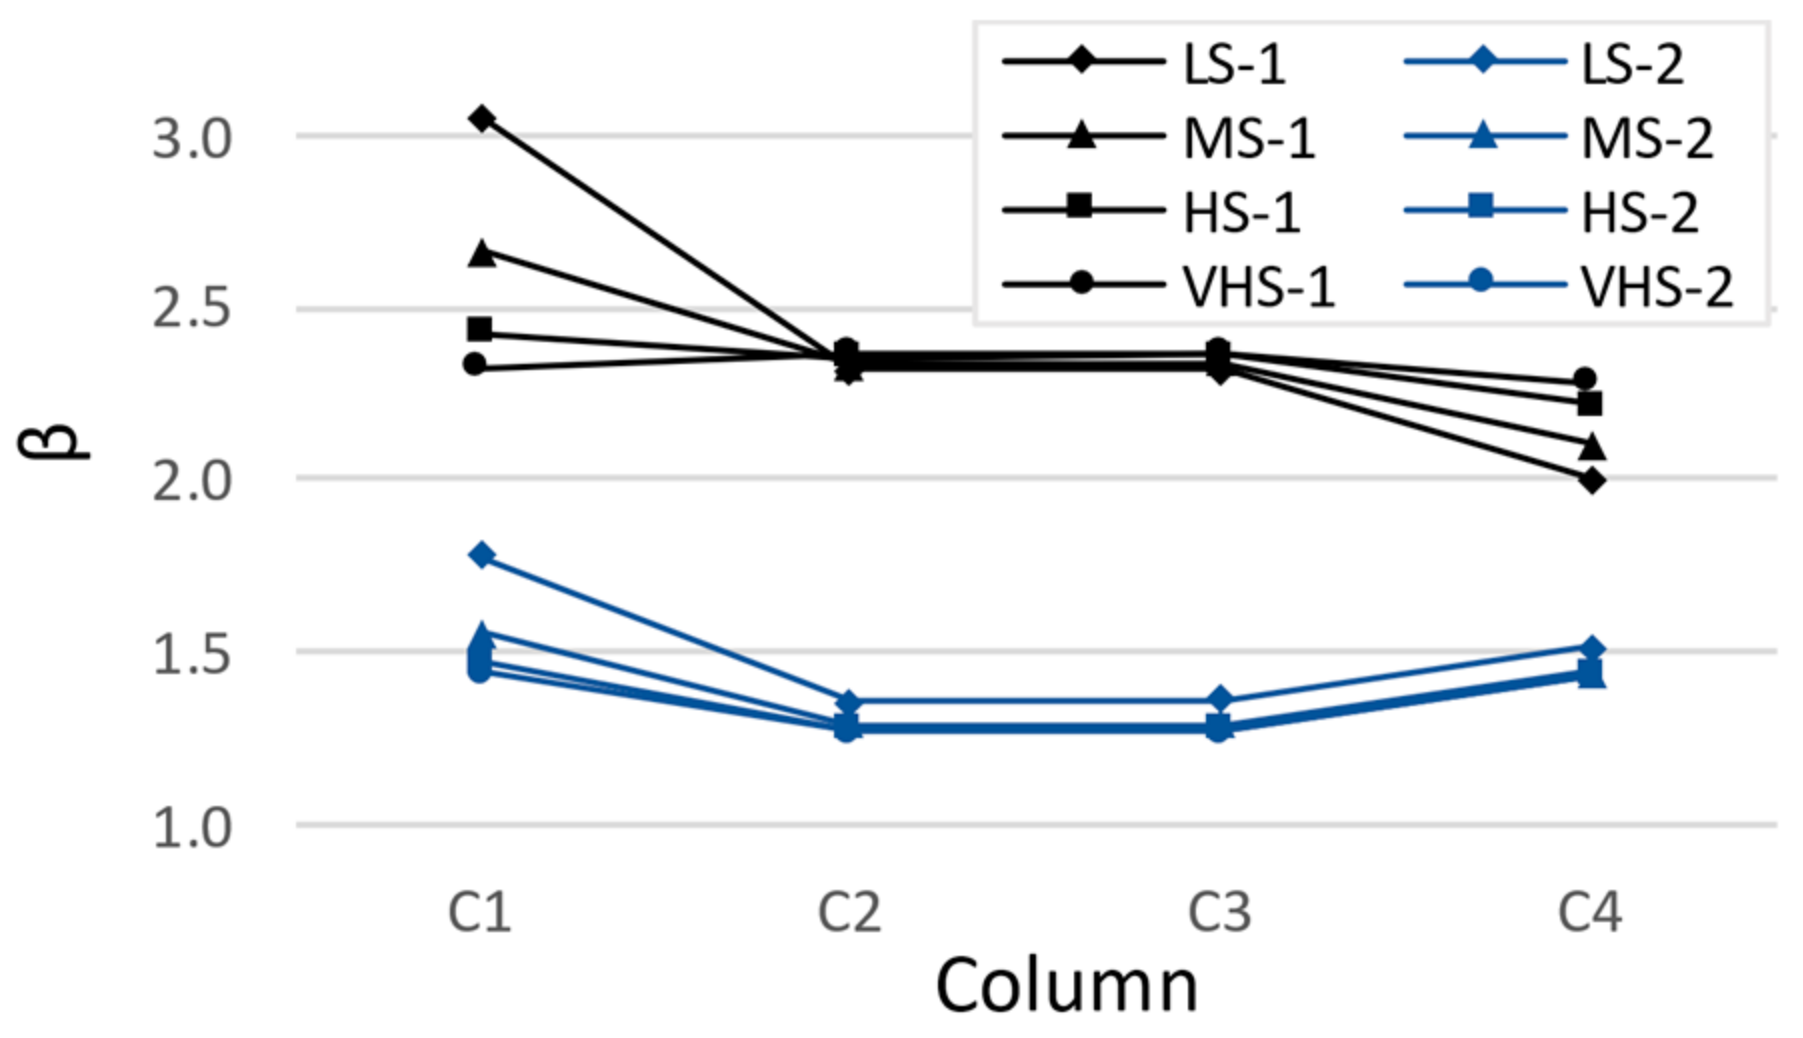
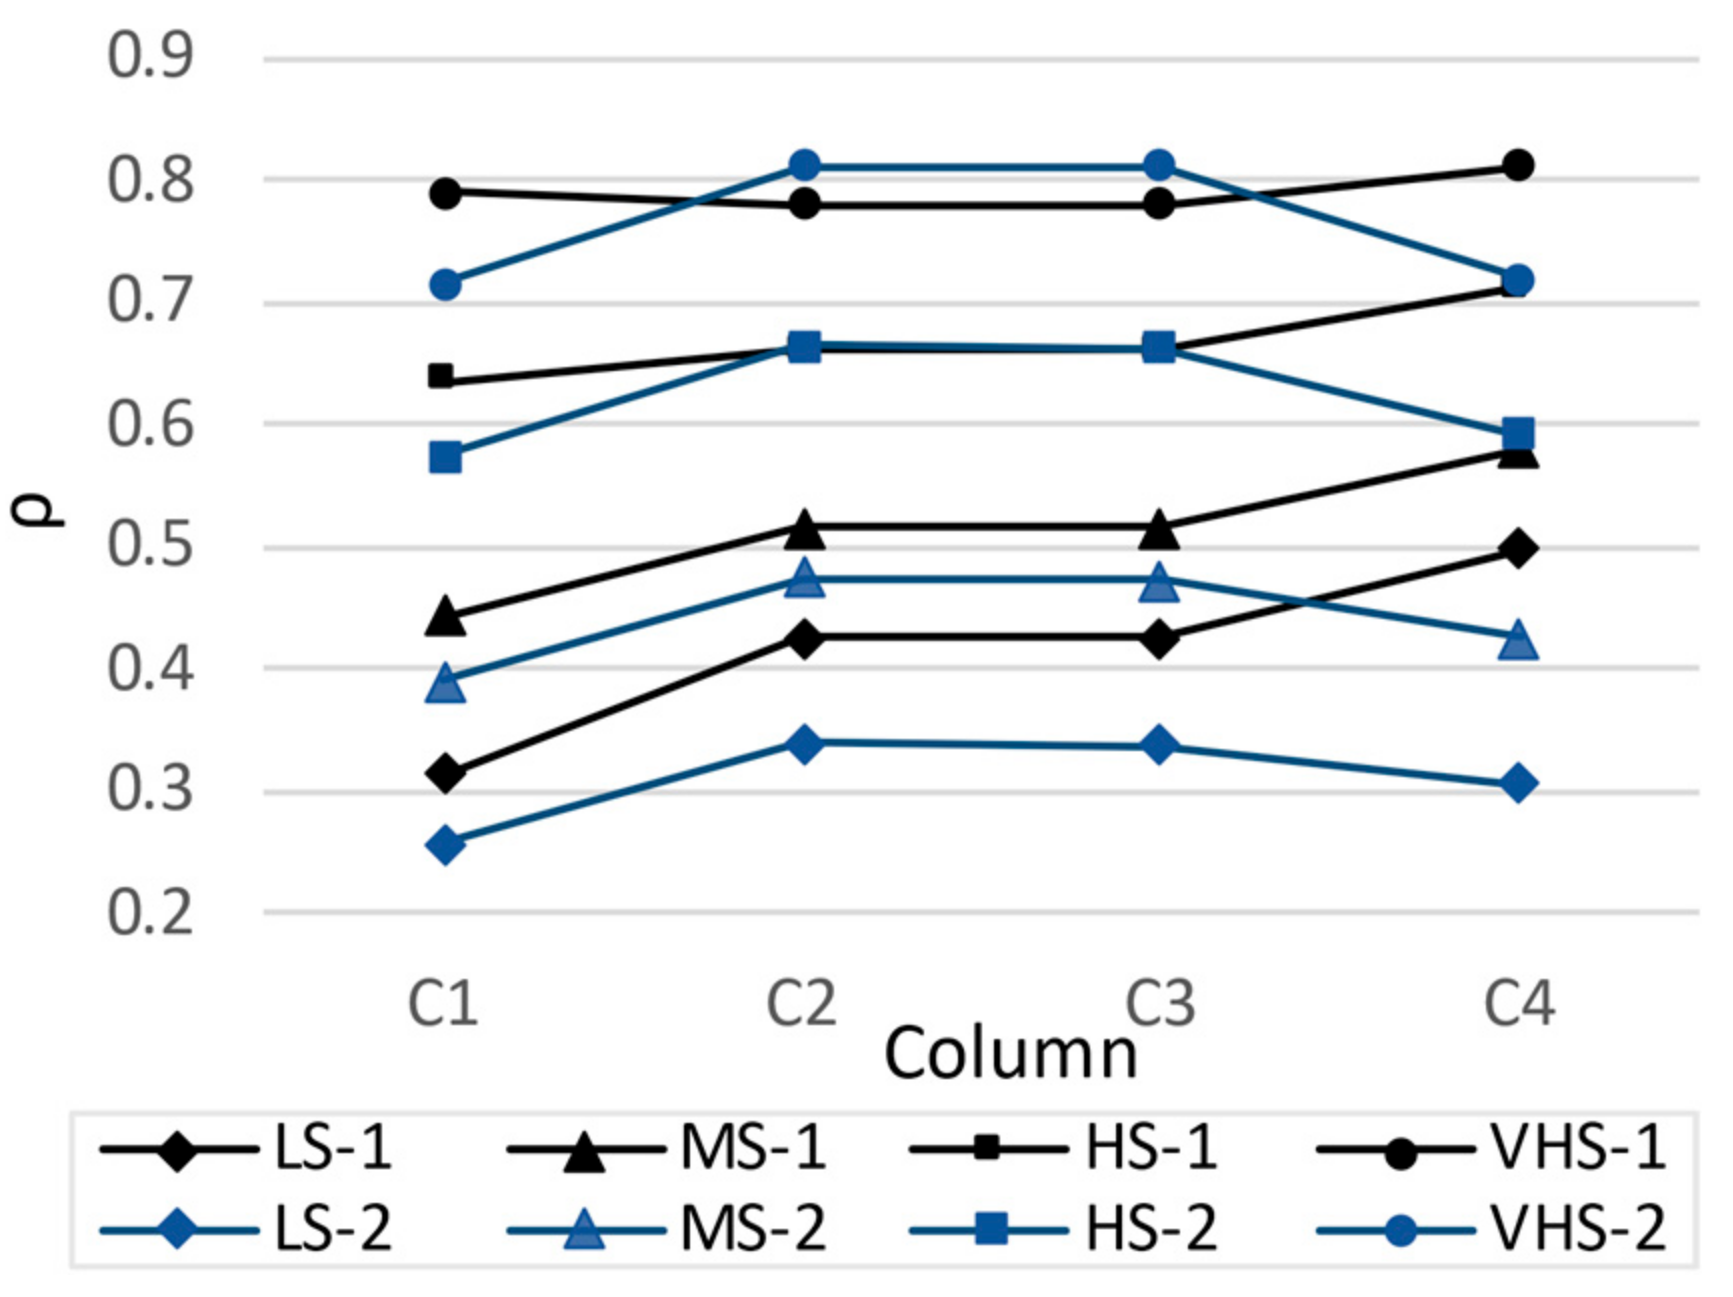
5.2. Magnitude of Imperfections
5.3. GNA-SMD
5.4. General Method
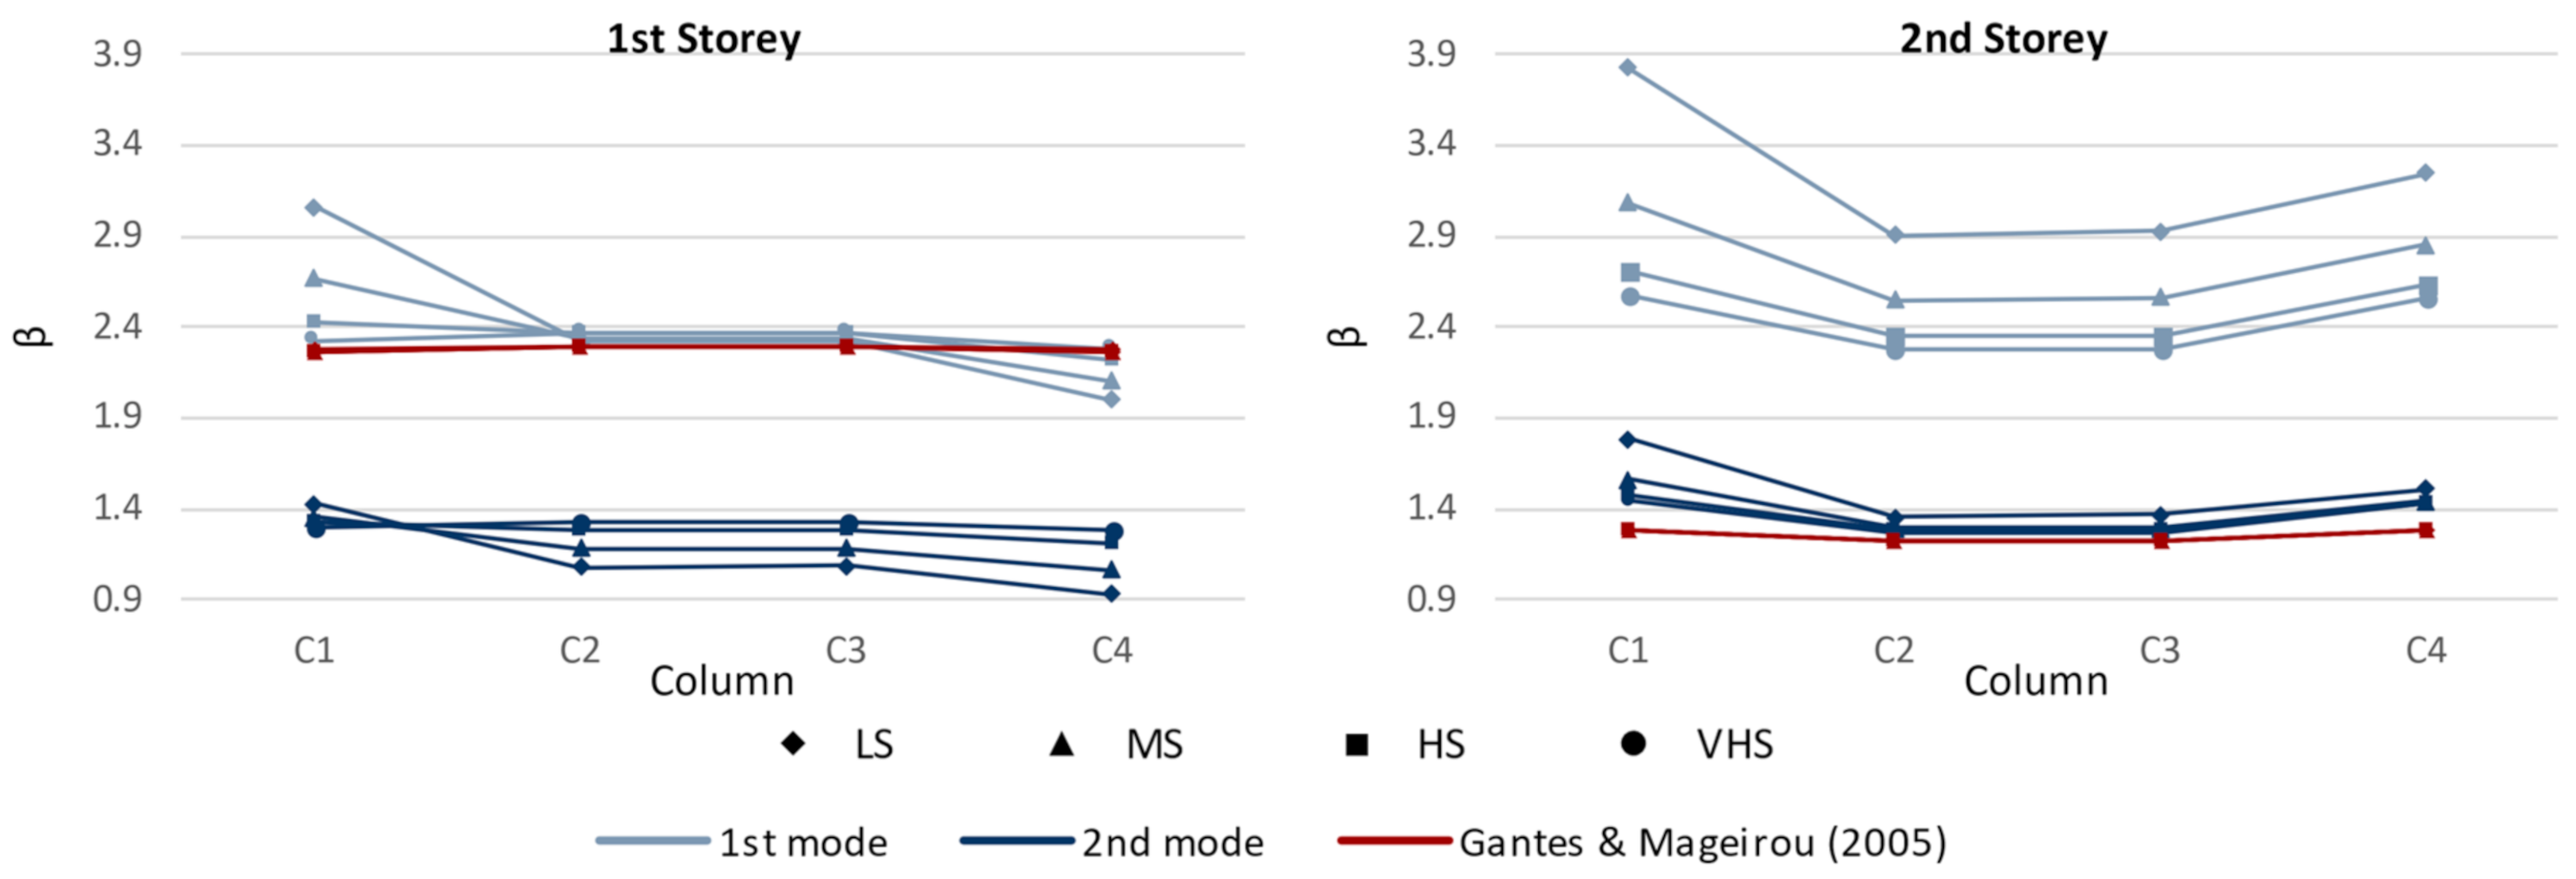
5.5. Effective Buckling Length
6. Conclusions
- The out-of-plane buckling dominates the behaviour of the examined frames. Their collapse mechanism involves inelastic flexural torsional buckling of their columns.
- For the three more rigid frames (αcr > 3), all the EC3-permitted design methods, except for the GNIA-SD, are on the safe side.
- The examined methods become less conservative as the slenderness of the structure increases. Hence, although they are all safe for the rigid frame, for the slenderest one (αcr < 3) all of them except for the General method are unsafe.
- In slender structures (αcr < 10) the consideration of each type of nonlinearity separately but neglecting their interaction, i.e., the geometric nonlinearity in the analysis and the material nonlinearity through plastic cross-sectional verification, results in unsafe design.
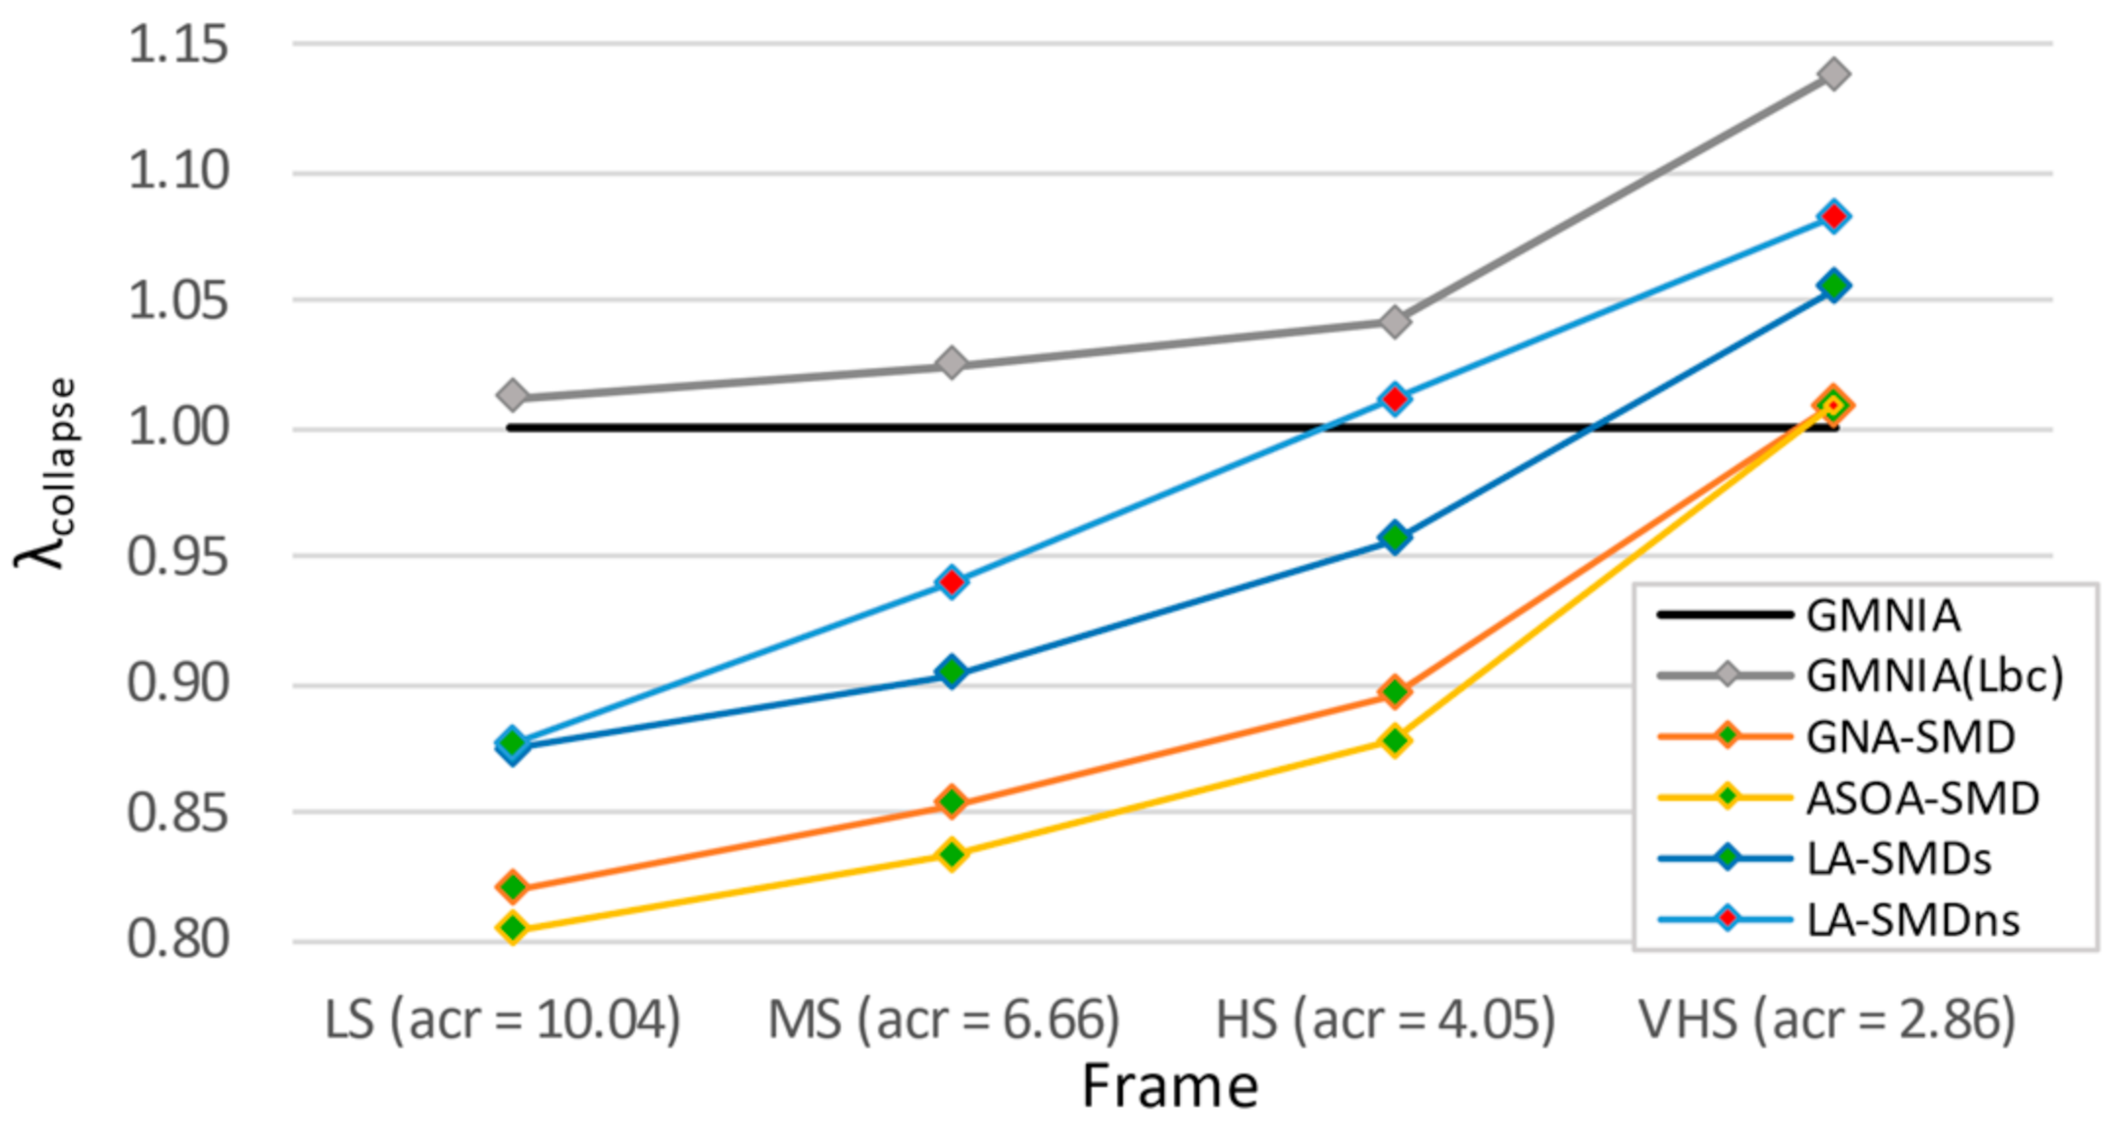
- The imperfections incorporated in the buckling curves are much lower than those proposed in Table 5.1 of EN 1993-1-1. If the imperfections extracted from the buckling curves are considered in GMNI Analyses, then all the methods that involve buckling verification are more conservative than GMNIA for all frames.
- When the system buckling approach is adopted for the determination of the buckling lengths, the calculations should be based on the critical buckling mode for the storey that each column belongs to, namely the first buckling mode where this storey displays large drift.
Author Contributions
Funding
Institutional Review Board Statement
Informed Consent Statement
Data Availability Statement
Conflicts of Interest
Abbreviations
| EC3 | Eurocode 3 |
| GMNIA | Geometrically and Materially Nonlinear Imperfection Analysis |
| GMNIA (Lbc) | Geometrically and Materially Nonlinear Imperfection Analysis (Local imperfections from buckling curves) |
| GNIA-SD | Geometrically Nonlinear Imperfection Analysis–Section Design |
| GNA-SMD | Geometrically Nonlinear Analysis–Section and Member Design |
| ASOA-SMD | Approximate Second Order Analysis–Section and Member Design |
| LA-SMDs | Linear Analysis-Section and Member Design (sway buckling length) |
| LA-SMDns | Linear Analysis-Section and Member Design (non-sway buckling length) |
| FB | Flexural Buckling |
| FTB | Flexural Torsional Buckling |
| LB | Local Buckling |
References
- EN 1993-1-1: Eurocode 3: Design of Steel Structures—Part 1-1: General Rules and Rules for Buildings; CEN: Brussels, Belgium, 2005.
- AISC. Specification for Structural Steel Buildings. 2016. Available online: https://www.aisc.org/globalassets/aisc/publications/standards/a360-16-spec-and-commentary.pdf (accessed on 2 November 2021).
- Trahair, N.S.; Bradford, M.A.; Nethercot, D.A.; Gardner, L. The Behaviour and Design of Steel Structures to EC3, 4th ed.; Taylor & Francis: New York, NY, USA, 2008. [Google Scholar]
- Vayas, I.; Ermopoulos, J.; Ioannidis, G. Design of Steel Structures to Eurocodes, 1st ed.; Springer International Publishing: Cham, Switzerland, 2019. [Google Scholar]
- Kindmann, R.; Kraus, M. Steel Structures: Design Using FEM; John Wiley & Sons: Hoboken, NJ, USA, 2012. [Google Scholar]
- Gardner, L. The continuous strength method. Proc. Inst. Civ. Eng. Struct. Build. 2008, 161, 127–133. [Google Scholar] [CrossRef] [Green Version]
- Gardner, L.; Yun, X.; Fieber, A.; Macorini, L. Steel Design by Advanced Analysis: Material Modeling and Strain Limits. Engineering 2019, 5, 243–249. [Google Scholar] [CrossRef]
- Chladný, E.; Stujberová, M. Frames with unique global and local imperfection in the shape of the elastic buckling mode (Part 1). Stahlbau 2013, 82, 609–617. [Google Scholar] [CrossRef]
- Agüero, A.; Baláž, I.; Koleková, Y. New method for metal beams sensitive to lateral torsional buckling with an equivalent geometrical UGLI imperfection. Structures 2021, 29, 1445–1462. [Google Scholar] [CrossRef]
- Nethercot, D.A. Frame structures: Global performance, static and stability behaviour: General Report. J. Constr. Steel Res. 2000, 55, 109–124. [Google Scholar] [CrossRef]
- Walport, F.; Gardner, L.; Nethercot, D.A. Equivalent bow imperfections for use in design by second order inelastic analysis. Structures 2020, 26, 670–685. [Google Scholar] [CrossRef]
- Lindner, J.; Kuhlmann, U.; Just, A. Verification of flexural buckling according to Eurocode 3 part 1-1 using bow imperfections. Steel Constr. 2016, 9, 349–362. [Google Scholar]
- Lindner, J.; Kuhlmann, U.; Jörg, F. Initial bow imperfections e0 for the verification of Flexural Buckling According to Eurocode 3 Part 1-1—Additional considerations. Steel Constr. 2018, 11, 30–41. [Google Scholar] [CrossRef]
- Jönsson, J.; Stan, T.C. European column buckling curves and finite element modelling including high strength steels. J. Constr. Steel Res. 2017, 128, 136–151. [Google Scholar] [CrossRef] [Green Version]
- Gantes, C.J.; Fragkopoulos, K.A. Strategy for numerical verification of steel structures at the ultimate limit state. Struct. Infrastruct. Eng. 2010, 6, 225–255. [Google Scholar] [CrossRef]
- Chen, W.F. Structural stability: From theory to practice. Eng. Struct. 2000, 22, 116–122. [Google Scholar] [CrossRef]
- Boissonnade, N.; Jaspart, J.P.; Muzeau, J.P.; Villette, M. New interaction formulae for beam-columns in Eurocode 3: The French-Belgian approach. J. Constr. Steel Res. 2004, 60, 421–431. [Google Scholar] [CrossRef]
- Greiner, R.; Lindner, J. Interaction formulae for members subjected to bending and axial compression in EUROCODE 3-the Method 2 approach. J. Constr. Steel Res. 2006, 62, 757–770. [Google Scholar]
- da Silva, L.S.; Marques, L.; Rebelo, C. Numerical validation of the general method in EC3-1-1 for prismatic members. J. Constr. Steel Res. 2010, 66, 575–590. [Google Scholar] [CrossRef]
- Bijlaard, F.S.K.; Feldmann, M.; Naumes, J.; Sedlacek, O. The ‘general method’ for assessing the out-of-plane stability of structural members and frames and comparison with alternative rules in en 1993—Euro code 3-part 1-1. Steel Constr. 2010, 3, 19–33. [Google Scholar] [CrossRef]
- Feldmann, M.; Wieschollek, M.; Heinemeyer, C. Biege-und Biegedrillknicken in konsistentem Ansatz als Basis einer allgemeinen Knickkurve für EC3-1-1, 6.3.4. Stahlbau 2017, 86, 699–706. [Google Scholar] [CrossRef]
- Yong, D.J.; Fernandez-Lacabe, D.; Lopez, A.; Serna, M.A. Initial imperfections and buckling analysis for beam-columns: A comparative study of EC-3 proposals. In Steel and Composite Structures; Taylor & Francis Group: London, UK, 2007. [Google Scholar]
- Hajdú, G.; Papp, F. Safety Assessment of Different Stability Design Rules for Beam-columns. Structures 2018, 14, 376–388. [Google Scholar] [CrossRef]
- Bernuzzi, C.; Cordova, B.; Simoncelli, M. Unbraced steel frame design according to EC3 and AISC provisions. J. Constr. Steel Res. 2015, 114, 157–177. [Google Scholar] [CrossRef]
- Fieber, A.; Gardner, L.; Macorini, L. Structural steel design using second-order inelastic analysis with strain limits. J. Constr. Steel Res. 2020, 168, 105980. [Google Scholar]
- Vayas, I. Interaktion der plastischen Grenzschnittgrößen doppelsymmetrischer I-Querschnitte. Stahlbau 2000, 69, 693–706. [Google Scholar]
- Eurocode 1: Actions on Structures—Part 1-1: General Actions—Densities, Self-Weight, Imposed Loads for Buildings; CEN: Brussels, Belgium, 2009.
- ADINA. Theory and Modeling Guide Volume I: ADINA; ADINA R & D, Inc.: Watertown, MA, USA, 2006. [Google Scholar]
- SOFiSTiK. SOFiSTiK 3D FEM v.2018. 2018. Available online: http://www.sofistik.com (accessed on 20 October 2018).
- Choi, D.H.; Yoo, H. Iterative system buckling analysis, considering a fictitious axial force to determine effective length factors for multi-story frames. Eng. Struct. 2009, 31, 560–570. [Google Scholar] [CrossRef]
- Bridge, R.O.; Clarke, M.J.; Leon, R.T.; Lui, E.M.; Sheikh, T.M.; White, D.W.; Hajjar, J.F. Effective Length and Notional Load Approaches for Assessing Frame Stability: Implications for American Steel Design; ASCE: New York, NY, USA, 1997. [Google Scholar]
- Tong, G.S.; Wang, J.P. Column effective lengths considering inter-story and inter-column interactions in sway-permitted frames. J. Constr. Steel Res. 2006, 62, 413–423. [Google Scholar] [CrossRef]
- Yura, J.A. The Effective Length of Columns in Unbraced Frames. AISC Eng. J. 1997, 8, 37–42. [Google Scholar]
- White, D.W.; Hajjar, J.F. Buckling Models and Stability Design of Steel Frames: A Unified Approach. J. Constr. Steel Res. 1997, 42, 171–207. [Google Scholar] [CrossRef]
- Webber, A.; Orr, J.J.; Shepherd, P.; Crothers, K. The effective length of columns in multi-storey frames. Eng. Struct. 2015, 102, 132–143. [Google Scholar] [CrossRef] [Green Version]
- Gantes, C.J.; Mageirou, G.E. Improved stiffness distribution factors for evaluation of effective buckling lengths in multi-story sway frames. Eng. Struct. 2005, 27, 1113–1124. [Google Scholar] [CrossRef]
- prEN 1993-1-1:2019: Eurocode 3—Design of Steel Structures—Part 1-1: General Rules and Rules for Buildings; CEN: Brussels, Belgium, 2019.
- Knobloch, M.; Bureau, A.; Kuhlmann, U.; da Silva, L.S.; Snijder, H.H.; Taras, A.; Bours, A.-L.; Jörg, F. Structural member stability verification in the new Part 1-1 of the second generation of Eurocode 3: Part 1: Evolution of Eurocodes, background to partial factors, cross-section classification and structural analysis. Steel Constr. 2020, 13, 98–113. [Google Scholar]
- Knobloch, M.; Bureau, A.; Kuhlmann, U.; da Silva, L.S.; Snijder, H.H.; Taras, A.; Bours, A.-L.; Jörg, F. Structural member stability verification in the new Part 1-1 of the second generation of Eurocode 3: Part 2: Member buckling design rules and further innovations. Steel Constr. 2020, 13, 208–222. [Google Scholar] [CrossRef]


| Method | Modelling—d.o.f. of Beam Elements | Analysis | Modelled Imperfections | Section Design | Member Design | In Plane Buckling Length |
|---|---|---|---|---|---|---|
| GMNIA | 7 | GMNIA | Global & Local | No | No | - |
| GNIA-SD | 7 | GNIA | Global & Local | Yes | No | - |
| GM | 6 | GNIA/LBA | Global & in-plane local | Yes | General Method | - |
| GNA-SMD | 6 | GNA | Global | Yes | Yes | Non-sway |
| LA-SMD | 6 | LA | Global | Yes | Yes | Sway |
| Frame | Slenderness | αcr | Vertical Loads | Horizontal Loads | |||
|---|---|---|---|---|---|---|---|
| Distributed | Concentrated | ||||||
| Internal Column | External Column | 1st Floor | 2nd Floor | ||||
| q [kN/m] | Pint [kN] | Pext [kN] | H1 [kN] | H2 [kN] | |||
| LS | Low | 10.04 | 70 | 0 | 0 | 256.5 | 436 |
| MS | Medium | 6.66 | 70 | 576 | 288 | 89.5 | 456 |
| HS | High | 4.05 | 70 | 1727 | 863.5 | 15 | 289 |
| VHS | Very High | 2.86 | 70 | 2878 | 1439 | 0 | 0 |
| Method | Ultimate Load Factor λcollapse | |||
|---|---|---|---|---|
| LS (αcr = 10.04) | MS (αcr = 6.66) | HS (αcr = 4.05) | VHS (αcr = 2.86) | |
| GMNIA | 1.000 | 1.000 | 1.000 | 1.000 |
| GNIA-SD | 0.963 | 1.010 | 1.088 | 1.167 |
| GNA-SMD | 0.820 | 0.853 | 0.896 | 1.009 |
| ASOA-SMD | 0.804 | 0.834 | 0.878 | 1.009 |
| LA-SMDs | 0.874 | 0.904 | 0.957 | 1.054 |
| LA-SMDns | 0.877 | 0.939 | 1.011 | 1.082 |
| General Method | 0.869 | 0.905 | 0.922 | 0.960 |
Publisher’s Note: MDPI stays neutral with regard to jurisdictional claims in published maps and institutional affiliations. |
© 2021 by the authors. Licensee MDPI, Basel, Switzerland. This article is an open access article distributed under the terms and conditions of the Creative Commons Attribution (CC BY) license (https://creativecommons.org/licenses/by/4.0/).
Share and Cite
Antonodimitraki, S.; Thanopoulos, P.; Vayas, I. EC3-Compatible Methods for Analysis and Design of Steel Framed Structures. Modelling 2021, 2, 567-590. https://doi.org/10.3390/modelling2040030
Antonodimitraki S, Thanopoulos P, Vayas I. EC3-Compatible Methods for Analysis and Design of Steel Framed Structures. Modelling. 2021; 2(4):567-590. https://doi.org/10.3390/modelling2040030
Chicago/Turabian StyleAntonodimitraki, Sofia, Pavlos Thanopoulos, and Ioannis Vayas. 2021. "EC3-Compatible Methods for Analysis and Design of Steel Framed Structures" Modelling 2, no. 4: 567-590. https://doi.org/10.3390/modelling2040030