Article

Temporal Responses of a Low-Energy Meal Replacement Plan or Exercise Training on Cardiovascular Function and Fibro-Inflammatory Markers in People with Type 2 Diabetes—A Secondary Analysis of the “Diabetes Interventional Assessment of Slimming or Training to Lessen Inconspicuous Cardiovascular Dysfunction” Study

1
Department of Cardiovascular Sciences, University of Leicester and the National Institute for Health Research Leicester Biomedical Research Centre, Glenfield Hospital, Leicester LE3 9QP, UK
2
Department of Cardiovascular Science, College of Life Science and Cardiovascular Research Centre, Glenfield Hospital, Leicester LE3 9QP, UK
3
Department of Food Science and Nutrition, School of the Environment, University of the Aegean, GR81100 Lemnos, Greece
4
Population, Policy and Practice Research, GOS Institute of Child Health, UCL, London WC1E 6BT, UK
5
Diabetes Research Centre, University of Leicester and the National Institute for Health Research Leicester Biomedical Research Centre, Leicester General Hospital, Leicester LE5 4PW, UK
6
CV Translational Research, Immunology & Cardiovascular Thematic Research Center (ICV-TRC), Bristol Myers Squibb, 3551 Lawrenceville Road, Princeton, NJ 08540, USA
*
Author to whom correspondence should be addressed.
Hearts 2024, 5(1), 165-181; https://doi.org/10.3390/hearts5010011
Submission received: 30 January 2024 / Revised: 6 March 2024 / Accepted: 14 March 2024 / Published: 16 March 2024

Abstract

:
Background: This study assesses the temporal responses of cardiovascular function, fibro-inflammation, and glucometabolic profiles in asymptomatic adults with type 2 diabetes, following a low-energy meal replacement plan (MRP) or exercise training. Methods: Secondary analysis of DIASTOLIC: a randomised, open-label, blinded-endpoint trial of 12 weeks MRP (~810 kcal/day) or exercise training. Cardiac magnetic resonance, plasma fibroinflammatory, and metabolic markers were undertaken at baseline, 4, and 12 weeks. Results: Out of 24 participants in the MRP group and 22 in exercise training, 18 and 11 completed all three visits. MRP resulted in early (0–4 weeks) improvement in insulin resistance (HOMA-IR: 10.82 to 4.32), decrease in FABP-4 (4.87 ± 0.19 to 5.15 ± 0.32 mg/L), and improvement in left ventricular remodelling LV mass: volume (0.86 ± 0.14 to 0.78 ± 0.11), all with large effect sizes. MMP8 levels increased moderately at 4–12 weeks. Peak early diastolic strain rate (cPEDSR) initially decreased, then improved. Exercise training led to minor improvements in insulin resistance and MMP-8 levels, with no significant changes in cPEDSR or LV remodelling. Conclusions: MRP resulted in early improvements in insulin resistance, cardiac remodelling, and inflammation, but with an initial decrease in diastolic function, improving by 12 weeks. Exercise training showed minor early benefits in insulin resistance and inflammation, but no significant cardiac changes.

1. Introduction

Obesity and type 2 diabetes (T2D) confer an increased risk of heart failure with preserved ejection fraction (HFpEF) [1,2]. Excess adiposity particularly visceral [3,4,5] drives systemic inflammation resulting in endothelial dysfunction, a central mechanism in the pathogenesis of HFpEF [6,7]. Even in the absence of obesity, T2D can cause asymptomatic myocardial alterations including left ventricular diastolic dysfunction, hypertrophy, and remodelling termed diabetic cardiomyopathy [8]—a precursor of HFpEF. Significant acute weight loss achieved with very low-energy diets has been shown to yield swift and significant metabolic improvements, T2D remission, and variable improvements in cardiovascular structure and function [9,10]. Some of these cardiovascular benefits persist up to 18 months post-intervention, despite weight increase [10]. Nonetheless, single-group intervention studies have reported that significant acute energy reduction using very low-energy diets (400–600 kcal/day) has been linked to diminished left ventricular systolic function, particularly in the short term (3 days to 8 weeks)—a phenomenon potentially attributable to increased myocardial lipid content and compromised energetics [11] as seen in a range of groups including healthy [12], those living with obesity [13] or T2D [14], and those with cardiovascular disease [11]. However, these insights have not been examined under the rigor of randomised controlled trials, nor compared to other lifestyle interventions. The benefits of weight loss through diet (DiRECT trial) [15,16,17] or medication (STEP-HFpEF trial) [18] are clear in managing cardiovascular risk in individuals with T2D at risk of HFpEF [15,16,17] and improving symptoms and physical performance in HFpEF patients [18]. However, contemporary outcome trials did not assess cardiovascular changes. Despite the recognition of the prominent role of inflammation in the genesis of diabetic cardiomyopathy and HFpEF, the changes in fibro-inflammation in response to behavioural interventions simultaneously with cardiovascular phenotyping have not been extensively studied. Moreover, the immediate effects of exercise on ventricular function, independent of weight loss, are less well understood.
Cardiac magnetic resonance imaging (CMR) permits multiparametric evaluation of cardiac structure and function, and it is ideally suited to detecting subtle cardiac alterations of LV strain and remodelling. Paired CMR, blood fibroinflammatory, and glycometabolic data permit detailed analysis of complex cardiometabolic adaptations following lifestyle interventions. The aim of this secondary analysis of the “Diabetes Interventional Assessment of Slimming or Training to Lessen Inconspicuous Cardiovascular Dysfunction (DIASTOLIC)” study [19] was to characterize the temporal responses of (1) cardiovascular function, (2) fibro-inflammation markers, and (3) glycometabolic profiles during a meal replacement plan (MRP) or an exercise training programme in asymptomatic T2D.

2. Materials and Methods

This is a secondary analysis of the DIASTOLIC study [19]. The rationale, design, conduct, and main outcomes have been published [19,20]. DIASTOLIC was a prospective, randomized, open-label, blinded endpoint trial of 12 weeks duration. Randomisation was 1:1:1 to either a low-energy MRP (~810 kcal/d), exercise training, or control group (see Appendix A, consort diagram). Participants fasted overnight prior to each visit. Each participant attended two visits at weeks 0 and 12 and was invited for an optional visit at 4 weeks primarily for those in the trial intervention arms [19]. Only data from subjects who attended all three visits are included in this analysis. Ethical approval was granted by the National Research Ethics Service (15/WM/0222), registered with clinicaltrials.gov (https://clinicaltrials.gov/study/NCT02590822?cond=NCT02590822&rank=1, accessed on 5 January 2024) (NCT02590822), and conducted according to the Declaration of Helsinki. All participants provided written informed consent.

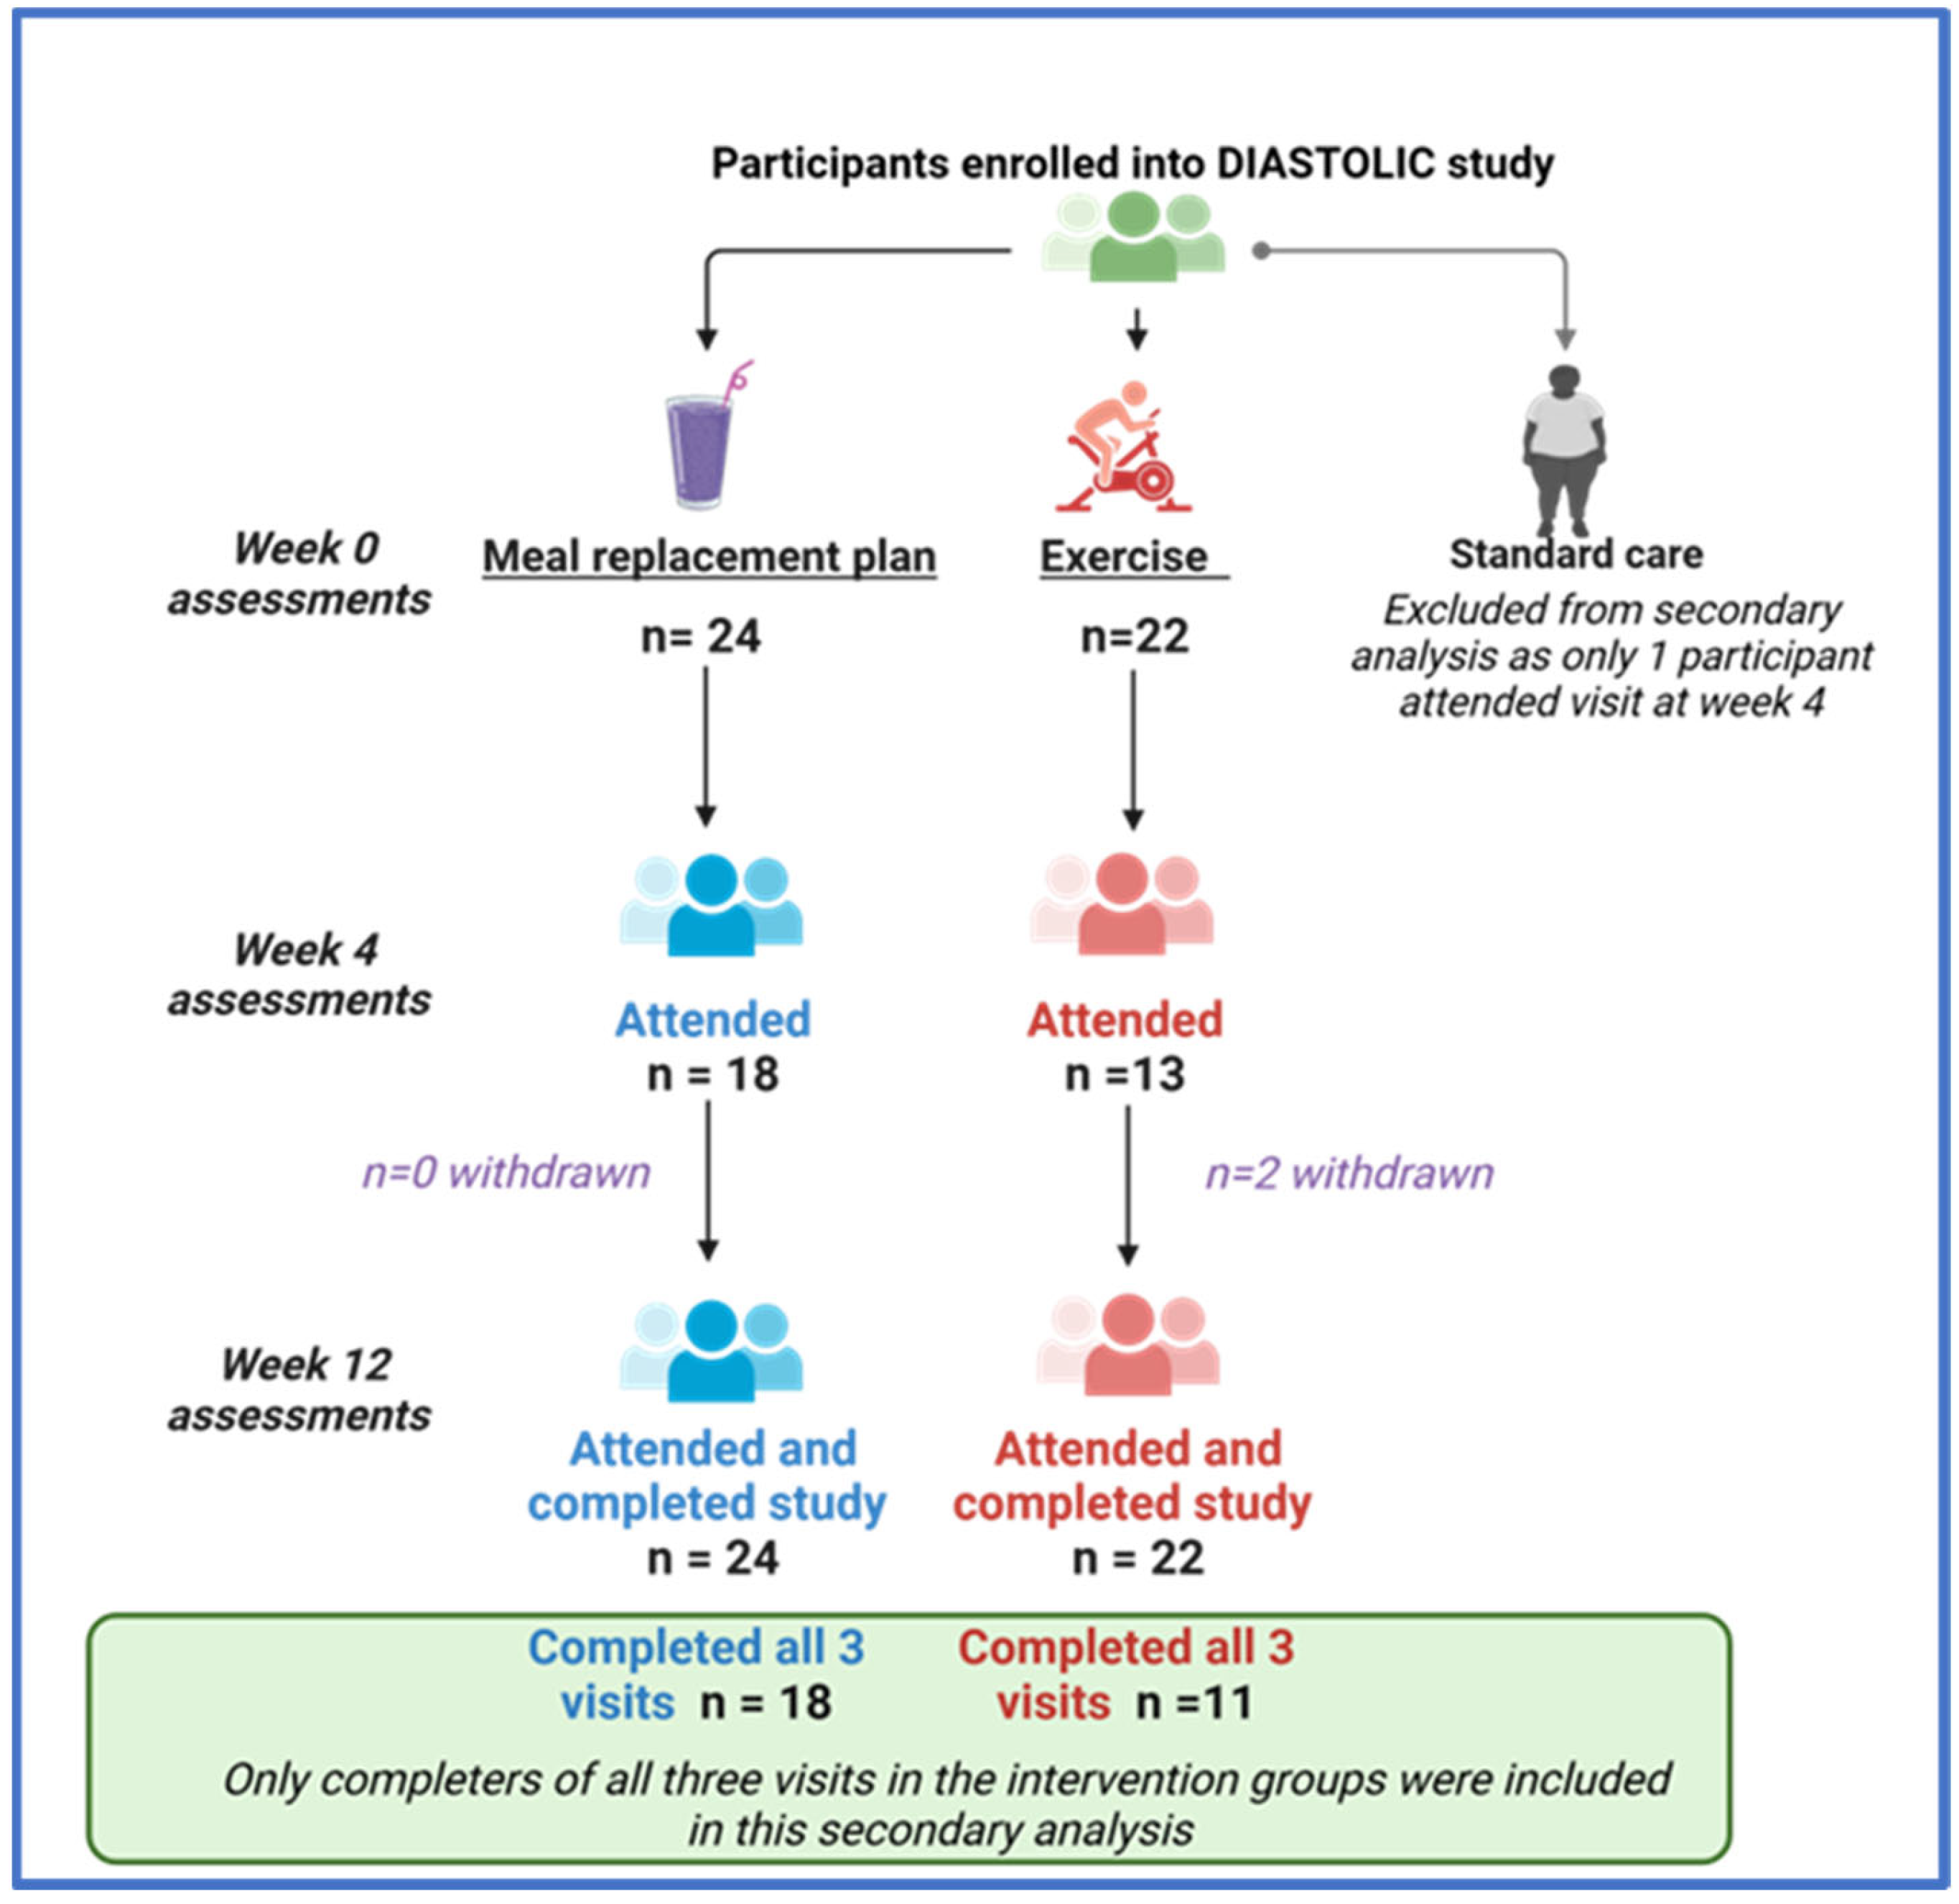
2.1. Study Population

The full inclusion and exclusion criteria have been published [19]. Eligible participants aged 18–65 years with established T2D (duration ≥ 3 months) diagnosed before age 60 years with BMI ≥ 30 kg/m2 (or ≥27 kg/m2 if South Asian or black ethnicity) and no prior cardiovascular disease. Key exclusion criteria were T2D duration > 12 years; current treatment with ≥three glucose-lowering medications or insulin; history, signs, or symptoms of cardiovascular disease, weight loss > 5 kg in the preceding 6 months; inability to exercise or undertake the MRP.

2.2. Anthropometry

Height and weight were measured following standard procedures, and body mass index (BMI, kg/m2) was calculated.

2.3. Biochemistry

A fibroinflammatory panel was conducted using the Luminex® multiplexed plasma biomarker assay (R&D systems, 2017, www.rndsystems.com/products/luminex-assays-and-highperformance-assays, accessed on 24 November 2023 by Bristol Myers Squibb (Ewing Township, NJ, USA). For this analysis, C-reactive protein (CRP), adipocyte fatty acid-binding protein 4 (FABP-4), growth differentiation factor-15 (GDF-15), and matrix metallopeptidase 8 (MMP-8) were selected because they reflect the systemic inflammatory and fibrotic processes implied in the development diabetic cardiomyopathy [21]. Insulin and leptin were quantified by multiplex assay on a Luminex platform [19]. Plasma adiponectin was analysed using a Quantikine ELISA assay (R&D Systems, Minneapolis, MN, USA). Serum lipid profile and glycated haemoglobin (HbA1c) were analysed according to standard operating procedures in the accredited laboratory at the University of Leicester NHS Trust, United Kingdom. The homeostatic index of insulin resistance (HOMA-IR) was calculated based on the fasting insulin and glucose levels [22].

2.4. CMR Image Acquisition and Analysis

CMR was performed using a 1.5-T scanner (Siemens Avanto or Aera, Erlangen, Germany) with retrospective echocardiographic gating and an 18-channel phased array cardiac receiver coil. Cardiac volumes and functional imaging and late gadolinium enhancement imaging were performed using standard cardiac magnetic resonance imaging techniques as previously described [19]. The complete imaging protocol has previously been published [19]. CMR analysis was performed offline, blinded to patient details. LV volumes and function were assessed by two operators (G.S.G and G.P.M.) using cmr42 version 5 (Circle Cardiovascular Imaging, Calgary, AB, Canada). Interobserver analysis has been previously published [23].

2.5. Trial Interventions

The 12-week low-energy meal replacement plan (MRP) was a nutritionally balanced ~810 kcal/day (50% carbohydrate, 30% protein, 20% fat) MRP (1:1 Diet Cambridge Weight Plan, UK). Oral anti-hyperglycaemics were discontinued to avoid hypoglycaemia, and antihypertensives were stopped to mitigate hypotension [19]. The diet was discontinued, and the maintenance diet was re-introduced between 8 and 12 weeks or once 50% excess body weight (difference between the actual and ideal body weight) was lost, whichever came first.
Participants in the exercise intervention arm attended thrice weekly, supervised, moderate-intensity aerobic exercise sessions. Exercise intensity was titrated to ∼60% baseline peak VO2 and heart rate [19]. Participants in the exercise arm followed their usual diet for the duration of the intervention.

2.6. Statistical Analysis

Data are shown as frequencies (%) for categorical data and mean ± SD or median (IQR) for continuous data. Normality was assessed using graphical (histograms and Q-Q plots) methods. Only data from completers of all three visits were included. The change in values between baseline and 4 weeks and then from 4 to 12 weeks was calculated within each group. Differences within groups for each time point are shown as mean or median differences alongside their corresponding 95% confidence interval (CI). Given the exploratory nature of this secondary analysis involving a small sample size and multiple measures across two groups at three time points, the statistical significance of the differences between time points is not reported. Instead, a description of the data trends is given. The magnitude of differences between variables across time points is assessed using the effect size: Cohen’s D was used for parametric data and coefficient of determination r2 for non-parametric data using standard methodology [24,25]. The interpretation of effect size is based on three categories: small (<0.2), medium or moderate (0.2–0.5), or large (≥0.8) for Cohen’s d [24], and small ≤ 0.04, medium or moderate ≥ 0.25, and large ≥ 0.64 for r2 [25]. Analysis was performed using SPSS v24.0 software (Statistical Package for the Social Sciences, Chicago, IL, USA).

3. Results

3.1. Baseline Characteristics

Complete data for three visits were available for 18 participants at the MRP and 11 at the exercise group (consort diagram, Appendix A Figure A1). Participants’ baseline demographic and clinical characteristics are provided in Table 1. No clinically meaningful differences in baseline characteristics or comorbidities were evident between groups. Both groups had similar baseline medication and body weight, but those allocated to the MRP had higher systolic blood pressure. Appendix A Table A1 compares the baseline and anthropometric measures between those included vs. excluded across both intervention groups, with no clinically meaningful differences evident, albeit those included in the MRP cohort had higher body weight and blood pressure compared to those excluded.

3.2. The Temporal Changes in the Effects of MRP and Exercise between 0 to 4 and 4 to 12 Weeks

3.2.1. Body Weight

In the MRP group, the average weight loss at 12 weeks was ~14 kg (mean difference (95% CI): −13.7 kg (−22.7 kg; −4.6 kg)) with the majority of the weight being lost in the first 4 weeks (mean difference −8.9 kg (−7.2; −10.5 kg)). Weight loss continued at a slower rate (1 kg per week on average) up to 12 weeks. In the exercise group, weight loss between baseline and 12 weeks was minimal (mean difference (95% CI)—1.4 kg (−11.4 kg; 8.6 kg)).

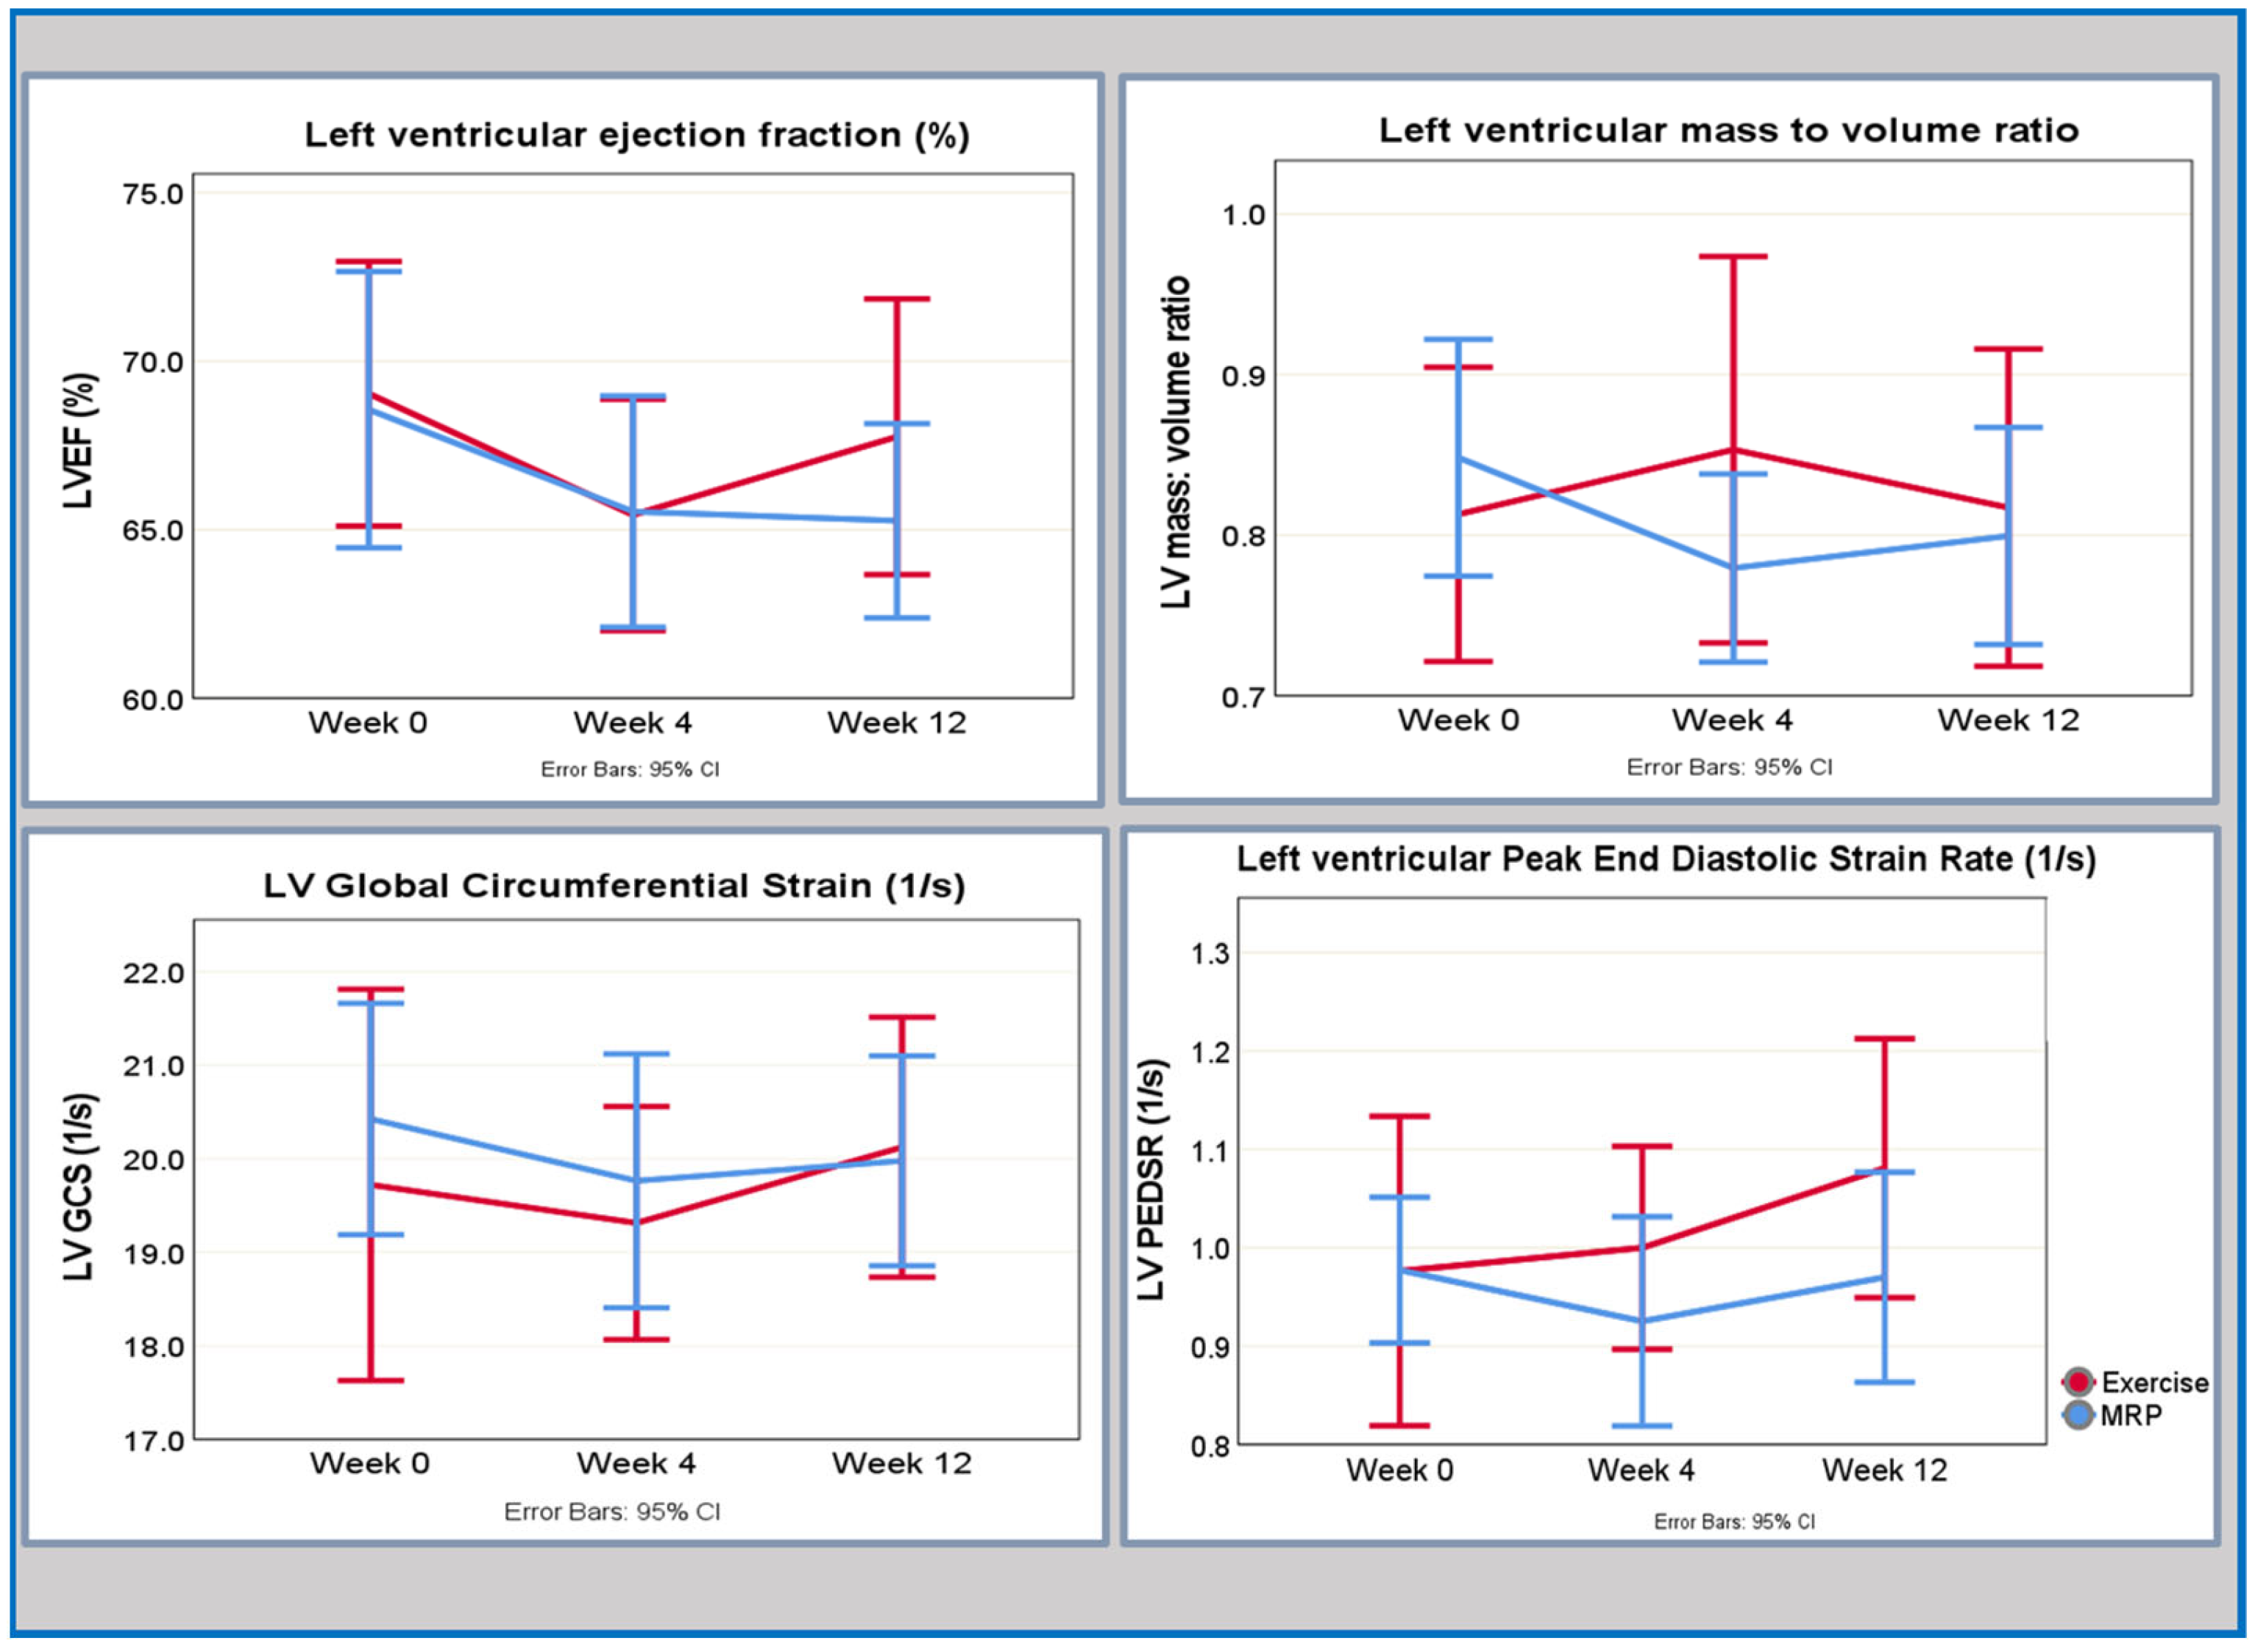
3.2.2. Cardiovascular Structure and Function

Changes in CMR-derived indices of cardiac structure and function are given in Table 2 and presented graphically in Figure 1.
In the MRP group, an early improvement in LV remodelling (LV mass-to-volume ratio) was seen at 4 weeks characterised by a moderate effect size. There was a further improvement by week 12, but the effect size was small. A decrease in left ventricular ejection fraction (LVEF) occurred between baseline and the 4-week interval, marked by a moderate effect size; however, the LVEF returned to baseline level by the 12-week time point, with a small effect size. Although there were small improvements in the circumferential peak early diastolic strain rate (circPEDR) at 4 weeks, which continued to 12 weeks, the effect size for these changes was small. There was an early response seen in the global circumferential strain (GCS) with a reduction at week 4, and no further change by week 12, with changes at both time points demonstrating a small effect size.
In the exercise group, the effect sizes for changes in the cardiovascular parameters were small, as outlined in Table 2. There was a trend towards a reduction in LVEF at 4 weeks, which returned to baseline by week 12; however, the effect size of those changes was small. Similarly, although there were small changes in the numerical values of circPEDSR and GCS, which trended towards an improvement at 4 weeks, the effect sizes were small for both indices across the two time points. There was a delayed response in the LV mass-to-volume ratio followed by a small trend towards an improvement seen at 12 weeks; however, both changes in the absolute values as well as the corresponding effect sizes were small.

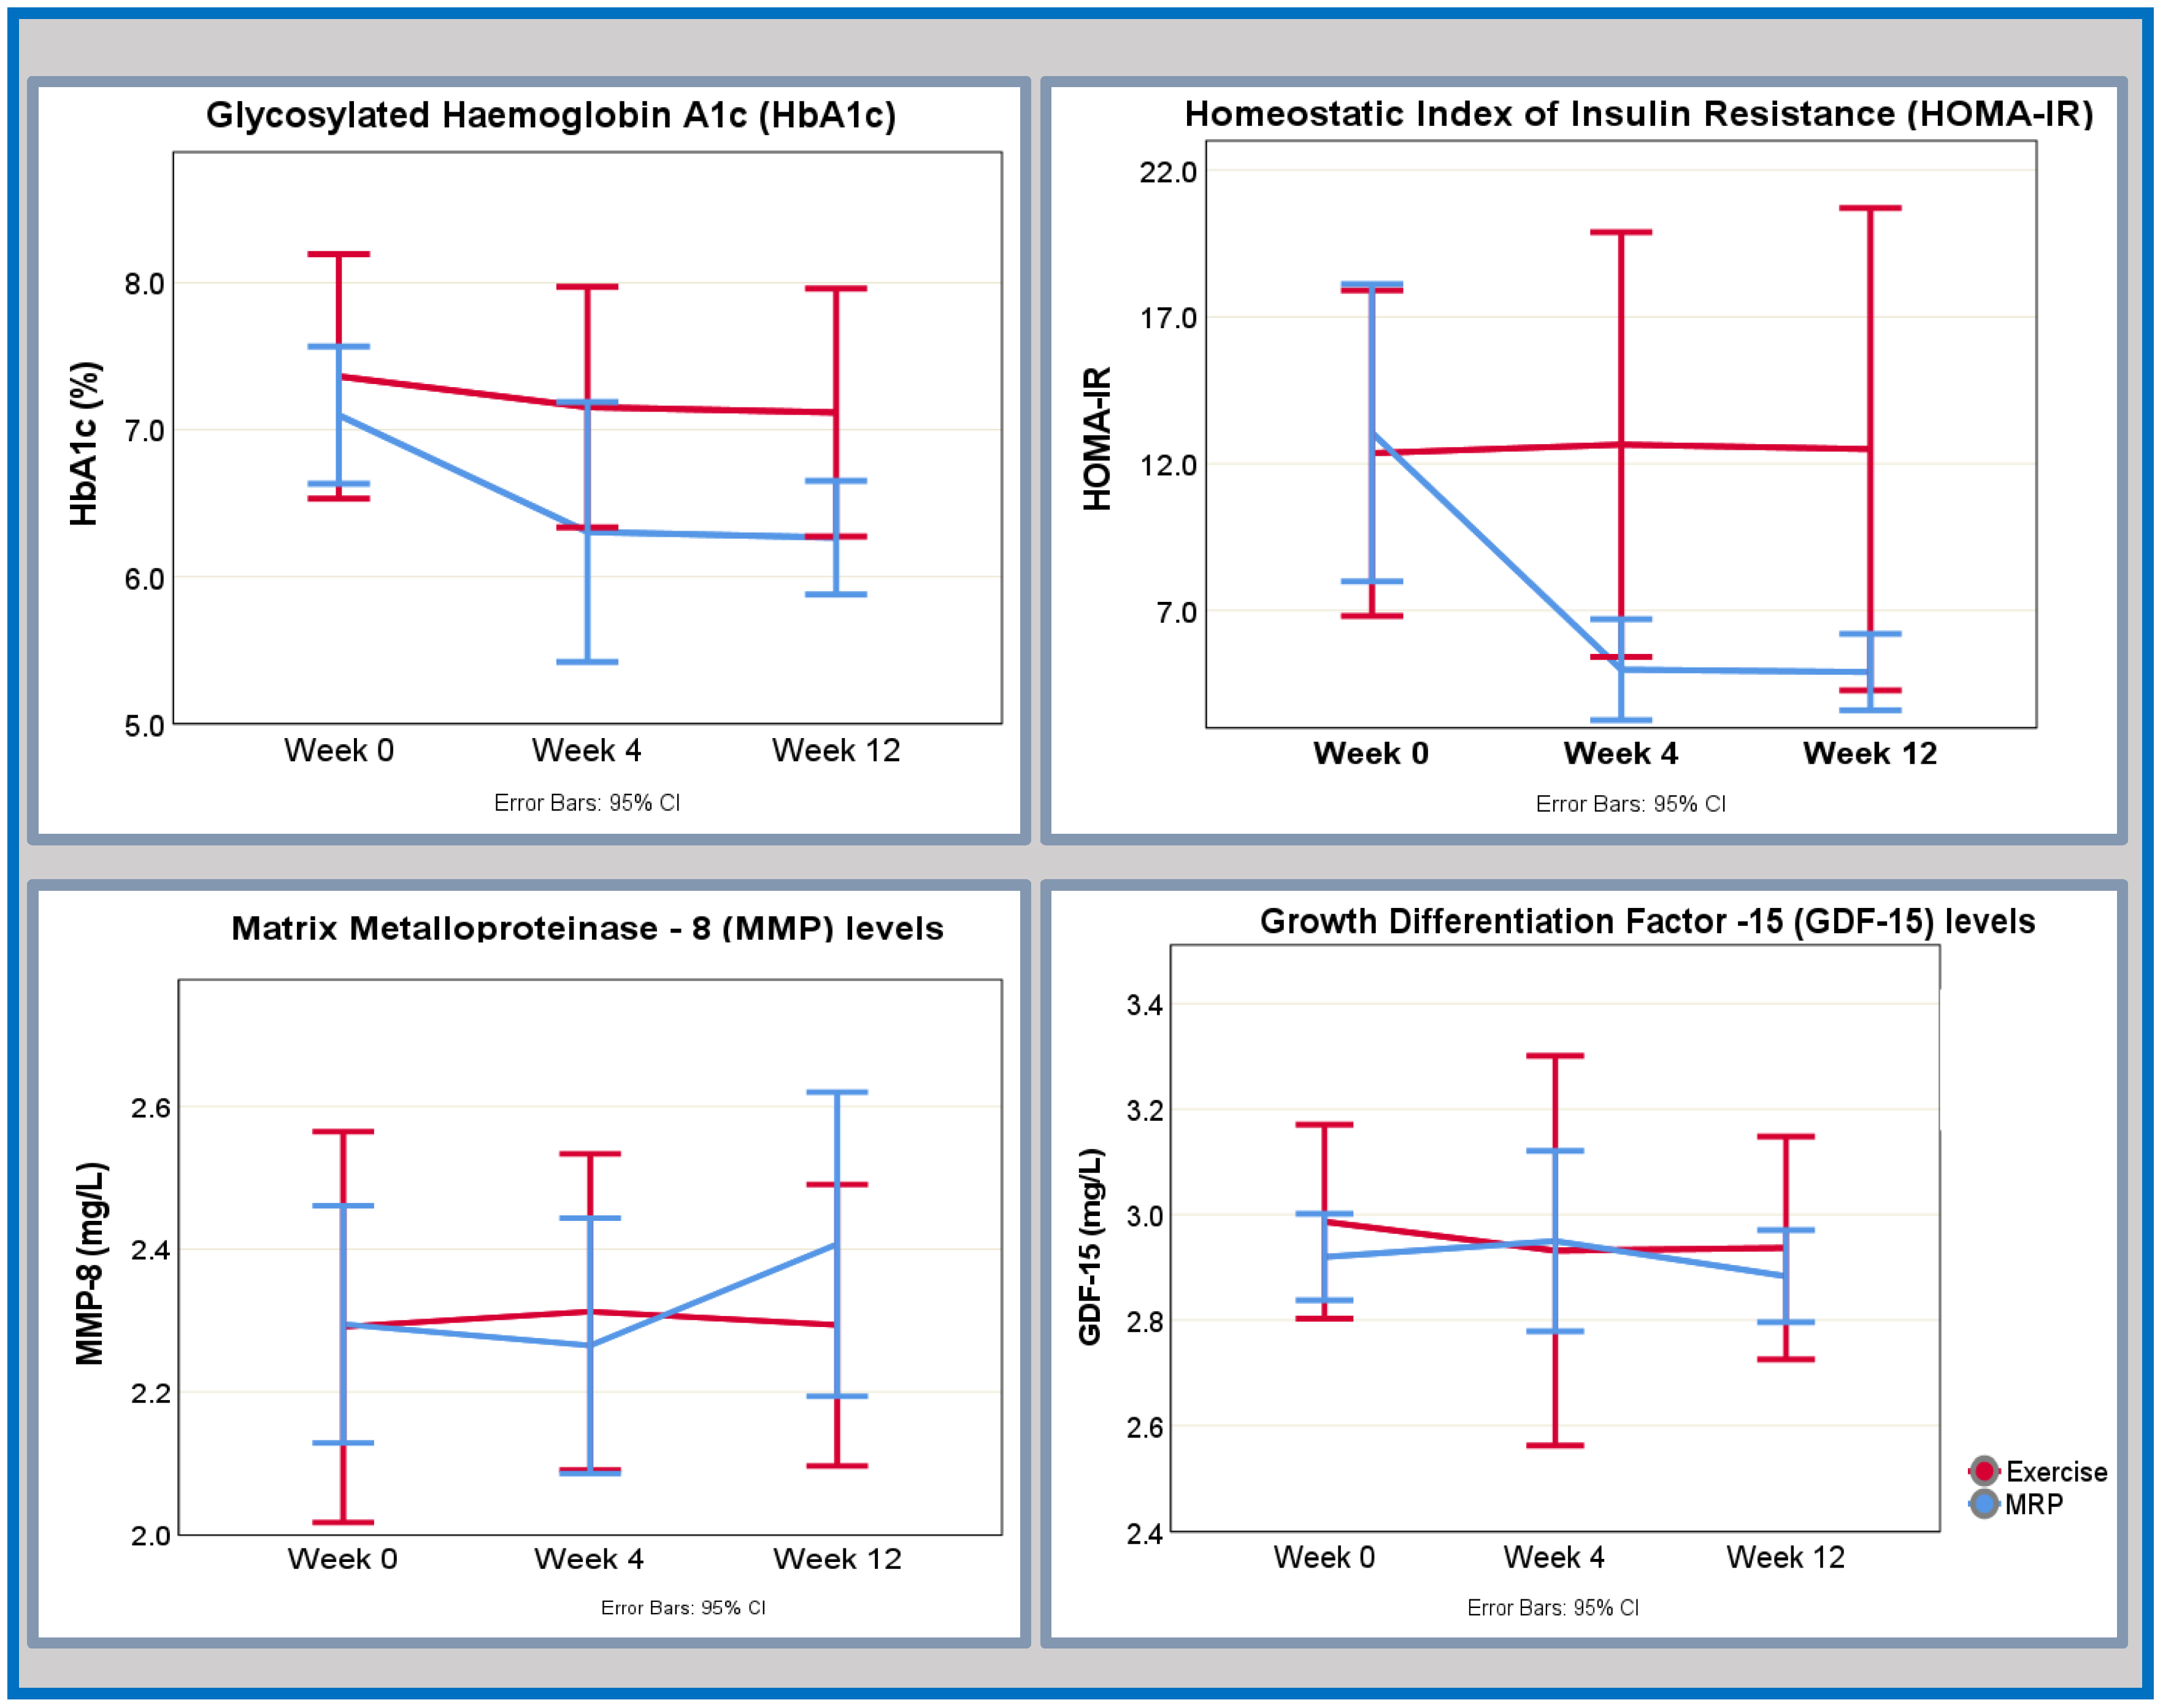
3.2.3. Glycometabolic Profile

Changes in glycometabolic markers are given in Table 3 (MRP group) and Table 4 (exercise group) and presented graphically in Figure 2.
In the MRP group, the most pronounced improvement in insulin resistance (HOMA-IR) was observed at the 4-week mark with a reduction of approximately 50% from its baseline value, accompanied by a large effect size. Subsequently, there were further small improvements in insulin resistance noted at 12 weeks, however, with a small effect size. Concurrently, there was an early and continued improvement in the glycaemic control (expressed as glycosylated haemoglobin HbA1c (%)) seen at week 4 (moderate effect size), which continued to week 12 albeit the effect size of change was small.
Similarly, leptin levels displayed a substantial reduction at the 4-week interval, associated with a large effect size. Although a further decline in leptin levels was observed by the 12-week mark, it is notable that the associated effect size was small. An initial increase in circulating adiponectin levels was discerned within the initial 4-week period, with an effect size indicative of a moderate impact. This increase persisted, exceeding baseline values at the 12-week assessment, albeit with a final effect size denoting a small effect.
Notable improvements in the lipid profile were evident between baseline and the 4-week time point. Specifically, there was a reduction in triglyceride levels and total cholesterol levels, both associated with a large effect size. These favourable trends persisted until the 12-week mark, albeit with effect sizes indicating a moderate impact. In contrast, high density lipoprotein (HDL) levels initially decreased before subsequently surpassing baseline values, albeit with only a small corresponding effect size.
In the exercise group, there was a small but early and sustained improvement in glycaemic control, as measured by HbA1c (%) and underscored by a large effect size. Concurrently, there was an early and sustained improvement in HOMA-IR across three time points; however, the accompanying effect size was moderate at week 4 and small at week 12. An early reduction in adiponectin levels, marked by a moderate effect size, was followed by an increase at the 12-week mark, though this latter alteration was accompanied by a small effect size. Triglyceride levels exhibited a small incremental rise across the three time points, with levels surpassing baseline values by week 12. Nevertheless, the effect size corresponding to this change was moderate only between the baseline and the 4 weeks. Although there were small reductions in total cholesterol and HDL cholesterol in the first 4 weeks, the accompanying effect sizes were small. Subsequently, HDL levels continued to decrease whereas total cholesterol levels increased, all with effect sizes indicative of small change.

3.2.4. Fibroinflammatory Biomarkers

Changes in fibroinflammatory markers are given in Table 3 (MRP group) and Table 4 (exercise group) and presented graphically in Figure 2.
In the MRP group, there was an early change in the fatty acid-binding protein 4 (FABP-4) levels between baseline and 4 weeks with a large effect size. FABP-4 levels continued to decrease to week 12, achieving a moderate effect size. Although C-reactive protein (CRP) levels were reduced at week 4 and then increased by week 12, the magnitude of the effect sizes was only small. There was a small initial increase in growth differentiation factor-15 (GDF-15) and matrix metalloproteinase-8 (MMP-8) levels at week 4 (small effect size), and this was followed by an increase by week 12 underpinned by a moderate effect size for both biomarkers.
In the exercise group, FABP-4 showed an early response of increasing at week 4, followed by a reduction by week 12 to below baseline levels; the corresponding effect sizes were small and moderate, respectively. The levels of CRP, GDF-15, and MMP-8 exhibited small fluctuations in levels across three time points; however, the effect sizes were small for all markers across the two time points.

4. Discussion

In this secondary analysis, we characterize the temporal responses of (1) cardiovascular function, (2) fibro-inflammation, and (3) glucometabolic profiles during a 12-week MRP or an exercise training programme in asymptomatic T2D.

4.1. Changes in Left Ventricular Systolic and Diastolic Function

In the MRP group, we observed an early response of a decrease in LVEF, which then remained below baseline, but within normal limits at 12 weeks. This was paralleled by changes in indices of LV strain. A reduction in LV strain is an early sign of dysfunction [26], and we observed an early reduction in circPEDSR as well as GCS in the first 4 weeks; however, the effect sizes of those changes were small. By week 12, circPEDSR improved indicating an overall improvement; however, again, the effect size was small. Our findings are similar to another single-group intervention study of 8 weeks of low-energy diet (≈810 kcal/day) in a small group of adults with obesity without HFpEF or T2D [13]. Rayner et al. observed a transient decline in LV systolic and diastolic function at week 1, which normalised by week 8. In our group, the continued change at week 12 suggests that reverse remodelling may require longer than 12 weeks to occur, but this remains to be confirmed in further studies.
Multiple possible pathophysiological explanations for the transient changes in LV function observed in our study exist. Firstly, it may be attributed to the increase in myocardial free fatty acid (FFA) and triglycerides and consequent increased utilization by the myocardium, which occurs in response to acute energy restriction [27]. Myocardial uptake of triglycerides is proportional to plasma concentration [28]; therefore, it is plausible that the decrease in the free triglycerides in our MRP group is a surrogate marker for increased myocardial triglyceride utilization and could be responsible for the transient changes in the LV strain, and diastolic function seen. We did not measure the myocardial triglyceride content, but it has been shown to increase in vivo in other studies performed on low-energy diets in obesity [13].
In the exercise group, there was an early reduction in LVEF (medium-effect size), but an improvement in circumferential end diastolic strain rate, with effect sizes indicating that these were small. Exercise training in HFpEF has been a focus of intense interest and investigated in a range of studies. A recent meta-analysis of key randomised controlled trials of exercise interventions in HfpEF found that exercise training did not result in improvements in the LV systolic or diastolic function as determined by echocardiography [29], which is not congruent with our findings; however, our group was assessed with CMR. It has been postulated that the benefits of exercise in HfpEF are predominantly extracardiac, including improving arterial stiffness and peripheral skeletal muscle oxygen extraction [29]. The exercise programme used in this study was not designed to elicit weight loss but to improve cardiovascular fitness [19]. The results of the DIASTOLIC trial support that the exercise tolerance defined as peak VO2 improved modestly, in response to exercise [20]. Dyspnoea and exercise intolerance are the cardinal symptoms of HFpEF; it is therefore likely that a combination of cardiac-directed and extra-cardiac factor-directed interventions (exercise) will be required to comprehensively manage HFpEF. Although weight loss with MRP can be associated with a reduction in lean muscle mass, an effect which can be mitigated by exercise [30]. A combination of diet and exercise may therefore be the most effective way of managing exercise intolerance in obesity and T2D.

4.2. Changes in Cardiac Remodelling and the Role of Inflammation and Cardiac Autophagy

Although the increased utilization of triglycerides and FFAs in cardiac infiltration described above may explain the transient diastolic dysfunction, it does not explain the improvement in LV mass–volume ratio (large, as graded by effect size) observed at 4 weeks in the MRP group and not in the exercise group.
Cardiac remodelling, pivotal in the evolution of HFpEF, is underpinned by neurohormonal imbalance, oxidative stress, and perturbed cardiac autophagy [31]. Cardiac autophagy is a process of myocardial cell turnover that is responsible for the degradation of damaged myocardial mitochondria and other cytoplasmic components and, consequently, influences the myocardial energy metabolism, remodelling, hypertrophy, and LV relaxation, all of which are central to the pathogenesis of HFpEF [32]. Cardiac autophagy becomes dysregulated within hours of energy deficiency, to allow accumulation of lipids and lysosomes to provide sustenance to the cardiomyocytes. Autophagic abnormalities have been demonstrated in the murine model of diabetic cardiomyopathy [32,33], where the autophagic process was dysregulated at baseline, and excess lysosome droplets accumulated within mitochondria resulting in diastolic dysfunction [32]. In this model, acute pharmacological inhibition of autophagy in starved mice resulted in a rapid decline in LV function and worsened LV remodelling [34], and when a pharmacological autophagy enhancer (Resveratrol) was used in T2D mice, the diastolic function improved [33]. It is plausible that the dysregulation of autophagy present in T2D myocardium is further dysregulated in the context of acute energy restriction, resulting in rapid cardiac remodelling; however, these mechanisms remain speculative.
Adiponectin’s role in autophagy underscores its connection to T2D, and regulation of cardiac autophagy is considered its key mechanism of cardiovascular protection [31]. Within our MRP group, a moderate increase in adiponectin levels at 4 weeks was paralleled by improved LV remodelling as measured by LV mass–volume ratio (of moderate effect size). Low adiponectin levels, common in obesity and T2D, adversely affect the vascular system and endothelial function and can lead to vascular and cardiac remodelling [31,35]. Conversely, increased adiponectin levels have been shown to combat LV hypertrophy and dysfunction by modulating LKB1-AMPK-eNOS signalling pathways [35]. In murine models of T2D, a deficiency in adiponectin or its regulatory pathways exacerbates cardiac hypertrophy, and dysfunction, and impairs myocardial autophagy [36,37]. Leptin also plays a complex role in cardiac remodelling and autophagy [31]. In the pressure-overload model of HF, such as HFpEF, leptin has been implicated in promoting cardiac dysfunction and remodelling via the Akt/mTOR pathway, affecting endothelial autophagy and heightening cardiac inflammation and fibrosis [38]. In our study, MRP led to a swift reduction in leptin levels at 4 weeks, and we observed improvements in left ventricular remodelling. Although our sample size was too small to confirm statistical significance, the effect size of this change was large. Aside from cardiac utilization, leptin reduction may reflect weight loss. The exercise showed similar, but less pronounced hormonal shifts, potentially due to a lack of weight loss. In a study of 24 perimenopausal obese women, vigorous aerobic exercise resulted in a significant decrease in leptin and a rise in adiponectin levels; however, this was only seen over a>20-week period [39]. It is plausible that the presence of T2D and a non-vigorous exercise regimen not designed to induce weight loss are accountable for the lack of major change in these two adipokines seen in our exercise group.
Recent studies suggest that epicardial adipose tissue (EAT) may be a key player in the emergence of diastolic dysfunction in adults with T2D [40,41]. While our study did not evaluate EAT, the impact of MRP and exercise on EAT’s lipid content and subsequent left ventricular (LV) strain warrants further investigation.

4.3. Changes in the Glycometabolic Profile and the Fibroinflammatory Markers

Consistent with existing literature, our analysis confirms that 12-week low-energy diet use leads to rapid, moderate to large (as graded by effect size) improvements in glycaemic control, insulin sensitivity, and lipid profiles [17,20,42]. These improvements are attributable to a complex interplay of biological responses, including enhanced pancreatic insulin release, increased glucose receptor activity, and alterations in mitochondrial density. Aerobic exercise has been shown to increase insulin sensitivity and regulate hyperglycaemia, even in the absence of significant weight loss as observed in our study [43]. The transient rise in triglycerides is likely attributable to the mobilisation of fat stores in response to increased anaerobic demand within the exercise group [44].
MRP had an immediate effect (within 4 weeks) on reducing circulating levels of the acute inflammatory phase protein hs-CRP, reduction in inflammatory proteins MMP-8, and increase in GDF-15. An increase in GDF-15 with MRP by 4 weeks is consistent with acute weight loss and signifies increased mitochondrial stress, likely due to metabolic shift related to acute energy restriction [44]. In the exercise group, small changes in hs-CRP and GDF-15 are likely due to the negligible weight loss, having no effect on meta-inflammation, and the effect size of these changes was small [45]. As adipose tissue is a source of GDF-15, smaller magnitude weight loss in the exercise group could account for small changes in the levels [44]. The FAB-4 fluctuations in the MRP group are again likely to correspond to weight loss stages: An initial rise in FAB-4, of large effect size, during the first 4 weeks reflects increased FFA release, followed by a decrease as weight loss and FFA mobilisation slow down between 4 and 12 weeks. One cardiometabolic pathogenic mechanism of FAB-4 is via disruption of glucose regulation and sensitivity [46]; thus, the changes observed in our study may be related to improvements in glucose control. In a recent study by Kitzman et al., a group of 24 people living with obesity and HFpEF underwent 20 weeks of very low-energy MRP, 26 structured exercises, and 25 underwent both interventions simultaneously [42]. The 20 weeks of approximately 600 kcal/day resulted in similar reductions in hs-CRP similar to our group and a further decrease in the exercise and diet groups. Kitzman et al. reported their results at a much later time point than in our group, which suggests a possibility of longer-term inflammatory suppression. A recent meta-analysis encompassing 27 studies indicated that endurance training significantly curtails inflammation in adults with obesity, with the most pronounced anti-inflammatory effects manifesting after prolonged periods (>20 weeks) and correlating with the fat loss [47]. This evidence suggests that the anti-inflammatory gains are attributable to more extended and intensive training than the 12-week aerobic regimen assessed in our study.

5. Limitations

This exploratory analysis benefits from multiparametric and detailed phenotyping of subjects using advanced fibroinflammatory markers and CMR at three time points and a randomised controlled study design, though it is not without its limitations. Firstly, this is a secondary analysis of the study, which was originally powered on circumferential PEDSR as the primary outcome at week 12 [19], and given that we include complete cases only, the sample size included is insufficient to confirm the statistical significance of our findings. Speckle tracking echocardiography, while frequently employed for strain assessment in clinical settings, faces limitations due to its dependence on angles, low signal-to-noise ratio, and susceptibility to adjacent myocardial contraction and cardiac translational movements [48], especially in the presence of chest deformities [49]. Although CMR overcomes these obstacles, CMR-derived strain is itself subject to limitations such as dependency on good image quality and frame rate, the operator’s experience, and the inter-vendor variability [50]. We have tried to mitigate this by a rigorous assessment of image quality, a standardised analysis protocol and an assessment conducted by a single experienced observer blinded to patient details and treatment group to minimise bias [19]. Despite limitations, intriguing trends in LV remodelling and inflammation in the MRP and exercise groups were seen despite small sample sizes and the short 12-week study duration. Future research should extend these findings to adults with established HFpEF to understand the full range of effects across all HF stages.

6. Conclusions

In this study, MRP-induced weight loss led to early (week 4) and sustained (week 12) improvements in insulin resistance, and inflammatory markers with improvements in LV reverse remodelling. However, there was an initial reduction in diastolic function that improved but remained below baseline at 12 weeks. Exercise training led to early, small but continued improvements in insulin resistance and inflammation, but no change in LV remodelling or diastology.

Author Contributions

J.M.B.: data analysis, statistical analysis, and writing—original draft preparation, review, and editing. G.S.G.: participant recruitment, image analysis, and draft revision. V.B.: statistical analysis. K.S.P.: acquisition of CMR images and draft revision. J.H., E.R., M.J.D. and T.Y.: study conception, design, data analysis, and draft revision. L.Z.: laboratory analysis; P.C., M.E.C., J.M. and C.-P.C.: investigation and writing—review & editing; G.P.M.: study conception, data analysis, and manuscript revision. E.M.B.: study conception, data analysis, and manuscript revision. All authors have read and agreed to the published version of the manuscript.

Funding

GPM is supported by an NIHR Research Professorship (2017-08-ST2-007). GSG was funded by a BHF Clinical research fellowship (FS/16/47/32190). JMB is supported by the British Society for Heart Failure Clinical Research Award (BSH-001-JMB).

Institutional Review Board Statement

Ethical approval was granted by the National Research Ethics Service (15/WM/0222), and the DIASTOLIC study was registered with clinicaltrials.gov (https://clinicaltrials.gov/study/NCT02590822?cond=NCT02590822&rank=1, accessed on 5 January 2024) (NCT02590822) and conducted according to the Declaration of Helsinki. The study was conducted in accordance with the International Conference on Harmonisation GCP Guidelines (ICH GCP) with informed consent given prior to any data collection.

Informed Consent Statement

Informed consent was obtained from all subjects involved in the study.

Data Availability Statement

Data are available upon request to the corresponding author.

Acknowledgments

We acknowledge the support from the Leicester Biomedical Research Centre and the NIHR Leicester Clinical Research Facility. The views expressed in this paper are those of the authors and not necessarily those of the NIHR, NHS, or the UK Department of Health and Social Care.

Conflicts of Interest

The authors declare no conflicts of interest.

Appendix A

Figure A1. A consort diagram of how participants were selected for this secondary analysis.
Hearts 05 00011 g0a1
Table A1. Distribution of demographic, anthropometric, and medication data at baseline between excluded and included participants in the analysis across interventions. Participants excluded from the analysis are the ones who did not attend the optional visit in week 4. Participants included in the analysis are the ones who attended all three visits.
MRPExercise
Excluded
n = 6
Included
n = 18
Excluded
n = 11
Included
n = 11
Age, years48.2 ± 8.3552.1 ± 4.3951.2 ± 3.8749.1 ± 9.73
Male sex, n (%)3.00 (50.0)12.0 (66.7)7.00 (68.6)6.00 (54.5)
White ethnic background, n (%)6.00 (100)13.0 (72.2)11.00 (100)9.00 (81)
Hypertension, n (%)3.00 (50)12.0 (66.7)5.00 (45.4)4.00 (36.4)
Hypercholesterolemia, n (%)4.00 (66.7)12.0 (66.7)9.00 (81.8)5.00 (45.4)
Systolic BP, mmHg146 ± 16151 ± 13.3136 ± 18.7136 ± 18.7
Height, cm169 ± 9.80169 ± 9.50169 ± 9.81169 ± 7.50
Weight, kg104 ± 23.2105 ± 13.598.7 ± 7.7799.6 ± 22.3
BMI, kg/m239.3 ± 8.3336.7 ± 4.9134.7 ± 5.1234.8 ± 6.70
HbA1c, %7.36 ± 1.547.10 ± 0.947.50 ± 1.027.34 ± 1.23
Medication received, n (%)
Insulin0000
Metformin6 (100)16 (88.8)11 (100)11 (100)
GLP-1 antagonist01 (5.56)3 (27.3)1 (9.09)
SGLT-2 inhibitor02 (11.1)2 (18.2)1 (9.09)
ACE inhibitor2 (33.3)7 (38.8)3 (27.3)3 (27.3)
Alpha blocker01 (5.56)1 (9.09)0
ARB1 (16.6)2 (11.1)01 (9.09)
B-blockers02 (11.1)02 (18.2)
CCB3 (50)4 (22.2)3 (27.3)2 (18.2)
Statin4 (66.7)11 (611)9 (81.8)5 (45.4)
Fibrate1 (16.6)000
Data are shown as mean ± SD unless otherwise indicated. Results are mean (SD) unless otherwise indicated. ARB, angiotensin receptor blocker; CCB, calcium channel blocker; GLP-1, glucagon-like peptide 1; SGLT-2, sodium glucose-linked transporter2 inhibitors; MRP: meal replacement plan.

References

  1. Borlaug, B.A. The pathophysiology of heart failure with preserved ejection fraction. Nat. Rev. Cardiol. 2014, 11, 507–515. [Google Scholar] [CrossRef]
  2. Shah, S.J.; Kitzman, D.W.; Borlaug, B.A.; van Heerebeek, L.; Zile, M.R.; Kass, D.A.; Paulus, W.J. Phenotype-Specific Treatment of Heart Failure with Preserved Ejection Fraction: A Multiorgan Roadmap. Circulation 2016, 134, 73–90. [Google Scholar] [CrossRef]
  3. Gregor, M.F.; Hotamisligil, G.S. Inflammatory Mechanisms in Obesity. Annu. Rev. Immunol. 2011, 29, 415–445. [Google Scholar] [CrossRef]
  4. Neeland, I.J.; Gupta, S.; Ayers, C.R.; Turer, A.T.; Rame, J.E.; Das, S.R.; Berry, J.D.; Khera, A.; McGuire, D.K.; Vega, G.L.; et al. Relation of regional fat distribution to left ventricular structure and function. Circ. Cardiovasc. Imaging. 2013, 6, 800–807. [Google Scholar] [CrossRef]
  5. Neeland, I.J.; Ross, R.; Després, J.P.; Matsuzawa, Y.; Yamashita, S.; Shai, I.; Seidell, J.; Magni, P.; Santos, R.D.; Arsenault, B.; et al. Visceral and ectopic fat, atherosclerosis, and cardiometabolic disease: A position statement. Lancet Diabetes Endocrinol. 2019, 7, 715–725. [Google Scholar] [CrossRef]
  6. Franssen, C.; Chen, S.; Unger, A.; Korkmaz, H.I.; De Keulenaer, G.W.; Tschope, C.; Leite-Moreira, A.F.; Musters, R.; Niessen, H.W.; Linke, W.A.; et al. Myocardial Microvascular Inflammatory Endothelial Activation in Heart Failure with Preserved Ejection Fraction. JACC Heart Fail. 2016, 4, 312–324. [Google Scholar] [CrossRef] [PubMed]
  7. Paulus, W.J.; Tschope, C. A novel paradigm for heart failure with preserved ejection fraction: Comorbidities drive myocardial dysfunction and remodeling through coronary microvascular endothelial inflammation. J. Am. Coll. Cardiol. 2013, 62, 263–271. [Google Scholar] [CrossRef] [PubMed]
  8. Paolillo, S.; Marsico, F.; Prastaro, M.; Renga, F.; Esposito, L.; De Martino, F.; Di Napoli, P.; Esposito, I.; Ambrosio, A.; Ianniruberto, M.; et al. Diabetic Cardiomyopathy: Definition, Diagnosis, and Therapeutic Implications. Heart Fail. Clin. 2019, 15, 341–347. [Google Scholar] [CrossRef] [PubMed]
  9. Viljanen, A.P.; Karmi, A.; Borra, R.; Pärkkä, J.P.; Lepomäki, V.; Parkkola, R.; Lautamäki, R.; Järvisalo, M.; Taittonen, M.; Rönnemaa, T.; et al. Effect of caloric restriction on myocardial fatty acid uptake, left ventricular mass, and cardiac work in obese adults. Am. J. Cardiol. 2009, 103, 1721–1726. [Google Scholar] [CrossRef]
  10. Jonker, J.T.; Snel, M.; Hammer, S.; Jazet, I.M.; van der Meer, R.W.; Pijl, H.; Meinders, A.E.; de Roos, A.; Smit, J.W.; Romijn, J.A.; et al. Sustained cardiac remodeling after a short-term very low calorie diet in type 2 diabetes mellitus patients. Int. J. Cardiovasc. Imaging 2014, 30, 121–127. [Google Scholar] [CrossRef]
  11. Jonker, J.T.; Djaberi, R.; van Schinkel, L.D.; Hammer, S.; Bus, M.T.J.; Kerpershoek, G.; Kharagjitsingh, A.V.; Romijn, J.A.; Bax, J.J.; Jukema, J.W.; et al. Very-Low-Calorie Diet Increases Myocardial Triglyceride Content and Decreases Diastolic Left Ventricular Function in Type 2 Diabetes with Cardiac Complications. Diabetes Care. 2013, 37, e1–e2. [Google Scholar] [CrossRef]
  12. van der Meer, R.W.; Hammer, S.; Smit, J.W.A.; Frölich, M.; Bax, J.J.; Diamant, M.; Rijzewijk, L.J.; de Roos, A.; Romijn, J.A.; Lamb, H.J. Short-Term Caloric Restriction Induces Accumulation of Myocardial Triglycerides and Decreases Left Ventricular Diastolic Function in Healthy Subjects. Diabetes 2007, 56, 2849–2853. [Google Scholar] [CrossRef]
  13. Rayner, J.J.; Abdesselam, I.; Peterzan, M.A.; Akoumianakis, I.; Akawi, N.; Antoniades, C.; Tomlinson, J.W.; Neubauer, S.; Rider, O.J. Very low calorie diets are associated with transient ventricular impairment before reversal of diastolic dysfunction in obesity. Int. J. Obes. 2019, 43, 2536–2544. [Google Scholar] [CrossRef]
  14. Hammer, S.; Snel, M.; Lamb, H.J.; Jazet, I.M.; van der Meer, R.W.; Pijl, H.; Meinders, E.A.; Romijn, J.A.; de Roos, A.; Smit, J.W. Prolonged caloric restriction in obese patients with type 2 diabetes mellitus decreases myocardial triglyceride content and improves myocardial function. J. Am. Coll. Cardiol. 2008, 52, 1006–1012. [Google Scholar] [CrossRef]
  15. Rehackova, L.; Rodrigues, A.M.; Thom, G.; Brosnahan, N.; Barnes, A.C.; McCombie, L.; Leslie, W.S.; Zhyzhneuskaya, S.; Peters, C.; Adamson, A.J.; et al. Participant experiences in the Diabetes REmission Clinical Trial (DiRECT). Diabet. Med. 2022, 39, e14689. [Google Scholar] [CrossRef]
  16. Leslie, W.S.; Ali, E.; Harris, L.; Messow, C.M.; Brosnahan, N.T.; Thom, G.; McCombie, E.L.; Barnes, A.C.; Sattar, N.; Taylor, R.; et al. Antihypertensive medication needs and blood pressure control with weight loss in the Diabetes Remission Clinical Trial (DiRECT). Diabetologia 2021, 64, 1927–1938. [Google Scholar] [CrossRef]
  17. Lean, M.E.; Leslie, W.S.; Barnes, A.C.; Brosnahan, N.; Thom, G.; McCombie, L.; Peters, C.; Zhyzhneuskaya, S.; Al-Mrabeh, A.; Hollingsworth, K.G.; et al. Primary care-led weight management for remission of type 2 diabetes (DiRECT): An open-label, cluster-randomised trial. Lancet 2018, 391, 541–551. [Google Scholar] [CrossRef] [PubMed]
  18. Kosiborod, M.N.; Abildstrøm, S.Z.; Borlaug, B.A.; Butler, J.; Rasmussen, S.; Davies, M.; Hovingh, G.K.; Kitzman, D.W.; Lindegaard, M.L.; Møller, D.V.; et al. Semaglutide in Patients with Heart Failure with Preserved Ejection Fraction and Obesity. N. Engl. J. Med. 2023, 389, 1069–1084. [Google Scholar] [CrossRef] [PubMed]
  19. Gulsin, G.S.; Brady, E.M.; Swarbrick, D.J.; Athithan, L.; Henson, J.; Baldry, E.; McAdam, J.; Marsh, A.M.; Parke, K.S.; Wormleighton, J.V.; et al. Rationale, design and study protocol of the randomised controlled trial: Diabetes Interventional Assessment of Slimming or Training tO Lessen Inconspicuous Cardiovascular Dysfunction (the DIASTOLIC study). BMJ Open 2019, 9, e023207. [Google Scholar] [CrossRef] [PubMed]
  20. Gulsin, G.S.; Swarbrick, D.J.; Athithan, L.; Brady, E.M.; Henson, J.; Baldry, E.; Argyridou, S.; Jaicim, N.B.; Squire, G.; Walters, Y.; et al. Effects of Low-Energy Diet or Exercise on Cardiovascular Function in Working-Age Adults with Type 2 Diabetes: A Prospective, Randomized, Open-Label, Blinded End Point Trial. Diabetes Care 2020, 43, 1300–1310. [Google Scholar] [CrossRef] [PubMed]
  21. Brady, E.M.; Gulsin, G.S.; Mirkes, E.M.; Parke, K.; Kanagala, P.; Ng, L.L.; Graham-Brown, M.P.M.; Athithan, L.; Henson, J.; Redman, E.; et al. Fibro-inflammatory recovery and type 2 diabetes remission following a low calorie diet but not exercise training: A secondary analysis of the DIASTOLIC randomised controlled trial. Diabet. Med. 2022, 39, e14884. [Google Scholar] [CrossRef]
  22. Placzkowska, S.; Pawlik-Sobecka, L.; Kokot, I.; Piwowar, A. Indirect insulin resistance detection: Current clinical trends and laboratory limitations. Biomed. Pap. Med. 2019, 163, 187–199. [Google Scholar] [CrossRef]
  23. Gulsin, G.S.; Swarbrick, D.J.; Hunt, W.H.; Levelt, E.; Graham-Brown, M.P.M.; Parke, K.S.; Wormleighton, J.V.; Lai, F.Y.; Yates, T.; Wilmot, E.G.; et al. Relation of Aortic Stiffness to Left Ventricular Remodeling in Younger Adults with Type 2 Diabetes. Diabetes 2018, 67, 1395–1400. [Google Scholar] [CrossRef]
  24. Cohen, J. A power primer. Psychol. Bull. 1992, 112, 155–159. [Google Scholar] [CrossRef]
  25. Serdar, C.C.; Cihan, M.; Yücel, D.; Serdar, M.A. Sample size, power and effect size revisited: Simplified and practical approaches in pre-clinical, clinical and laboratory studies. Biochem. Med. 2021, 31, 010502. [Google Scholar] [CrossRef] [PubMed]
  26. DeVore, A.D.; McNulty, S.; Alenezi, F.; Ersboll, M.; Vader, J.M.; Oh, J.K.; Lin, G.; Redfield, M.M.; Lewis, G.; Semigran, M.J.; et al. Impaired left ventricular global longitudinal strain in patients with heart failure with preserved ejection fraction: Insights from the RELAX trial. Eur. J. Heart Fail. 2017, 19, 893–900. [Google Scholar] [CrossRef] [PubMed]
  27. Rui, L. Energy metabolism in the liver. Compr. Physiol. 2014, 4, 177–197. [Google Scholar] [PubMed]
  28. Kerr, M.; Dodd, M.S.; Heather, L.C. The ‘Goldilocks zone’ of fatty acid metabolism; to ensure that the relationship with cardiac function is just right. Clin. Sci. 2017, 131, 2079–2094. [Google Scholar] [CrossRef] [PubMed]
  29. Pandey, A.; Parashar, A.; Kumbhani, D.; Agarwal, S.; Garg, J.; Kitzman, D.; Levine, B.; Drazner, M.; Berry, J. Exercise training in patients with heart failure and preserved ejection fraction: Meta-analysis of randomized control trials. Circ. Heart Fail. 2015, 8, 33–40. [Google Scholar] [CrossRef] [PubMed]
  30. Gulsin, G.S.; Henson, J.; Brady, E.M.; Sargeant, J.A.; Wilmot, E.G.; Athithan, L.; Htike, Z.Z.; Marsh, A.M.; Biglands, J.D.; Kellman, P.; et al. Cardiovascular Determinants of Aerobic Exercise Capacity in Adults with Type 2 Diabetes. Diabetes Care 2020, 43, 2248–2256. [Google Scholar] [CrossRef]
  31. Kamareddine, L.; Ghantous, C.M.; Allouch, S.; Al-Ashmar, S.A.; Anlar, G.; Kannan, S.; Djouhri, L.; Korashy, H.M.; Agouni, A.; Zeidan, A. Between Inflammation and Autophagy: The Role of Leptin-Adiponectin Axis in Cardiac Remodeling. J. Inflamm. Res. 2021, 14, 5349–5365. [Google Scholar] [CrossRef]
  32. Nishida, K.; Kyoi, S.; Yamaguchi, O.; Sadoshima, J.; Otsu, K. The role of autophagy in the heart. Cell Death Differ. 2009, 16, 31–38. [Google Scholar] [CrossRef]
  33. Kanamori, H.; Takemura, G.; Goto, K.; Tsujimoto, A.; Mikami, A.; Ogino, A.; Watanabe, T.; Morishita, K.; Okada, H.; Kawasaki, M.; et al. Autophagic adaptations in diabetic cardiomyopathy differ between type 1 and type 2 diabetes. Autophagy 2015, 11, 1146–1160. [Google Scholar] [CrossRef]
  34. Takemura, G.; Kanamori, H.; Goto, K.; Maruyama, R.; Tsujimoto, A.; Fujiwara, H.; Seishima, M.; Minatoguchi, S. Autophagy maintains cardiac function in the starved adult. Autophagy 2009, 5, 1034–1036. [Google Scholar] [CrossRef]
  35. Ghantous, C.M.; Kobeissy, F.H.; Soudani, N.; Rahman, F.A.; Al-Hariri, M.; Itani, H.A.; Sabra, R.; Zeidan, A. Mechanical stretch-induced vascular hypertrophy occurs through modulation of leptin synthesis-mediated ROS formation and GATA-4 nuclear translocation. Front. Pharmacol. 2015, 6, 240. [Google Scholar] [CrossRef]
  36. Guo, R.; Zhang, Y.; Turdi, S.; Ren, J. Adiponectin knockout accentuates high fat diet-induced obesity and cardiac dysfunction: Role of autophagy. Biochim. Biophys. Acta 2013, 1832, 1136–1148. [Google Scholar] [CrossRef]
  37. Jahng, J.W.; Turdi, S.; Kovacevic, V.; Dadson, K.; Li, R.K.; Sweeney, G. Pressure Overload-Induced Cardiac Dysfunction in Aged Male Adiponectin Knockout Mice Is Associated with Autophagy Deficiency. Endocrinology 2015, 156, 2667–2677. [Google Scholar] [CrossRef] [PubMed]
  38. Gogiraju, R.; Hubert, A.; Fahrer, J.; Straub, B.K.; Brandt, M.; Wenzel, P.; Münzel, T.; Konstantinides, S.; Hasenfuss, G.; Schäfer, K. Endothelial Leptin Receptor Deletion Promotes Cardiac Autophagy and Angiogenesis Following Pressure Overload by Suppressing Akt/mTOR Signaling. Circ. Heart Fail. 2019, 12, e005622. [Google Scholar] [CrossRef] [PubMed]
  39. Sari, İ.; Habipoğlu, S.; Seydel, G.; Erşan, S.; Güntürk, İ. The effect of acute step-aerobic exercise on adiponectin and leptin levels in premenopausal women. J. Sports Med. Phys. Fitness 2021, 61, 725–731. [Google Scholar] [CrossRef] [PubMed]
  40. Koepp, K.E.; Obokata, M.; Reddy, Y.N.V.; Olson, T.P.; Borlaug, B.A. Hemodynamic and Functional Impact of Epicardial Adipose Tissue in Heart Failure with Preserved Ejection Fraction. JACC Heart Fail. 2020, 8, 657–666. [Google Scholar] [CrossRef] [PubMed]
  41. Patel, V.B.; Shah, S.; Verma, S.; Oudit, G.Y. Epicardial adipose tissue as a metabolic transducer: Role in heart failure and coronary artery disease. Heart Fail. Rev. 2017, 22, 889–902. [Google Scholar] [CrossRef] [PubMed]
  42. Kitzman, D.W.; Brubaker, P.; Morgan, T.; Haykowsky, M.; Hundley, G.; Kraus, W.E.; Eggebeen, J.; Nicklas, B.J. Effect of Caloric Restriction or Aerobic Exercise Training on Peak Oxygen Consumption and Quality of Life in Obese Older Patients with Heart Failure with Preserved Ejection Fraction: A Randomized Clinical Trial. JAMA 2016, 315, 36–46. [Google Scholar] [CrossRef] [PubMed]
  43. Colberg, S.R.; Sigal, R.J.; Yardley, J.E.; Riddell, M.C.; Dunstan, D.W.; Dempsey, P.C.; Horton, E.S.; Castorino, K.; Tate, D.F. Physical Activity/Exercise and Diabetes: A Position Statement of the American Diabetes Association. Diabetes Care 2016, 39, 2065–2079. [Google Scholar] [CrossRef] [PubMed]
  44. Wang, D.; Day, E.A.; Townsend, L.K.; Djordjevic, D.; Jørgensen, S.B.; Steinberg, G.R. GDF15: Emerging biology and therapeutic applications for obesity and cardiometabolic disease. Nat. Rev. Endocrinol. 2021, 17, 592–607. [Google Scholar] [CrossRef]
  45. Tsioufis, C.; Bafakis, I.; Kasiakogias, A.; Stefanadis, C. The role of matrix metalloproteinases in diabetes mellitus. Curr. Top. Med. Chem. 2012, 12, 1159–1165. [Google Scholar] [CrossRef] [PubMed]
  46. Dahlström, E.H.; Saksi, J.; Forsblom, C.; Uglebjerg, N.; Mars, N.; Thorn, L.M.; Harjutsalo, V.; Rossing, P.; Ahluwalia, T.S.; Lindsberg, P.J.; et al. The Low-Expression Variant of FABP4 Is Associated with Cardiovascular Disease in Type 1 Diabetes. Diabetes 2021, 70, 2391–2401. [Google Scholar] [CrossRef] [PubMed]
  47. Gonzalo-Encabo, P.; Maldonado, G.; Valadés, D.; Ferragut, C.; Pérez-López, A. The Role of Exercise Training on Low-Grade Systemic Inflammation in Adults with Overweight and Obesity: A Systematic Review. Int. J. Environ. Res. Public Health 2021, 18, 13258. [Google Scholar] [CrossRef]
  48. Voigt, J.U.; Pedrizzetti, G.; Lysyansky, P.; Marwick, T.H.; Houle, H.; Baumann, R.; Pedri, S.; Ito, Y.; Abe, Y.; Metz, S.; et al. Definitions for a common standard for 2D speckle tracking echocardiography: Consensus document of the EACVI/ASE/Industry Task Force to standardize deformation imaging. Eur. Heart J. Cardiovasc. Imaging 2015, 16, 1–11. [Google Scholar] [CrossRef]
  49. Sonaglioni, A.; Nicolosi, G.L.; Trevisan, R.; Lombardo, M.; Grasso, E.; Gensini, G.F.; Ambrosio, G. The influence of pectus excavatum on cardiac kinetics and function in otherwise healthy individuals: A systematic review. Int. J. Cardiol. 2023, 381, 135–144. [Google Scholar] [CrossRef]
  50. Scatteia, A.; Baritussio, A.; Bucciarelli-Ducci, C. Strain imaging using cardiac magnetic resonance. Heart Fail. Rev. 2017, 22, 465–476. [Google Scholar] [CrossRef]
Figure 1. Key temporal responses of cardiovascular indices to MRP or exercise from baseline to week 4 and week 12.
Hearts 05 00011 g001
Figure 2. Key differential temporal changes in glycaemic control and fibroinflammatory markers with regard to MRP or exercise from baseline to week 4 and week 12.
Hearts 05 00011 g002
Table 1. Baseline demographics of study participants.
MRP
n = 18
Exercise
n = 11
Age, years52.1 ± 4.3949.1 ± 9.73
Male sex, n (%)12.0 (66.7)6.00 (54.5)
White ethnic background, n (%)13.0 (72.2)9.00 (81)
Hypertension, n (%)12.0 (66.7)4.00 (36.4)
Hypercholesterolemia, n (%)12.0 (66.7)5.00 (45.4)
Systolic blood pressure, mmHg151 ± 13.3136 ± 18.7
Height, cm169 ± 9.50169 ± 7.50
Weight, kg105 ± 13.599.6 ± 22.3
Body mass index, kg/m236.7 ± 4.9134.8 ± 6.70
HbA1c, %7.10 ± 0.947.34 ± 1.23
Medication received, n (%)
Insulin00
Metformin16 (88.8)11 (100)
GLP-1 antagonist1 (5.56)1 (9.09)
SGLT-2 inhibitor2 (11.1)1 (9.09)
ACE inhibitor7 (38.8)3 (27.3)
Alpha blocker1 (5.56)0
ARB2 (11.1)1 (9.09)
B-blockers2 (11.1)2 (18.2)
CCB4 (22.2)2(18.2)
Statin11 (611)5 (45.4)
Fibrate00
Results are mean ± SD unless otherwise indicated. ARB, angiotensin receptor blocker; CCB, calcium channel blocker; GLP-1, glucagon-like peptide 1; MRP, meal replacement plan; SGLT-2, sodium glucose-linked transporter2 inhibitors.
Table 2. Temporal responses of cardiac MRI parameters for the MRP and exercise groups.
Baseline–Week 4Week 4–Week 12
BaselineWeek 4Week 12Mean Difference (95% CI) Effect Size (95% CI)
Cohen’s d
Mean Difference (95% CI) Effect Size (95% CI)
Cohen’s d
MRP group
LV ejection fraction, %69.0 ± 7.665.6 ± 6.265.2 ± 5.4 −3.4 (0.29; 6.45)0.56 (0.04; 1.07)−0.3 (−2.543.09)0.05 (−0.44; 0.54)
LV mass indexed to height, g/cm0.78 ± 0.140.74 ± 0.150.69 ± 0.22−0.04 (0.00; 0.10)0.17 (−0.31; 0.64)0.00 (−0.05; 0.13)0.22 (−0.25; 0.70)
Longitudinal PEDSR, −1/s0.69 ± 0.080.71 ± 0.130.69 ± 0.14−0.02 (−0.09; 0.10)−0.15 (−0.77; 0.48)−0.02 (−0.09; 0.13)0.07 (−0.58; 0.72)
Circumferential PEDSR, −1/s0.97 ± 0.130.94 ± 0.190.97 ± 0.19−0.04 (−0.18; 0.08)0.20 (−0.29; 0.69)−0.04 (−0.17; 0.08)−0.18 (−0.69; 0.32)
Global longitudinal strain, %15.8 ± 2.616.5 ± 2.416.0 ± 1.8−0.70 (−2.0; 0.68) −0.28 (−0.78; 0.24)−0.57 (−2.0; 0.84)0.27 (−0.27; 0.80)
Global circumferential strain, %20.5 ± 1.0919.9 ± 2.319.9 ± 1.90.59 (−0.26; 1.43)0.38 (−0.14; 0.90)−0.21 (−1.01; 0.58)−0.15 (0.68; 0.37)
LV mass-to-volume ratio0.86 ± 0.140.78 ± 0.110.80 ± 0.12−0.08 (0.028; 0.12)0.80 (0.24; 1.34)−0.02 (−0.06; 0.02)0.24 (0.74; 0.25)
Exercise group
LV ejection fraction, %69.03 ± 5.865.4 ± 5.167.8 ± 6.1−3.39 (−2.23; 9.41)0.41 (−0.21; 1.02)−2.31 (−6.28; 1.64)0.39 (−0.99; 0.23)
LV mass indexed to height, g/m0.70 ± 0.120.72 ± 0.120.71 ± 0.1−0.02 (−0.05; 0.14)−0.38 (−0.98; 0.24)0.01 (−0.04; 0.14)0.07 (−0.51; 0.67)
Longitudinal PEDSR, −1/s0.76 ± 0.160.77 ± 0.120.79 ± 0.14−0.01 (0.04; 0.05)–0.37 (−0.77; 0.71)0.02 (−0.14; 0.18)−0.1 (−0.84; 0.64)
Circumferential PEDSR, −1/s0.97 ± 0.231.00 ± 0.151.08 ± 0.19−0.02 (−0.11; 0.06)−0.17 ((−0.76; 0.43)−0.08 (0.16; −0.002)0.05 (−1.15; 0.11)
Global longitudinal strain, %16.3 ± 2.916.1 ± 2.216.9 ± 2.1−0.29 (−2.3; 1.7)0.06 (−0.01; 1.29)−0.92 (−1.69; −1.15)0.01 (−0.43; 0.73)
Global circumferential strain, %19.7 ± 3.119.3 ± 1.920.1 ± 2.10.41 (−1.48; 2.30)0.01 (−0.45; 0.73)−0.81 (−1.83; 0.22)−0.50 (−1.15; 0.11)
LV mass-to-volume ratio0.81 ± 0.1420.85 ± 0.180.82 ± 0.15−0.04 (−0.10; 0.02)−0.44 (−1.05; 0.18)−0.03 (−0.01; 0.08)0.44 (−0.16; 1.04)
Results are shown as mean ± SD or mean difference (95% CI). Effect sizes (95% CI); SD, standard deviation; CI, confidence interval; LV, left ventricular, PEDSR, peak early diastolic strain rate.
Table 3. Temporal responses of fibroinflammatory and glycometabolic markers for the MRP group (n = 18).
Baseline—Week 4Week 4–Week 12
BaselineWeek 4Week 12Mean or Median Difference
(95% CI or IQR)
Effect Size (95% CI)Mean or Median Difference
(95% CI or IQR)
Effect Size (95% CI)
CRP, mg/L6.26 ± 0.186.12 ± 0.396.30 ± 0.19−0.14 (−0.07; 0.36)0.35 (−0.16; 0.85)0.18 (−0.39; 0.03)0.45 (−0.95; 0.07)
FABP-4, mg/L4.87 ± 0.195.15 ± 0.324.97 ± 0.300.27 (−0.42; −0.12)0.97 (−1.15; 0.36)−0.18 (0.02; 0.33)0.61 (0.07; 1.14)
GDF-15, mg/L2.92 ± 0.152.95 ± 0.322.88 ± 0.160.03 (0.20; 0.14)0.10 (−0.58; 0.40)−0.07(−0.08; 0.21)0.25 (−0.25; 0.74)
MMP-8, mg/L2.29 ± 0.312.26 ± 0.342.41 ± 0.40−0.03 (−0.10; 0.16)0.12 (−0.37; 0.62)0.14 (−0.28; 0.01)0.54 (−1.1; −0.06)
Adiponectin * 103, mg/L3.57 (2.56; 4.67)4.16 (3.23; 5.83)4.76 (3.16; 6.16)0.62 * (−1.9; 0.95)0.55 $ (0.045; 1.04)0.18 * (−1.13; 1.21)0.20 $ (−0.45; 0.48)
Leptin * 103, mg/L19.3 (11.9; 41.8)6.65 (3.84; 22.3)5.89 (3.75; 27.4)−13.8 * (7.26; 20.34)1.05 $ (0.46; 1.62)−2.53 * (−8.95; 3.89)0.20 $ (−0.66; 0.27)
Glycated HbA1c, %7.10 ± 0.946.31 ± 1.786.27 ± 0.78−0.79 (0.07; 1.52)0.55 (0.04; 1.03)−0.04 (−0.73; 0.81)0.03 (−0.44; 0.48)
HOMA-IR10.8 (8.38; 14.3)4.32 (2.09; 7.62)3.98 (2.07; 7.60)−5.40 * (2.52; 8.01)0.88 $ (0.28; 1.45)−0.40 * (−1.67; 2.22)0.30 $ (−0.45; 0.52)
Triglycerides, mmol/L2.11 ± 1.041.04 ± 0.281.31 ± 0.46−1.07 (0.55; 1.59)1.06 (0.45; 1.64)0.27 (−0.51; 0.03)0.60 (−1.09; 0.06)
Cholesterol, total, mmol/L4.64 ± 1.083.50 ± 0.994.16 ± 1.24−1.14 (−0.81; −1.48)1.75 (0.97; 2.51)0.66 (1.09; 0.23)0.79 (0.23; 1.32)
HDL cholesterol, mmol/L1.17 ± 0.171.14 ± 0.191.21 ± 0.23−0.03 (−0.07; 0.12)0.14 (−0.56; 0.63)0.08 (−0.17; 0.02)0.42 (−0.91; 0.83)
LDL cholesterol, mmol/L2.55 ± 0.881.96 ± 0.962.35 (1.16)−0.59 (0.24; 0.95)0.88 (0.29; 1.46)0.39 (0.83; 0.07)0.61 (0.08; 1.12)
Values presented are mean ± SD or median (interquartile range). Change is presented either as mean (95% CI) for parametric data or median (IQR) for non-parametric data (denoted with *). Effect sizes are either Cohen’s d for parametric data or r2 for non-parametric data (denoted with $). CI, confidence interval; CRP, C-reactive protein; FABP-4, fatty acid-binding protein 4; GDF-15, growth differentiation factor-15; HbA1c, glycated haemoglobin 1c; HDL, high-density lipoprotein; HOMA-IR, homeostatic index of insulin resistance; LDL, low-density lipoprotein; MMP-8, matrix metalloproteinase-8.
Table 4. Temporal responses of fibroinflammatory and glycometabolic markers for the exercise group (n = 11).
Baseline—Week 4Week 4–Week 12
BaselineWeek 4Week 12Mean or Median Difference
(95% CI or IQR)
Effect Size (95% CI)Mean or Median Difference
(95% CI or IQR)
Effect Size (95% CI)
CRP, mg/L6.28 ± 0.216.27 ± 0.266.26 ± 0.20−0.01 (−0.17; 0.19)0.35 (−0.58; 0.65)−0.01 (−0.20; 0.22)0.37 (−0.58; 0.66)
FABP-4, mg/L4.84 ± 0.294.89 ± 0.354.80 ± 0.280.05 (−0.17; 0.05)0.36 (−0.99; 0.29)−0.09 (−0.03; 0.21)0.53 (−0.14; 1.19)
GDF-15, mg/L2.99 ± 0.262.93 ± 0.522.94 ± 0.30−0.05 (−0.20; 0.31)0.15 (−0.48; 0.77)0.01 (−0.31; 0.30)0.01 (−0.63; 0.61)
MMP-8, mg/L2.29 ± 0.382.31 ± 0.312.29 ± 0.280.02 (−0.19; 0.15)0.09 (−0.70; 0.53)−0.02 (−0.15; 0.19)0.08 (−0.54; 0.70)
Adiponectin * 103, mg/L3.12 (2.49; 7.29)2.73 (1.46; 6.95)3.07 (1.65; 7.62)−0.39 * (−0.68; 1.44)0.61 $ (−0.50; 1.25)0.34 * (−1.84; 0.32)0.40 $ (0.23; 0.90)
Leptin * 103, mg/L14.4 (6.60; 35.1)13.5 (6.31; 35.9)11.5 (4.04; 38.9)−1.05 * (−3.13; 2.57)0.07 $ (−0.65; 0.53)−1.99 * (−4.30; 3.62)0.06 $ (−0.63; 0.51)
Glycated HbA1c, %7.36 ± 1.247.16 ± 1.22)7.12 ± 1.26−0.20 (0.10; 0.40)0.72 (0.036; 1.37)−0.04 (−0.29; 0.37)0.07 (−0.52; 0.66)
HOMA-IR9.60 (6.27; 21.0)8.53 (6.53; 11.1)7.51 (5.70; 18.1)−1.07 * (−4.21; 3.63)0.50 $ (−0.64; 0.74)−1.01 * (−4.20; 3.60)0.30 $ (−0.65; 0.62)
Triglycerides, mmol/L2.09 ± 0.842.13 ± 0.862.16 ± 0.92−0.04 (−0.62; 0.54)0.05 (−0.64; 0.54)0.03 (−0.61; 0.55)0.03 (−0.62; 0.56)
Cholesterol, total, mmol/L4.78 ± 0.724.57 ± 0.884.68 ± 0.96−0.21 (−0.19; 0.61)0.35 (−0.27; 0.95)0.11 (−0.79; 0.57)0.11 (−0.69; 0.49)
HDL cholesterol, mmol/L1.22 ± 0.321.11 ± 0.261.09 ± 0.26−0.11 (0.04; 0.18)0.70 (0.29; 1.77)−0.02 (−0.04; 0.08)0.20 (−0.39; 0.80)
LDL cholesterol, mmol/L2.55 ± 0.752.44 ± 0.732.57 ± 0.95−0.12 (−0.19; 0.41)0.26 (−0.38; 0.89)0.13 (−0.68; 0.42)0.17 (−0.79; 0.46)
Values presented are mean ± SD or median (interquartile range). Change is presented either as mean (95% CI) for parametric data or median (IQR) for non-parametric data (denoted with *). Effect sizes are either Cohen’s d for parametric data or r2 for non-parametric data (denoted with $). CI, confidence interval; CRP, C-reactive protein; FABP-4, fatty acid-binding protein 4; GDF-15, growth differentiation factor-15; HbA1c, glycated haemoglobin 1c; HDL, high-density lipoprotein; HOMA-IR, homeostatic index of insulin resistance; LDL, low-density lipoprotein; MMP-8, matrix metalloproteinase-8.
Disclaimer/Publisher’s Note: The statements, opinions and data contained in all publications are solely those of the individual author(s) and contributor(s) and not of MDPI and/or the editor(s). MDPI and/or the editor(s) disclaim responsibility for any injury to people or property resulting from any ideas, methods, instructions or products referred to in the content.

