Article

Dual-Band Image Fusion Approach Using Regional Weight Analysis Combined with a Multi-Level Smoothing Filter

1
Graduate School, Changchun University of Science and Technology, Changchun 130022, China
2
Beijing Institute of Space Mechanics & Electricity, Beijing 100190, China
3
National and Local Joint Engineering Research Center of Space Optoelectronics Technology, Changchun University of Science and Technology, Changchun 130022, China
4
Fundammontal Science on Space-Ground Laser Communication Technology Laboratory, Changchun University of Science and Technology, Changchun 130022, China
5
Key Laboratory of Education Ministry Optoelectronics Measurement & Control and Optical Information Transfer Technology, Changchun University of Science and Technology, Changchun 130022, China
6
School of Physics, Changchun University of Science and Technology, Changchun 130022, China
*
Author to whom correspondence should be addressed.
Optics 2024, 5(1), 76-87; https://doi.org/10.3390/opt5010006
Submission received: 1 November 2023 / Revised: 26 January 2024 / Accepted: 1 February 2024 / Published: 21 February 2024
(This article belongs to the Section Engineering Optics)

Abstract

:
Image fusion is an effective and efficient way to express the feature information of an infrared image and abundant detailed information of a visible image in a single fused image. However, obtaining a fused result with good visual effect, while preserving and inheriting those characteristic details, seems a challenging problem. In this paper, by combining a multi-level smoothing filter and regional weight analysis, a dual-band image fusion approach is proposed. Firstly, a series of dual-band image layers with different details are obtained using smoothing results. With different parameters in a bilateral filter, different smoothed results are achieved at different levels. Secondly, regional weight maps are generated for each image layer, and then we fuse the dual-band image layers with their corresponding regional weight map. Finally, by imposing proper weights, those fused image layers are synthetized. Through comparison with seven excellent fusion methods, both subjective and objective evaluations for the experimental results indicate that the proposed approach can produce the best fused image, which has the best visual effect with good contrast, and those small details are preserved and highlighted, too. In particular, for the image pairs with a size of 640 × 480, the algorithm could provide a good visual effect result within 2.86 s, and the result has almost the best objective metrics.

1. Introduction

Infrared (IR) and visible (VI) image fusion aims to combine characteristic information of the two source images into one single fused image, which is supposed to inherit abundant object details of the VI image and preserve particular target information of the IR image [1,2]. However, how to fuse IR and VI images with good visual effect, preserving and inheriting those characteristic details, seems a challenging problem [3].
Over recent decades, researchers have made great efforts in improving dual-image fusion [4,5,6,7,8]. A set of image fusion methods based on multi-scale decomposition have been proposed, including the wavelet transform method and curvelet transform approach [4,5]. Pyramid-based algorithms are typical multi-resolution approaches, such as the Laplacian pyramid [6], contrast pyramid [7], and morphological pyramid [8]. However, those methods which use a multi-scale strategy usually need down sampling and up sampling, which will smooth details and introduce some artifacts. In addition, other excellent methods have been developed. IR and VI image fusion is achieved using visual saliency map calculation and weighted least square optimization (weighted least square: WLS) [9]. Different features of dual-band images are considered by fusing detail layers, and a visual saliency map is designed to merge the base layers. Naidu et al. makes use of multi-resolution singular value decomposition (singular value decomposition: SVD) to achieve image fusion [10]. A novel Bayesian fusion (Bayesian fusion: BF) model is used for image fusion [11], and it is cast into a regression problem by formulating the problem in a hierarchical Bayesian manner with a TV penalty. Bai et al. utilize region extraction based on multi-scale center-surround top-hat transform (center-surround top-hat transform: CSTH) [12] to design an excellent IR and VI image fusion method. Liu et al. propose a general image fusion framework which considers multi-scale transform and sparse representation (multi-scale transform: MST) [13]. Kong et al. use image processing methods and face detection in visible images to determine the position of the face in the infrared image, and then use target detection algorithms on infrared images which make good use of dual-band images [14]. Many researchers have studied learning-based methods. For example, Ma et al. present a new IR/VI fusion method based on an end-to-end model named FusionGAN; they use generative adversarial networks for dual-band image fusion (FusionGAN: FG), which can keep both the thermal radiation and the texture details from the source images [15]. Li et al. mention an IR and VI image fusion approach with ResNet and zero-phase component analysis [16]; this design can produce a fused result with good contrast. In this work, ResNet50 is utilized to extract deep features from two source images. These learning-based methods create good results according to their experiments [17], but the results usually are determined by the training image data. Moreover, saliency or weight map extraction is useful in dual-band image fusion; for example, researchers consider saliency preserving in some image fusion applications [18]. Particularly, Zhao et al. propose several visual saliency or visual attention analysis models for image enhancement [19,20] and dual-band image fusion [21,22]; the visual saliency can help well highlight the details. In particular, they have developed a multi-scale-based visual saliency extraction method (multi-scale-based saliency extraction: MBSE) recently [23], and this method could produce a result with good visual effect and abundant detailed information.
Each dual-band fusion method has its application limitations, as it may produce an unsatisfactory result with negative artifacts, such as poor local contrast, image details, characteristic loss, noise amplification, and image quality degradation of the whole fused image. Aiming at those disadvantages, a dual-band image fusion approach using regional weight analysis combined with a multi-level smoothing filter is proposed. The main work and contribution are described as follows.
Firstly, a bilateral filter-based multi-scale decomposition could help extract image details even from potential targets under different levels.
Secondly, a regional weight map is designed to represent attention importance for different regions and pixels of an image. This map can help the fused result to inherit enough information from the original dual-band images.
Thirdly, weight factors are introduced to resynthesize these fused image layers. The weight factors can adjust the relative weight between different image layers to relatively enhanced image details.

2. Basic Theory

2.1. Bilateral Filter for Multi-Level Smoothing

Our multi-scale decomposition is based on a bilateral filter, which is a typical image smooth filter. With varying parameters, an image smooth filter can generate results under different smoothness levels. Then, we can extract details between those smoothing results, just like multi-scale decomposition. Those multi-scale decomposition methods, such as wavelet transform and Laplacian pyramid, are widely used for image fusion. Multi-scale decomposition is achieved via filters and similar operations, which usually involve up sampling and down sampling, leading to some negative artifacts, detail loss, and sometimes higher time consumption. Thus, we intend to introduce a bilateral filter to construct multi-level smoothing to form similar multi-scale decomposition without up sampling and down sampling.
Considering edge detail preservation [24], we finally introduce a bilateral filter as our smooth tool. The filter runs within a local area. On one hand, the result is constrained by the relative distance between the center pixel and its neighbor pixels, whilst on the other hand, it is also determined by the gray difference or pixel distance between them. Then, this filter generally smooths the image while preserving edge details by using a non-linear combination of nearby sampling values [24].
If the original image is I, and the smoothed result from the bilateral filter is g, for an arbitrary pixel p, g can be obtained using the following equation:
g p = q Ω G σ s p q G σ r I p I q I p q Ω G σ s p q G σ r I p I q
where Ω denotes a window or a region, whose center usually is pixel p, q is an arbitrary pixel in Ω , and I p represents the pixel value at p in image I. Ω could be as large as the whole image. G σ x represents a Gaussian function with parameters x and σ . In this formula, G σ s p q means the closeness function which measures geometric distance, and p q represents the spatial distance between pixel p and q. Meanwhile, G σ r I p I q denotes the photometric similarity function, and I p I q is the pixel value distance between Ip and Iq, which means the absolute value of I p I q .
Learning from Ref. [24], based on the image size comparison, we allow the size of window Ω to be 9 × 9.
From Equation (1), we can conclude that the smoothed result is mainly determined by the two deviations σ s and σ r , where the two deviations are just the parameters for Gaussian function in Equation (1). Then, we can rewrite Equation (1) as follows, which could be defined as the function of input I, σ s , and σ r :
g p = B F I , σ s , σ r
where B F is short for the bilateral filter.
We need to analyze how these two parameters affect image smoothness. Thus, we try two directions. On one hand, when σ r is fixed, we can obtain a smoothed result with a changing value of σ s . As shown in Figure 1, if we fix σ r = 0.03, (a)–(d) are the original image, the result with σ s = 5, the result with σ s = 11, and the result with σ s = 17, respectively. Images (b)–(d) are so similar, and only the information with high frequency (like ground area) is smoothed. Therefore, the parameter σ s has little influence on smoothness. On the other hand, when σ s is fixed, we can obtain smoothed results with a changing value of σ r . As shown in Figure 2, if we fix σ s = 11, (a)–(d) are the original image, the result with σ r = 0.03, the result with σ r = 0.13, and the result with σ r = 0.23, respectively. Learning from images (b)–(d), the larger σ r can make the result smoother. Meanwhile, the larger σ r is, the less the frequency information is smoothed. Therefore, the parameter σ r has a decisive influence on smoothness.
According to our analysis, we can achieve different smoothing results at different levels with varying σ r . Then, we can extract details between those smoothing results, just like multi-scale decomposition. Typically, σ r is within the range [0, 0.3].

2.2. Regional Weight Analysis

The human visual system (HVS) is highly adapted for detecting and extracting structural information from a scene or an image [25]. We consider the HVS to be sensitive to structure information, which is associated with the local contrast of the image. Thus, we assume those regions with relatively larger intensity and color differences would attract more attention from the HVS. We intend to generate a regional weight map (RWmap) to represent attention importance for different regions of an image, and this regional weight map is designed based on the gray value difference for the gray image. RWmap has the same size as the original image.
We assume a regional weight map (RWmap) for arbitrary pixel p in a gray image I follows the subsequent equation:
R W map p = q Ω γ d p , q
where Ω means the neighborhood of pixel p in the image I, and q is an arbitrary pixel within Ω . Ω could be a local area around p; it also could cover the whole image. γ d p , q measures the gray value difference between p and q:
γ d p , q = I p I q α
where α is a constant which can scale the difference. I(p) denotes the gray value of pixel p in the image I. Usually, a larger α produces a larger γ d p , q . When α = 1, the spatial contribution of q imposing on γ d p , q remains the same no matter whether q is next to p or far away. So, one can change the value of α to design the spatial contribution of q. Usually, α = 1 is enough.
When α = 1 and Ω covers the whole image, the regional weight value of the arbitrary pixel p can be calculated pixel by pixel as follows:
R W map p = I p I q 1 + I p I q 2 + + I p I q M N
where M and N are the height and width of image I, respectively. MN means the sum of all pixels, so qi (i = 1, 2 , , MN) has covered all pixels in the image I.
From Equation (5), we find that the same gray value in the image will achieve the same value in the regional weight map. That is to say, for an arbitrary pixel p in the image I, the gray value is I p , and we can obtain a regional weight at the corresponding position p in the regional weight map as R W map p . Then, for all pixels with the same gray value in I, they have the same regional weight value as R W map p at the corresponding position in the regional weight map. Thus, this gray value analysis will greatly reduce the amount of computation.
Finally, after analyzing every pixel p in I, we obtain a regional weight map R W map corresponding to the original image I.
According to Equation (5), we can obtain the R W map for the original image I. The R W map should be normalized to guarantee R W map [0, 1], which reflects how much attention that the HVS pays to image I. In Figure 3, we have shown two examples of regional weight maps. Figure 3a,c denote original images, and (b) and (d) are the R W map corresponding to (a) and (c), respectively. From these two examples, we can find that our regional weight analysis can give a full-resolution image matrix corresponding to the original image, and large value areas mirror those regions that attract more attention from the HVS.

3. Image Fusion Approach

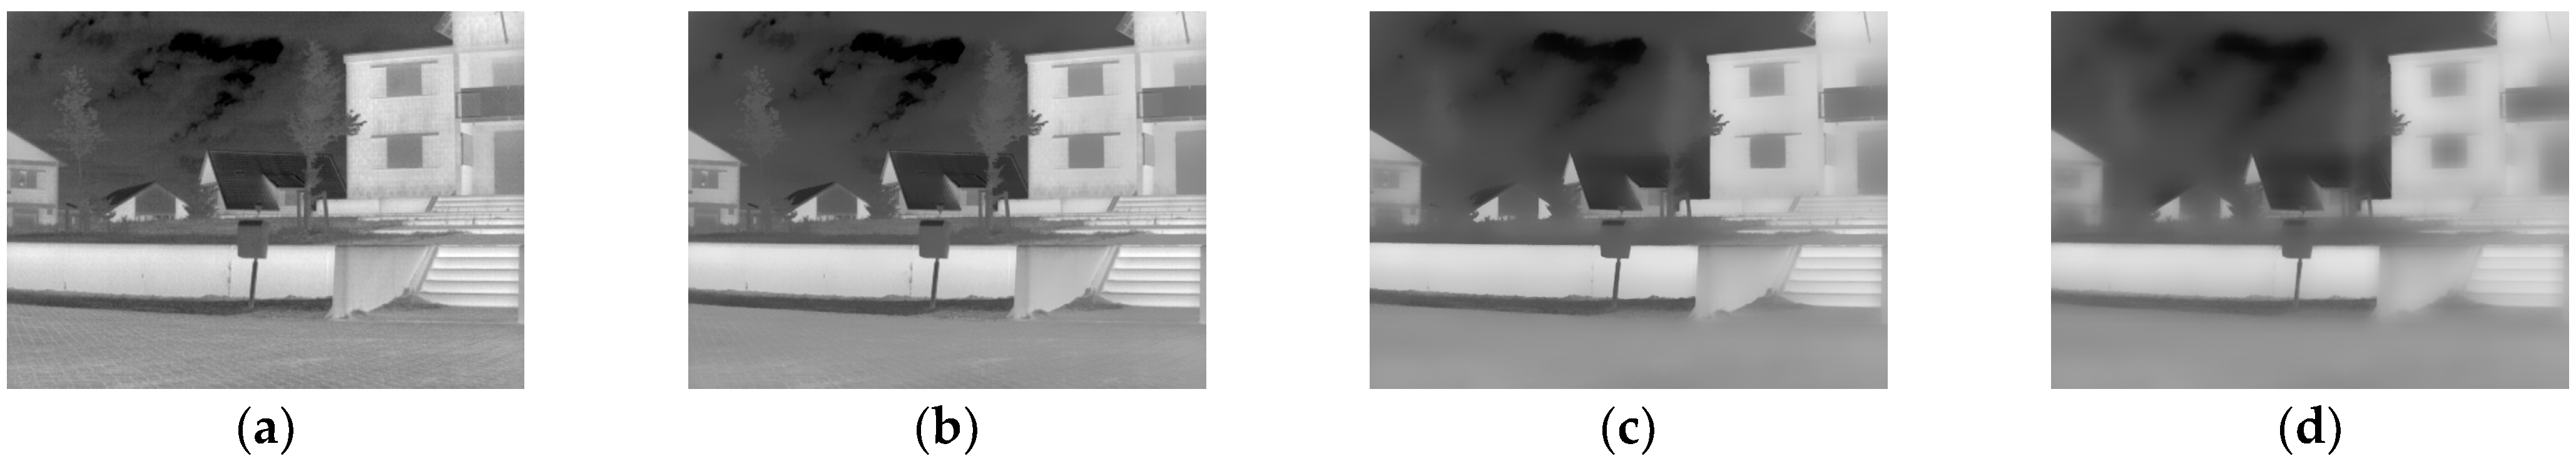
3.1. Multi-Level Smoothing

Learning from Section 2.1, we can achieve different smoothing results at different levels by varying parameters in the bilateral filter and extracting details between those smoothing results. Therefore, we intend to construct multi-level smoothing to achieve this target. Then, we can obtain different detailed preserved images under different smoothing levels.
Assuming the input image I, the smoothing result S k at the kth level can be obtained using Equation (6):
S k = B F I , σ s k , σ r k
where k = 1 , 2 , 3 , , M , and S k can be changed with varied parameters σ s k and σ r k . If we let σ s k < σ s k + 1 and σ r k < σ r k + 1 , the result S k + 1 will be smoother than S k . If the smoothed images S k of order M have been obtained, the original image I can be expressed by the following:
I = I S 1 + S 1 S 2 + + S M 1 S M + S M
where I can be treated as S 0 , so Equation (7) can be written as follows:
I = k = 1 M S k 1 S k + S M
Here, we can consider S k 1 S k as the extracted details between those smoothing results; then, the original image I is composed of a base layer and M detail layers. A base image layer is S M , which is defined as follows:
S ( M ) = B F I , σ s M , σ r M
S ( M ) is the most smoothed result. In Equation (9), M detail image layers are determined by the following:
D k = S k 1 S k
where Equation (10) can be solved using the corresponding σ s k and σ r k , and k = 1 , 2 , 3 , , M .
Finally, the original image I is designed to form (n + 1) levels, including a base image layer and M detail image layers. The multi-level smoothing and detail extraction are conducted without any down sampling or up sampling, so non-band-limited detail layers can be produced. We can impose our fusion operation on a base layer and detail layers to achieve different detail preserved fusion and enhancement. Meanwhile, we can emphasize different details after image synthesis, which is a contrary process of this section, and it will be discussed in Section 3.3.

3.2. Image Fusion Based on Image Layers

After the base layer and detail layers based on multi-level smoothing have been handled, image fusion is attempted in those layers between the two source images. For each layer, the regional weight analysis as described in Section 2.2 is introduced to achieve detailed enhanced fusion results.
Supposing the IR image is X and the VI image is Y, our fusion is achieved under different layers based on Section 3.1. Here, we consider M + 1 layers, too. According to Equation (9), the base layer of X and Y are S X ( M ) and S Y ( M ) , respectively. Their regional weight maps are R W map S X ( M ) and R W map S Y ( M ) . Then, the fused result F S ( M ) is defined as follows:
F S ( M ) = 1 2 S X ( M ) R W map S X ( M ) + S Y ( M ) 1 R W map S X ( M ) + 1 2 S X ( M ) 1 R W map S Y ( M ) + S Y ( M ) R W map S Y ( M )
Meanwhile, according to Equation (11), for an arbitrary level k, detail image layers for two source images are D X k and D Y k , whose regional weight maps are R W map D X k and RW map D Y k . In a similar way, the fused equation is defined as follows:
F D k = 1 2 D X k R W map D X k + D Y k 1 R W map D X k + 1 2 D X k 1 R W map D Y k + D Y k R W map D Y k
Based on different layers and regional weight analysis, the fusion can be operated under different detail levels. Both one base layer fusion and M detail layer fusion will effectively fuse detail features.

3.3. Image Layer Resynthesis

Based on layer extraction (Equations (9) and (10)) and image layer-based image fusion (Equations (11) and (12)), we have obtained M + 1 fused layers. In this section, we try to resynthesize these layers to form a fused image.
Equation (8) is used for layer extraction; now, similar to Equation (8), we try to resynthesize the image layers based on Equations (11) and (12) to obtain a final fused result F :
F = k = 1 M λ k F D k + λ 0 F S ( M )
Different from Equation (8), we introduce weight parameters λ k (k = 0, 1… M) in Equation (13). This weight factor could help adjust the relative contribution of different fusion layers to the final fused result, and this could help enhance those details from different layers.
In a real application, usually, M < 5, as a small M is sufficient to extract and distinguish detailed information. If λ k is relatively large, more information would be inherited from the corresponding layer F D k (when k = 1, 2… M) or F S ( M ) (when k = 0). Therefore, proper factors λ k (k = 0, 1… M) are important for detail preservation and enhancement. To control the energy of the final result, λ k 0 , 1 .

3.4. Implementation

As shown in Figure 4, we have described the flowchart of the implementation of the proposed method. Firstly, the IR image and the VI image are processed into image layers (Section 3.1). Secondly, image fusion is achieved using regional weight extraction based on image layers (Section 3.2). Finally, we try to resynthesize these fused layers to form a fused image (Section 3.3).
To carefully show how the algorithm functions, we have given the program codes for our image fusion approach, as described in Algorithm 1 as follows, with which one can easily understand the method.
Algorithm 1 Image fusion approach algorithm
Require:  X , Y , k , σ s k , σ r k , λ 0 , λ k .
1: Get initial infrared image data X and visible image data Y .
2: Init: Initial σ s k , σ r k , λ 0 , k = 1 .
3: Get the base image layers S X M and S Y M of X and Y by Equation (9).
4: While k < = M do:
 a.
Get the smoothing images S X k and S Y k corresponding to X and Y by Equation (6).
 b.
Get detail image layers D X k and D Y k corresponding to X and Y by Equation (10).
 c.
The R W map S X ( M ) and R W map D X ( k ) of X are obtained by Equation (5).
 d.
The R W map S Y ( M ) and R W map D Y ( k ) of Y are obtained by Equation (5).
 e.
Get the fused result F S ( M ) by Equation (11).
 f.
Get the detail image layers fused result F D ( k ) by Equation (12).
 g.
Sum the fusion results of weighted detail image layer F D = λ k F D k

5: End while
6: The final fusion result F is obtained by fusing F S ( M ) and F D by Equation (13).

4. Experimental Results and Discussion

In our experiment, we have introduced seven excellent fusion methods for comparison, including classical model-based methods and recent deep learning-based works. These seven approaches are weighted least square optimization (WLS) [9], an image fusion technique using multi-resolution singular value decomposition (SVD) [10], Bayesian fusion for infrared and visible images (BF) [11], multi-scale center-surround top-hat transform (CSTH) [12], a generative adversarial network for infrared and visible image fusion (FG) [26], multi-scale transform (MST) [13], and the multi-scale visual saliency extraction method (MBSE) [23].
The image pairs that we tested for our experiments were downloaded from the website, https://doi.org/10.6084/m9.figshare.c.3860689.v1 (accessed on 26 January 2024), they can also be found in Ref. [27]. These two pairs of source images are shown in Figure 5. (a) and (b) are VI and IR images (434 × 340), mainly including road, cars, and people. (c) and (d) are VI and IR images (640 × 480), mainly including trees, buildings, and a person.
In our experiment, we performed tests on a personal computer using AMD Ryzen 5 3400G (Advanced Micro Devices, Inc., Santa Clara City, CA, USA) with Radeon Vega Graphics 3.7 GHz, and the software used is MATLAB 2014b (MathWorks, Natick city, MA, USA).

4.1. Experimental Setting

In Section 3.1, the level M can determine how much we can separate detail levels. According to our experience, M = 3 is sufficient. Two deviations σ s and σ r are important for our smoothness. Learning from Figure 1 and Figure 2, we have concluded that the parameter σ r has a decisive influence on smoothness. Thus, we keep σ s = 11 and set σ r k = {0.05, 0.11, 0.2} when k = 1, 2, 3. In addition, as we analyzed for Figure 1, if we select σ s = 5, σ s = 11, or σ s = 17, the results are similar. Therefore, σ s = 11 is our experimental selection.
In Section 3.3, synthetic weight parameters λ k (k = 0, 1,…, M = 3) are selected as λ k = {0.3, 0.8, 0.6, 0.1} when k = 0, 1, 2, 3.
Since those parameters are selected from experience, they usually are fixed for our fusion. But one can slightly adjust them if the user needs a special output. Therefore, in our experiment, we simply input the original images, then the method can output a good result.

4.2. Objective Evaluation Methods

Whether the fused image is good or not, we need both a subjective assessment and objective assessment. Our HVS can rapidly provide subjective scores when observing an image, but the HVS seems inefficient when facing lots of images. Here, we need to consider objective measurement for image fusion.
In this section, X and Y denote two source images, respectively. F represents the fused result.
Entropy (En) is usually used for evaluating how much information the image contains [28]. Here, we consider En to evaluate fusion performance:
E n = i = 0 L 1 p F i log 2 P F i
where PF(i) represents the probability for the pixel value i in image F, and L is the gray level (L = 255 when the image has a bit depth = 8). For the entropy metric, a larger value means a better fused result.
Joint entropy (JE) can mirror how much information the fused result has inherited from the source images [29]. The joint entropy can be defined as follows:
J E F X Y = i = 0 L 1 j = 0 L 1 k = 0 L 1 p F X Y i , j , k log 2 p F X Y i , j , k
where L is the gray level (L = 255 when the image has a bit depth = 8), and PFXY(i, j, k) is a joint probability that pixel values in images X, Y, and F are i, j, and k, respectively. We need a larger JE to show a better fusion performance.
Spatial frequency (SF) is usually considered for measuring image sharpness. SF reflects the overall activity degree of the image in the spatial domain. SF is defined by the gradient energy between horizontal and vertical directions:
S F = i = 1 W 1 j = 1 H 1 F x + 1 , y F x , y / W H 2 + i = 1 W 1 j = 1 H 1 F x , y + 1 F x , y / W H 2
where W denotes the width of the image F, and H represents the height of F. The larger the SF value is, the better the fused result is.

4.3. Performance Comparison

The fusion results for Figure 5a,b are shown in Figure 6. The two images contain unique information, especially the road, cars, and people. Figure 6a–h are the fused images with different methods. In these two source images, the special information includes pedestrians and cars on the road, the signs on the shops, and some streetlamp details. In image (a), the result of the WLS method looks good, but it loses some details. The results of images (b), (c), and (d) have low contrast, and those details are not clear enough. The results of (e), (f), and (g) look better than (b), (c), and (d), they have a good visual effect, and the main features are well preserved and highlighted. According to (h), our algorithm inherits much information with good image contrast. Meanwhile, compared with (e), (f), and (g), the result of the proposed method emphasizes those small features much better.
Figure 6 is tested using objective evaluations including En, JE, and SF. The results are listed in Table 1. According to the objective assessment, the proposed method has the largest En, JE, and SF values, indicating that our fused result performs best.
Figure 7 shows the fused results for Figure 5c,d using the eight approaches. The main information in these two images is trees, buildings, and a person, especially the running person. In the VI image, this person can be hardly seen, while in the IR image, they can be well observed; whether the person could be found in the fused result would greatly affect the subjective evaluation. From images (a), (b), (c), and (e), we cannot easily find this person, so WLS, BF, SVD, and MST fail to inherit and preserve this important detail feature. The result of FG for the image (d) seems to be low contrast, and the details on the grass are completely lost. In image (g), the MBSE creates a good result, but the details on the grass are completely lost. CSTH produces a better result, as the main features are well preserved and highlighted. According to (h), our algorithm has the best visual effect with good contrast, and those small details are preserved and highlighted, too.
The objective evaluation results for Figure 7 are shown in Table 2. Learning from quantitative comparison, the proposed method has the largest En and SF values, and the second largest JE value, indicating that our fused result performs best.

4.4. Computational Efficiency Discussion

Computational efficiency is one of the most important factors in algorithm measurement. In this section, we will discuss how fast the methods run. The size of Figure 6 is 434 × 340, and Figure 7 is 640 × 480. The processing time of these eight approaches for Figure 6 and Figure 7 are listed in Table 3. According to the data, we find that MST and SVD run the fastest because their design seems more efficient. CSTH is the slowest algorithm as the multi-scale center-surround top-hat transform takes a long time. Our algorithm lies in the middle of those methods, and we need to accelerate it in the future. The multi-level smoothing affects the efficiency. In the future, we need to try to reduce the levels of smoothness based on parameter optimization. Meanwhile, code optimization could also help speed up the processing time.

5. Conclusions

The fusion of IR and VI images with good visual effect, while preserving and inheriting those characteristic details, is challenging work. In this paper, we propose a dual-band image fusion approach using regional weight analysis combined with a multi-level smoothing filter. According to the experiment and discussion, the proposed method has powerful performance, preserving and even enhancing image details, resulting in the fused image having a good visual effect. Actually, by using a smoothing filter, we can extract different details to form a series of dual-band image layers. Then, we can obtain a regional weight map for different image layers and use them for our dual-band fusion to express and highlight those potential target regions and pixels. Finally, those fused image layers are synthetized utilizing proper weights, which can be artificially adjusted to emphasize different details in different image layers.
Because of our design, the fused image usually has a good visual effect, well preserving and inheriting characteristic details which the HVS pays attention to. This kind of fusion strategy can be quite suitable and well applied in target detection and recognition, multiple source image application, and other relative fields.
The limitation of our approach lies in the computational efficiency and parameter selection. In the future, computational efficiency should be a key point, and we will focus on algorithm acceleration and algorithm structure optimization. Since some computation is conducted separately for dual-band images, we will consider parallel computing to accelerate the algorithm. For parameter selection, we will learn how to set them adaptively and automatically.
This approach is difficult to apply in RGB imagery. RGB images contain three channels. We can perform image fusion on the three channels, respectively. We can obtain the final result by combining the fused images of three channels. There will be distortion in the color of final result because of the changes in all three channels.
In future, we will make an effort to integrate our algorithm into our own equipment.

Author Contributions

Conceptualization, J.Y.; Software, J.Y., X.W. and Y.T.; Validation, H.J.; Formal analysis, X.W.; Investigation, J.Y.; Resources, X.W.; Data curation, J.Y. and Y.T.; Writing–original draft, H.J. and X.W.; Writing–review & editing, X.W.; Visualization, H.J. All authors have read and agreed to the published version of the manuscript.

Funding

This paper is supported by the Natural Science Foundation of Jilin Province under No. YDZJ202201ZYTS510.

Institutional Review Board Statement

Not applicable.

Informed Consent Statement

Not applicable.

Data Availability Statement

Data are contained within the article.

Conflicts of Interest

The authors declare no conflict of interest.

References

  1. Dogra, A.; Goyal, B.; Agrawal, S. From multi-scale decomposition to non-multi-scale decompositionok methods: A comprehensive survey of image fusion techniques and its applications. IEEE Access 2017, 5, 16040–16067. [Google Scholar] [CrossRef]
  2. Zhang, X.; Ma, Y.; Fan, F.; Zhang, Y.; Huang, J. Infrared and visible image fusion via saliency analysis and local edge-preserving multi-scale decomposition. JOSA A 2017, 34, 1400–1410. [Google Scholar] [CrossRef] [PubMed]
  3. Pan, Q.; Zhao, L.; Chen, S.; Li, X. Fusion of Low-Quality Visible and Infrared Images Based on Multi-Level Latent Low-Rank Representation Joint with Retinex Enhancement and Multi-Visual Weight Information. IEEE Access 2021, 10, 2140–2153. [Google Scholar] [CrossRef]
  4. Nencini, F.; Garzelli, A.; Baronti, S.; Alparone, L. Remote sensing image fusion using the curvelet transform. Inf. Fusion 2007, 8, 143–156. [Google Scholar] [CrossRef]
  5. Pajares, G.; de la Cruz, J.M. A wavelet-based image fusion tutorial. Pattern Recognit. 2004, 37, 1855–1872. [Google Scholar] [CrossRef]
  6. Burt, P.J.; Adelson, E.H. The Laplacian pyramid as a compact image code. IEEE Trans. Commun. 1983, 31, 532–540. [Google Scholar] [CrossRef]
  7. Toet, A.; van Ruyven, L.J.; Valeton, J.M. Merging thermal and visual images by a contrast pyramid. Opt. Eng. 1989, 28, 789–792. [Google Scholar] [CrossRef]
  8. Matsopoulos, G.; Marshall, S. Application of morphological pyramids: Fusion of MR and CT phantoms. J. Vis. Commun. Image Represent. 1995, 6, 196–207. [Google Scholar] [CrossRef]
  9. Ma, J.; Zhou, Z.; Wang, B.; Zong, H. Infrared and visible image fusion based on visual saliency map and weighted least square optimization. Infrared Phys. Technol. 2017, 82, 8–17. [Google Scholar] [CrossRef]
  10. Naidu, V. Image fusion technique using multi-resolution singular value decomposition. Def. Sci. J. 2011, 61, 479. [Google Scholar] [CrossRef]
  11. Zhao, Z.; Xu, S.; Zhang, C.; Liu, J.; Zhang, J. Bayesian fusion for infrared and visible images. Signal Process. 2020, 177, 107734. [Google Scholar] [CrossRef]
  12. Bai, X.; Zhou, F.; Xue, B. Fusion of infrared and visual images through region extraction by using multi scale center-surround top-hat transform. Opt. Express 2011, 19, 8444–8457. [Google Scholar] [CrossRef]
  13. Liu, Y.; Liu, S.; Wang, Z. A general framework for image fusion based on multi-scale transform and sparse representation. Inf. Fusion 2015, 24, 147–164. [Google Scholar] [CrossRef]
  14. Kong, S.G.; Heo, J.; Boughorbel, F.; Zheng, Y.; Abidi, B.R.; Koschan, A.; Yi, M.; Abidi, M.A. Multiscale Fusion of Visible and Thermal IR Images for Illumination-Invariant Face Recognition. Int. J. Comput. Vis. 2007, 71, 215–233. [Google Scholar] [CrossRef]
  15. Ma, J.; Yu, W.; Liang, P.; Li, C.; Jiang, J. FusionGAN: A generative adversarial network for infrared and visible image fusion. Inf. Fusion 2019, 48, 11–26. [Google Scholar] [CrossRef]
  16. Li, H.; Wu, X.-J.; Durrani, T.S. Infrared and visible image fusion with ResNet and zero-phase component analysis. Infrared Phys. Technol. 2019, 102, 103039. [Google Scholar] [CrossRef]
  17. Xu, H.; Ma, J.; Jiang, J.; Guo, X.; Ling, H. U2Fusion: A unified unsupervised image fusion network. IEEE Trans. Pattern Anal. Mach. Intell. 2020, 44, 502–518. [Google Scholar] [CrossRef]
  18. Hong, R.; Wang, C.; Wang, M.; Sun, F. Salience preserving multifocus image fusion with dynamic range compression. Int. J. Innov. Comput. Inf. Control. 2009, 5, 2369–2380. [Google Scholar]
  19. Zhao, J.; Chen, Y.; Feng, H.; Xu, Z.; Li, Q. Infrared image enhancement through saliency feature analysis based on multi-scale decomposition. Infrared Phys. Technol. 2014, 62, 86–93. [Google Scholar] [CrossRef]
  20. Zhao, J.; Chen, Y.; Feng, H.; Xu, Z.; Li, Q. Fast image enhancement using multi-scale saliency extraction in infrared imagery. Opt.-Int. J. Light Electron Opt. 2014, 125, 4039–4042. [Google Scholar] [CrossRef]
  21. Zhao, J.; Zhou, Q.; Chen, Y.; Feng, H.; Xu, Z.; Li, Q. Fusion of visible and infrared images using saliency analysis and detail preserving based image decomposition. Infrared Phys. Technol. 2013, 56, 93–99. [Google Scholar] [CrossRef]
  22. Zhao, J.; Feng, H.; Xu, Z.; Li, Q.; Liu, T. Detail enhanced multi-source fusion using visual weight map extraction based on multi scale edge preserving decomposition. Opt. Commun. 2013, 287, 45–52. [Google Scholar] [CrossRef]
  23. Wu, X.; Zhao, J.; Mao, H.; Cui, G. Infrared and visible-image fusion using multiscale visual saliency extraction based on spatial weight matrix. J. Electron. Imaging 2021, 30, 23029. [Google Scholar] [CrossRef]
  24. Xie, J.; Heng, P.; Shah, M. Image diffusion using saliency bilateral filter. IEEE Trans. Inf. Technol. Biomed. 2008, 12, 768–771. [Google Scholar]
  25. Wang, Z.; Bovik, A.C.; Sheikh, H.R.; Simoncelli, E.P. Image quality assessment: From error visibility to structural similarity. IEEE Trans. Image Process. 2004, 13, 600–612. [Google Scholar] [CrossRef] [PubMed]
  26. Hou, J.; Zhang, D.; Wu, W.; Ma, J.; Zhou, H. A generative adversarial network for infrared and visible image fusion based on semantic segmentation. Entropy 2021, 23, 376. [Google Scholar] [CrossRef] [PubMed]
  27. Toet, A. The TNO multiband image data collection. Data Brief. 2017, 15, 249. [Google Scholar] [CrossRef]
  28. Roberts, J.W.; Van Aardt, J.; Ahmed, F. Assessment of image fusion procedures using entropy, image quality, and multispectral classification. J. Appl. Remote Sens. 2008, 2, 23522. [Google Scholar]
  29. Qu, G.; Zhang, D.; Yan, P. Information measure for performance of image fusion. Electron. Lett. 2002, 38, 313–315. [Google Scholar] [CrossRef]
Figure 1. Smoothed result g p with different σ s and fixed σ r = 0.03. (a) Original image, (b) result with σ s = 5, (c) result with σ s = 11, and (d) result with σ s = 17.
Optics 05 00006 g001
Figure 2. Smoothed result with different σ r and fixed σ s = 11. (a) Original image, (b) result with σ r = 0.03, (c) result with σ r = 0.13, and (d) result with σ r = 0.23.
Optics 05 00006 g002
Figure 3. Examples of regional weight map R W map . (a) Original image 1, (b) R W map of (a), (c) original image 2, and (d) R W map of (c).
Optics 05 00006 g003
Figure 4. Flowchart of the proposed approach.
Optics 05 00006 g004
Figure 5. Source images: (a,b) are VI and IR images (434 × 340), mainly including road, cars, and people. (c,d) are VI and IR images (640 × 480), mainly including trees, buildings, and a person.
Optics 05 00006 g005
Figure 6. Fused results for Figure 5a,b: (ah) are the results based on the eight methods, respectively. (a) WLS, (b) BF, (c) SVD (d) FG, (e) MST, (f) CSTH, (g) MBSE, and (h) ours.
Optics 05 00006 g006
Figure 7. Fused results for Figure 5c,d: (ah) are the results based on the eight methods, respectively. (a) WLS, (b) BF, (c) SVD (d) FG, (e) MST, (f) CSTH, (g) MBSE, and (h) ours.
Optics 05 00006 g007
Table 1. Quantitative comparison using En, JE, and SF for Figure 6.
MethodsEnJESF
WLS6.236.5313.77
BF5.546.309.54
SVD5.886.4110.49
FG6.006.457.76
MST6.926.7514.92
CSTH6.606.6515.30
MBSE6.256.5313.84
Ours7.086.8121.54
Table 2. Quantitative comparison using E, JE, and SF for Figure 7.
MethodsEnJESF
WLS6.717.1915.60
BF6.457.1013.83
SVD6.207.0212.01
FG6.327.0612.22
MST7.127.3218.54
CSTH7.357.5026.04
MBSE6.837.2320.87
Ours7.417.3630.51
Table 3. Comparison of processing time for experimental images (unit: second).
Image/AlgorithmsSizeWLSBFSVDFGMSTCSTHMBSEOurs
Figure 6434 × 3402.170.840.564.340.212.870.381.47
Figure 7640 × 4803.211.130.976.210.434.120.532.86
Disclaimer/Publisher’s Note: The statements, opinions and data contained in all publications are solely those of the individual author(s) and contributor(s) and not of MDPI and/or the editor(s). MDPI and/or the editor(s) disclaim responsibility for any injury to people or property resulting from any ideas, methods, instructions or products referred to in the content.

