
Dual-Pump Vibrational Coherent Anti-Stokes Raman Scattering System Developed for Simultaneous Temperature and Relative Nitrogen–Water Vapor Concentration Measurements


Abstract
:1. Introduction
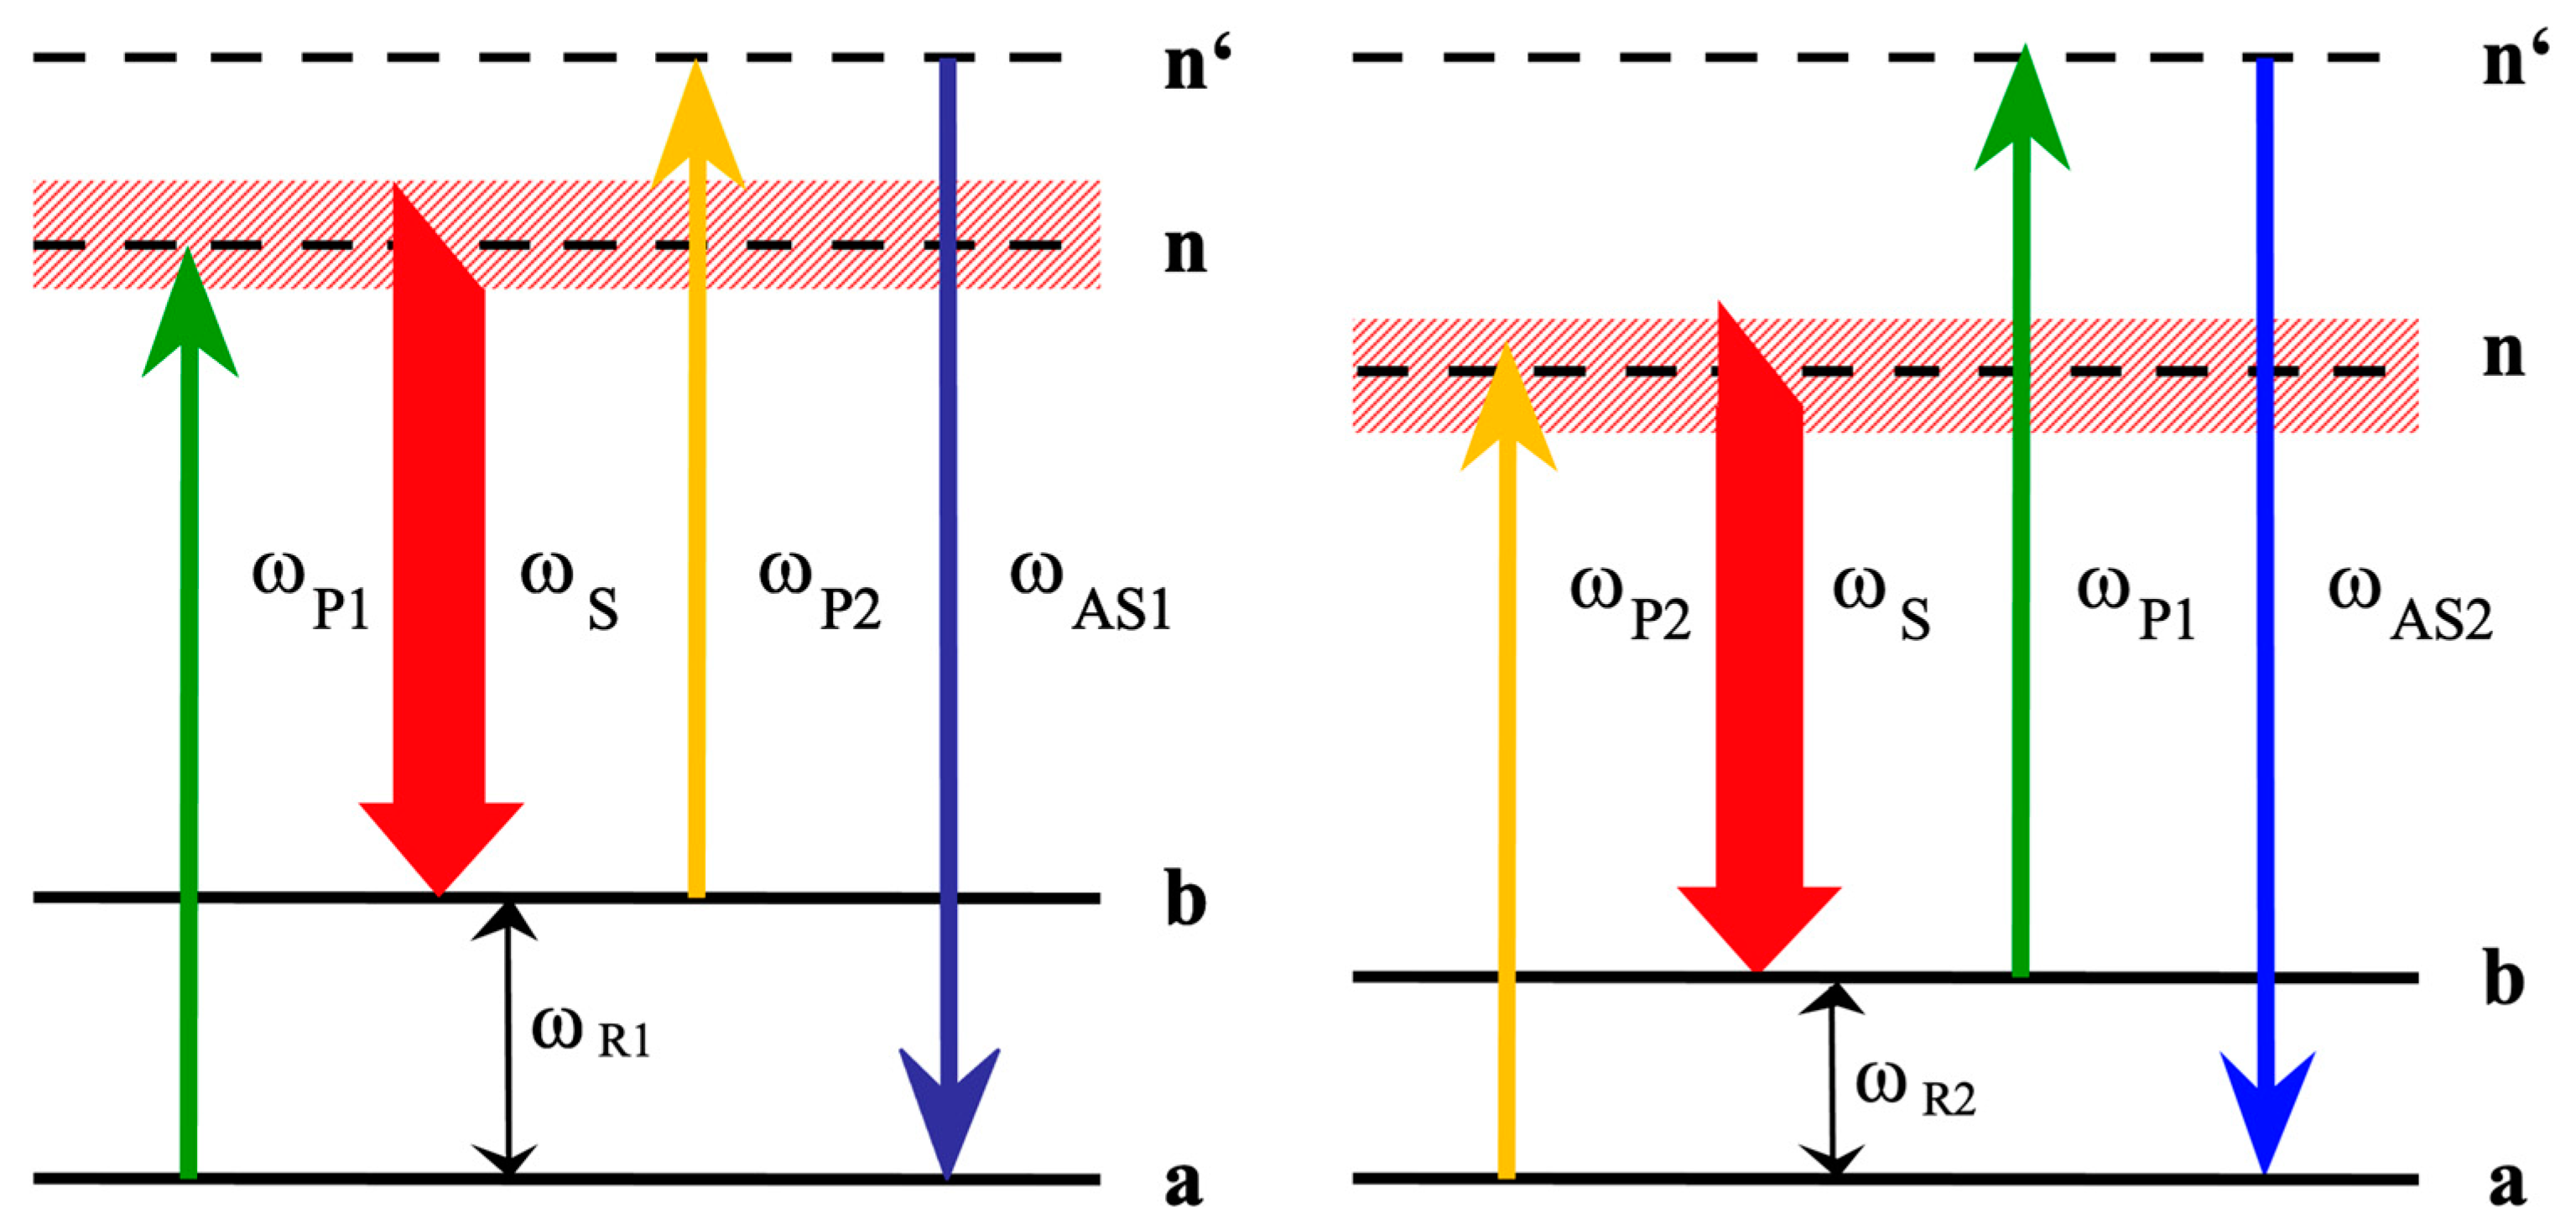
2. DPVCARS Process
3. Experimental
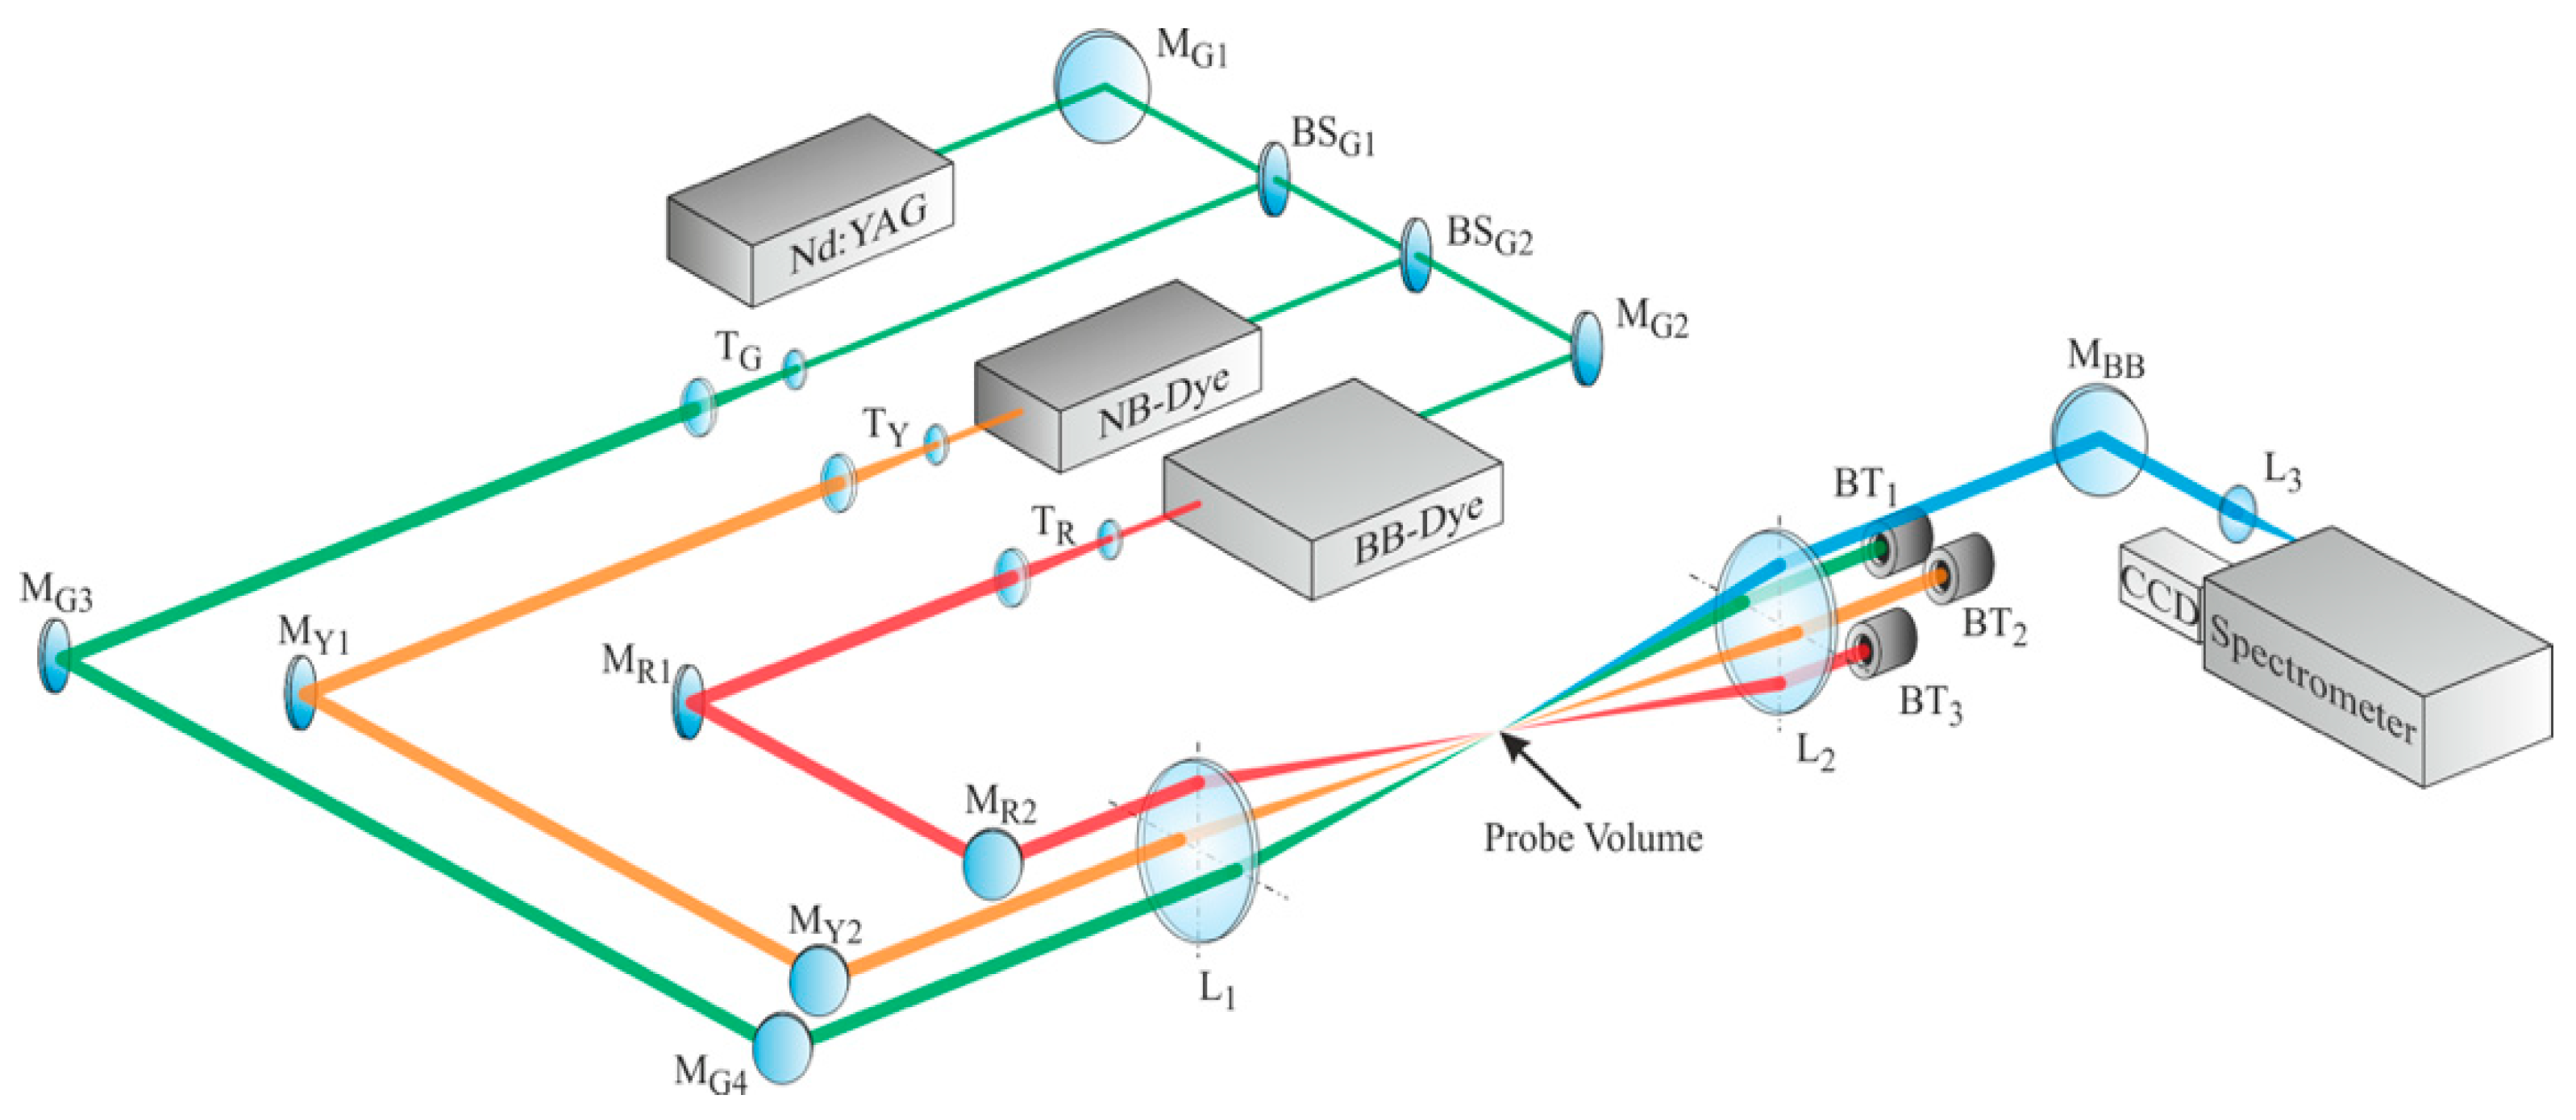
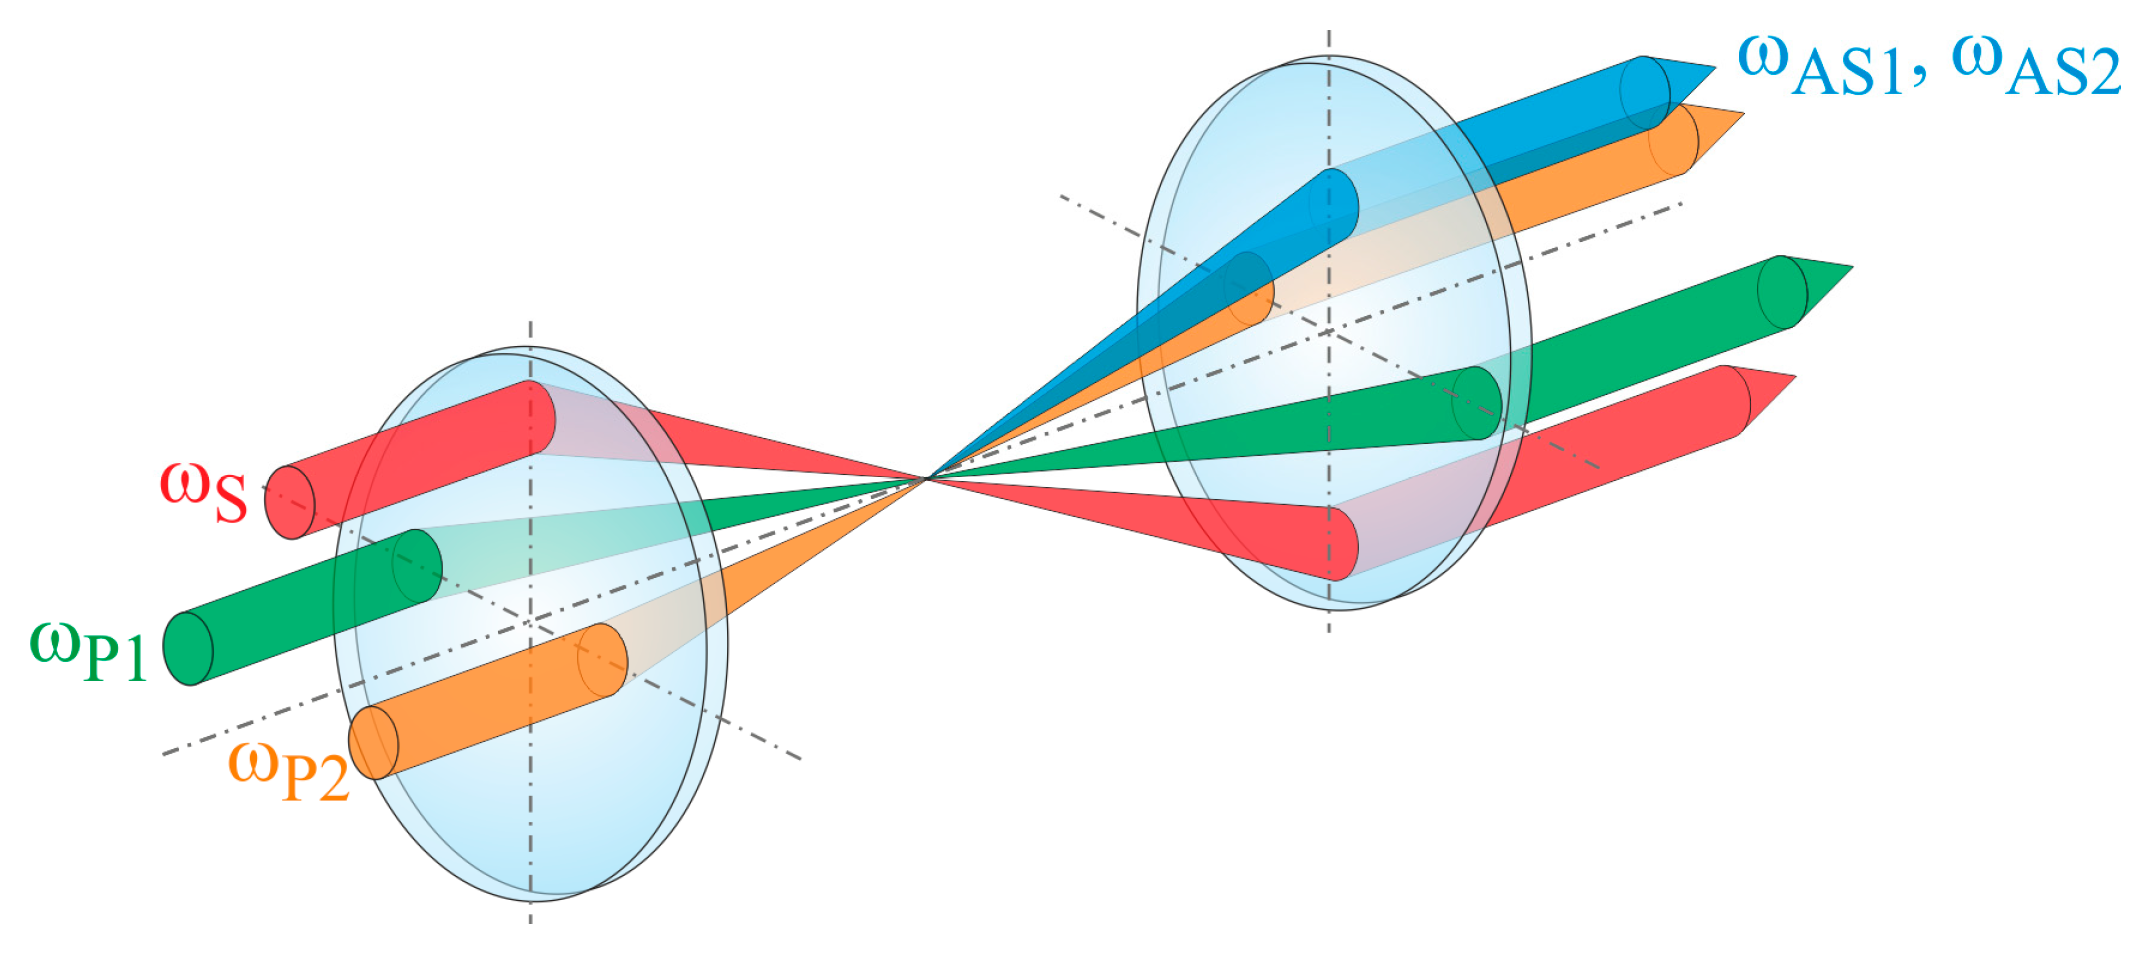
3.1. DPVCARS System
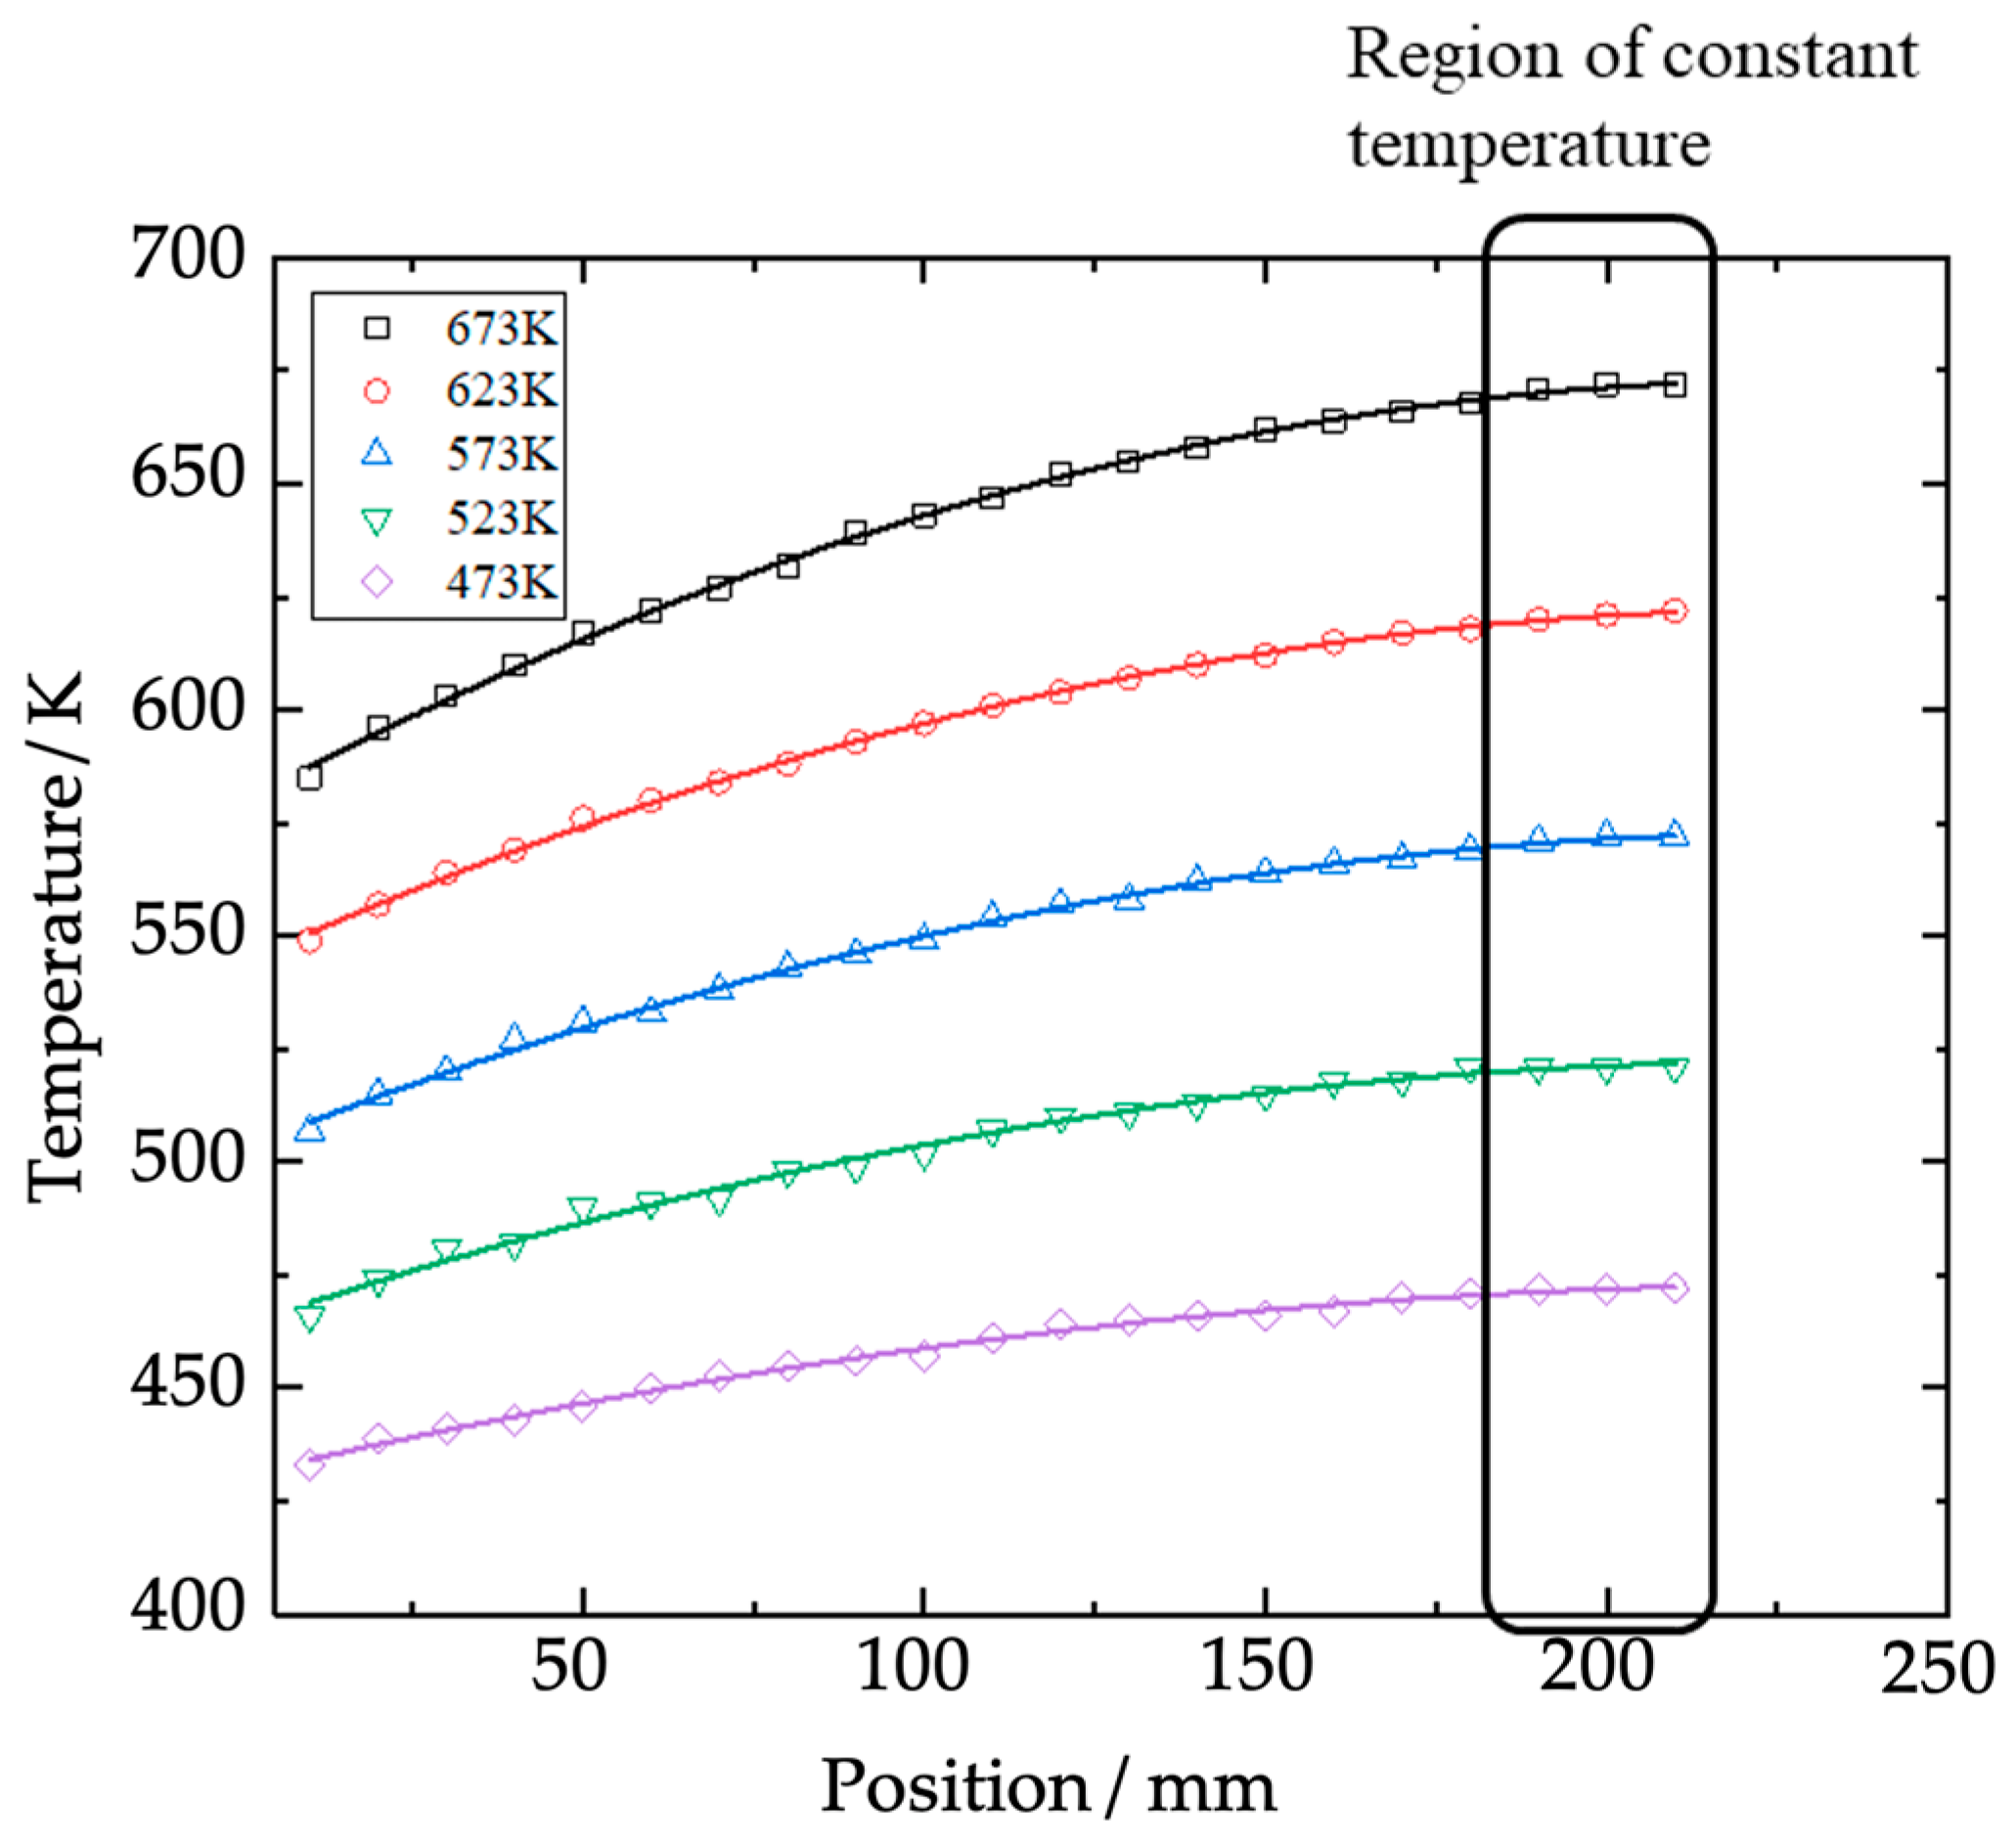
3.2. Heatable Gas Cell
3.3. Temperature Evaluation and Mixture Preparation
4. Results and Discussion
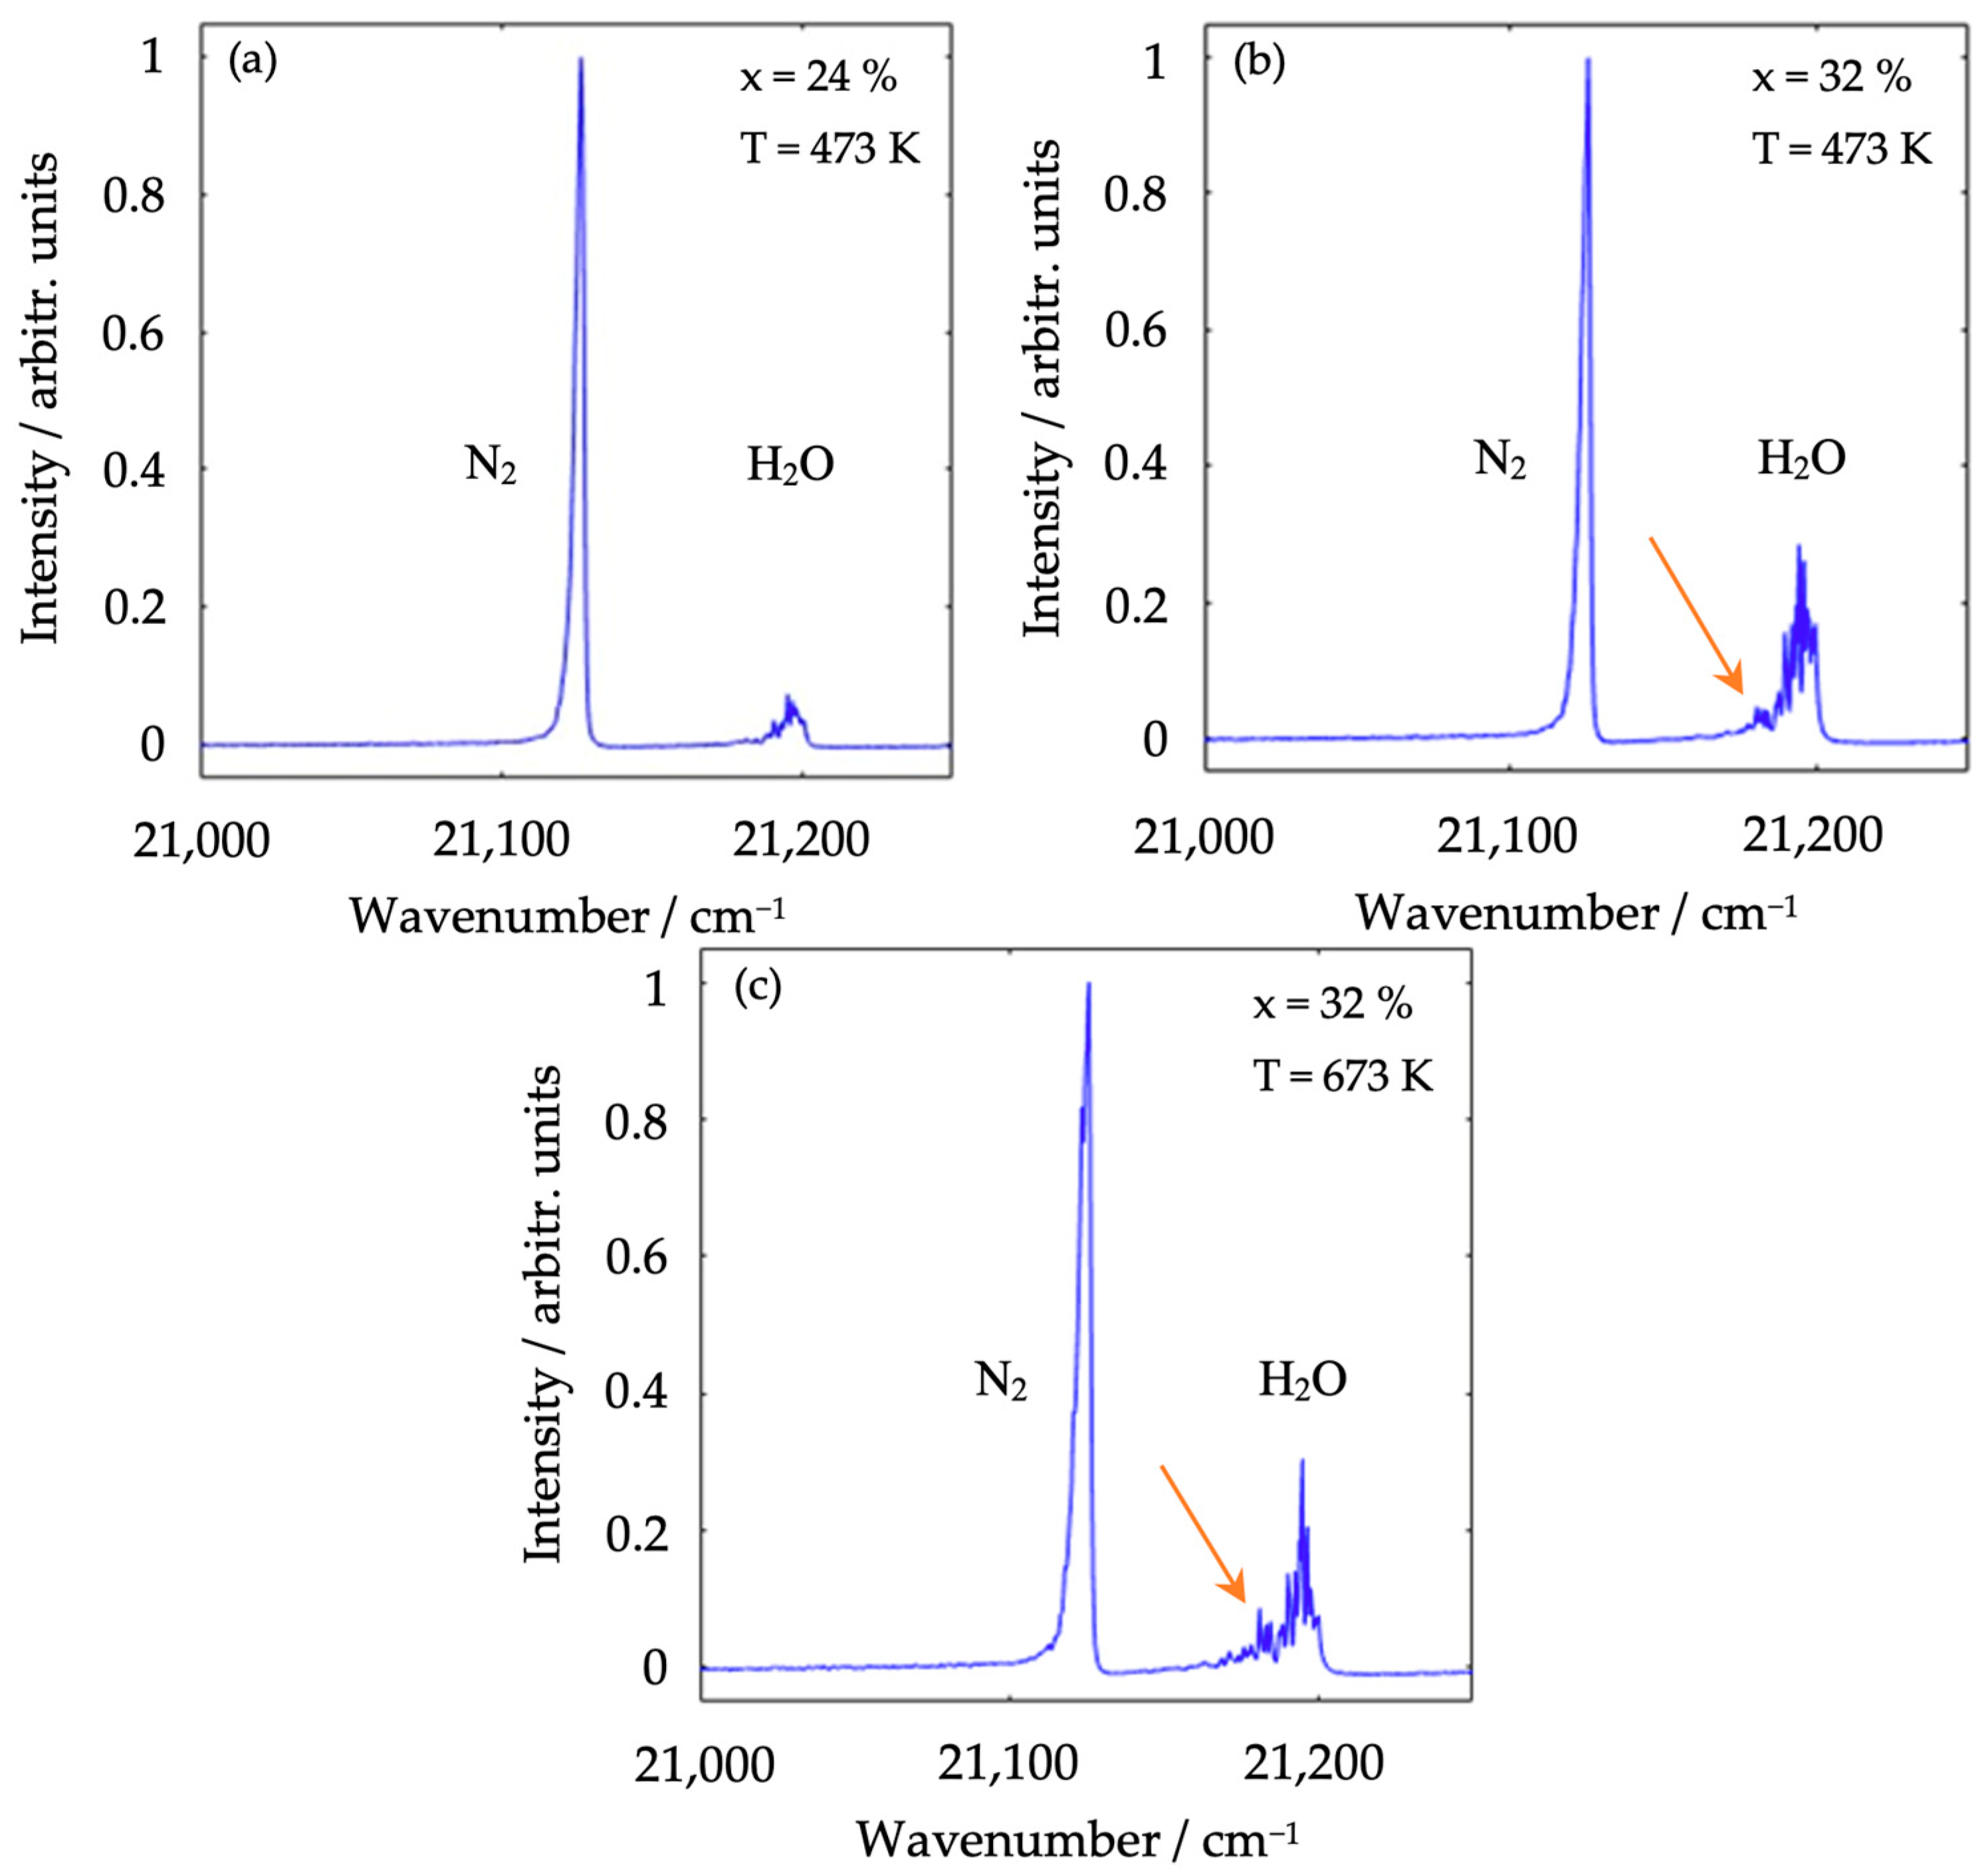
4.1. Experimental N2–H2O Spectra
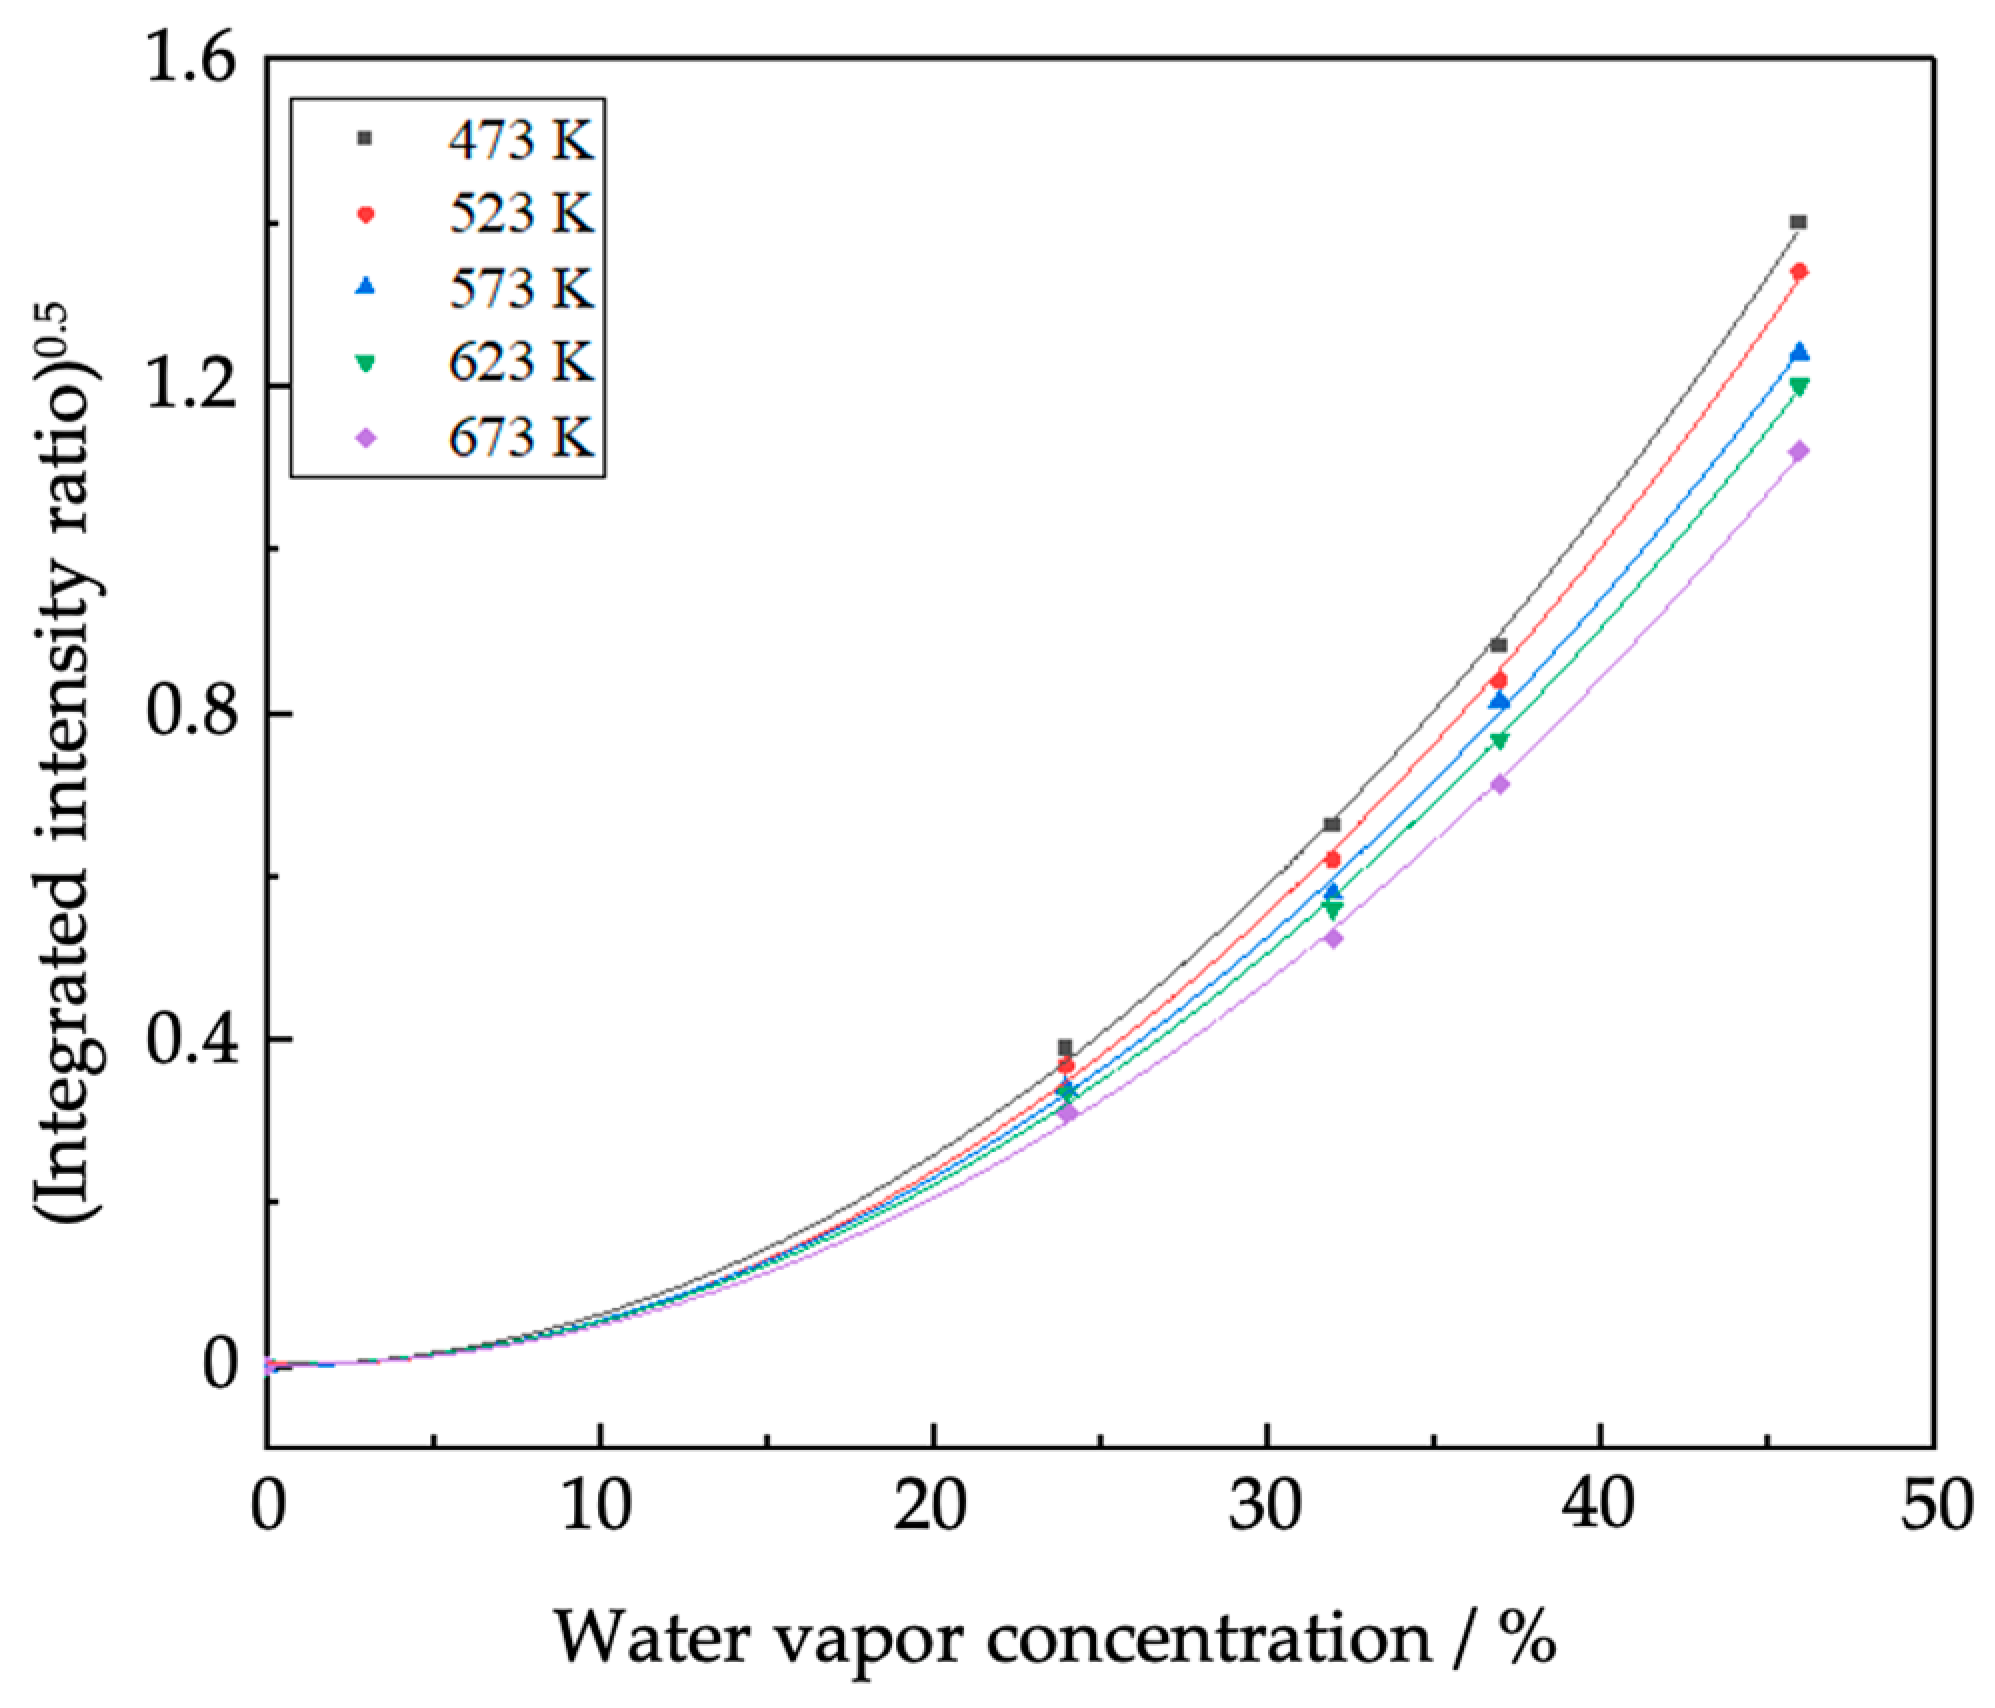
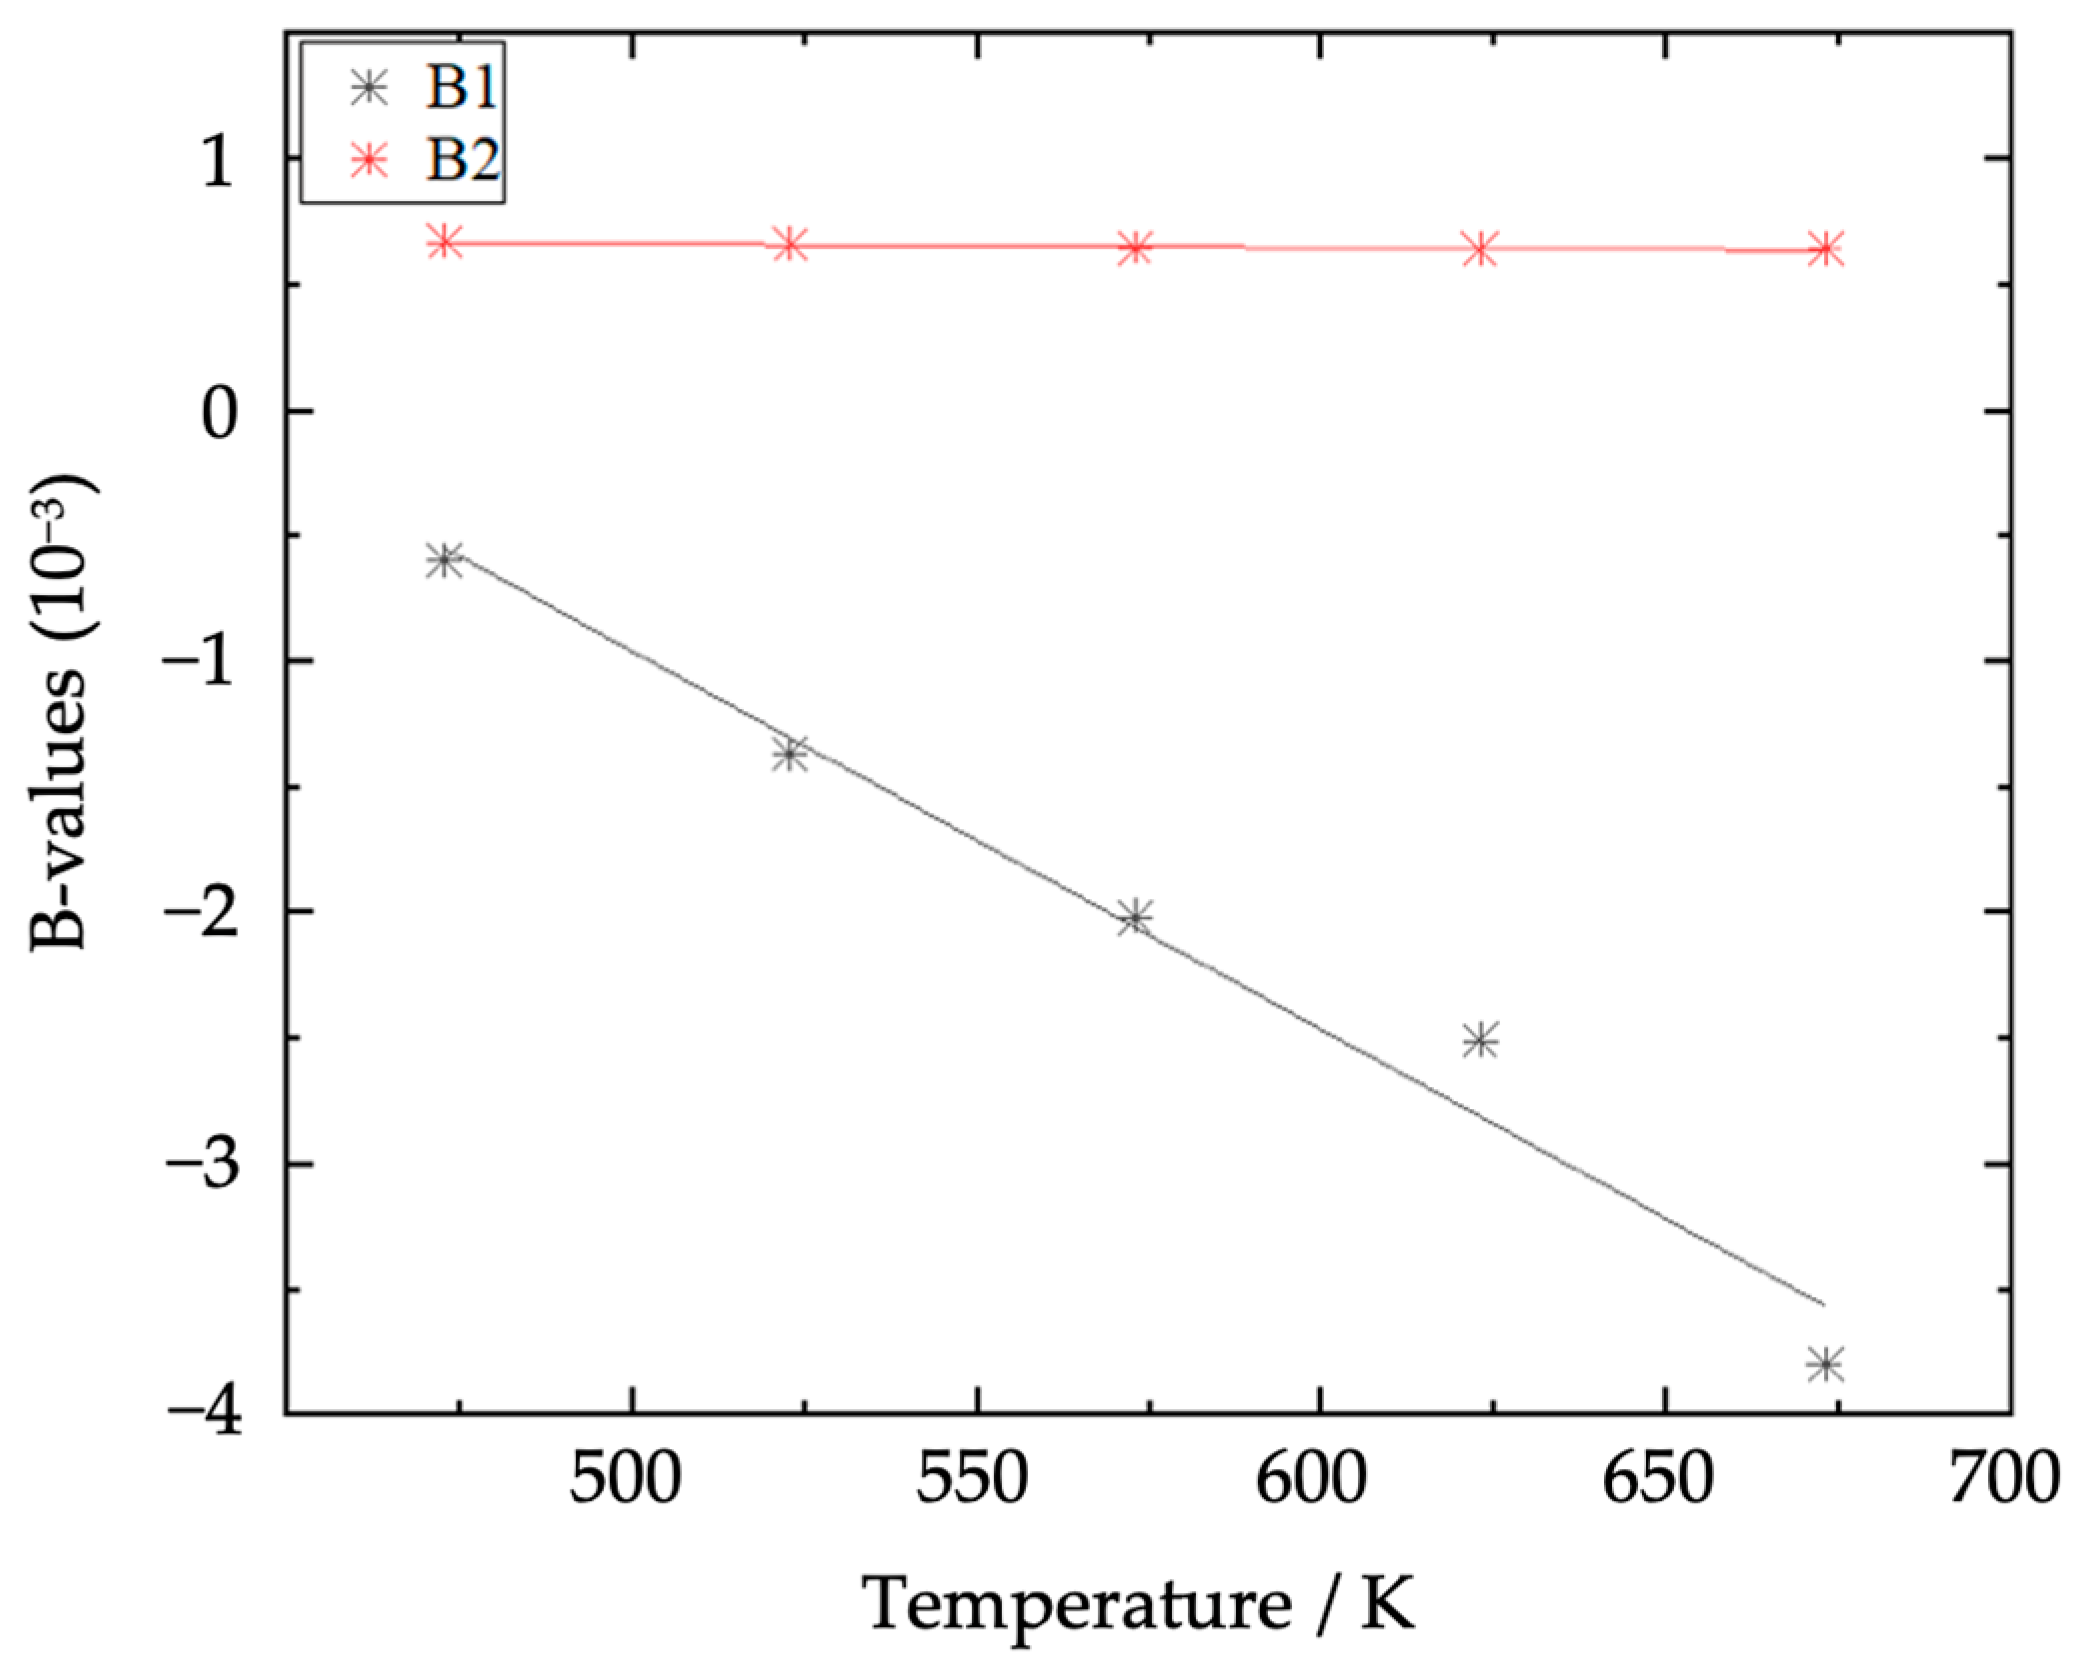
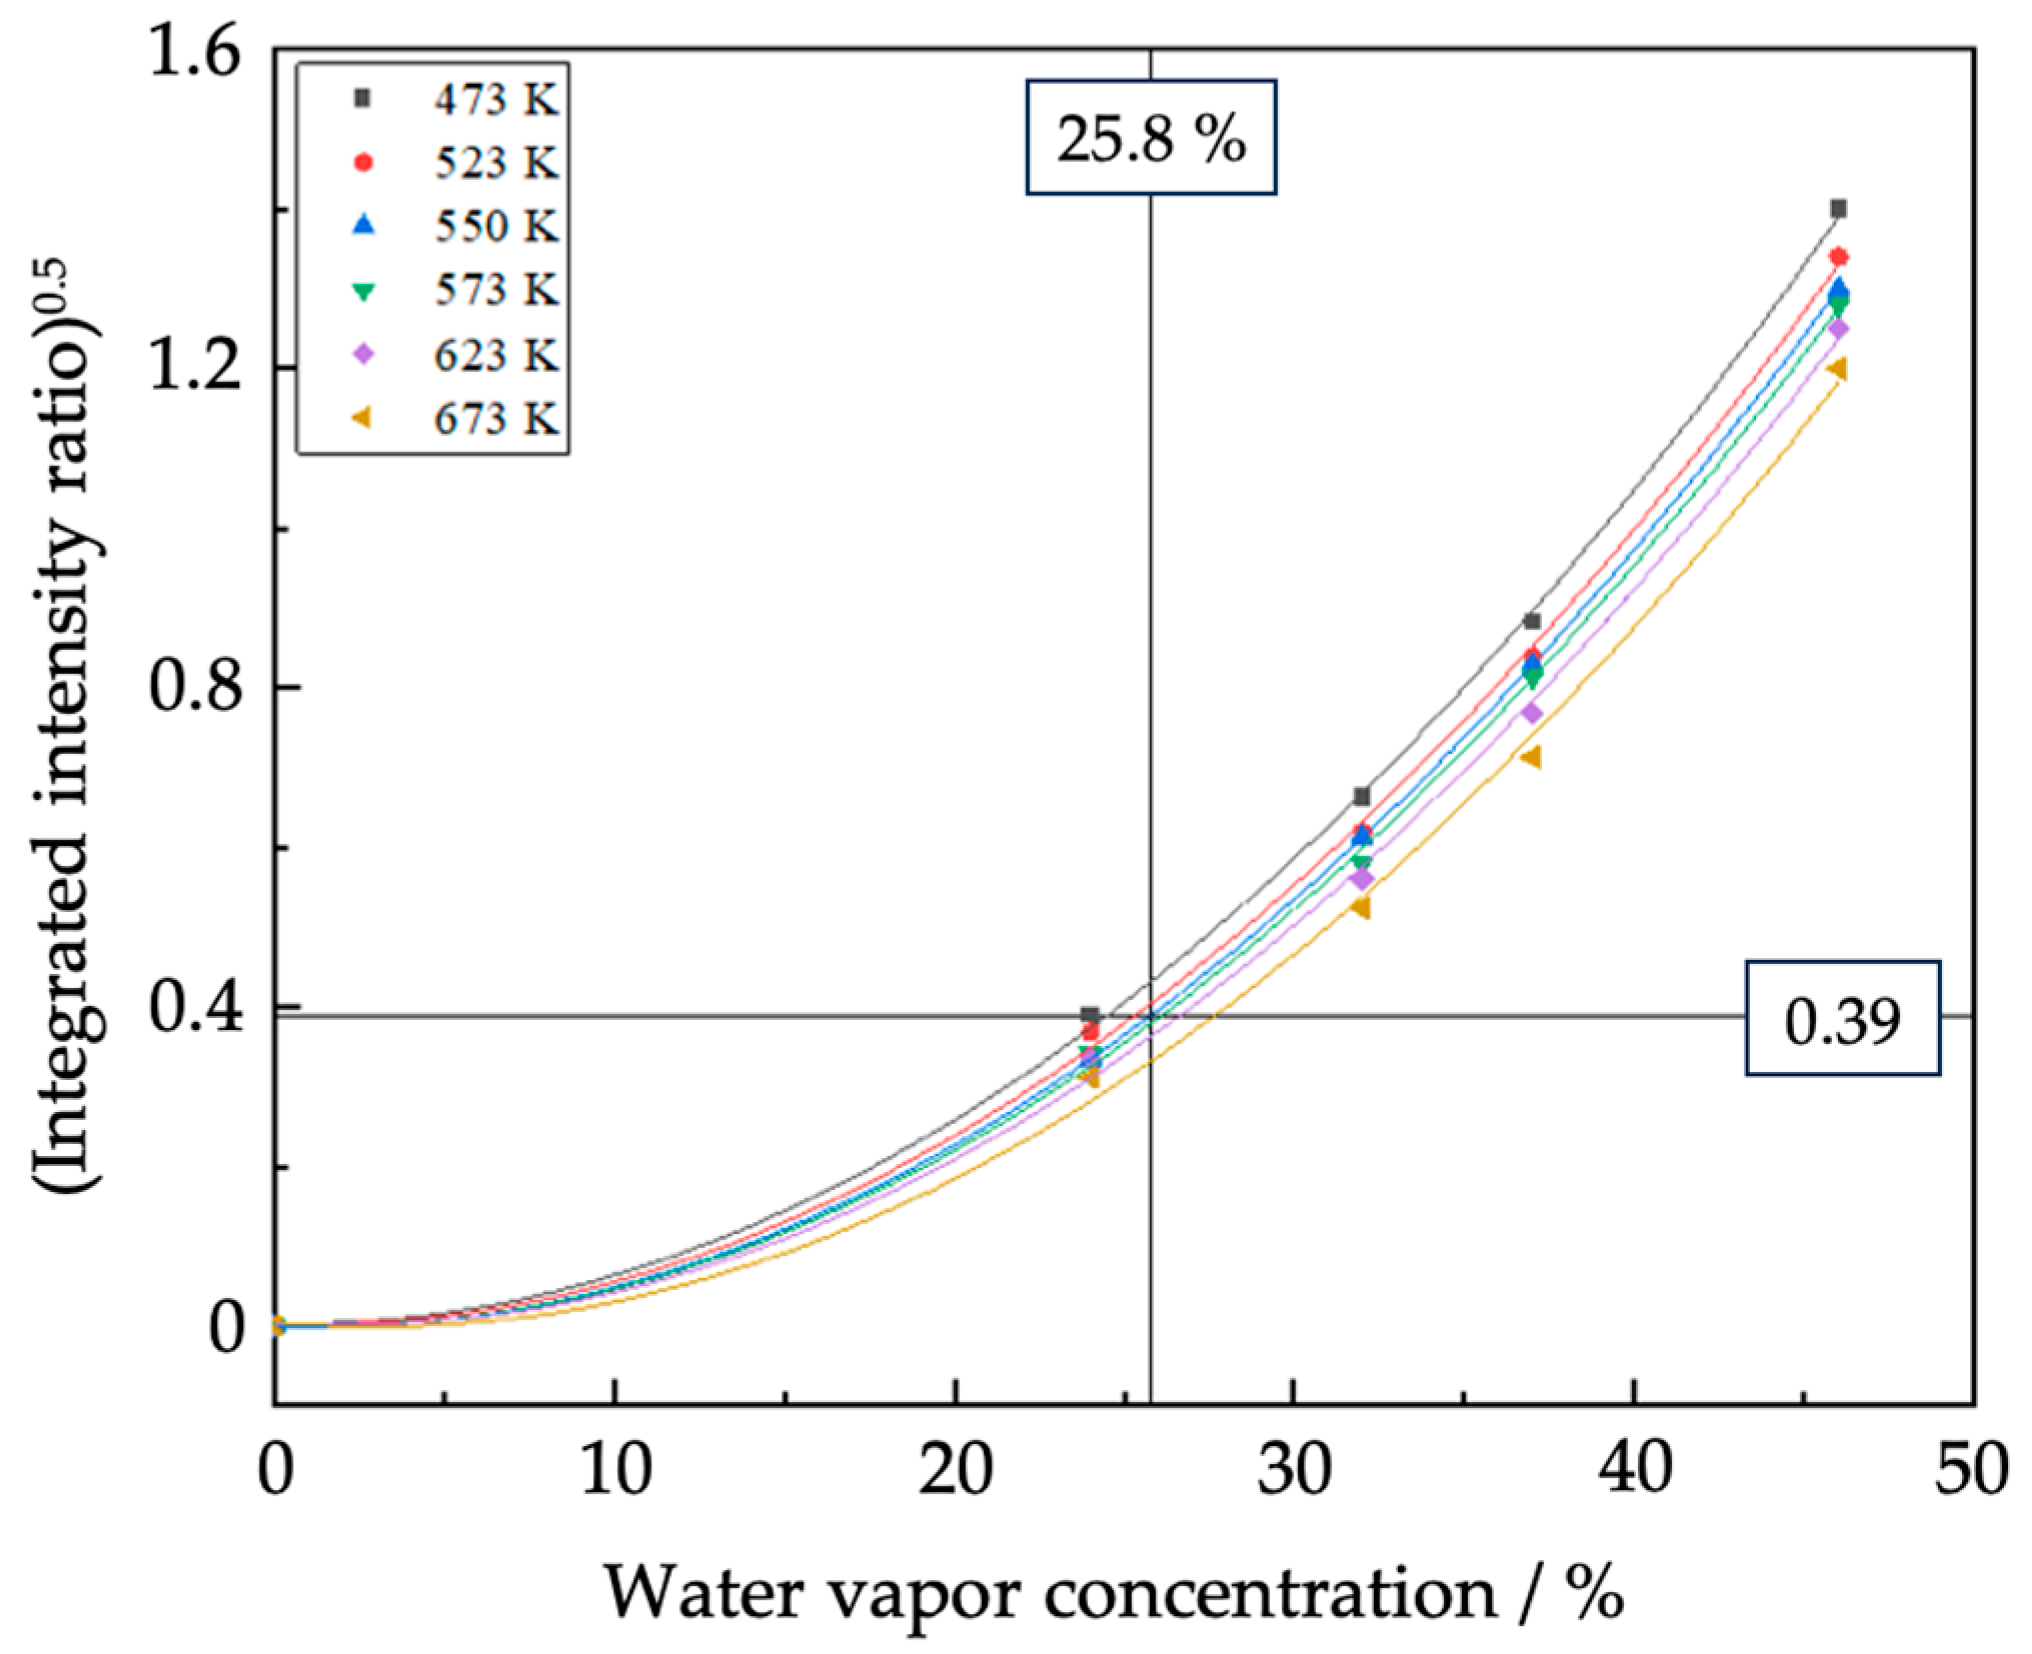
4.2. Calibration Procedure
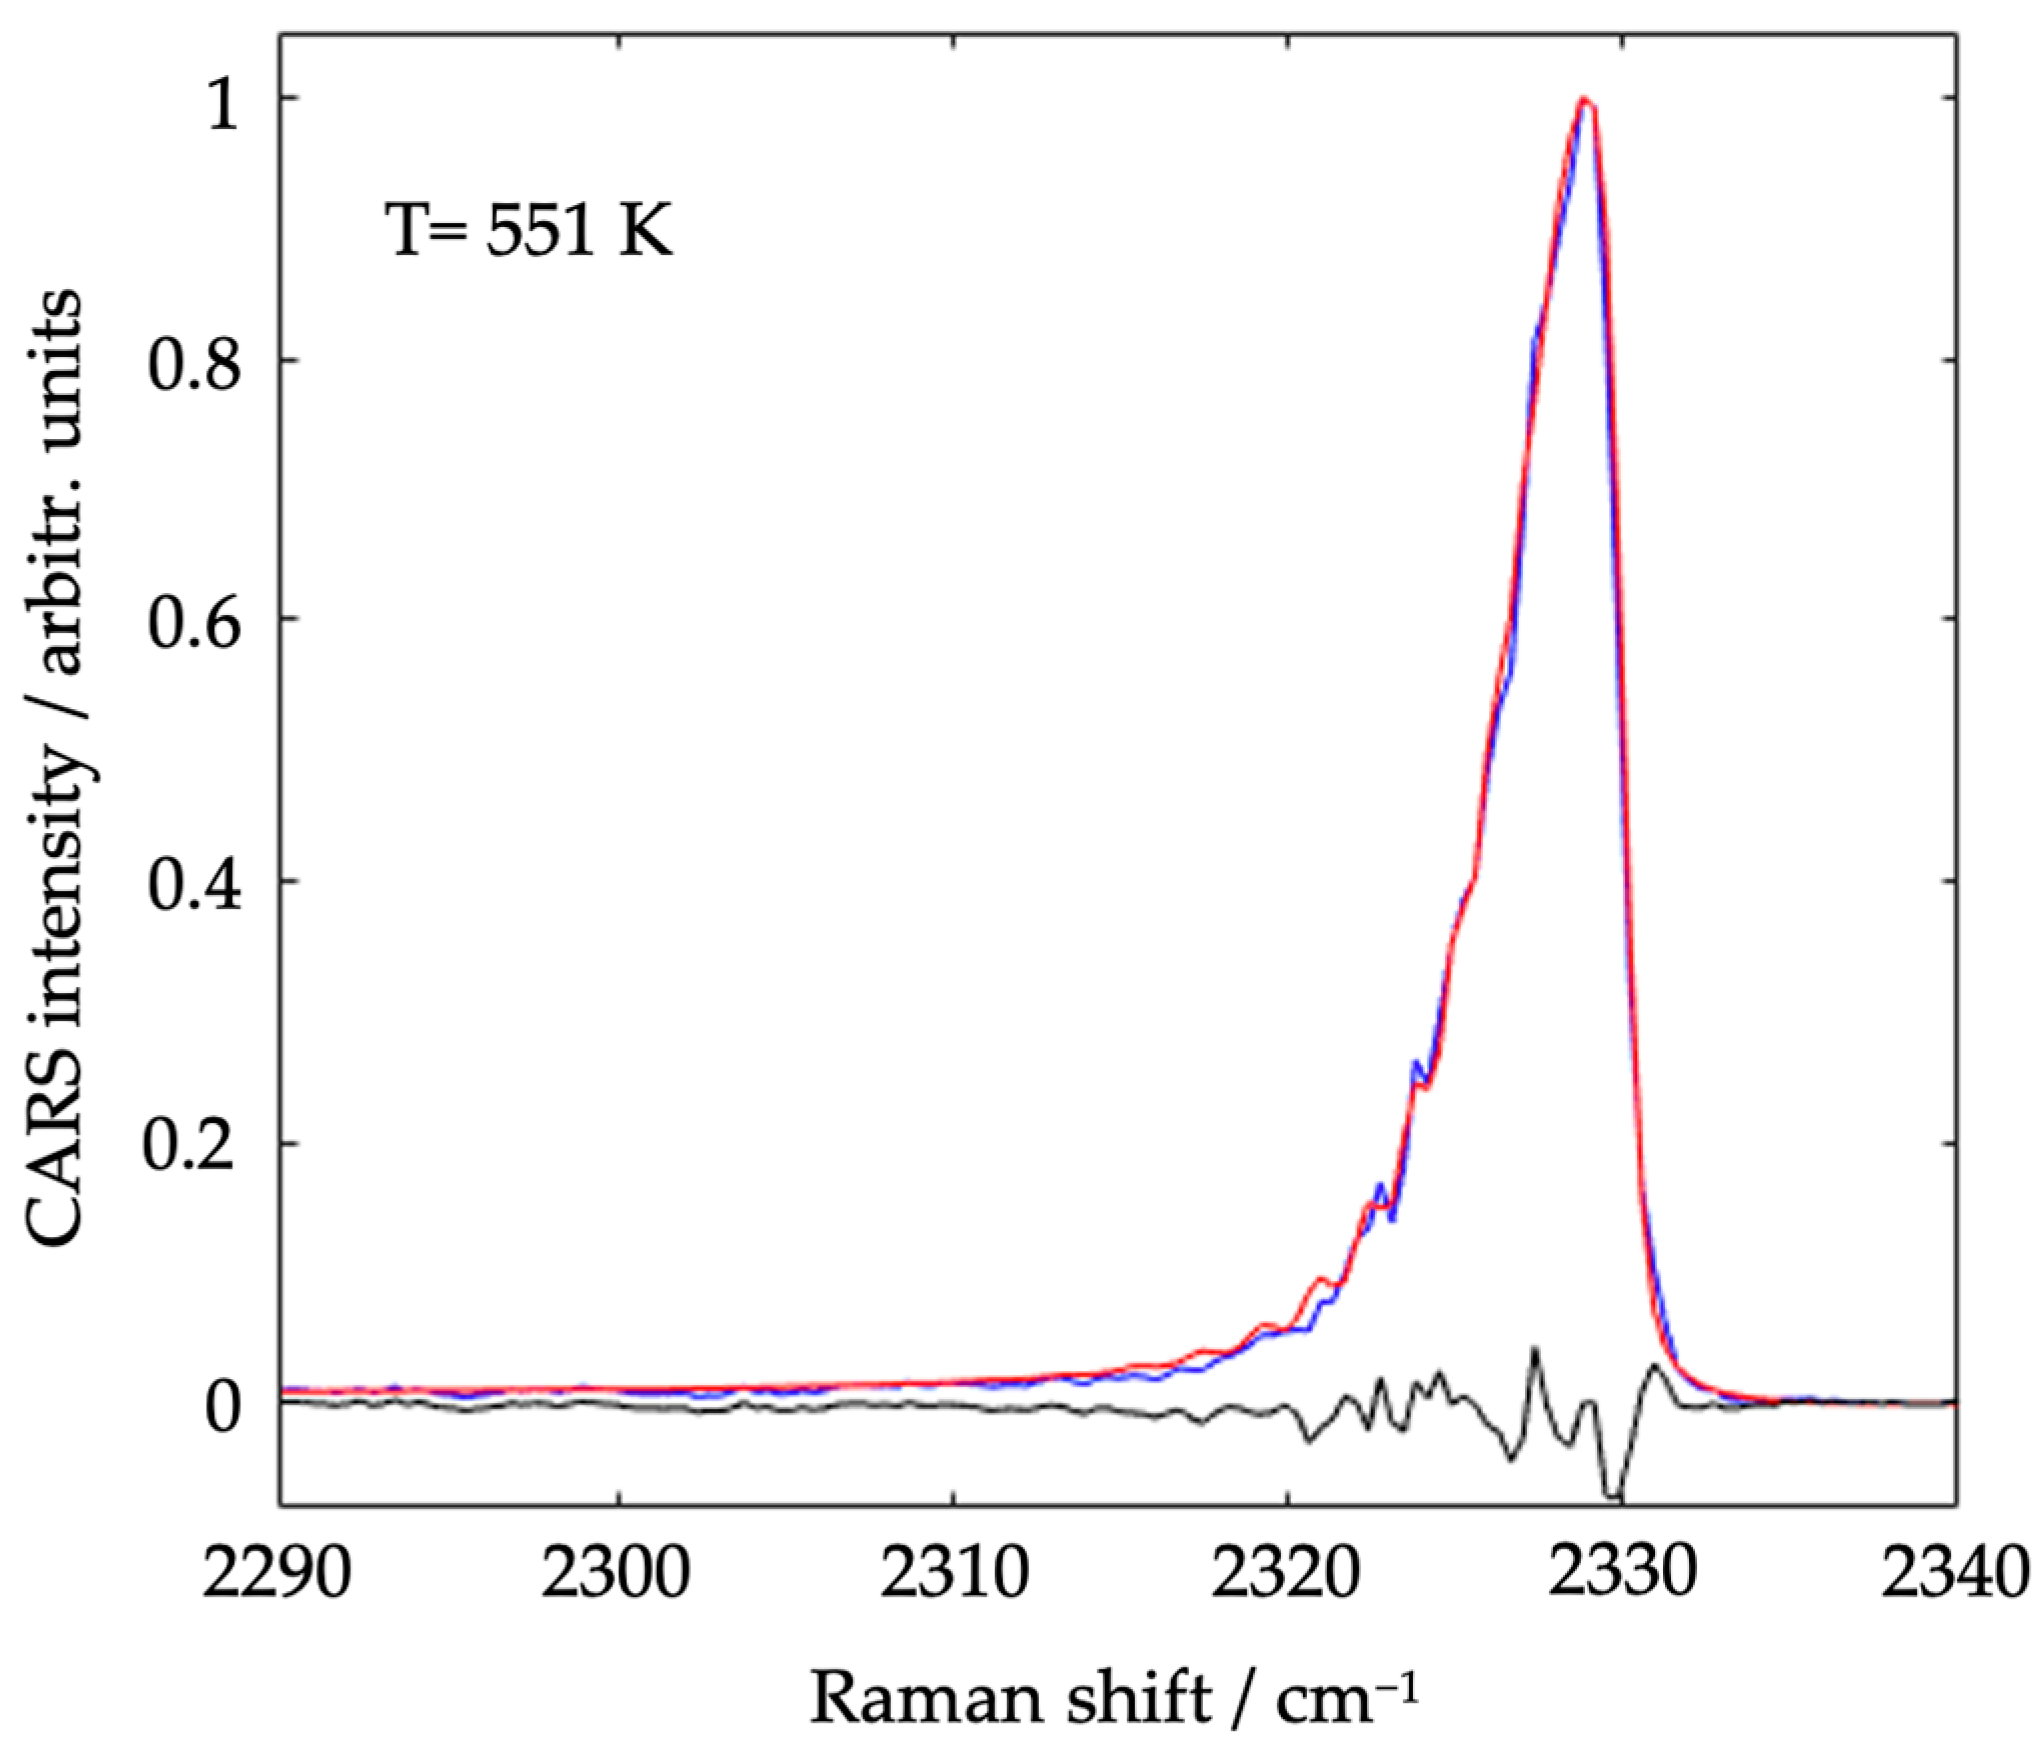
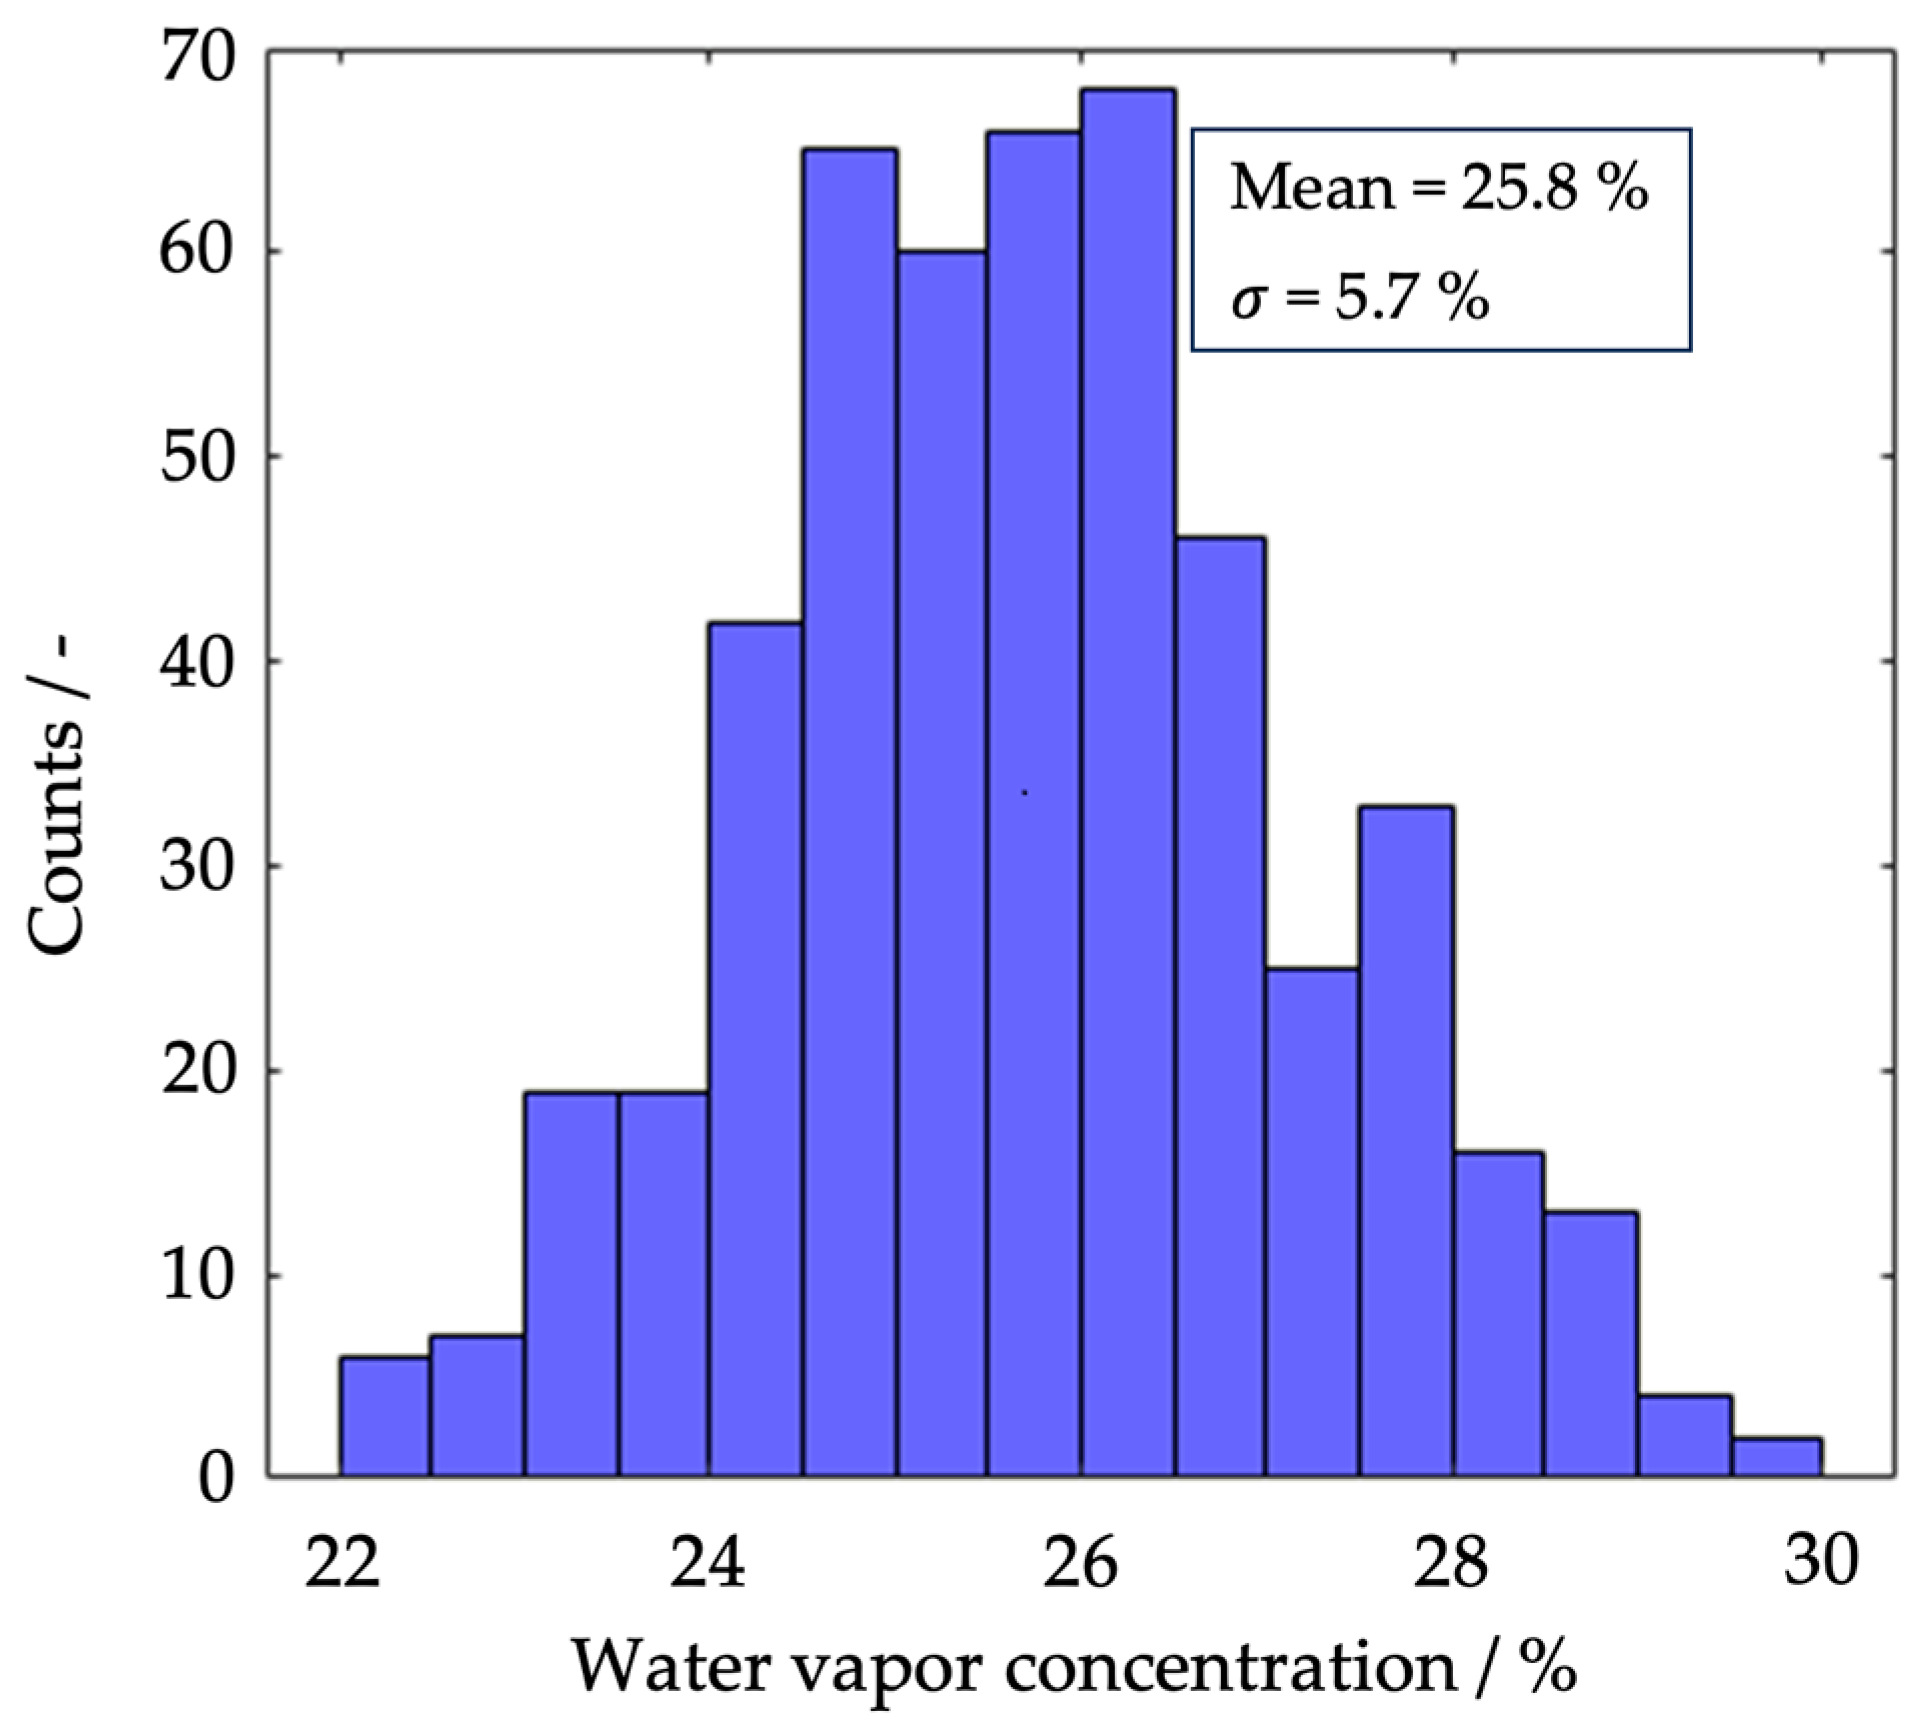
4.3. Validation Measurements
5. Conclusions
Author Contributions
Funding
Data Availability Statement
Acknowledgments
Conflicts of Interest
References
- Gao, J.; Liu, Q.; Gu, F.; Liu, B.; Zhong, Z.; Su, F. Recent advances in methanation catalysts for the production of synthetic natural gas. RSC Adv. 2015, 5, 22759–22776. [Google Scholar] [CrossRef]
- Cassia, R.; Nocioni, M.; Correa-Aragunde, N.; Lamattina, L. Climate change and the impact of greenhouse gasses: CO2 and NO, friends and foes of plant oxidative stress. Front. Plant Sci. 2018, 9, 273. [Google Scholar] [CrossRef] [PubMed]
- de Vasconcelos, B.R.; Lavoie, J.M. Recent advances in power-to-X technology for the production of fuels and chemicals. Front. Chem. 2019, 7, 392. [Google Scholar] [CrossRef] [PubMed]
- Wulf, C.; Zapp, P.; Schreiber, A. Review of power-to-X demonstration projects in Europe. Front. Energy Res. 2020, 8, 191. [Google Scholar] [CrossRef]
- Eckbreth, A.C. Laser Diagnostics for Combustion Temperature and Species, 2nd ed.; Gordon and Breach: Amsterdam, The Netherlands, 1996. [Google Scholar] [CrossRef]
- Meng, H.; Ren, Y.; Cameron, F.; Pitsch, H. In-situ temperature and major species measurements of sooting flames based on short-gated spontaneous Raman scattering. Appl. Phys. B 2023, 129, 32. [Google Scholar] [CrossRef]
- Kim, H.; Aldén, M.; Brackmann, C. Suppression of unpolarized background interferences for Raman spectroscopy under continuous operation. Opt. Express 2021, 29, 1048–1063. [Google Scholar] [CrossRef] [PubMed]
- Steinberg, A.; Roy, S. (Eds.) Optical Diagnostics for Reacting Flows: Theory and Practice, 1st ed.; AIAA: Stuttgart, Germany, 2023. [Google Scholar] [CrossRef]
- Klick, T.; Marko, K.A.; Rimai, L. Broadband single-pulse CARS spectra in a fired international combustion engine. Appl. Opt. 1981, 20, 1178–1181. [Google Scholar] [CrossRef]
- Alden, M.; Wallin, S. CARS experiments in a full-scale (10 × 10 m) industrial coal furnace. Appl. Opt. 1985, 24, 3434–3437. [Google Scholar] [CrossRef]
- Clauss, W.; Klimenko, D.N.; Oschwald, M.; Vereschagin, K.A.; Smirnov, V.V.; Stelmakh, O.M.; Fabelinsky, V.I. CARS investigation of hydrogen Q-branch linewidths at high temperatures in a high-pressure H2–O2 pulsed burner. J. Raman Spectrosc. 2002, 33, 906–911. [Google Scholar] [CrossRef]
- Athmanathan, V.; Rahman, K.A.; Lauriola, D.K.; Braun, J.; Paniagua, G.; Slipchenko, M.N.; Sukesh, R.; Meyer, T.R. Femtosecond/picosecond rotational coherent anti-Stokes Raman scattering thermometry in the exhaust of a rotating detonation combustor. Combust. Flame 2021, 231, 111504. [Google Scholar] [CrossRef]
- Seeger, T.; Leipertz, A. Experimental comparison of single-shot broadband vibrational and dual-broadband pure rotational coherent anti-Stokes Raman scattering in hot air. Appl. Opt. 1996, 35, 2665–2671. [Google Scholar] [CrossRef]
- Lucht, R.P. Three-laser coherent anti-Stokes Raman scattering measurements of two species. Opt. Lett. 1987, 12, 78–80. [Google Scholar] [CrossRef] [PubMed]
- Hancock, R.D.; Schauer, F.R.; Lucht, R.P.; Farrow, R.L. Dual-pump coherent anti-Stokes Raman scattering measurements of nitrogen and oxygen in a laminar jet diffusion flame. Appl. Opt. 1997, 36, 3217–3226. [Google Scholar] [CrossRef] [PubMed]
- Frederickson, K.; Kearney, S.P.; Luketa, A.; Hewson, J.C.; Grasser, T.W. Dual-pump CARS measurements of temperature and oxygen in a turbulent methanol-fueled pool fire. Combust. Sci. Technol. 2010, 182, 941–959. [Google Scholar] [CrossRef]
- Brüggemann, D.; Wies, B.; Zhang, X.X.; Heinze, T.; Knoche, K.-F. CARS Spectroscopy for Temperature and Concentration Measurements in a Spark Ignition Engine. In Combustion Flow Diagnostics; Durao, D.F.G., Whitelaw, J.H., Witze, P.O., Eds.; Kluwer Academic Pub.: Dardrecht, The Netherlands, 1992; pp. 495–511. [Google Scholar]
- Roy, S.; Meyer, T.R.; Lucht, R.P.; Afzelius, M.; Bengtsson, P.E.; Gord, J.R. Dual-pump dual-broadband coherent anti-Stokes Raman scattering in reacting flows. Opt. Lett. 2004, 29, 1843–1845. [Google Scholar] [CrossRef] [PubMed]
- Green, S.M.; Rubas, P.J.; Paul, M.A.; Peters, J.E.; Lucht, R.P. Annular phase-matched dual-pump coherent anti-Stokes Raman spectroscopy system for the simultaneous detection of nitrogen and methane. Appl. Opt. 1998, 37, 1690–1701. [Google Scholar] [CrossRef] [PubMed]
- Beyrau, F.; Seeger, T.; Malarski, A.; Leipertz, A. Determination of temperatures and fuel/air ratios in an ethene-air flame by dual-pump CARS. J. Raman Spectrosc. 2003, 34, 946–951. [Google Scholar] [CrossRef]
- Beyrau, F.; Datta, A.; Seeger, T.; Leipertz, A. Dual-pump CARS for the simultaneous detection of N2, O2 and CO in CH4-flames. J. Raman Spectrosc. 2002, 33, 919–924. [Google Scholar] [CrossRef]
- Weikl, M.C.; Seeger, T.; Hierold, R.; Leipertz, A. Dual-pump CARS measurements of N2, H2, and CO in a partially premixed flame. J. Raman Spectrosc. 2007, 38, 983–988. [Google Scholar] [CrossRef]
- Tedder, S.A.; Wheeler, J.L.; Cutler, A.D.; Danehy, P.M. Width-Increased dual-pump enhanced coherent anti-Stokes Raman spectroscopy. Appl. Opt. 2010, 49, 1305–1313. [Google Scholar] [CrossRef]
- Hall, R.J.; Shirley, J.A.; Eckbreth, A.C. Coherent anti-Stokes Raman spectroscopy: Spectra of water vapor in flames. Opt. Lett. 1979, 4, 87–89. [Google Scholar] [CrossRef]
- Misoi, H.; Hölzer, J.I.; Seeger, T. Temperature dependent determination of the S-branch Raman linewidths of oxygen and carbon dioxide in an oxyfuel relevant mixture. Appl. Opt. 2021, 60, 4410–4417. [Google Scholar] [CrossRef] [PubMed]
- Hölzer, J.I.; Meißner, C.; Seeger, T. Improvement of the coherent model function for S branch Raman linewidth determination in oxygen. Appl. Opt. 2021, 60, C76–C83. [Google Scholar] [CrossRef] [PubMed]
- Eckbreth, A.C.; Anderson, T.J. Dual broadband CARS for simultaneous, multiple species measurements. Appl. Opt. 1985, 24, 2731–2736. [Google Scholar] [CrossRef] [PubMed]
- Eckbreth, A.C.; Anderson, T.J.; Dobbs, G.M. Multi-color CARS for hydrogen-fueled scramjet applications. Appl. Phys. B Photophys. Laser Chem. 1988, 45, 215–223. [Google Scholar] [CrossRef]
- Eckbreth, A.C.; Dobbs, G.M.; Stufflebeam, J.H.; Tellex, P.A. Cars temperature and species measurements in augmented jet engine exhausts. Appl. Opt. 1983, 23, 1328–1339. [Google Scholar] [CrossRef] [PubMed]
- Nishihara, M.; Freund, J.B.; Glumac, N.G.; Elliott, G.S. Dual-pump CARS measurements in a hydrogen diffusion flame in cross-flow with AC dielectric barrier discharge. PSST 2018, 27, 035012. [Google Scholar] [CrossRef]
- Castellanos, L.; Mazza, F.; Bohlin, A. Water vapor in hydrogen flames by time-resolved collisional dephasing of the pure-rotational N2 CARS signal. Proc. Combust. Inst. 2023, 39, 1279–1287. [Google Scholar] [CrossRef]
- Nordström, E.; Bohlin, A.; Bengtsson, P.E. Pure ratational coherent anti-Stokes Raman spectroscopy of water vapor and its relevance for combustion diagnostics. J. Raman Spectrosc. 2013, 44, 1322–1325. [Google Scholar] [CrossRef]
- Rahn, L.A.; Palmer, R.E. Studies of nitrogen self-broadening at high temperature with inverse Raman spectroscopy. J. Opt. Soc. Am. B 1986, 3, 1164–1169. [Google Scholar] [CrossRef]


Disclaimer/Publisher’s Note: The statements, opinions and data contained in all publications are solely those of the individual author(s) and contributor(s) and not of MDPI and/or the editor(s). MDPI and/or the editor(s) disclaim responsibility for any injury to people or property resulting from any ideas, methods, instructions or products referred to in the content. |
© 2023 by the authors. Licensee MDPI, Basel, Switzerland. This article is an open access article distributed under the terms and conditions of the Creative Commons Attribution (CC BY) license (https://creativecommons.org/licenses/by/4.0/).
Share and Cite
Too, A.; Sidiropoulos, E.; Holz, Y.; Karuri, N.W.; Seeger, T. Dual-Pump Vibrational Coherent Anti-Stokes Raman Scattering System Developed for Simultaneous Temperature and Relative Nitrogen–Water Vapor Concentration Measurements. Optics 2023, 4, 613-624. https://doi.org/10.3390/opt4040046
Too A, Sidiropoulos E, Holz Y, Karuri NW, Seeger T. Dual-Pump Vibrational Coherent Anti-Stokes Raman Scattering System Developed for Simultaneous Temperature and Relative Nitrogen–Water Vapor Concentration Measurements. Optics. 2023; 4(4):613-624. https://doi.org/10.3390/opt4040046
Chicago/Turabian StyleToo, Amon, Evaggelos Sidiropoulos, Yannik Holz, Nancy Wangechi Karuri, and Thomas Seeger. 2023. "Dual-Pump Vibrational Coherent Anti-Stokes Raman Scattering System Developed for Simultaneous Temperature and Relative Nitrogen–Water Vapor Concentration Measurements" Optics 4, no. 4: 613-624. https://doi.org/10.3390/opt4040046