Article

In Vivo Biomechanical Response of the Human Cornea to Acoustic Waves

by
Francisco J. Ávila
*,
Maria Concepción Marcellán
and
Laura Remón
Departamento de Física Aplicada, Facultad de Ciencias, Universidad de Zaragoza, 50009 Zaragoza, Spain
*
Author to whom correspondence should be addressed.
Optics 2023, 4(4), 584-594; https://doi.org/10.3390/opt4040043
Submission received: 21 September 2023 / Revised: 25 October 2023 / Accepted: 14 November 2023 / Published: 17 November 2023
(This article belongs to the Special Issue Advances in Vision Optics, Myopia Control and Refractive Surgery)

Abstract

:
The cornea is the optical window to the brain. Its optical and structural properties are responsible for optical transparency and vision. The shape, elasticity, rigidity, or stiffness are due to its biomechanical properties, whose stability results in ocular integrity and intraocular pressure dynamics. Here, we report in vivo observations of shape changes and biomechanical alterations in the human cornea induced by acoustic wave pressure within the frequency range of 50–350 Hz and the sound pressure level of 90 dB. The central corneal thickness (CCT) and eccentricity (e2) were measured using Scheimpflug imaging and biomechanical properties [corneal hysteresis (CH) and intraocular pressure (IOP)] were assessed with air-puff tonometry in six young, healthy volunteers. At the specific 150 Hz acoustic frequency, the variations in e2 and CCT were 0.058 and 7.33 µm, respectively. Biomechanical alterations were also observed in both the IOP (a decrease of 3.60 mmHg) and CH (an increase of 0.40 mmHg).

1. Introduction

Corneal biomechanics [1,2] depends on the distribution of the collagen fibers within the stroma. The corneal type-I fibrillary collagen arrangement allows the maintenance of the three-dimensional structure and transparency of the corneal stroma [3]. Knowledge of the biomechanical properties (BMPs) of the cornea allows us to ensure the success of refractive surgery [4] or the diagnosis and follow up of corneal pathologies such as keratoconus, a progressive degeneration that can lead to corneal transplantation.
The clinical relevance of BMPs has attracted special interest with the development of surgery techniques to modify the refractive power of the cornea via laser ablation [5] or lenticular extraction [6]. These techniques consist of modify the lamellar structure of the cornea, causing redistribution of mechanical stress. The biomechanical response is expected to provide the correct corneal curvature [7,8] and normal vision.
Various methods based on different inherent principles have been developed to characterize corneal biomechanics in vivo. The most commonly used approaches involve the use of air-puff tonometry, such as the Ocular Response Analyzer (ORA), which is a non-invasive device that measures the intraocular pressure (IOP) and corneal biomechanics, including corneal hysteresis (CH) and corneal resistance factor (CRF) parameters [9]. The ORA device has been extensively used to explore the impact of corneal biomechanics on myopia development [10], asymmetry of visual field defects in glaucoma [11], the effect of soft contact lens use in healthy subjects [12], or corneal changes due to degenerative keratoconus disease [13].
The development of optical techniques, such as the Scheimpflug camera or optical coherence tomography (OCT), allows the direct monitoring of corneal deformation following air perturbations (e.g., CORVIS ST) [14,15]. In recent years, new technologies, including Brillouin microscopy [16] and corneal elastography techniques [17,18], have emerged as potential tools for in vivo corneal biomechanical evaluation. Moreover, the finite element methods (a type of in silico method) are playing a fundamental role in corneal modelling simulations in several studies to evaluate and establish predictive models of corneal biomechanics [19,20,21].
Due to its inherent elastic properties, the cornea can behave as a biomechanical resonance system under the action of certain mechanical vibrations [22], and then the cornea can be considered a biomechanical resonant oscillator when external perturbations are applied [23,24].
In this respect, sound-induced corneal vibrometry has previously been reported to explore the corneal vibrational modes. Akca et al. [25] reported the visualization of the resonance modes of ex vivo corneas using low-power sound waves and OCT imaging. In addition, these vibrational resonance modes of the cornea are sensitive to the IOP [26].
Therefore, the corneal resonance induced by acoustic waves seems to be sensitive to both the shape and the biomechanics of the cornea. This work presents an acoustic wave generator to induce subtle modifications in corneal shape that can alters corneal biomechanics within the physiological range. We show the first in vivo observations of corneal biomechanics and shape changes due to acoustic pressure within the range 50–350 Hz at a maximum pressure level of 90 dB. The technique utilizes an arbitrary waveform generator, a sound amplifier, a subwoofer, a Scheimpflug camera (Galilei G2; Ziemer Ophthalmic Systems AG, Port, Switzerland), and an ORA (Reichert Instruments, Depew, NY, USA) tonometer. Shape parameters, including the CCT and e2, and biomechanical measure (CH and IOP) changes were analyzed in six healthy volunteers as a function of the oscillating frequency of the sound wave generator.

2. Materials and Methods

2.1. Experimental Corneal Acoustic Wave Generator

Figure 1a shows a schematic diagram of the custom-built instrument. The acoustic waves are generated via a function/arbitrary waveform (FWG) generator (RSGD 805, RS PRO, RS Components Ltd, Northants, UK) with maximum output frequency of 5 MHz, 125 MSa/s sample rate, and resolution frequency of 1 μHz (14-bit vertical resolution). The output wave can be generated as a sine, square, ramp, pulse, Gaussian noise, or arbitrary forms. The output is connected to a sound amplifier (SA), which drives a full-range subwoofer (SW) (FR8, VISATON GmbH & Co, Haan, Germany) to produce acoustic pressure at the corneal plane. Figure 1 shows a real picture of the set up, vertically orientated for clinical measurements.

2.2. Instrument Calibration

A sinusoidal waveform signal was generated at the FWG for two different amplitudes (peak-to-peak voltage): 1 and 2 Vpp. The sound pressure level was measured in dB using a digital sound meter placed at 100 mm from the SW, as a function of the signal frequency. Figure 2 shows the measured acoustic pressure (dB) for a frequency range between 50 and 350 Hz (with a step size of 50 Hz) for two different amplitude values. For in vivo corneal testing, we chose the lower amplitude that provided a maximum pressure of 90 dB at the maximum frequency (350 Hz), with a modulation of 11 dB within the range of tested frequencies.

2.3. Experimental Measurements

Six volunteers (33 ± 9 years old) were included in the study. The measurements were carried out at the Visual Science and Instrumentation Lab of the University of Zaragoza (Zaragoza, Spain). The participants did not have any ocular diseases, glaucoma, or corneal complications that could affect the measurements. Dual Placido–Scheimpflug imaging (Galilei G2) and air-puff tonometry (ORA) commercial devices (ORA, Reichert Instruments, Depew, NY, USA) were employed to obtain morphometric data for shape characterization and biomechanical assessment, respectively, as shown in Table 1.

2.3.1. Galilei Dual Scheimpflug Analyzer: Shape Parameters

The Galilei Dual Scheimpflug Analyzer (Galilei G2; Ziemer Ophthalmic Systems AG, Port, Switzerland) is an advanced clinical optical system that combines Placido Disk imaging with a revolving Scheimpflug camera [14]. This integration allows for the simultaneous capture of corneal topography information from both the internal and external surfaces of the cornea. The device captures two corneal images for each analyzed meridian, and the Galilei G2 software (version G4) overlays these images to enhance the accuracy of corneal parameter estimation. The central corneal thickness (CCT) and eccentricity (e2) were extracted for each participant and sound frequency. Three measurements of good quality, as indicated via the Galilei G2 software, were captured at each session to assess repeatability, using the 16-picture (i.e., 16 corneal meridians) scan mode. Corneal shape involved the CCT and e2 measures. While variations in CCT correspond to tissue compression, eccentricity values reveal the rate of corneal flattening due to sound pressure waves.

2.3.2. Ocular Response Analyzer: Biomechanical Assessment

Ocular Response Analyzer (ORA, Reichert Instruments, Depew, NY, USA) is a non-contact air-puff applanation tonometer that provides corneal hysteresis (CH) and corneal resistance factor (CRF) measurements [9]. CH refers to the dissipation of energy when an external stress is applied to the cornea. Unlike purely elastic materials that immediately return to their initial state once the stress is removed, the cornea exhibits time-dependent stress. On the other hand, the CRF measures the resistance of the cornea, encompassing aspects of rigidity and/or elasticity. CH and the IOP were measured for each volunteer for different sound wave frequencies. Each experimental measurement was the average of four measurements of good quality.

2.3.3. Pneumatic Viscoelastic Damping

CH deals with the inherent viscous damping nature of the human cornea [27]. CH can be defined as the biomechanical property that describes the biophysics of the corneal viscoelastic nature when the tissue is deformed by an external load (air pulses). In that sense, CH is the corneal capability to absorb and dissipate energy such as mechanical stress or intraocular pressure [28].
The proposed method delivers sound waves to the corneal tissue with a sine-wave form at a given amplitude and angular frequency (see Section 2); those waves create back-and-forth oscillations of the air molecules, creating a wave pressure. This study deals with the transition of the “pneumatic tonometry” concept [29], the principle of which is based on corneal depression against the IOP due to the injection of an air column flow.
In this work, we introduce the concept of pneumatic viscoelastic damping (PVD) as the variation in CH as a consequence of a sound wave pressure (swp) as a function of the sound frequency (υ), defined as:
P V D   υ = 100 × C H s w p C H 0 C H 0
Let us consider a viscoelastic cornea under external pressures. When loaded, the cornea exhibits immediate deformation (pure elastic component) that is damped by the viscous component followed by creep deformation (viscoelastic damping) [30]. More elastic corneas are prone to greater deformation due to a decreased viscoelasticity response [27] (i.e., lower CH values); in this sense, PVD reflects the ability of the cornea to modify its elastic and viscous properties under dynamic load conditions. Positive PVD values correspond to an increased viscosity component. On the contrary, PVD negative values indicate a reduced capability to absorb and dissipate energy as the elasticity the predominant component.

3. Results

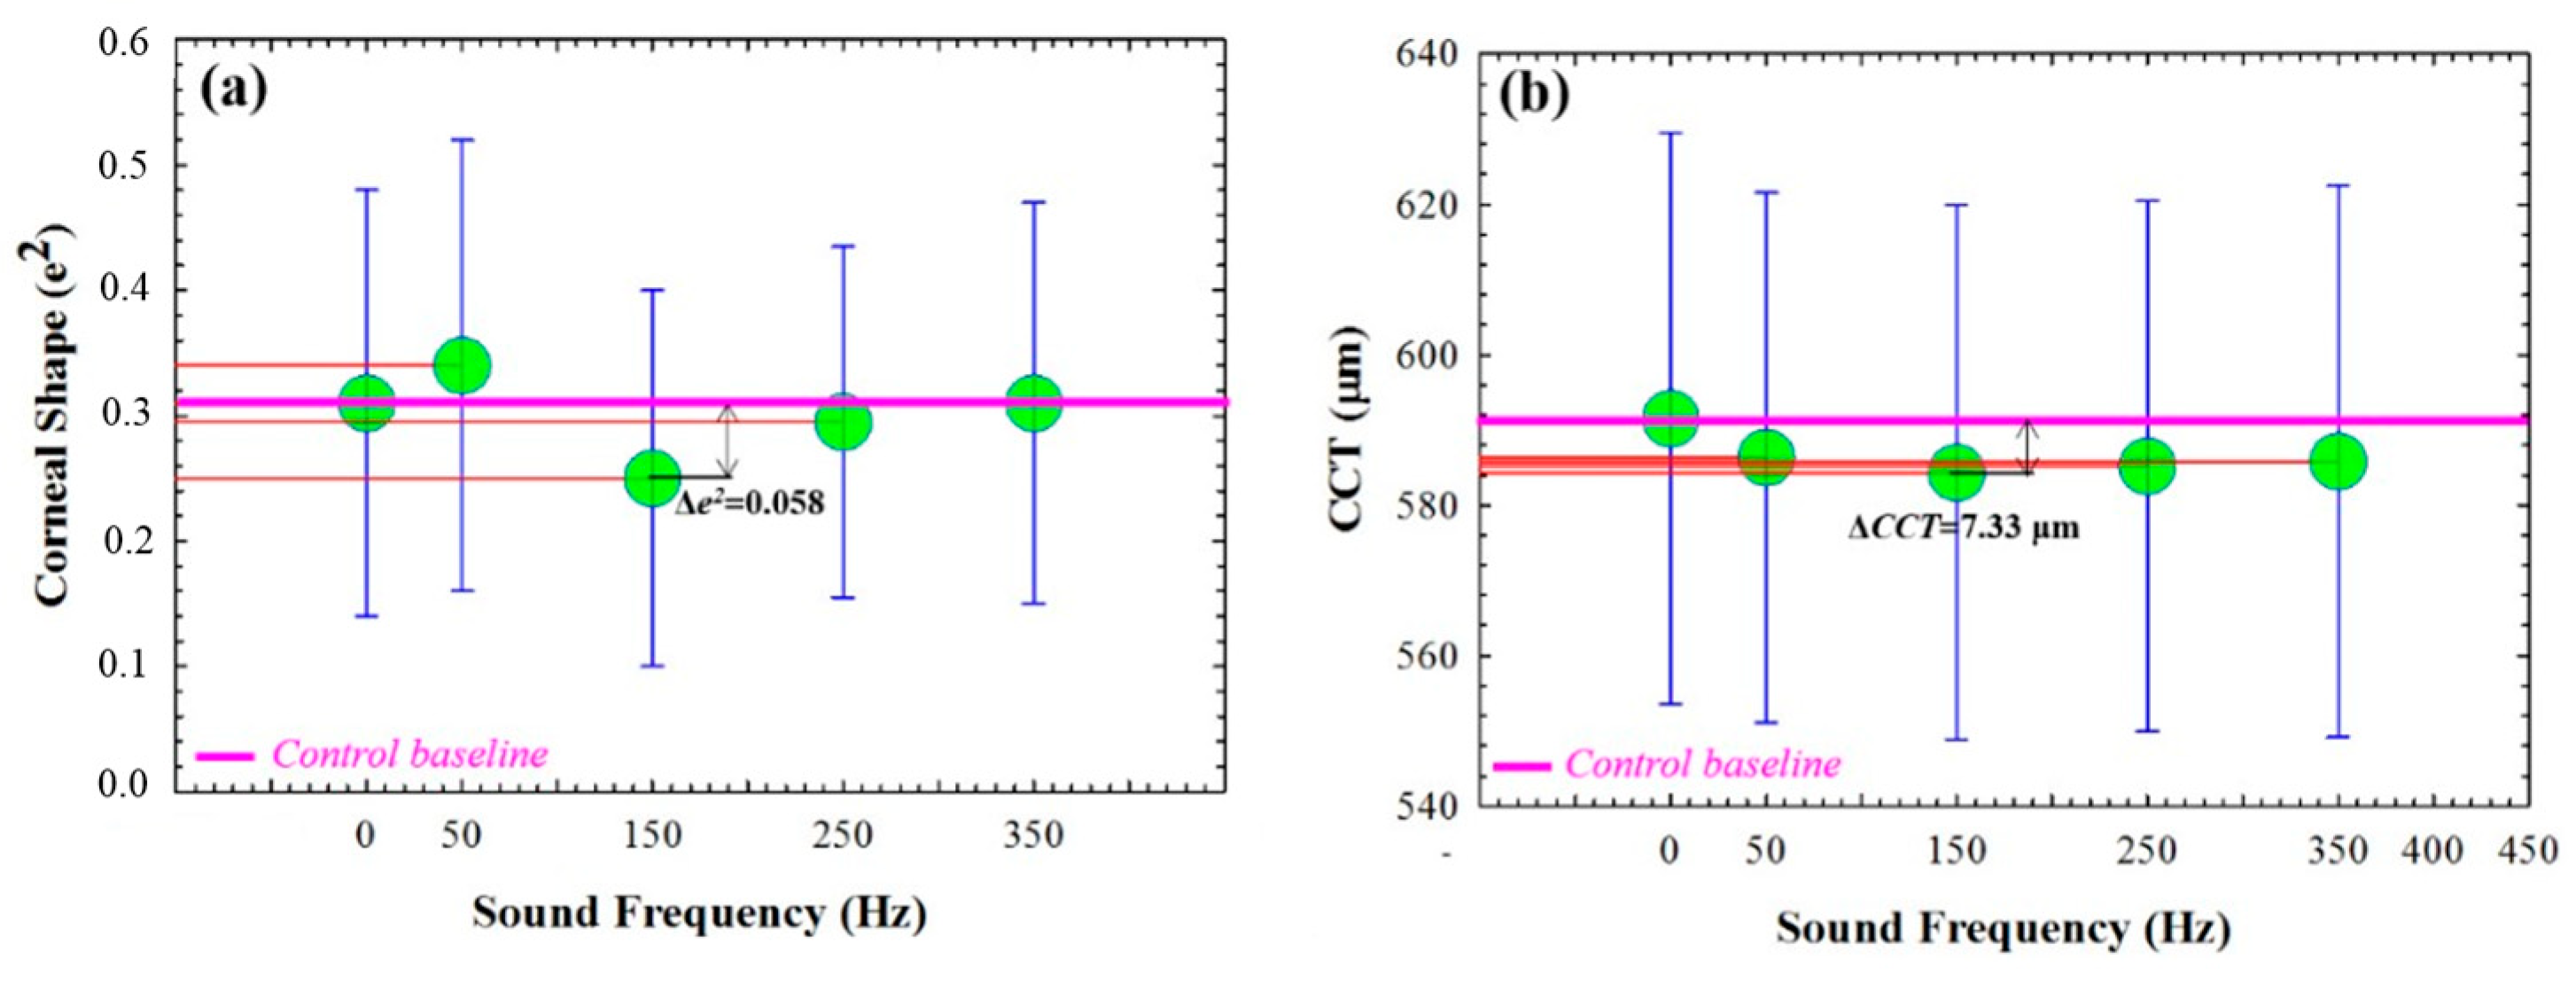
3.1. Corneal Shape Changes as a Function of the Sound Frequency

Understanding the acoustic sinusoidal wave reaching the corneal surface as an external sound pressure perturbation applied to a viscoelastic material, an observed deformation or structural change is expected in relation to the relaxed state (i.e., FWG off). As described in Section 2.3, the structural changes in the corneal tissue were quantified via computing the CCT and e2 parameters from Scheimpflug imaging. Figure 3 shows the mean values for six volunteers as a function of the sound frequency compared to the control baseline mean values (FGW off). The results showed that, at a given sound frequency, the corneal tissue reaches the lowest values of e2 and CCT. In particular, the most sensitive sound frequency was 150 Hz, which resulted in an average reduction of 0.058 in e2 (Figure 3a) and 7.33 μm in CCT (Figure 3b) compared to the relaxed state.
Figure 4 displays an example from one volunteer of the Scheimpflug output elevation maps for a regular measurement (upper row, instrument off) and a measurement taken while the acoustic wave generator was operating at 150 Hz for anterior and posterior corneal surfaces. The images demonstrate quantitative modifications in both the anterior and posterior surfaces during the presence of the sound pressure.

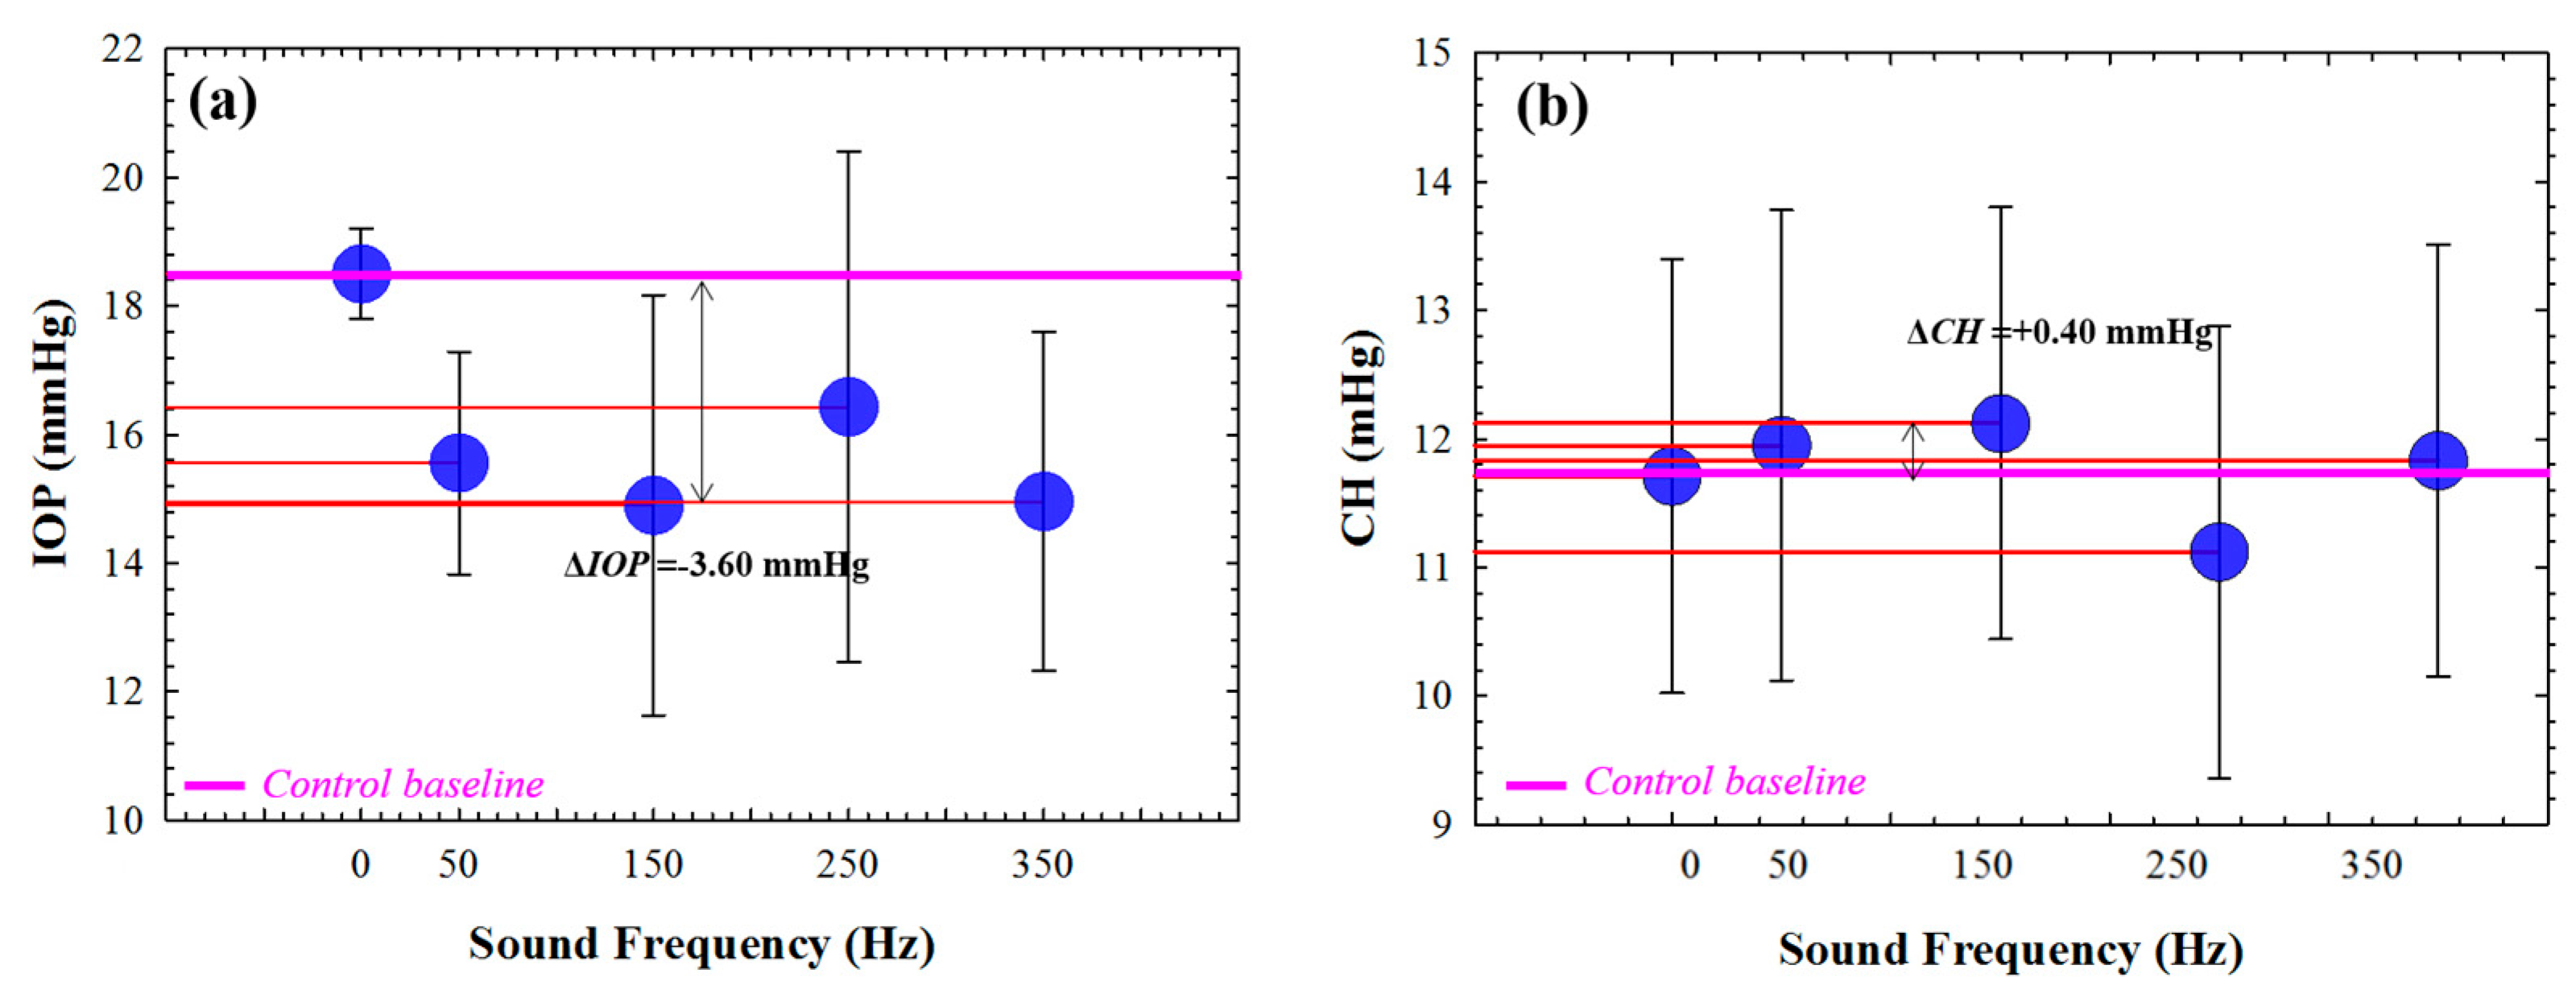
3.2. Biomechanical Variations and Sound Frequency

The previous section showed how the frequency modulation of the sound pressure at a constant signal amplitude can induce slight changes in corneal shape, specifically in the central thickness, to the order of a few microns. These changes, unlike those produced via air-puff tonometry at a macroscopic scale, are microscopic in nature. However, even at the microscopic scale, this section presents evidence of how acoustic pressure can induce measurable biomechanical changes in the cornea. Figure 5 shows the mean IOP values for six healthy young adult subjects as a function of the sound frequency. The average control value falls within the normal range established between 11 and 21 mmHg [27]. According to our findings, the IOP is reduced for all the tested frequencies (Figure 5a), reaching a minimum value at 150 Hz that corresponds to an absolute difference of 3.60 mmHg with respect to the control baseline (pink line).
Regarding the viscoelastic property measured using the CH parameter, it shows a maximum value (an increase of 0.40 mmHg with respect to the average control value) for 150 Hz. Those preliminary results suggest that the application of acoustic waves can alter the corneal biomechanics, specifically reducing both the IOP and CH at a specific sound frequency of 150 Hz.
The air-puff system enables the acquisition of stress–strain dynamic measurements during the duration of the air pulse. Figure 6 illustrates a comparison of the air pulse pressure curves and corneal applanation responses (averaged value of the six volunteers) under normal operation (with the acoustic wave generator off) and with the application of acoustic wave pressure at 150 Hz. It can be observed that the application of external sound pressure causes less air pressure to reach the first applanation of the cornea (Figure 6a). This fact can be associated with reduced corneal stiffness, which aligns with the results presented in Figure 6b, where the first applanation occurs earlier when acoustic waves are applied. It is noteworthy that in Figure 6b, an intersection is observed on the left side of the graph between the applanation curves corresponding to normal measurements (blue line) and measurements taken during acoustic pressure (green line). A statistical comparison was performed via applying Student’s t-test, revealing significant differences in both air-puff pressure (p = 0.036) and applanation waveforms (p = 0.039), respectively.
While the cornea still undergoes deformation due to the air pressure (sound off), the effect of acoustic interaction alters the viscoelastic properties over time, causing the cornea to begin relaxation at a point where it is still deforming.

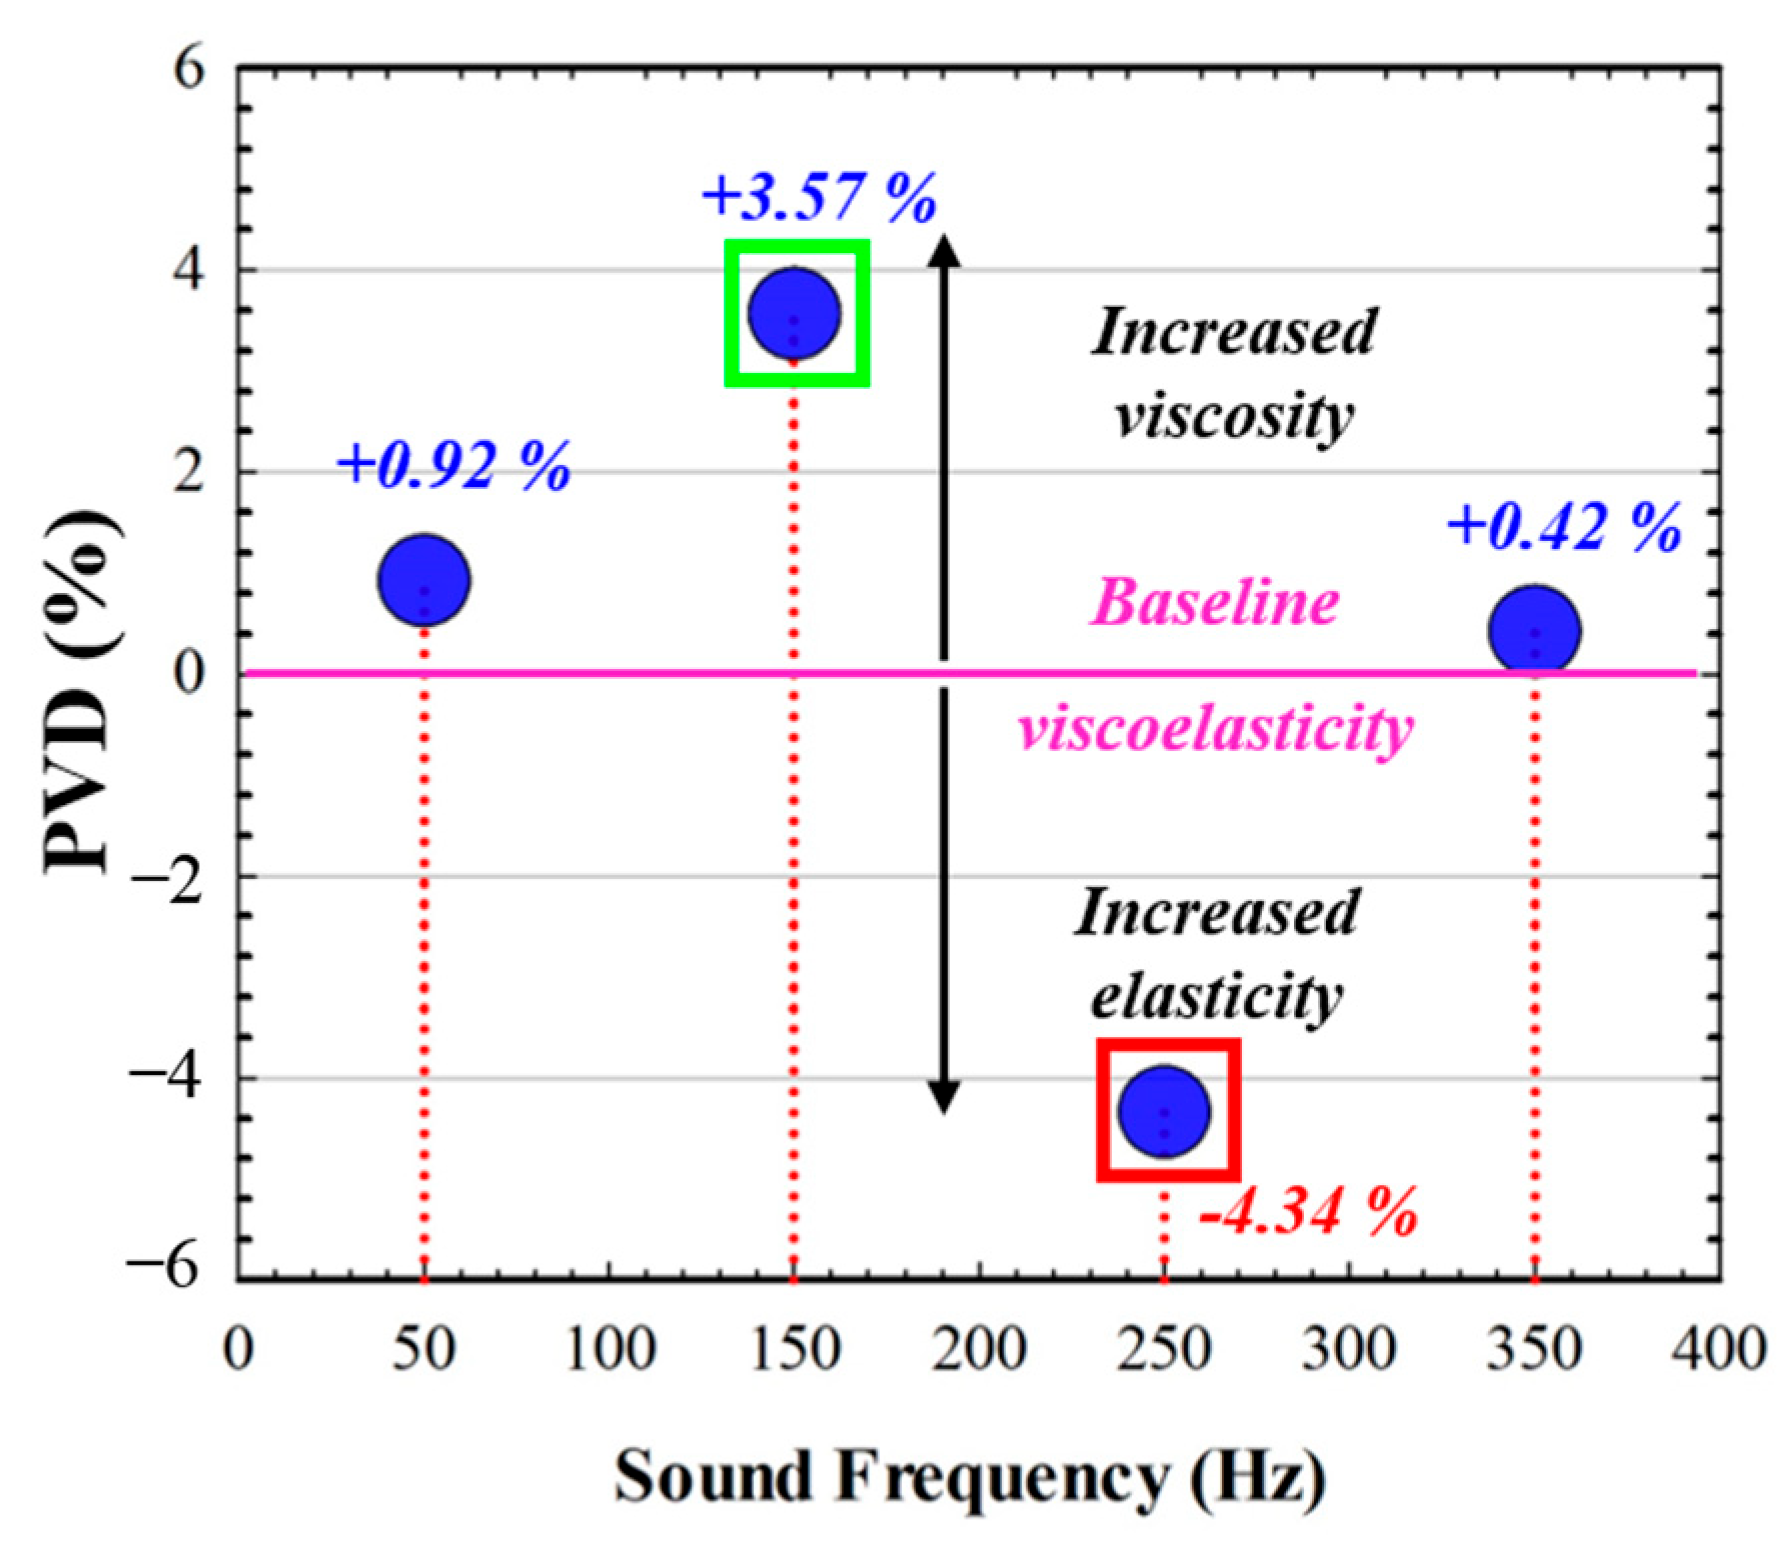
Pneumatic Viscoelastic Damping for Different Sound Wave Frequencies

Figure 7 shows the PVD values for different sound frequencies. At the specific frequency of 150 Hz, the PVD showed a maximum value of +3.75% (green box) which corresponds to an increased viscosity with respect to the baseline viscoelasticity (pink line). In agreement with the data shown in Figure 5b, the maximum PVD value occurs for the same sound frequency at which an increasing CH is observed. On the contrary, negative values for PVD (red box in Figure 7) correspond to decreased CH values with respect to the control baseline.

3.3. Shape and Biomechanical Stability during Cornea and Acoustic Wave Interactions

The previous sections showed how the application of acoustic pressure by means of our proposed acoustic wave generator can alter the corneal shape at a microscopic scale and modify its biomechanical properties. This raises the question of whether these changes remain stable over time or whether they fluctuate randomly. To address this question, we conducted four consecutive measurements on a volunteer while applying the specific frequency of 150 Hz using both Scheimpflug imaging and the ORA analyzer. The results of these measurements are presented in Figure 8.

4. Discussion and Conclusions

The corneal shape and transparency are related to biomechanical properties, and the elastic component plays a dominant role [31]. Based on the corneal pneumatic tonometry concept [29], we developed a clinically orientated instrument to deliver acoustic waves to the corneal plane by combining a function/arbitrary waveform generator and a wide-range subwoofer mounted in a vertical orientation. The system was first calibrated via placing a digital sound meter at the position at which the corneal apex should be aligned. Sinusoidal signals at two different peak-to-peak amplitude voltages (1 and 2 Vpp.) were generated within the range frequency of 50–350 Hz (50 Hz step), obtaining a maximum sound pressure around 90 dB (see Figure 1) at the maximum frequency (350 Hz).
As a proof of concept, we tested the instrument on six healthy volunteers in a lab-conducted experiment. In the experimental set up, two commercially available ophthalmic devices were employed to establish a set of measurements of biomechanics and corneal biometry using the Ocular Response Analyzer (ORA, Reichter) and dual Scheimpflug tomography and Placido topography (Ziemer Ophthalmic Systems, AG) systems.
Previously to our work, Akca et al. [25] reported the observation of three corneal vibrational modes using sound waves within the frequency range of 50–400 Hz in ex vivo bovine ocular globes. They found a vibration amplitude of ~8 µm for a fundamental mode in the range of 80–120 Hz and at the sound pressure level of 100 dB.
In our work, we delivered acoustic sinusoidal acoustic waves in the frequency range of 50–350 Hz (1 Vpp. amplitude) and a 90 dB pressure level at the living human cornea, using a custom corneal acoustic waveform generator (see the description in Section 2.1). Corneal changes were visualized using a dual Scheimpflug camera and Placido rings analyzer and an Ocular Response Analyzer to monitor the corneal structure and biomechanics, respectively.
We found a reduction in the central corneal thickness of 7.33 µm at the sound frequency of 150 Hz together with a flattening of the corneal eccentricity of 0.058 (e2) (see Figure 3). These results are visualized in the elevation maps shown in Figure 4. The application of acoustic waves can then induce measurable axial deformation in the cornea that is consistent with the results of Akca et al. [25] in ex vivo corneas.
On the one hand, the application of acoustic waves induces an IOP decrease (on average) from 18.5 ± 0.71 to 14.9 ± 3.27 mmHg at a sound frequency of 150 Hz; this induced change is within the reported physiological transient variations in the IOP [32,33].
In this sense, corneal hysteresis (CH) reacts to elevated IOP levels, rendering the tissue more elastic and reducing the viscous component; this alteration in CH due to an elevated IOP is considered a biomarker of glaucoma disease [27]. Agarwal et al. [34] evaluate the relationship between the IOP and CH before and after applying prostaglandin analogue therapy in 57 patients with glaucoma; they found a correlated reduction in the IOP of 18.8%, with increased CH in 5.2%. Our results showed an IOP reduction of 19.46% and an increase in CH of 3.5% during acoustic pressure application with respect to the baseline reference values (see Figure 5), which are in agreement with those reported by Agarwal et al.
On the other hand, Herndon et al. [35] compared the CCT values in normal and hypertensive eyes; they found significantly greater CCT values in normal eyes compared with those of ocular hypertension patients. In addition, the positive linear correlation between the CCT and IOP was demonstrated by Wei et al. [36] in a healthy young population, so a decrease in IOP implies a reduction in CCT. In good agreement, our results showed a reduction in CCT of 1.16% as a consequence of the decrease of 18.8% in IOP as a consequence of acoustic pressure application at 150 Hz.
Finally, the pneumatic viscoelastic damping (PVD) concept was introduced as the adaptive capability of the human cornea to modify its viscoelasticity by modulating the elastic and viscous components when low-magnitude external forces are loaded, such as sound wave pressures. We found two specific sound frequencies at which both scenarios occur: at 150 Hz, PVD showed positive values that correspond to a mean increase of +0.40 in CH and maximum corneal deformation (see Figure 3), consistent with an increased viscous component. On the contrary, at 250 Hz the PVD turned into negative values that are (as described in Section 2.3.3) related to an increased elastic component.
These preliminary results suggest that the corneal shape and biomechanical alterations due to sound wave pressure depend not only on the minimum pneumatic load to interact with the tissue but also on the specific oscillating frequency.
To conclude, we present a new and versatile system to generate acoustic waves for corneal applications. As a proof of concept, the system was tested on six volunteers, delivering a maximum sound pressure of 90 dB of sinusoidal acoustic waves at the range of 50–350 Hz (50 Hz step size). At the given frequency of 150 Hz, we found corneal deformation and changes in both IOP and CH that are consistent with those in the reported literature. Therefore, the application of acoustic waves allows us to modify the corneal biomechanics and the structure of the cornea in physiological transient physiological variations.
The main limitations were the small size of the sample, which did not allow the whole statistical analysis of the results, although the main goal was to demonstrate a proof of concept of biomechanical response in the human cornea’s interaction with acoustic waves. The exposure time to sound waves was 10 s per measure to ensure continuous acoustic pressure before, while, and just after Scheimpflug and air-puff tonometry measures. The upcoming clinical study will include larger sound pressure exposure times to track whether changes in corneal biomechanics occur due to the time-dependent properties associated to the viscous damping nature of the human stroma. Future work will include a clinical study in a large population as a function of age and pathological conditions such as hypertensive and glaucomatous eyes, including contact lens wearers, and patients undergoing refractive surgery and minimally invasive glaucoma surgery. Those future steps will allow us to investigate changes in PVD over time.

Author Contributions

Conceptualization, F.J.Á.; methodology, F.J.Á., M.C.M. and L.R.; formal analysis, F.J.Á.; investigation, M.C.M. and L.R.; writing—original draft preparation, F.J.Á.; writing—review and editing, F.J.Á., M.C.M. and L.R.; project administration, F.J.Á.; funding acquisition, F.J.Á. All authors have read and agreed to the published version of the manuscript.

Funding

This research was funded by FUNDACIÓN BANCARIA IBERCAJA, grant number, 223221: JIUZ-2021-CIE-01.

Institutional Review Board Statement

The study was conducted in accordance with the Declaration of Helsinki, and approved by the Ethics Committee of the Health Sciences Institute of Aragon, Spain. (protocol code: C.P.-C.I. PI20/377, date of approval: 14 July 2020).

Informed Consent Statement

Informed consent was obtained from all subjects involved in the study.

Data Availability Statement

Data are contained within the article.

Acknowledgments

The authors thank Julio Amaré and Juanjo Lanuza from the “Departamento de Fisica Aplicada” of the University of Zaragoza for their technical support in the electronic design and mechanical assembly of the corneal waveform generator.

Conflicts of Interest

The authors declare no conflict of interest.

References

  1. Piñero, D.P.; Alcón, N. Corneal biomechanics: A review. Clin. Exp. Optom. 2015, 98, 107–116. [Google Scholar] [CrossRef]
  2. Kling, S.; Hafezi, F. Corneal biomechanics—A review. Ophtalmic. Physiol. Opt. 2017, 37, 240–252. [Google Scholar] [CrossRef]
  3. Wilson, A.; Marshall, J. A review of corneal biomechanics: Mechanisms for measurement and the implications for refractive surgery. Indian J. Ophthalmol. 2020, 68, 2679–2690. [Google Scholar] [PubMed]
  4. Meek, K.M. Corneal collagen-its role in maintaining corneal shape and transparency. Biophys. Rev. 2009, 1, 83–93. [Google Scholar] [CrossRef] [PubMed]
  5. Fernández, J.; Rodríguez-Vallejo, M.; Martínez, J.; Tauste, A.; Piñero, D.P. Corneal biomechanics after laser refractive surgery: Unmasking differences between techniques. J. Cataract. Refract. Surg. 2018, 44, 390–398. [Google Scholar] [CrossRef] [PubMed]
  6. Cao, K.; Liu, L.; Yu, T.; Chen, F.; Bai, J.; Liu, T. Changes in corneal biomechanics during small-incision lenticule extraction (SMILE) and femtosecond-assisted laser in situ keratomileusis (FS-LASIK). Lasers Med. Sci. 2020, 35, 599–609. [Google Scholar] [CrossRef]
  7. Wallace, H.B.; McKelvie, J.; Green, C.R.; Misra, S.L. Corneal Curvature: The Influence of Corneal Accommodation and Biomechanics on Corneal Shape. Transl. Vis. Sci. Technol. 2019, 8, 5. [Google Scholar] [CrossRef]
  8. Wu, D.; Liu, C.; Li, B.; Wang, D.; Fang, X. Influence of Cap Thickness on Corneal Curvature and Corneal Biomechanics After SMILE: A Prospective, Contralateral Eye Study. J. Refract. Surg. 2020, 36, 82–88. [Google Scholar] [CrossRef]
  9. Kaushik, S.; Pandav, S.S. Ocular Response Analyzer. J. Curr. Glaucoma Pract. 2012, 6, 17–19. [Google Scholar] [CrossRef]
  10. Du, Y.; Zhang, Y.; Zhang, Y.; Li, T.; Wang, J.; Du, Z. Analysis of potential impact factors of corneal biomechanics in myopia. BMC Ophthalmol. 2023, 23, 143. [Google Scholar] [CrossRef]
  11. Choi, E.J.; Kim, K.N.; Song, M.Y.; Hwang, Y.H. Correlation between Interocular Asymmetry of Corneal Hysteresis and Visual Field Defect in Glaucoma. Korean J. Ophthalmol. 2023, 37, 112–119. [Google Scholar] [CrossRef] [PubMed]
  12. Marcellán, M.C.; Remón, L.; Ávila, F.J. Corneal hysteresis and intraocular pressure are altered in silicone-hydrogel soft contact lenses wearers. Int. Ophthalmol. 2022, 42, 2801–2809. [Google Scholar] [CrossRef] [PubMed]
  13. Sedaghat, M.R.; Momeni-Moghaddam, H.; Kangari, H.; Moradi, A.; Akbarzadeh, R.; Naroo, S.A. Changes in corneal biomechanical parameters in keratoconus eyes with various severities after corneal cross-linking (CXL): A comparative study. Eur. J. Ophthalmol. 2023, 3, 2114–2122. [Google Scholar] [CrossRef] [PubMed]
  14. Baptista, P.M.; Ambrosio, R.; Oliveira, L.; Meneres, P.; Beirao, J.M. Corneal Biomechanical Assessment with Ultra-High-Speed Scheimpflug Imaging During Non-Contact Tonometry: A Prospective Review. Clin. Ophthalmol. 2021, 15, 1409–1423. [Google Scholar] [CrossRef]
  15. Karmiris, E.; Tsiripidis, K.; Gartaganis, P.S.; Totou, S.; Vasilopoulou, M.G.; Patelis, A.; Giannakis, I.; Chalkiadaki, E. Comparison of intraocular pressure obtained by Goldmann applanation tonometer, Corvis ST and an airpuff tonometer in healthy adults. Eur. J. Ophthalmol. 2021, 32, 951–959. [Google Scholar] [CrossRef]
  16. Eltony, A.M.; Shaom, P.; Yun, S.H. Measuring mechanical anisotropy of the cornea with Brillouin microscopy. Nat. Commun. 2022, 13, 1354. [Google Scholar] [CrossRef]
  17. Sun, M.G.; Son, T.; Crutison, J.; Guaiquil, V.; Lin, S.; Nammari, L.; Klatt, D.; Yao, X.; Rosenblatt, M.I.; Royston, T.J. Optical coherence elastography for assessing the influence of intraocular pressure on elastic wave dispersion in the cornea. J. Mech. Behav. Biomed. Mater. 2022, 128, 105100. [Google Scholar] [CrossRef]
  18. Lan, G.; Twa, M.D.; Song, C.; Feng, J.; Huang, Y.; Xu, J.; Qin, J.; An, L.; Wei, X. In vivo corneal elastography: A topical review of challenges and opportunities. Comput. Struct. Biotechnol. J. 2023, 21, 2664–2687. [Google Scholar] [CrossRef]
  19. Qin, X.; Tian, L.; Zhang, H.; Zhang, D.; Jie, Y.; Zhang, H.X.; Li, L. Determine Corneal Biomechanical Parameters by Finite Element Simulation and Parametric Analysis Based on ORA Measurements. Front. Bioeng. Biotechnol. 2022, 10, 862947. [Google Scholar] [CrossRef]
  20. Hsu, F.L.; Shih, P.J.; Wang, I.J. Development and validation of an intuitive biomechanics-based method for intraocular pressure measurement: A modal analysis approach. BMC Ophthalmol. 2023, 23, 124. [Google Scholar] [CrossRef]
  21. Zhao, G.P.; Zhai, H.T.; Xiang, H.Z.; Wu, L.M.; Chen, Q.O.; Chen, C.; Zhou, M. Biomechanical study of cornea response under orthokeratology lens therapy: A finite element analysis. Int. J. Numer. Methods Biomed. Eng. 2023, 39, e3691. [Google Scholar] [CrossRef]
  22. Wardosanidze, Z.V. About the possible acoustic functions of the eye. Am. J. Biom. Sci. Res. 2021, 15, 79–81. [Google Scholar] [CrossRef]
  23. Coquart, L.; Depeursinge, C.; Gurnier, A.; Ohayon, R. A fluid-structure interaction problem in biomechanics: Prestressed vibrations of the eye by the finite element method. J. Biomech. 1992, 25, 1105–1118. [Google Scholar] [CrossRef] [PubMed]
  24. Shih, P.J.; Guo, Y.R. Resonance frequency of fluid-filled and prestressed spherical shell—A model of the human eyeball. J. Acoust. Soc. Am. 2016, 139, 1784. [Google Scholar] [CrossRef] [PubMed]
  25. Akca, B.I.; Chang, E.W.; Kling, S.; Ramier, A.; Scarcelli, G.; Marcos, S.; Yun, S.H. Observation of sound-induced corneal vibrational modes by optical coherence tomography. Biomed. Opt. Express 2015, 6, 3313–3319. [Google Scholar] [CrossRef]
  26. Ramier, A.; Tavakol, B.; Yun, S.H. Effect of intraocular pressure on the vibrational resonance of the cornea measured by optical coherence tomography. Investig. Ophthalmol. Vis. Sci. 2017, 58, 4326. [Google Scholar]
  27. Zimprich, L.; Diedrich, J.; Bleeker, A.; Schweitzer, J.A. Corneal Hysteresis as a Biomarker of Glaucoma: Current Insights. Clin. Ophthalmol. 2020, 14, 2255–2264. [Google Scholar] [CrossRef]
  28. Jammal, A.A.; Medeiros, F.A. Corneal hysteresis: Ready for prime time? Curr. Opin. Ophthalmol. 2022, 33, 243–249. [Google Scholar] [CrossRef]
  29. Walter, R.E.; Kitovitz, T.L. An experimental and theoretical study of the pneumatic tonometer. Exp. Eye Res. 1972, 13, 14–23. [Google Scholar]
  30. Kobayashi, A.S.; Staberg, L.G.; Schlegel, W.A. Viscoelastic properties of the human cornea. Exp. Mech. 1973, 13, 497–503. [Google Scholar] [CrossRef]
  31. Ávila, F.J.; Marcellán, M.C.; Remón, L. On the relationship between corneal biomechanics, macrostructure, and optical properties. J. Imaging 2021, 7, 280. [Google Scholar] [CrossRef] [PubMed]
  32. Martin, X.D. Normal intraocular pressure in man. Ophthalmologica 1992, 205, 57–63. [Google Scholar] [CrossRef] [PubMed]
  33. Bakke, E.F.; Hisdal, J.; Semb, S.O. Intraocular Pressure Increases in Parallel with Systemic Blood Pressure during Isometric Exercise. Investig. Opthalmol. Vis. Sci. 2009, 50, 760–764. [Google Scholar] [CrossRef]
  34. Agarwal, D.; Ehrlich, J.; Shimmyo, M.; Radcliffe, N. The relationship between corneal hysteresis and the magnitude of intraocular pressure reduction with topical prostaglandin therapy. Br. J. Ophthalmol. 2011, 96, 254–257. [Google Scholar] [CrossRef]
  35. Herndon, L.W.; Choudhri, S.A.; Cox, T.; Damji, K.F.; Shields, M.B.; Allingham, R.R. Central corneal thickness in normal, glaucomatous, and ocular hypertensive eyes. Arch. Ophthalmol. 1997, 115, 1137–1141. [Google Scholar] [CrossRef] [PubMed]
  36. Wei, W.; Fan, Z.; Wang, L.; Li, Z.; Jiao, W.; Li, Y. Correlation Analysis between Central Corneal Thickness and Intraocular Pressure in Juveniles in Northern China: The Jinan City Eye Study. PLoS ONE 2011, 9, e104842. [Google Scholar] [CrossRef] [PubMed]
Figure 1. (a) Schematic of the corneal acoustic wave generator. (b) Real picture of the apparatus in real-time operation. FWG represents the waveform generator for acoustic waves, SA is the sound amplifier, and SW is a subwoofer that emits the sound wave directed towards the eyeball.
Optics 04 00043 g001
Figure 2. Measured sound pressure (in dB) as a function of the sound frequency for two different Vpp amplitudes generated at the FWG.
Optics 04 00043 g002
Figure 3. Averaged (mean and standard deviation of the six participants) corneal eccentricity (a) and central corneal thickness (b) measured as a function of the sound frequency. Red lines intersect the mean values for e2 and CCT.
Optics 04 00043 g003
Figure 4. Scheimpflug output elevation maps corresponding to a regular measurement (upper row, instrument off) and a measurement during the acoustic wave generator operating at 150 Hz. The right and left column correspond to anterior and posterior corneal surface elevation, respectively.
Optics 04 00043 g004
Figure 5. The averaged (mean and standard deviation of the six participants) IOP (a) and CH (b) measured as a function of the sound frequency. Red lines intersect the mean values for IOP and CH.
Optics 04 00043 g005
Figure 6. The air-puff pressure and applanation averaged response curves during an air-pulse time lapse for a normal measurement (a) and during acoustic pressure application (b).
Optics 04 00043 g006
Figure 7. PVD (%) mean values as a function of the sound frequency. Vertical red dotted lines show the relative position of the mean PVD values with respect to the baseline viscoelasticity. Green and red boxes indicate the maximums positive and negative minimums PVD values, respectively.
Optics 04 00043 g007
Figure 8. Sequential CCT and IOP measurements in one volunteer at the same experimental conditions (acoustic generator operating at 150 Hz and 1 Vpp). (a,b) Horizontal black lines represent the reference bands for the experimental values (central, upper and lower correspond to mean and control lines for a standard deviation error of ±1%, respectively). ΔCCTmax and ΔIOPmax are the maximum variation found for CCT and IOP values, respectively.
Optics 04 00043 g008
Table 1. Summary of the parameters measured in the experimental procedure. CCT: central corneal thickness; IOP: intraocular pressure; CH: corneal hysteresis.
Shape ParametersBiomechanical Parameters
CCT (µm)IOP (mmg)
Eccentricity (e2)CH (mmHg)
Disclaimer/Publisher’s Note: The statements, opinions and data contained in all publications are solely those of the individual author(s) and contributor(s) and not of MDPI and/or the editor(s). MDPI and/or the editor(s) disclaim responsibility for any injury to people or property resulting from any ideas, methods, instructions or products referred to in the content.

