Article

Understanding the Real Effect of the High-Order Aberrations after Myopic Femto-Lasik

1
Grupo de Óptica y Percepción Visual (GOPV), Department of Optics, Pharmacology and Anatomy, University of Alicante, Carretera San Vicente, s/n, 03690 San Vicente del Raspeig, Spain
2
Oftalica Alicante, Avda. Padre Esplá, 58, 03013 Alicante, Spain
*
Author to whom correspondence should be addressed.
Optics 2022, 3(4), 384-399; https://doi.org/10.3390/opt3040033
Submission received: 27 June 2022 / Revised: 14 September 2022 / Accepted: 19 September 2022 / Published: 9 October 2022
(This article belongs to the Special Issue Advances in Vision Optics, Myopia Control and Refractive Surgery)

Abstract

:
In this work we try to understand the real effect of increase in aberrations after Femto-LASIK surgery on the patient’s final visual quality, specifically when the visual acuity measurement is considered. A clinical study with 37 eyes of 20 patients that underwent myopic Femto-LASIK surgery and different personalized eye model simulations were carried out. In clinical study, correlations between pre- and postoperative parameters with visual acuity were analysed. Eye simulations (based on real data) provided simulations of vision quality before and after surgery. Our main results showed a significant increase in aberrations was obtained after surgery; however, no differences were found between the preoperative corrected distance visual acuity (CDVA) and the postoperative uncorrected distance visual acuity (UDVA). This absence of differences in visual quality could be explained by performing different simulations on three eyes that would cover most of the possible clinical situations. Simulations were implemented considering a pupil size of 2.5 mm and the personalized data of each patient. Results showed that final visual acuity (VA) change are determined by the final high-order aberrations (HOAS) and their increase after surgery but measured under photopic conditions. In conclusion, customized analysis of higher-order aberrations in scotopic pupils better predicts patient visual acuity after Lasik surgery.

1. Introduction

One of the most revolutionary breakthroughs in the world of refractive surgery has been the use of the laser in situ keratomileusis (LASIK) technique. LASIK surgery is widely used in the correction of refractive errors and involves the creation of an anterior lamella or flap, followed by stromal photoablation using an excimer laser [1]. The creation of this flap is an important step in the surgical procedure and can be performed by a mechanical microkeratome or more recently using a femtosecond laser (FS laser). The FS laser aims to improve the predictability of refractive surgery and avoid its complications [2,3]. It is well known that LASIK surgery induces high-order aberrations (HOA) that can produce night vision problems, such as halos, glare and deterioration of contrast function [4,5]. The main eye element involved in the generation of such aberrations is the first corneal surface [6,7,8], with the contribution of the second corneal surface being minimal and not significant as many authors reported [9]. Scientific literature has shown that myopic LASIK refractive surgery treatment produces a change in corneal asphericity, making it more positive [10], and this change is directly correlated with an increment of the spherical aberration. Furthermore, other high-order aberrations such as coma are increased after LASIK surgery [8,11].
An important criterion to assess the success of the surgery is the efficacy index defined as the ratio of mean postoperative uncorrected distance vision (UDVA) to the mean preoperative corrected distance vision (CDVA). LASIK surgery has been demonstrated to be a safe and effective surgery. Thus, when comparing preoperative CDVA and postoperative UDVA, both values are similar and close to 1 [11,12,13,14] on the decimal scale. These results are to some extent contradicted by the fact that high-order aberrations are significantly increased after surgery. An impairment of visual acuity should be expected resulting in an efficacy index clearly below unity.
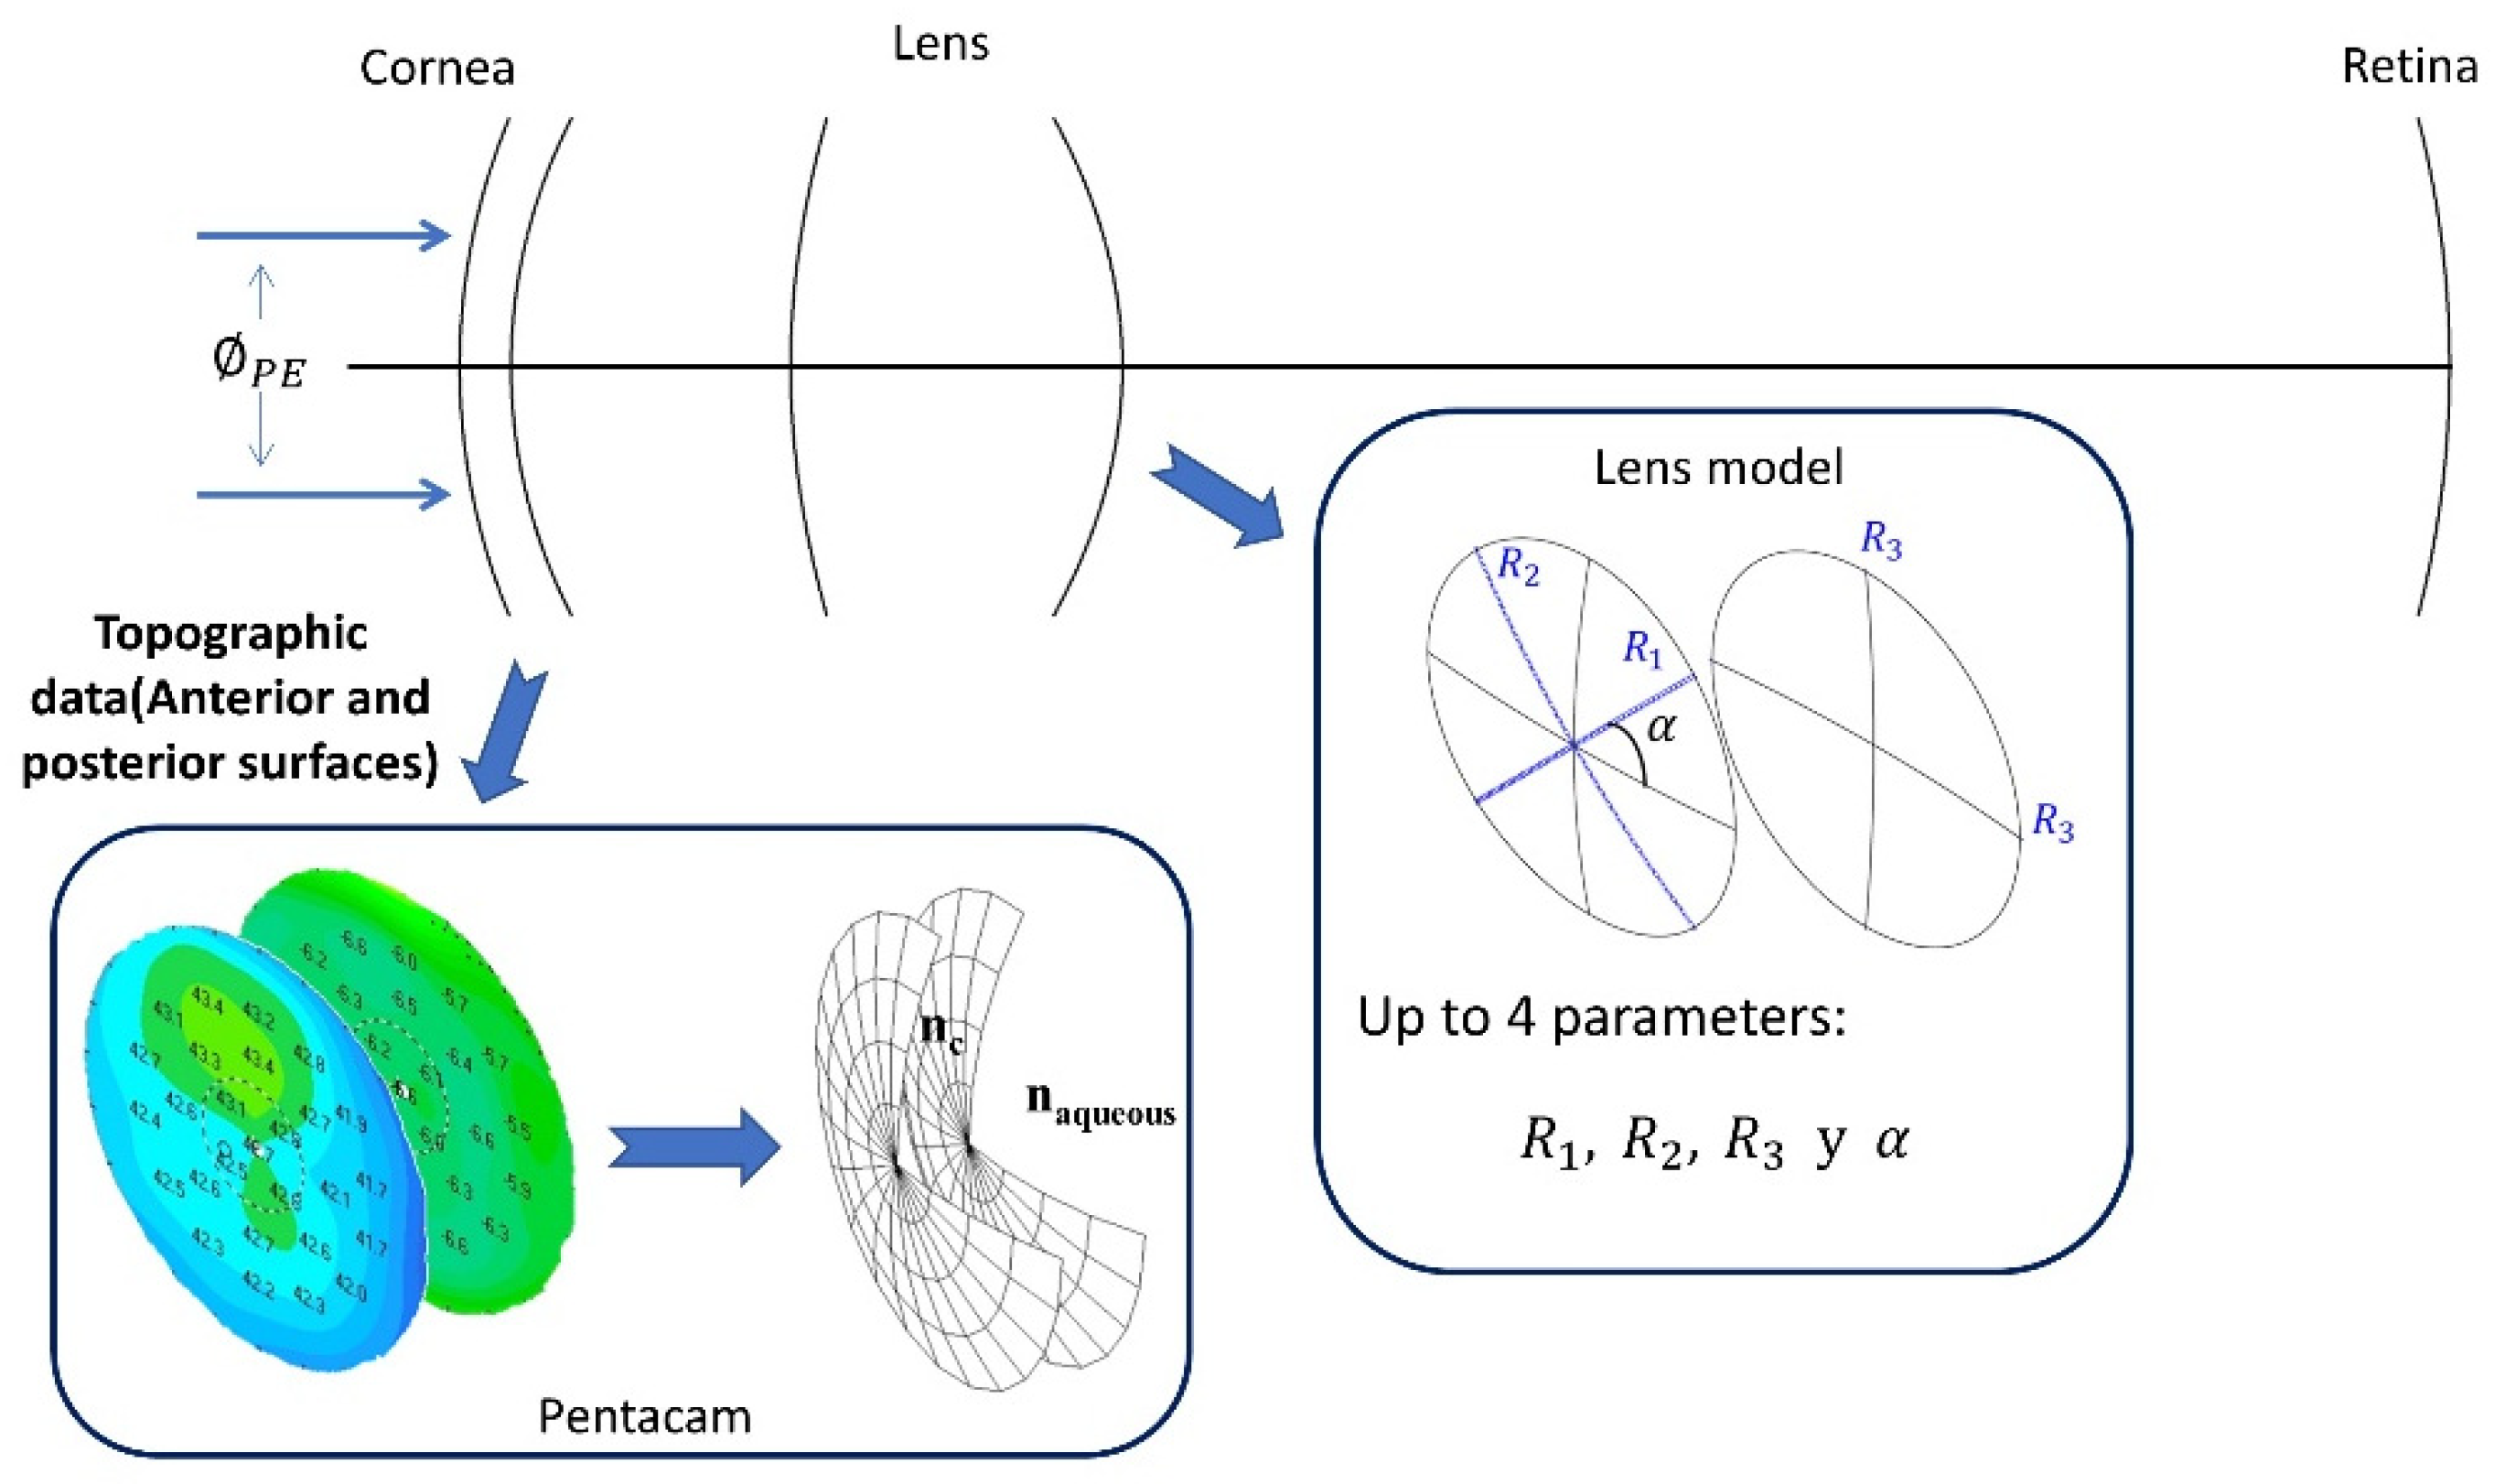
This study aims to understand the real effect of the aberrations increment after LASIK surgery on the final patient visual quality, specifically when the visual acuity measurement is considered. For this purpose, a clinical study and different personalized eye model simulations are performed. In clinical study, correlations between pre- and postoperative parameters with visual acuity are analyzed. Similarly, eye simulations (based on topographic and biometric data of real patients) provide an insight of the quality of vision before and after surgery.

2. Methods

2.1. Clinical Study

Patients

In total, 37 eyes of 20 patients that underwent myopic Femto-LASIK surgery were included in this retrospective study. First examination was carried out in the following 24 or 48 h after surgery. A second examination was performed between 1 week and 1 month after surgery and finally a third examination between 6 months and 1 year after the surgery. Patients attended the refractive surgery service of the Alicante Oftalica Clinic center between February 2019 and March 2021. All procedures complied with the principles of the Declaration of Helsinki. Informed consent was obtained from each patient before surgery. Only patients with myopia with or without astigmatism, older than 18 years and whose pre- and postoperative data were available were included. Patients with hyperopia, whose post-surgery check-ups were not between 1 week and a year after the operation, and with some previous eye surgeries were excluded. Clinical data were collected from the last examination realized between 6 months and 1 year.

2.2. Clinical Data

Preoperatively, corrected distance visual acuity (CDVA), axial length and corneal tomography were measured. In addition, postoperative uncorrected distance visual acuity (UDVA) was also measured. A detailed examination of the anterior and posterior segment was performed using a slit lamp before and after surgery.
A rotating Scheimpflug imaging technology (Pentacam®) [15] was used to obtain the corneal tomography. Pre- and postoperative corneal thickness, corneal radius (front and back), asphericity, root mean square of high order aberrations up to the 6th order (RMS HOAS), spherical aberration (SE) and root mean square of coma (RMS coma) were measured. All Zernike coefficients were initially calculated for a pupil diameter of 6.0 mm.

2.3. Statistical Analysis

Statistical analysis was performed with the SPSS computer program [16]. The Shapiro–Wilk test for sample size lower than 50 was used to check the normality of the data (significance level p < 0.05). The Student’s t-test or Wilcoxon test was used for paired groups in the variables that followed a normal or no normal distributions, respectively. Spearman’s correlation coefficient (not all variables had normal distribution) was obtained to know correlations between the preoperative spherical equivalent and the difference in asphericity, spherical aberration, RMS coma and RMS HOAS.

2.4. Simulations

Based on previous works [17,18], a customized model of the eye was implemented incorporating topographic and biometric data of the patient (topographies of the first and second surface of the cornea, corneal thickness (CT), anterior chamber depth (ACD) and the axial length (AL)) obtained from Pentacam. First step was to build an individual eye model using the preoperative Pentacam data of the patient, particularly, the heights of the first and second cornea surfaces were fitted to a Zernike polynomials series in a 6 mm diameter and inserted in a Zemax file as “Zernike standard sag” surfaces, while CT, ACD and AL were considered to positioning the second corneal surface, the lens, and the retina, respectively. For the refractive index value of the different mediums and the retina curvature, a generic eye model was followed [19].
With respect to the lens, we used a four parameters lens model (biconic first surface and spherical second surface (see Figure 1)). The values of the four variables (R1, R2, α, and R3) were optimized based on the patient refractive error. This process implied to insert an ideal Gaussian thin lens with the patient subjective refractive correction in front of the cornea of the model and demanding minimal RMS spot size. In the optimization process, radii are allowed to vary within a realistic range of values [20], and the entrance pupil diameter is fixed to 2.5 mm. In this way, we have assembled a customized eye model that adequately represents the patient’s eye under photopic conditions (2.5 mm). Conditions under which VA is clinically measured and on which we focused in our simulations.
For the evaluation of the post-surgery eye we extracted, from the preoperative model, the ideal Gaussian thin lens and substitute of the elevation maps of the two cornea surfaces by the post operative ones took account of the new CT.
From the eye models, point spread function (PSF) and an E-Snellen optotype vision simulation corresponding to VA = 1 were obtained. The optical performance of all simulations was obtained after combining ray tracing and Fourier optics (Zemax, LLC Washington, USA and MATLAB, The MathWorks, Natick, MA, USA).
In this study three clinical cases were simulated and analyzed. The criteria for selection of these eyes was to cover the most of possible clinical situations. Consequently, Eye 1 was chosen to explain those cases in which preoperative CDVA and postoperative UCVA were very similar, but an impairment of VA was expected due to the increase of aberrations after surgery. Eye 2 explained what occurs when postoperative UCVA is better than preoperative CDVA even if postoperative aberrations were increased. Finally, Eye 3 was chosen to explain those cases with preoperative CDVA better than postoperative UCVA and with higher postoperative high-order aberrations.

3. Results

3.1. Clinical Study

Table 1 shows the mean clinical parameters measured pre- and postoperatively. Patients were aged between 22 and 41 years (31.60 ± 5.12 years) with a preoperative sphere of −2.61 ± 1.36 D (range [−5.25, 0] D), cylinder of −0.62 ± 0.82 (range [−2.75, 0] and a corresponding preoperative sphere equivalent of −2.92 ± 1.14 D (range [−5.25, −0.75] D. The axial length of the patients ranged between 23.48 and 26.51 mm (mean of 25.16 ± 0.72 mm). Differences before and after surgery between parameters as anterior corneal radius, asphericity or pachymetry were significant (p < 0.05). In addition, the change in posterior corneal radius was also significant, but this difference cannot be considered clinically relevant because the mean difference was around 0.02 mm.
As seen in Table 1, differences between the preoperative CDVA and the postoperative UDVA were not significant. This result agreed with the cumulative percentages of eyes reaching specific levels of UDVA and in the change of Snellen lines obtained after surgery (Figure 2 left). There was a higher percentage of patients with VA = 1 after than before surgery and 80% of eyes improved one line or maintained the visual acuity (Figure 2 right).
As shown in Table 2, anterior corneal surface generated most of the total aberrations of the cornea. Therefore, values obtained for the anterior corneal surface and total cornea were very close. HOAS RMS significantly increased a mean value of 0.24 µm after surgery reaching values higher than 0.5 µm (p < 0.001). SA and RMS coma also increased significantly by 0.07 µm and 0.016 µm on average, respectively (p < 0.05). Even though the change of spherical aberration was significant, the second corneal surface contribution cannot be considered clinically relevant because only a minimal variation of 0.01 µm in SA was found.

3.2. Correlations

Correlations between the preoperative SE and the change in asphericity, SA, RMS coma and HOAS RMS were significant (Table 3). Aberrations increased as preoperative SE was higher (see Figure 3A–D). Asphericity and SA showed the highest correlations (r = −0.880, p < 0.001 and r = −0.693, p < 0.001, respectively).
However, the significant increase in aberrations after surgery did not lead to significant differences between the preoperative CDVA and postoperative UDVA. No worsening of vision quality was observed after surgery. Why this behavior? Why was the significant increase in aberrations not influencing the final visual quality? To answer and understand these questions, simulations using real patient data were proposed.

3.3. Simulation

As commented in the methodology section, 3 eyes of 3 patients were selected for this study. These eyes were carefully chosen in order to cover the most range of possible real cases. Eye 1 would attempt to explain why preoperative CDVA and postoperative UCVA were very similar if an increase of aberrations after surgery occurred. Eye 2 could help to understand why the postoperative UCVA is better than preoperative CDVA even if postoperative aberrations were increased. Finally, Eye 3 would provide an explanation for cases with preoperative CDVA better than postoperative UCVA and with higher postoperative high order aberrations.
For this purpose, from elevation maps of each eye, simulations were performed for pupil entrance of 6 mm and 2.5 mm. For each pupil size, the PSF function and vision simulation of an E-Snellen optotype corresponding to a VA = 1 were obtained.

3.4. EYE 1

A 34-year-old man with a preoperative refraction of −3.5D and a CDVA = 1. After surgery, the UCVA achieved was 1.
Postoperative topography showed more surface irregularities for the 6 mm pupil size than for the 2.5 mm pupil size (see Figure 4 up). PSF function was essentially a point before and after surgery for 2.5 mm. However, for the 6 mm pupil size, the PSF function was impaired and the vision simulation optotype became worse compared to the optotype corresponding to the 2.5 mm pupil size (Figure 4 middle). The aberrations of this eye corroborated these simulations (see Table 4). For the 2.5 mm pupil size, the contribution of aberrations was insignificant (in fact HOAS RMS diminished by 0.02 µm after surgery), while for the 6 mm pupil size HOAS RMS increased by 0.284 µm after surgery, basically due to an increase of 0.049 µm of the spherical aberration. This result showed that if a photopic pupil size (for instance 2.5 mm) was considered, it was possible to explain why the preoperative CDVA and postoperative UDVA remained the same, and the patient maintained the same quality of vision after surgery (see Figure 4 down).

3.5. EYE 2

A 22-year-old woman with a preoperative refraction of −2.75 D and a CDVA = 1. After surgery, the UDVA was 1.25.
In this case, for the pupil size of 2.5 mm, there was a slight improvement in the HOAS RMS and coma. However, a significant increase in aberrations was obtained when a pupil size of 6 mm was considered (see Table 5). These results provided better postoperative PSF function and simulated optotype vison for a pupil size of 2.5 mm than 6 mm (Figure 5 middle and down). Therefore, these results could explain a better value for the postoperative UDVA than for the preoperative CDVA.

3.6. EYE 3

A 31-year-old woman with a preoperative refraction of −1.75 D and a CDVA = 1. After surgery, she presented a UDVA = 0.7.
As seen in Table 6, for this eye and with a pupil size of 6 mm, HOAS RMS were clearly increased after surgery (1.207 µm), basically due to an increase in coma (0.849 µm of increase). Large differences in quality vision were observed. (Figure 6 middle and down). This worsening was also observed for 2.5 mm pupil size. Topography after surgery showed irregularities within the 2.5 mm zone that could be caused by poor corneal healing or biomechanical characteristics (see Figure 6A). A lower HOAS RMS increase of 0.088 µm was obtained, but this increase in aberrations could explain the differences between PSF functions before and after surgery and the poorer quality of vision obtained (see Figure 6B,C). Consequently, a decrease in clinical VA would be also expected after surgery if a pupil size of 2.5 mm is considered.

4. Discussion

Our clinical results showed that differences between preoperative and postoperative values of anterior corneal radius, asphericity or pachymetry were significant (p < 0.05), as reported in previous studies [4,12,14,15,21,22,23]. Despite the change of the posterior corneal radius was also significant, it could not be considered clinically relevant because the mean difference was about 0.02 mm [10]. The anterior corneal surface was the most relevant surface in the generation of the aberrations after surgery. HOAS RMS, SA and RMS coma were significantly increased after surgery (p < 0.05) in agreement with published studies [6,7,9,24]. The contribution to global aberrations from the second corneal surface was not clinically significant as previous reported results [4,12,25]. Study of correlations showed that asphericity, SA, RMS coma and HOAS RMS increased as the pre-surgery spherical equivalent was higher consistent with previously published studies [23,26,27,28].
Optical aberrations are associated with bad quality of vision, with one of the main causes being a large mesopic pupil diameter (>6 mm) [29,30]. Several studies have shown that Femto-Lasik technique is an effective technique [12,13,14,15] and these results imply that no differences are expected between the preoperative CDVA and the postoperative UDVA after Femto-Lasik surgery. Our study corroborated this statement. However, if a significant increase of aberrations after surgery was obtained, more differences between the preoperative CDVA and the postoperative UDVA would be expected, and a lower efficacy index should be obtained. This absence of differences in vision quality was confirmed with our clinical results as cumulative percentages of eyes with better postoperative UDVA showed (Figure 2). As this study established, two factors are key to understanding the lack of correlation between vision quality and increased aberrations: the pupil size and a personalized analysis of each case.
Although several studies have been conducted to assess the aberrations induced by different LASIK techniques, there are no consensus results regarding the changes in individual aberration terms [26]. As indicated by Al-Zeraid et al., the differences between previous reports may be related to the different levels of preoperative aberrations and the pupil analysis diameter used. So far, no literature has been found to question why there is no direct correlation between objective worsening of visual quality and clinical measure of visual acuity after surgery. As commented above, the pupil size commonly used to obtain aberrations is 6 mm [12,13,14,15]; however, VA is measured under photopic conditions as stablished the ETDRS study protocol [
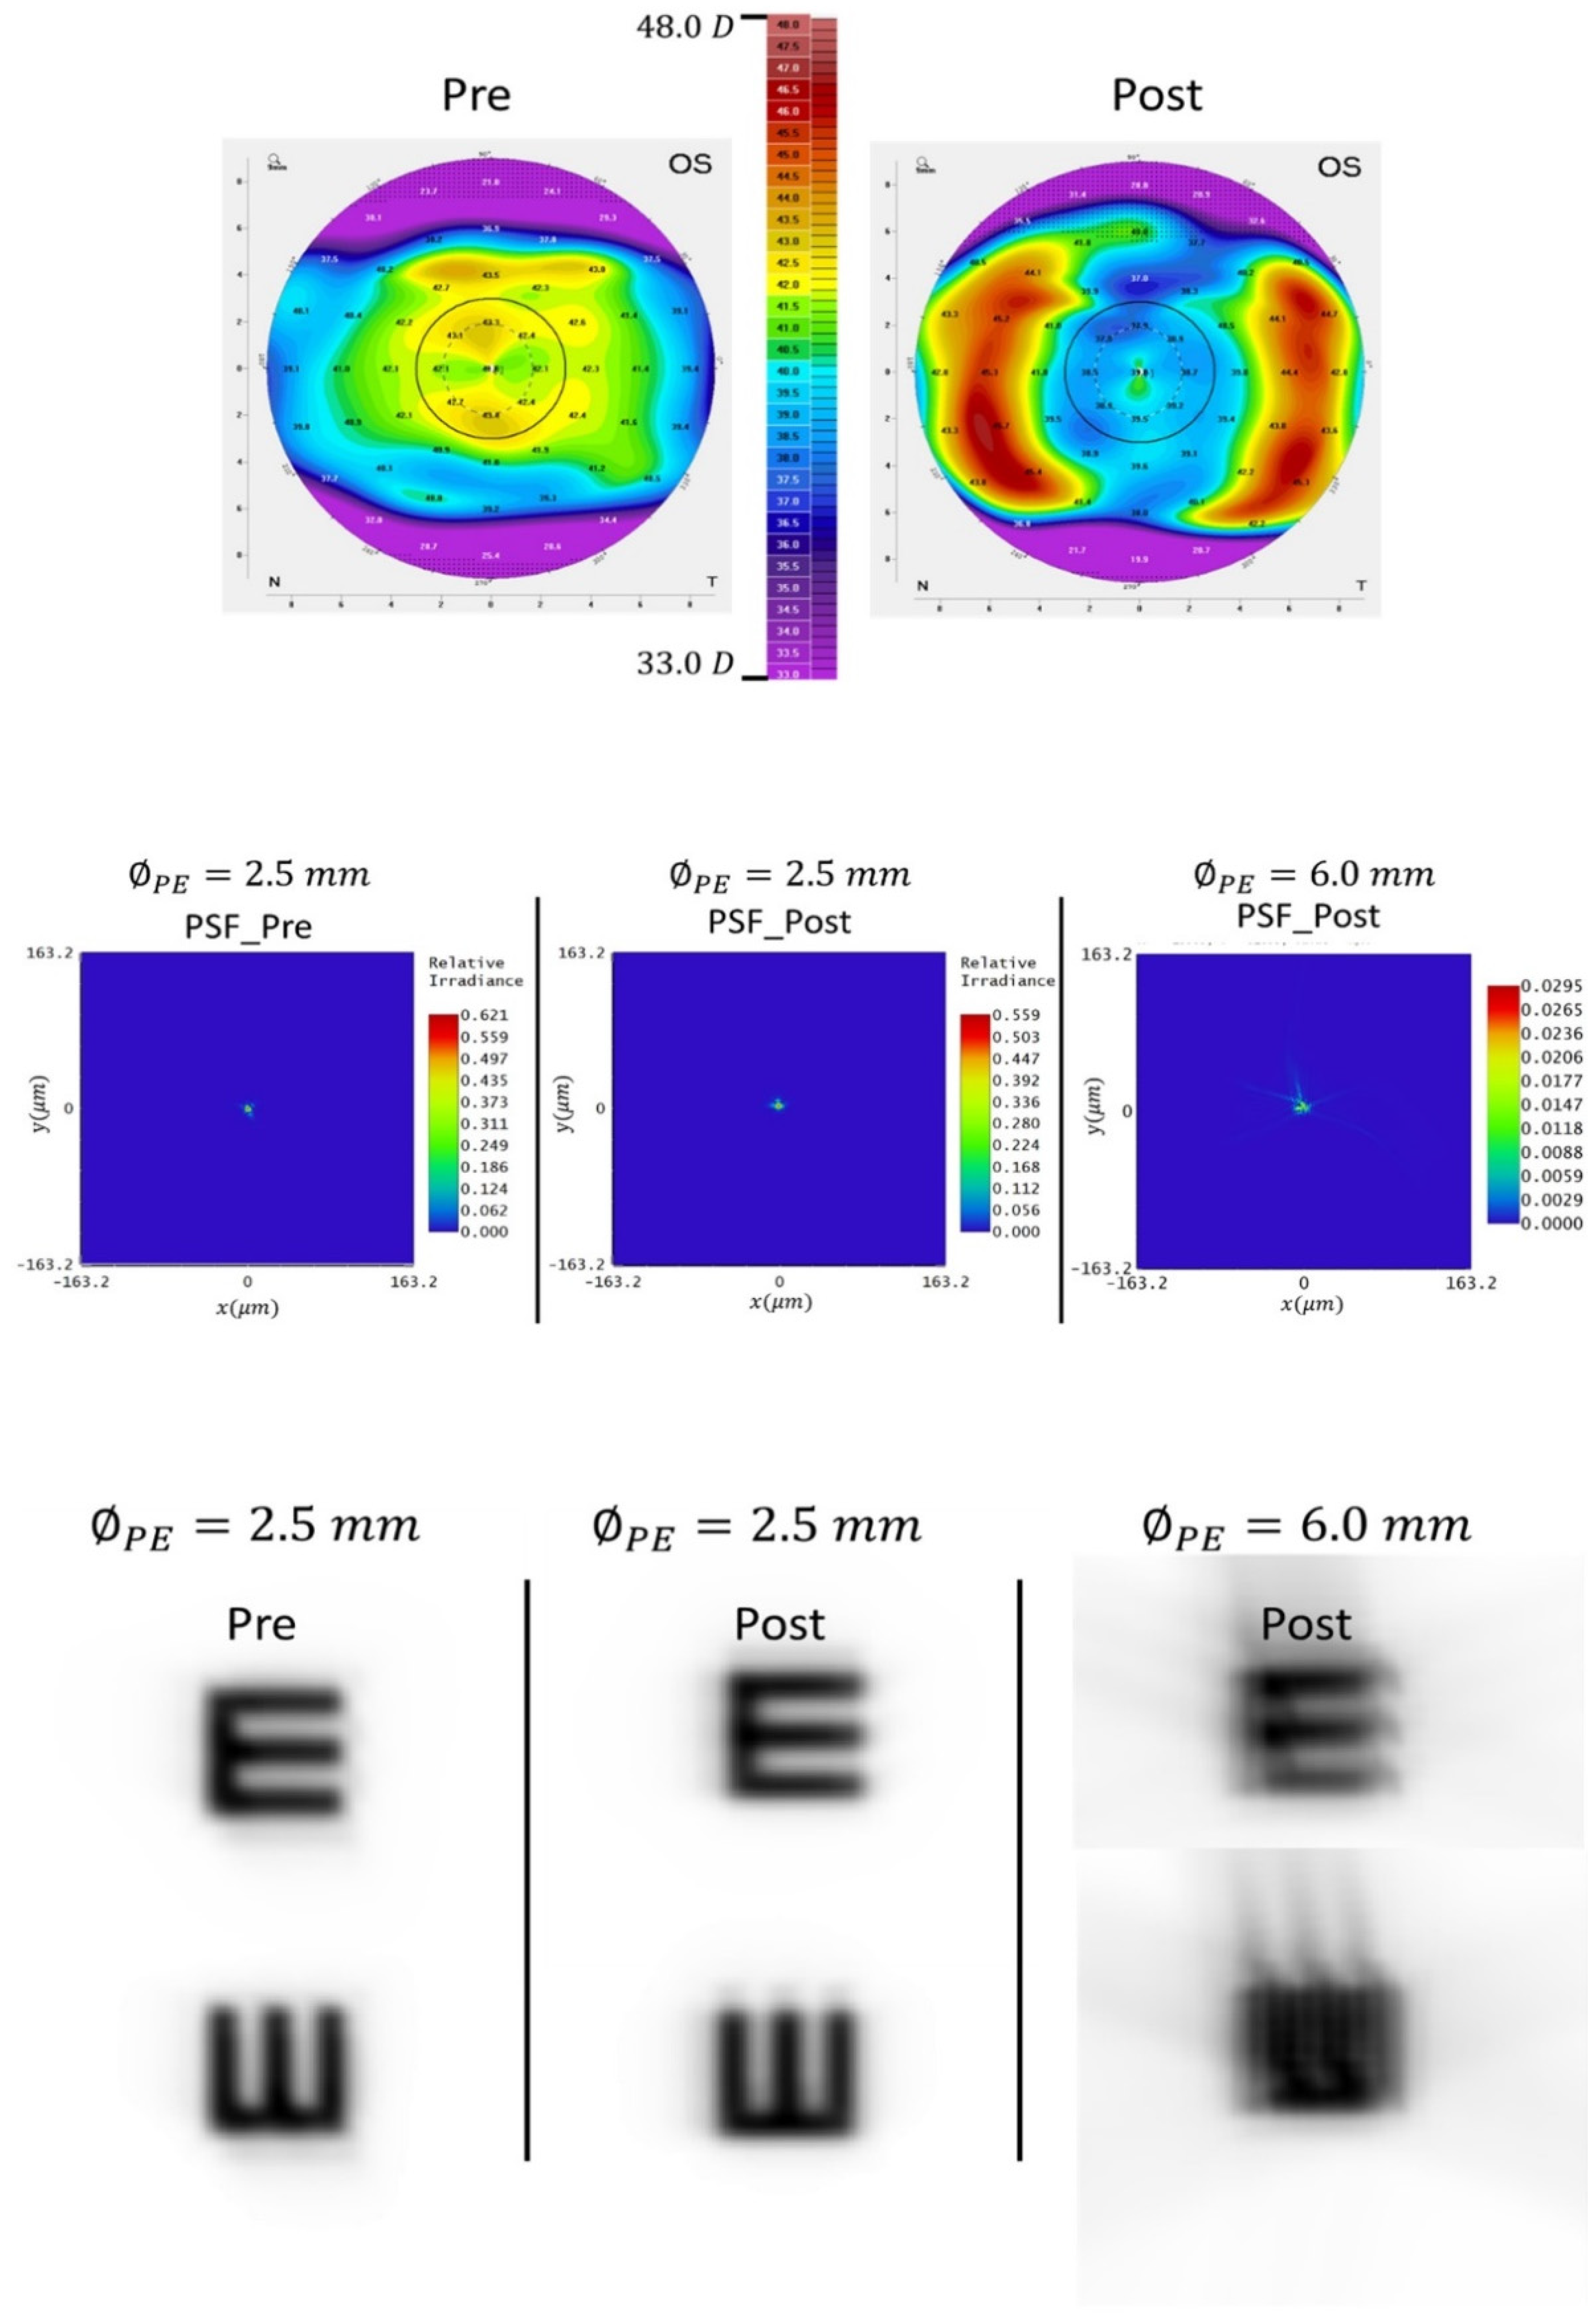
30]. At these illumination levels, normal pupils have lower diameters than 6 mm. Assuming an average photopic pupil size of 2.5 mm and recalculating the value of the aberrations for this diameter, it is possible to explain why the preoperative CDVA and postoperative UDVA are correlated. For this purpose, three eyes, which represent most of the possible relationships between preoperative CDVA and postoperative UCVA, were simulated. Eye 1 had the same preoperative CDVA and postoperative UDVA an equal to 1, in Eye 2 the VA after surgery became better than before surgery (CDVA = 1 and UDVA = 1.25 respectively) and in Eye 3 there was a worsening of VA after surgery (preoperative CDVA = 1 and postoperative UDVA = 0.7).
Our simulations showed that for the pupil size of 6 mm, the three eyes increased HOAS after surgery and vision quality was impaired (Figure 4, Figure 5 and Figure 6) following the general trend of the clinical study. However, clinical measurement of VA did not correlate with this result because postoperative UDVA was not always worse than preoperative CDVA. This correlation between clinical VA measurement and HOAS was found when a 2.5 mm pupil size was considered. The results justified that for Eye 1 the preoperative CDVA and postoperative UDVA were practically identical, for Eye 2 the postoperative UDVA was better and for Eye 3 worse (Figure 4, Figure 5 and Figure 6). As seen in Table 4, Table 5 and Table 6, for the 2.5 mm pupil size, in Eyes 1 and 2, HOAS diminished after surgery, whereas in Eye 3 it increased.
Most of eyes from clinical base data (33) obtained a postoperative VA 1 or close to one and only 4 eyes obtained VA lower than 0.8. In these 4 eyes, the postoperative HOAS was higher than 0.06 µm. We have seen that a postoperative VA equal to or better than preoperative VA is associated with a maintenance or improvement of postoperative HOAS aberrations for a pupil size of 2.5 mm (i.e., Eyes 1 and 2). In addition, in those eyes which HOAS were higher than 0,06 µm and the increase of HOAS after surgery was higher than 0,03 µm (i.e., Eye 3), a lower postoperative VA were expected. However, the amount of this decrease in VA depends on the specific distribution of the aberrations.
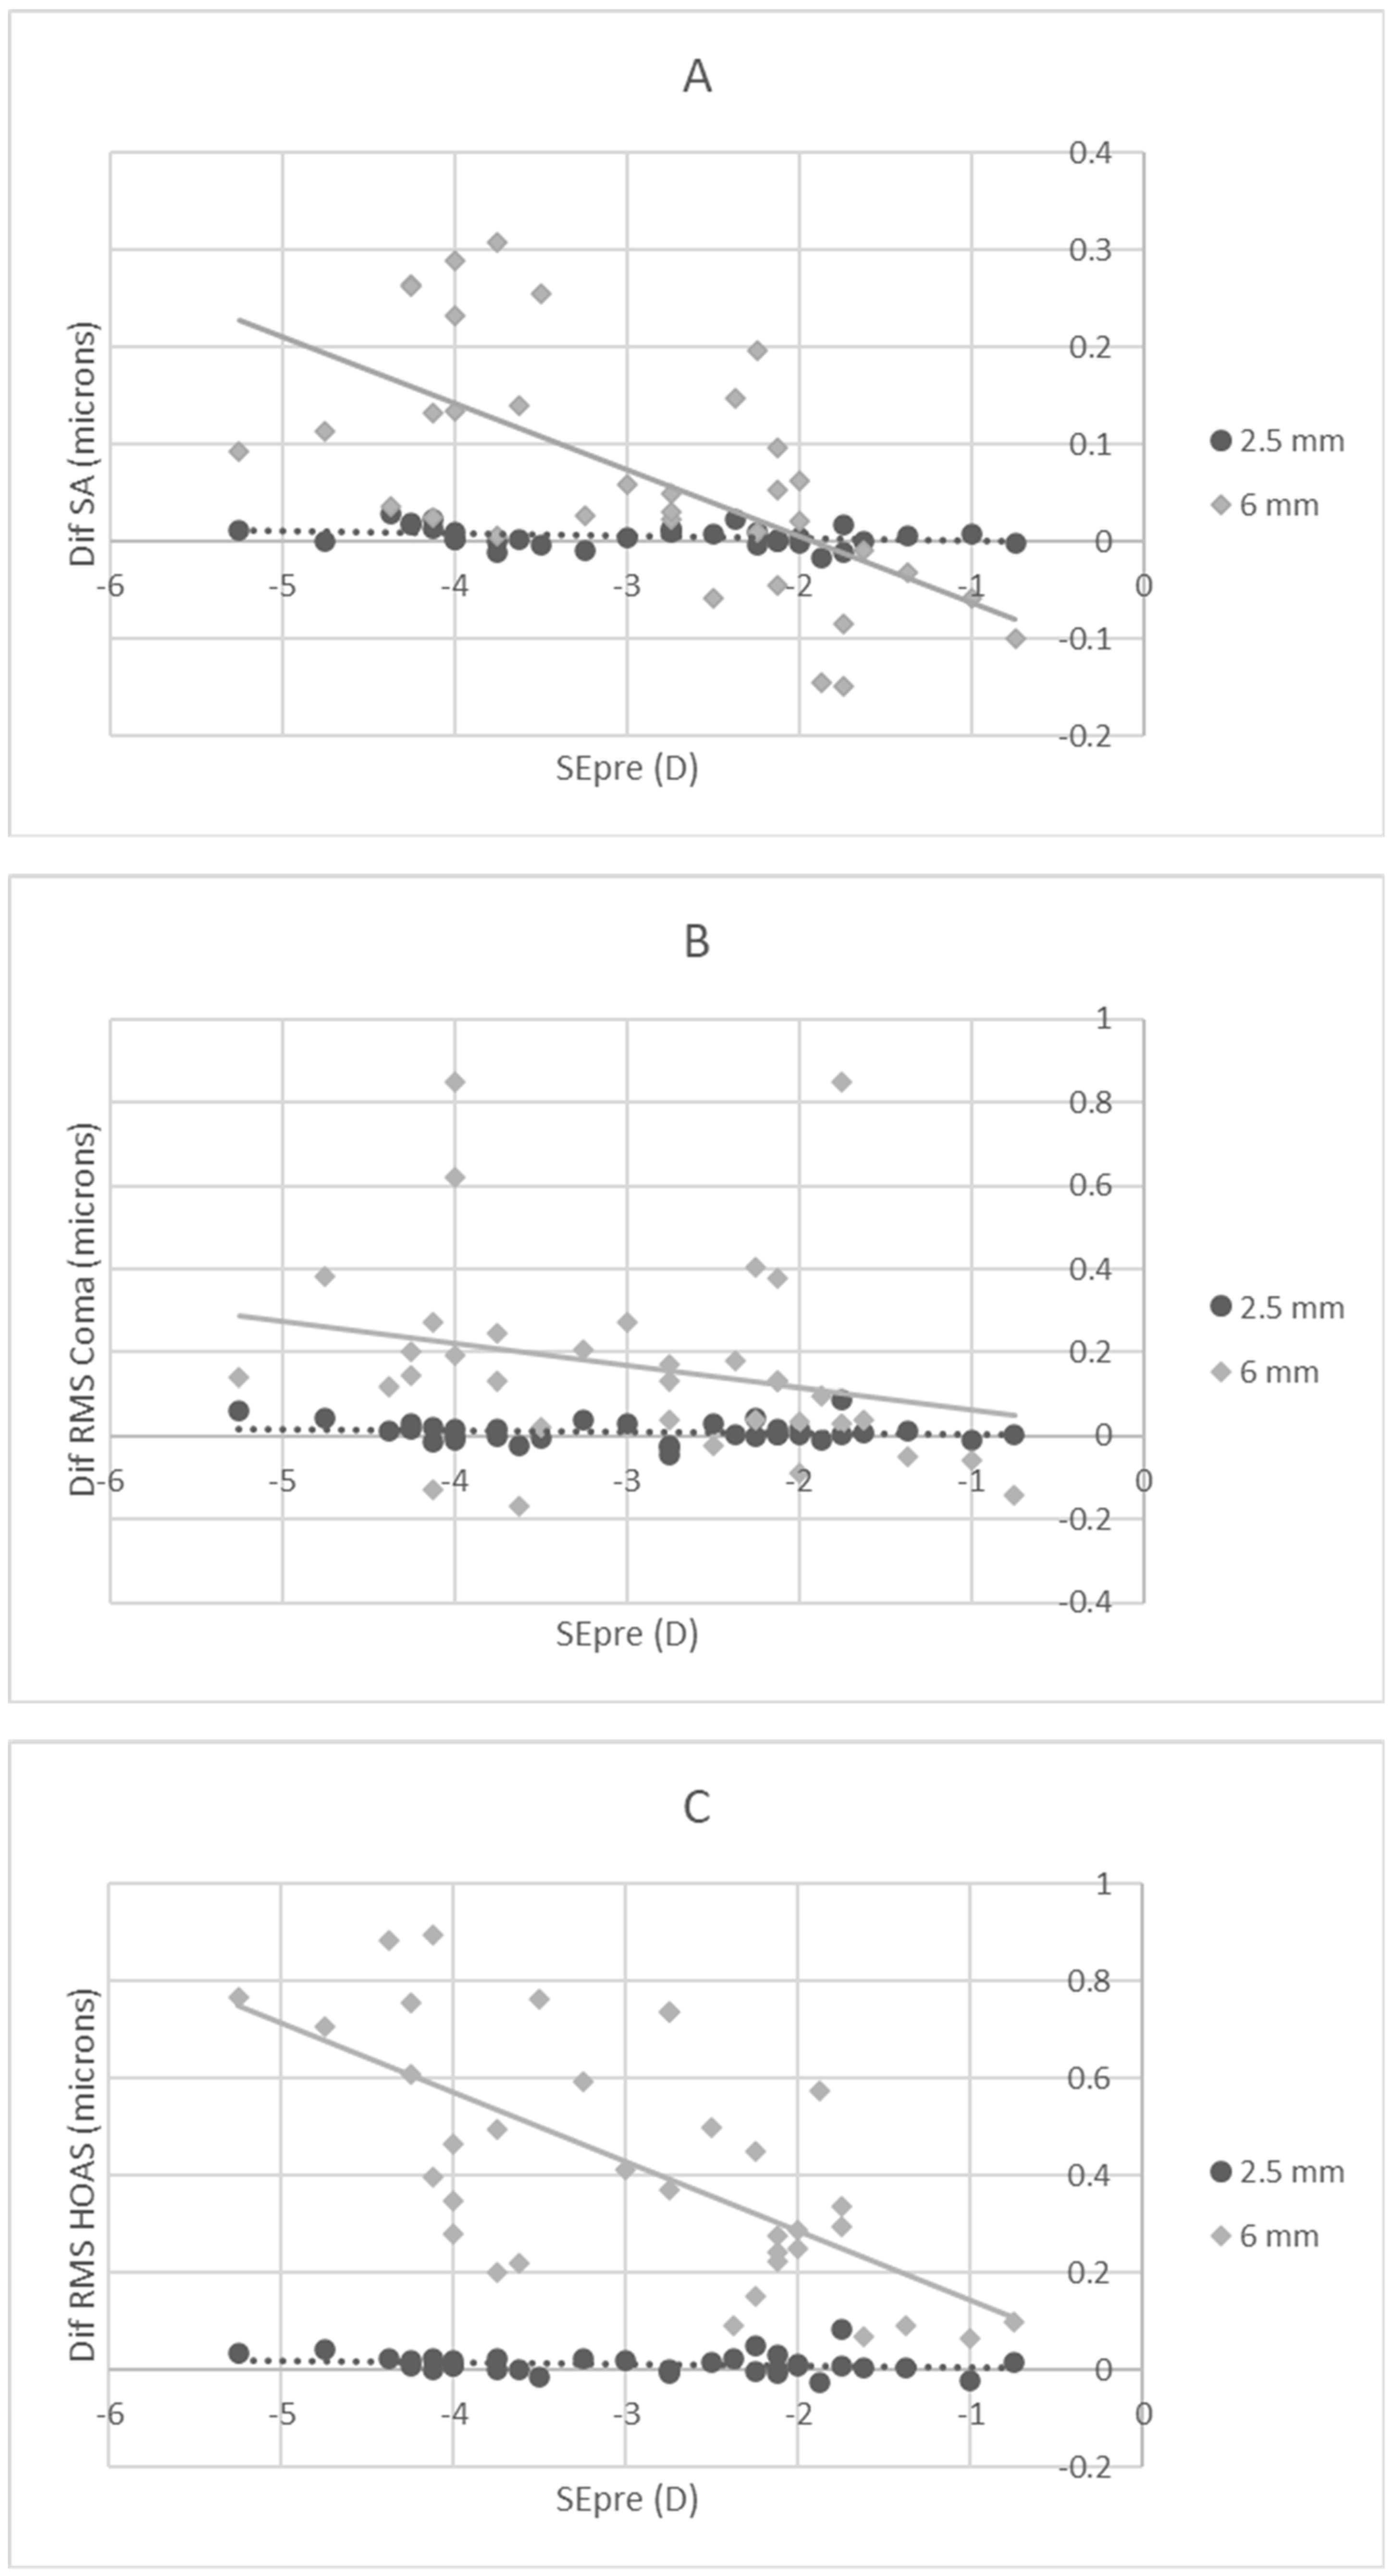
To corroborate these conclusions, correlations were studied for 2.5 mm pupil size. Table 7 showed that only correlation between SE and SA was significant, but as seen in Figure 7A, this correlation was not clinically relevant because the values were very low and always close to 0. In addition, differences in coma and RMS HOAS were not significant (see Table 7 and Figure 7B,C). This lack of correlations explains why HOAS were not influencing the final patients vision quality and any differences between preoperative CDVA and postoperative UDVA were found. Moreover, this result reinforces the idea that it is necessary a personalized analysis for each patient to find the correlation between the HOAS and the final vision quality (as the three analysed cases have shown).
This study has shown that considering a photopic pupil size (lower than 3 mm) in the analysis of aberrations is key to better understanding the patients final vision quality. In most cases there are not correlation between the change of visual acuity before and after surgery when only the change of HOAS for 6 mm of pupil size is considered. Visual acuity is measured under photopic luminance, and the postoperative VA are determined by the final HOAS and the increment of them after surgery, but for 2.5 mm of pupil size. Our results indicated that HOAS higher than 0.06 µm are likely to produce VA values lower than 1 and, if in addition, the increment of the HOA after surgery is higher than 0.03 µm, a worsening of AV (Eye 3). Although our study has only been simulated on three eyes, the results could be extrapolated to most real cases since the effect of high-order aberrations (basically SA and coma) will produce the same effect on the final quality of vision. Although the simulation could be improved by considering total aberrations of the eye for a better personalized lens model, this assumption does not invalidate our results because we have focused on photopic conditions. We have considered a diameter of 2.5 mm in the entrance pupil plane which would correspond to a smaller beam size in the lens plane. Therefore, our model provides a sufficiently good behavior of the photopic conditions. In addition, the need of total ocular aberrations will lead to clinical drawbacks because the use of aberrometers is not widespread in clinical practice. Specifically, refractive surgery usually only takes into account the corneal measurement. Consequently, our study can be useful to a wider audience since corneal aberrations are easier to obtain.
In conclusion, the personalized analysis of higher order aberrations for photopic pupil sizes will better predict the patient’s final visual acuity post-Lasik surgery.

Author Contributions

Conceptualization, J.J.M., E.R., V.J.C., C.G., M.T.C.; methodology, J.J.M., E.R., V.J.C., C.G., M.T.C.; software, J.J.M., E.R., V.J.C., C.G., M.T.C.; validation, J.J.M., E.R., V.J.C., C.G., M.T.C.; formal análisis, J.J.M., E.R., V.J.C., C.G., M.T.C.; investigation, J.J.M., E.R., V.J.C., C.G., M.T.C., B.M., E.C.; resources, B.M., E.C.; data curation, B.M., E.C.; writing—original draft preparation, J.J.M., E.R., V.J.C.; writing—review and editing, J.J.M., E.R., V.J.C., C.G., M.T.C.; E.C.; project administration, V.J.C.; funding acquisition, C.G. All authors have read and agreed to the published version of the manuscript.

Funding

This work was supported by the “Generalitat Valenciana” of Spain (project AICO/2021/130).

Conflicts of Interest

The authors declare no conflict of interest.

References

  1. Sugar, A.; Rapuano, C.J.; Culbertson, W.W.; Huang, D.; A Varley, G.; Agapitos, P.J.; de Luise, V.P.; Koch, D.D. Laser in situ keratomileusis for myopia and astigmatism: Safety and efficacy: A report by the american academy of ophthalmology. Ophthalmology 2002, 109, 175–187. [Google Scholar] [CrossRef]
  2. Stulting, R.D.; Carr, J.D.; Thompson, K.P.; Waring, G.O.; Wiley, W.M.; Walker, J.G. Complications of laser in situ keratomileusis for the correction of myopia. Ophthalmology 1999, 106, 13–20. [Google Scholar] [CrossRef]
  3. Callou, T.P.; Garcia, R.; Mukai, A.; Giacomin, N.T.; de Souza, R.G.; Bechara, S.J. Advances in femtosecond laser technology. Clin. Ophthalmol. 2016, 10, 697–703. [Google Scholar] [CrossRef] [PubMed] [Green Version]
  4. Ortiz, D.; Alio, J.L.; Pinero, D. Measurement of corneal curvature change after mechanical laser in situ keratomileusis flap creation and femtosecond laser flap creation. J. Cataract Refract. Surg. 2008, 34, 238–242. [Google Scholar] [CrossRef] [PubMed]
  5. Gyldenkerne, A.; Ivarsen, A.; Hjortdal, J.O. Comparison of corneal shape changes and aberrations induced by FS-LASIK and SMILE for myopia. J. Refract. Surg. 2015, 31, 223–229. [Google Scholar] [CrossRef] [Green Version]
  6. Wang, J.; Ren, Y.; Liang, K.; Jiang, Z.; Tao, L. Changes of corneal high-order aberrations after femtosecond laser-assisted in situ keratomileusis. Med. Baltim. 2018, 97, e0618. [Google Scholar] [CrossRef] [PubMed]
  7. Sefat, S.M.; Wiltfang, R.; Bechmann, M.; Mayer, W.J.; Kampik, A.; Kook, D. Evaluation of changes in human corneas after femtosecond laser-assisted LASIK and small-incision lenticule extraction (SMILE) using non-contact tonometry and ultra-high-speed camera (corvis ST). Curr. Eye Res. 2016, 41, 917–922. [Google Scholar] [CrossRef] [PubMed]
  8. Wu, W.; Wang, Y. Corneal higher-order aberrations of the anterior surface, posterior surface, and total cornea after SMILE, FS-LASIK, and FLEx surgeries. Eye Contact Lens 2016, 42, 358–365. [Google Scholar] [CrossRef]
  9. Perez-Escudero, A.; Dorronsoro, C.; Sawides, L.; Remon, L.; Merayo-Lloves, J.; Marcos, S. Minor influence of myopic laser in situ keratomileusis on the posterior corneal surface. Investig. Ophthalmol. Vis. Sci. 2009, 50, 4146–4154. [Google Scholar] [CrossRef] [Green Version]
  10. Molchan, R.P.; Taylor, K.R.; Panday, V.A.; Caldwell, M.C.; Reilly, C.D. Retrospective analysis comparing the preoperative and postoperative “Q” values for 2 different lasers in refractive surgery. Cornea 2015, 34, 1437–1440. [Google Scholar] [CrossRef] [PubMed]
  11. Kamiya, K.; Shimizu, K.; Igarashi, A.; Kobashi, H.; Komatsu, M. Comparison of visual acuity, higher-order aberrations and corneal asphericity after refractive lenticule extraction and wavefront-guided laser-assisted in situ keratomileusis for myopia. Br. J. Ophthalmol. 2013, 97, 968–975. [Google Scholar] [CrossRef]
  12. Arora, R.; Goel, Y.; Goyal, J.L.; Goyal, G.; Garg, A.; Jain, P. Refractive outcome of wavefront guided laser in situ keratomileusis and wavefront guided photorefractive keratectomy in high pre-existing higher order aberration. Contact Lens Anterior Eye 2015, 38, 127–133. [Google Scholar] [CrossRef] [PubMed]
  13. Lin, F.; Xu, Y.; Yang, Y. Comparison of the visual results after SMILE and femtosecond laser-assisted LASIK for myopia. J. Refract. Surg. 2014, 30, 248–254. [Google Scholar] [CrossRef] [Green Version]
  14. Piao, J.; Whang, W.; Joo, C. Comparison of visual outcomes after femtosecond laser-assisted LASIK versus flap-off epipolis LASIK for myopia. BMC Ophthalmol. 2020, 20, 310. [Google Scholar] [CrossRef] [PubMed]
  15. OCULUS. Pentacam, 6.09.46; OCULUS: Wetzlar, Germany, 2021. [Google Scholar]
  16. The MathWorks Inc. Matlab, 9.10.0 (R2021a); The MathWorks Inc.: Natick, MA, USA, 2021. [Google Scholar]
  17. Camps, V.J.; Miret, J.J.; Garcia, C.; Tolosa, A.; Pinero, D.P. Simulation of the effect of different presbyopia-correcting intraocular lenses with eyes with previous laser refractive surgery. J. Refract. Surg. 2018, 34, 222–227. [Google Scholar] [CrossRef] [PubMed] [Green Version]
  18. Camps, V.J.; Tolosa, A.; Pinero, D.P.; de Fez, D.; Caballero, M.T.; Miret, J.J. In vitro aberrometric assessment of a multifocal intraocular lens and two extended depth of focus IOLs. J. Ophthalmol. 2017, 2017, 7095734. [Google Scholar] [CrossRef] [PubMed] [Green Version]
  19. Escudero-Sanz, I.; Navarro, R. Off-axis aberrations of a wide-angle schematic eye model. J. Opt. Soc. Am. A Opt. Image Sci. Vis. 1999, 16, 1881–1891. [Google Scholar] [CrossRef] [PubMed] [Green Version]
  20. Chen, Y.-L.; Tan, B.; Shi, L.; Lewis, J.; Wang, M.; Baker, K. The shape of aging lens. Investig. Ophthalmol. Vis. Sci. 2010, 51, 4593. [Google Scholar]
  21. Svedberg, H.; Chen, E.; Hamberg-Nystrom, H. Changes in corneal thickness and curvature after different excimer laser photorefractive procedures and their impact on intraocular pressure measurements. Graefes Arch. Clin. Exp. Ophthalmol. 2005, 243, 1218–1220. [Google Scholar] [CrossRef]
  22. Hjortdal, J.Ø.; Møller-Pedersen, T.; Ivarsen, A.; Ehlers, N. Corneal power, thickness, and stiffness: Results of a prospective randomized controlled trial of PRK and LASIK for myopia. J. Cataract Refract. Surg. 2005, 31, 21–29. [Google Scholar] [CrossRef]
  23. Piccinini, A.L.; Golan, O.; Hafezi, F.; Randleman, J.B. Higher-order aberration measurements: Comparison between scheimpflug and dual scheimpflug-placido technology in normal eyes. J. Cataract Refract. Surg. 2019, 45, 490–494. [Google Scholar] [CrossRef] [PubMed]
  24. Khyrat, Y.; Elshafei, A.; Abdelrahman, R.; Abdelmalk, N. Assessment of the posterior corneal surface changes after LASIK treatment of myopia using pentacam. J. Egypt. Ophthalmol. Soc. 2014, 107, 10. [Google Scholar] [CrossRef]
  25. Al-Zeraid, F.M.; Osuagwu, U.L. Induced higher-order aberrations after laser in situ keratomileusis (LASIK) performed with wavefront-guided IntraLase femtosecond laser in moderate to high astigmatism. BMC Ophthalmol. 2016, 16, 29–35. [Google Scholar] [CrossRef] [PubMed] [Green Version]
  26. Hashemian, S.J.; Soleimani, M.; Foroutan, A.; Joshaghani, M.; Ghaempanah, M.J.; Jafari, M.E.; Yaseri, M. Ocular higher-order aberrations and mesopic pupil size in individuals screened for refractive surgery. Int. J. Ophthalmol. 2012, 5, 222–225. [Google Scholar] [CrossRef] [PubMed]
  27. Castejón-Mochón, J.F.; López-Gil, N.; Benito, A.; Artal, P. Ocular wave-front aberration statistics in a normal young population. Vis. Res. 2002, 42, 1611–1617. [Google Scholar] [CrossRef] [Green Version]
  28. Sahay, P.; Bafna, R.K.; Reddy, J.C.; Vajpayee, R.B.; Sharma, N. Complications of laser-assisted in situ keratomileusis. Indian J. Ophthalmol. 2021, 69, 1658–1669. [Google Scholar] [CrossRef]
  29. Schallhorn, S.C.; Kaupp, S.E.; Tanzer, D.J.; Tidwell, J.; Laurent, J.; Bourque, L.B. Pupil size and quality of vision after LASIK. Ophthalmology 2003, 110, 1606–1614. [Google Scholar] [CrossRef]
  30. Ferris, F.L.; Sperduto, R.D. Standardized illumination for visual acuity testing in clinical research. Am. J. Ophthalmol. 1982, 94, 97–98. [Google Scholar] [CrossRef]
Figure 1. Customized eye model used in simulations.
Optics 03 00033 g001
Figure 2. Cumulative percentages of eyes reaching specific levels of visual acuity without correction after LASIK surgery. Preoperative CDVA and postoperative UDVA are compared (left). Changes in Snellen lines when postoperative UDVA and preoperative CDVA are compared (right).
Optics 03 00033 g002
Figure 3. (AD) Dispersion diagrams. Correlation between the preoperative SE and the difference between preoperative and postoperative values of asphericity (A), SA (B), RMS coma (C) and HOAS RMS (D).
Optics 03 00033 g003
Figure 4. For Eye1, (up) pre- and postoperative topographies. Pupil size of 2.5 mm centred in apex is indicated with black circle; (middle) pre- and postoperative PSF functions for 2.5 mm and 6 mm pupil sizes; (down) pre- and postoperative vision simulated optotype for 2.5 mm and 6 mm pupil sizes.
Optics 03 00033 g004
Figure 5. For Eye 2, (up) pre and postoperative topographies. Pupil size of 2.5 mm centred in apex is indicated with black circle; (middle) pre and postoperative PSF functions for 2.5 mm and 6 mm pupil sizes; (down) pre- and postoperative vision simulated optotype for 2.5 mm and 6 mm pupil sizes.
Optics 03 00033 g005
Figure 6. For Eye 3, (A) pre and postoperative topographies. Pupil size of 2.5 mm centred in apex is indicated with black circle; (B) pre and postoperative PSF functions for 2.5 mm and 6 mm pupil sizes; (C) pre- and postoperative vision simulated optotype for 2.5 mm and 6 mm pupil sizes.
Optics 03 00033 g006
Figure 7. (AC) Dispersion diagrams for 2.5 mm pupil size. Correlation between the preoperative spherical equivalent and the difference between preoperative and postoperative values of SA (A) and RMS coma (B) and HOAS RMS (C).
Optics 03 00033 g007
Table 1. Comparison of preoperative and postoperative LASIK values. The ranges, mean and standard deviation in visual acuity, corneal radii, asphericity and pachymetry are presented, as well as the result of the statistical analysis (p-value). Statistically significant values are highlighted in bold.
Preoperative DataPostoperative Data
Range [min, max]Mean ± SDRangeMean ± SDp-Value
pre-CDVA[0.85, 1.25]1.03 ± 0.09------------------------
post-UDVA------------------------[0.7, 1.25]1.04 ± 0.160.860 *
Ranterior (mm)[7.29, 8.87]7.92 ± 0.33[7.41, 9.48]8.36 ± 0.37<0.001
Asphericityanterior[−0.57, −0.01]−0.29 ± 0.11[−0.21, −0.71]0.22 ± 0.27<0.001
Rposterior (mm)[5.87, 6.84]6.38 ± 0.24[5.88, 6.92]6.40 ± 0.250.001
Asphericityposterior[−0.57, −0.01]−0.35 ± 0.17[−1.13, −0.10]−0.31 ± 0.170.004
Pachimetry (µm)[489, 635]554.38 ± 29.31[434, 571]506.22 ± 30.34<0.001
SD, standard deviation; CDVA, corrected distance visual acuity; UDVA, uncorrected distance visual acuity; Ranterior, anterior corneal radius; Rposterior, posterior corneal radius. * p = 0.860 corresponds to the differences between pre-CDVA and post-UDVA.
Table 2. Comparison of preoperative and postoperative of root mean square high-order aberrations (RMS HOAS), spherical aberration (SA) and RMS coma measured in microns (µm). The ranges, the mean and the standard deviation of the anterior and posterior cornea surfaces and total cornea are presented as well as the result of the statistical analysis (p-value). Statistically significant values are highlighted in bold. All measures have been made for a pupil diameter of 6 mm.
ϕ = 6 mmPreoperative DataPostoperative Data
Anterior cornea surface
Range [min, max]Mean ± SDRangeMean ± SDp-value
HOAS RMS (µm)[0.27, 0.85]0.40 ± 0.11[0.31, 1.42]0.64 ± 0.26<0.001
SA (µm)[0.06, 0.43]0.26 ± 0.09[0.07, 0.62]0.33 ± 0.13<0.001
Coma RMS (µm)[0.02, 0.43]0.18 ± 0.10[0.01, 1.04]0.34 ± 0.25<0.001
Posterior cornea surface
Range [min, max]Mean ± SDRangeMean ± SDp-value
HOAS RMS (µm)[0.15, 0.26]0.20 ± 0.03[0.14, 0.32]0.20 ± 0.040.201
SA (µm)[−0.21, −0.02]−0.14 ± 0.03[−0.22, −0.02]−0.15 ± 0.040.003
Coma RMS (µm)[0.00, 0.15]0.06 ± 0.03[0.01, 0.19]0.07 ± 0.040.981
Total cornea
Range [min, max]Mean ± SDRangeMean ± SDp-value
HOAS RMS (µm)[0.23, 0.50]0.36 ± 0.07[0.24, 1.34]0.60 ± 0.24<0.001
SA (µm)[0.03, 0.38]0.21 ± 0.08[0.04, 0.54]0.27 ± 0.130.020
Coma RMS (µm)[0.04, 0.37]0.16 ± 0.08[0.03, 0.99]0.33 ± 0.22<0.001
SD, standard deviation; RMS HOAS, root mean square high-order aberrations; SA, spherical aberration.
Table 3. Correlations of preoperative SE with the difference between pre- and post-surgery values obtained for asphericity, SA, RMS coma and RMS HOAS. Statistically significant values are highlighted in bold.
ϕ = 6 mmSEpre-dif_AsphericitySEpre-dif_SASEpre-dif_RMS ComaSEpre-dif_RMS HOAS
Correlation coef.−0.880−0.693−0.427−0.429
Sig. (bilateral)<0.001<0.0010.0110.010
Table 4. Preoperative and postoperative RMS HOAS, SA and RMS coma values of Eye 1 for 2.5 mm and 6 mm pupil sizes.
ϕ = 2.5 mmϕ = 6 mm
PreoperativePostoperativePreoperativePostoperative
HOAS RMS (µm)0.0540.0340.4560.74
SA (µm)0.018−0.0040.2780.327
Coma RMS (µm)0.0190.0130.1510.172
Table 5. Preoperative and postoperative RMS HOAS, SA and RMS coma values of Eye 2 for 2.5 mm and 6 mm pupil sizes.
ϕ = 2.5 mmϕ = 6 mm
PreoperativePostoperativePreoperativePostoperative
HOAS RMS (µm)0.0640.0570.2060.571
SA (µm)−0.001−0.0110.060.091
Coma RMS (µm)0.0530.0080.2430.374
Table 6. Preoperative and postoperative RMS HOAS, SA and RMS coma values of Eye 3 for 2.5 mm and 6 mm pupil sizes.
ϕ = 2.5 mmϕ = 6 mm
PreoperativePostoperativePreoperativePostoperative
HOAS RMS (µm)0.0370.1250.361.207
SA (µm)0.003−0.0170.2140.066
Coma RMS (µm)0.0210.110.1951.044
Table 7. Correlations for 2.5 mm pupil size of preoperative SE with the difference between pre- and post-surgery values obtained for SA, RMS coma and RMS HOAS. Statistically significant values are highlighted in bold.
ϕ = 2.5 mmSEpre-Dif SASEpre-Dif. RMS ComaSEpre-Dif. HORMS
Correlation coef−0.363−0.175−0.314
Sig. (bilateral)0.0320.3160.066
Publisher’s Note: MDPI stays neutral with regard to jurisdictional claims in published maps and institutional affiliations.

