Article

Comparative Microbial Community Analysis of Fur Seals and Aquaculture Salmon Gut Microbiomes in Tasmania

1
School of Veterinary Medicine, University of California, 1 Shields Ave, Davis, CA 95616, USA
2
Tasmania Institute of Agriculture, University of Tasmania, Sandy Bay, TAS 7001, Australia
3
Practical Informatics, Pittsburgh, PA 15213, USA
4
Institute for Marine and Antarctic Studies, University of Tasmania, Battery Point, TAS 7005, Australia
*
Author to whom correspondence should be addressed.
Current address: Wild EcoHealth, Tacoma, Washington 98465, USA.
Oceans 2023, 4(2), 200-219; https://doi.org/10.3390/oceans4020014
Submission received: 31 March 2023 / Revised: 31 May 2023 / Accepted: 13 June 2023 / Published: 16 June 2023
(This article belongs to the Special Issue Marine Mammals in a Changing World, 2nd Edition)

Abstract

:
In Tasmania, Australian fur seals (Arctocephalus pusillus doriferus) regularly interact with Atlantic salmon (Salmo salmar L.) aquaculture lease operations and opportunistically consume fish. The microbial communities of seals and aquaculture salmon were analyzed for potential indicators of microbial sharing and to determine the potential effects of interactions on wild seal microbiome composition. The high-throughput sequencing of the V1–V3 region of the 16S rRNA genes from the gut microbial communities of 221 fur seals was performed: 41 males caught at farms, 50 adult scats from haul-outs near farms, 24 necropsied seals, and controls from Bass Strait breeding colonies, encompassing 56 adult scats and 50 pup swabs. QIIME2 and R Studio were used for analysis. Foraging at or near salmon farms significantly shifted seal microbiome biodiversity. Taxonomic analysis showed a greater divergence in Bacteroidota representatives in male seals captured at farms compared to all other groups. Pathogens were identified that could be monitoring targets. Potential indicator amplicon sequence variants were found across a variety of taxa and could be used as minimally invasive indicators for interactions at this interface. The diversity and taxonomic shifts in the microbial communities of seals indicate a need to further study this interface for broader ecological implications.

1. Introduction

In marine and coastal systems, humans have historically been directly connected to the wild through the fisheries of wild fish stocks and direct interaction with wild animals via recreational activities, fisheries’ competition for fish stocks, and aquaculture [1,2,3]. However, the more indirect connections are often more insidious and easily overlooked. The interconnectedness of the wild system to humans, both directly and indirectly, has become more evident as aquaculture management in nearshore systems is improved upon.
In Tasmania, an island state of Australia, the farmed Atlantic salmon (Salmo salar L.) industry produced 51,298 tonnes of salmon in 2016–2017, and production has continued to increase annually. The industry in Tasmania alone produces around AUD $739 million of profit and has become the single most important aquaculture commodity in Australia [4,5]. Meanwhile, in the same region, the Australian fur seal (Arctocephalus pusillus doriferus) populations have rebounded since the sealing era [6]. It is the most abundant breeding fur seal in the region, and males regularly attempt to forage on the farmed salmon in the estuarine net pens and also forage on wild native fish species in the region, such as jack mackerel (Trachurus declivis) and rebait (Emmelichthys nitidus) [7,8]. The population remains reduced post-sealing, and their continued recovery remains tenuous as they face modern human influences on their ecosystem.
One of these is that the interactions between male fur seals and aquaculture leads directly to increased risk for the safety of fish, human, and marine mammals in many similar systems around the world [3,9,10]. Often, the Australian fur seals in Tasmania predate on farmed salmon through the nets of the net pens holding salmon in the estuarine habitat. This can lead to a reduction in salmon stock, risk to farm workers, and occasionally, these interactions can lead to the injury, entanglement, and mortality of the seals [11,12]. Direct impacts (entanglement, seal–human interactions, etc.) are currently being mitigated through regulation and by the industry improving pen infrastructure; however the extent of indirect effects, such as bio-contamination risks, are largely unknown. At this interface, little is known about the indirect effects, such as the microbial connections between aquaculture and wildlife, as no research has been conducted on fur seals’ microbial communities in the regions around farms.
Microbial source tracking (MST) systems have been employed to follow sources of pollution and pathogens into the aquatic and marine ecosystems [13,14]. Historically, MST systems have relied on fecal coliforms and other indicator bacteria, such as E. coli, to follow terrestrial contamination through aquatic and marine systems, as well as determine water quality/safety [13,15]. However, these techniques are labor-intensive and have many limitations in their ability to discern point sources or the interplay between multiple sources, so the use of genetic markers and genetic libraries have been adopted as being more precise in measuring point sources as molecular methodologies continue to advance [16,17,18,19]. With advances in technology, the ability to track multiple taxa in microbial communities through systems has become possible [20,21,22,23]. Metacommunity analysis utilizes the knowledge of the diversity of species and changes in community structures to elucidate the extent of interactions within and between species assemblages, including microbial communities found in nature [16,24,25,26,27]. Comparing full microbial communities using microbiome analysis between geographic regions and trophic levels as a way of analyzing bacterial movements is an up-and-coming field of research [23,28,29]. Such work at the interface between wild fur seals, aquaculture, and human development would be very useful in laying the groundwork for biocontamination monitoring and management.
Microbiota are communities of microbial organisms living in and interacting with a distinct environment, for example, the gut or the skin of another organism [30,31]. Microbes, such as bacteria and fungi, thrive in a wide variety of environments, depending on their specific growth requirements and characteristics. Many are shared through trophic systems, from prey to predator, and up the food chain [32,33]. Some microbes are geographically more or less abundant, and their presence in a host can indicate whether that animal has spent time in that region [34,35]. Studying microbiota differences is minimally invasive and has the capability of indicating host lifestyle, what environments the host encounters, and what pathogen exposure is occurring, all in one detailed analytical study when variables such as spatial and temporal variability are well characterized [34,36].
It is known that a shift in diet and the consistent use of new environments can alter the microbial community in the gut as well [37]. Differences in nutrition, age, and regionality are also known to affect microbiome structure and diversity in many species, including pinnipeds [38,39,40]. It is understood that as an animal matures through life stages, their microbiome shifts with increasing microbial input from the environment and their changing diet [41]. However, in adult animals, the microbiome is considered remarkably stable [42]. Therefore, differences seen in adult pinnipeds’ microbiota in the same population are expected to be minimal and, if existent, to be related to novel prey or habitat use.
As there are no native salmonids in Tasmania, salmon are not a natural prey item for wildlife here, and their potentially novel microbial communities are now entering the ecosystem and native predators’ gastrointestinal tracts [43,44]. The microbes in farmed salmon may be transferred to the ecosystem, wild animals, and people in the region through biocontamination, predation, or direct interaction with salmon farms and farmed salmon. The aquaculture of Atlantic salmon is known to introduce pathogens into natural ecosystems, so a monitoring scheme would be very useful for the early detection of pathogen spread [43,44]. As many male fur seals frequent the farms during the non-breeding seasons and haul out on nearby rocky islands to rest with other seals that are foraging in the region, it is likely that shifts in microbiota would be most pronounced in the males that frequent the farms and would be most like those found in other adults that forage and haul out in the region.
This study aimed to elucidate any potential microbial community differences in seal gut microbial communities associated with foraging on or near non-native farmed salmon. This study provides a baseline understanding of the microbial community of Australian fur seal guts across Tasmania, and what potential life history and external variables lead to changes in microbiomes in this recovering pinniped population. The microbiomes of Australian fur seals found in Tasmania were compared across age class, location of sampling, and proximity to salmon farms to determine diversity differences and detect the amplicon sequence variants (ASV)s, which drive the community diversity changes found. Differentially abundant ASVs in the seal microbiomes were identified using compositional analysis and then compared to a representative sampling of the farmed salmon gut microbiome ASVs to determine whether seals in regions around farms shared ASVs with salmon gut microbiomes. The identified ASVs could prove to be useful indicator species for interactions between seals and salmon farms. The data from this project will aid in future pinniped microbiome studies and metacommunity analyses.

2. Materials and Methods

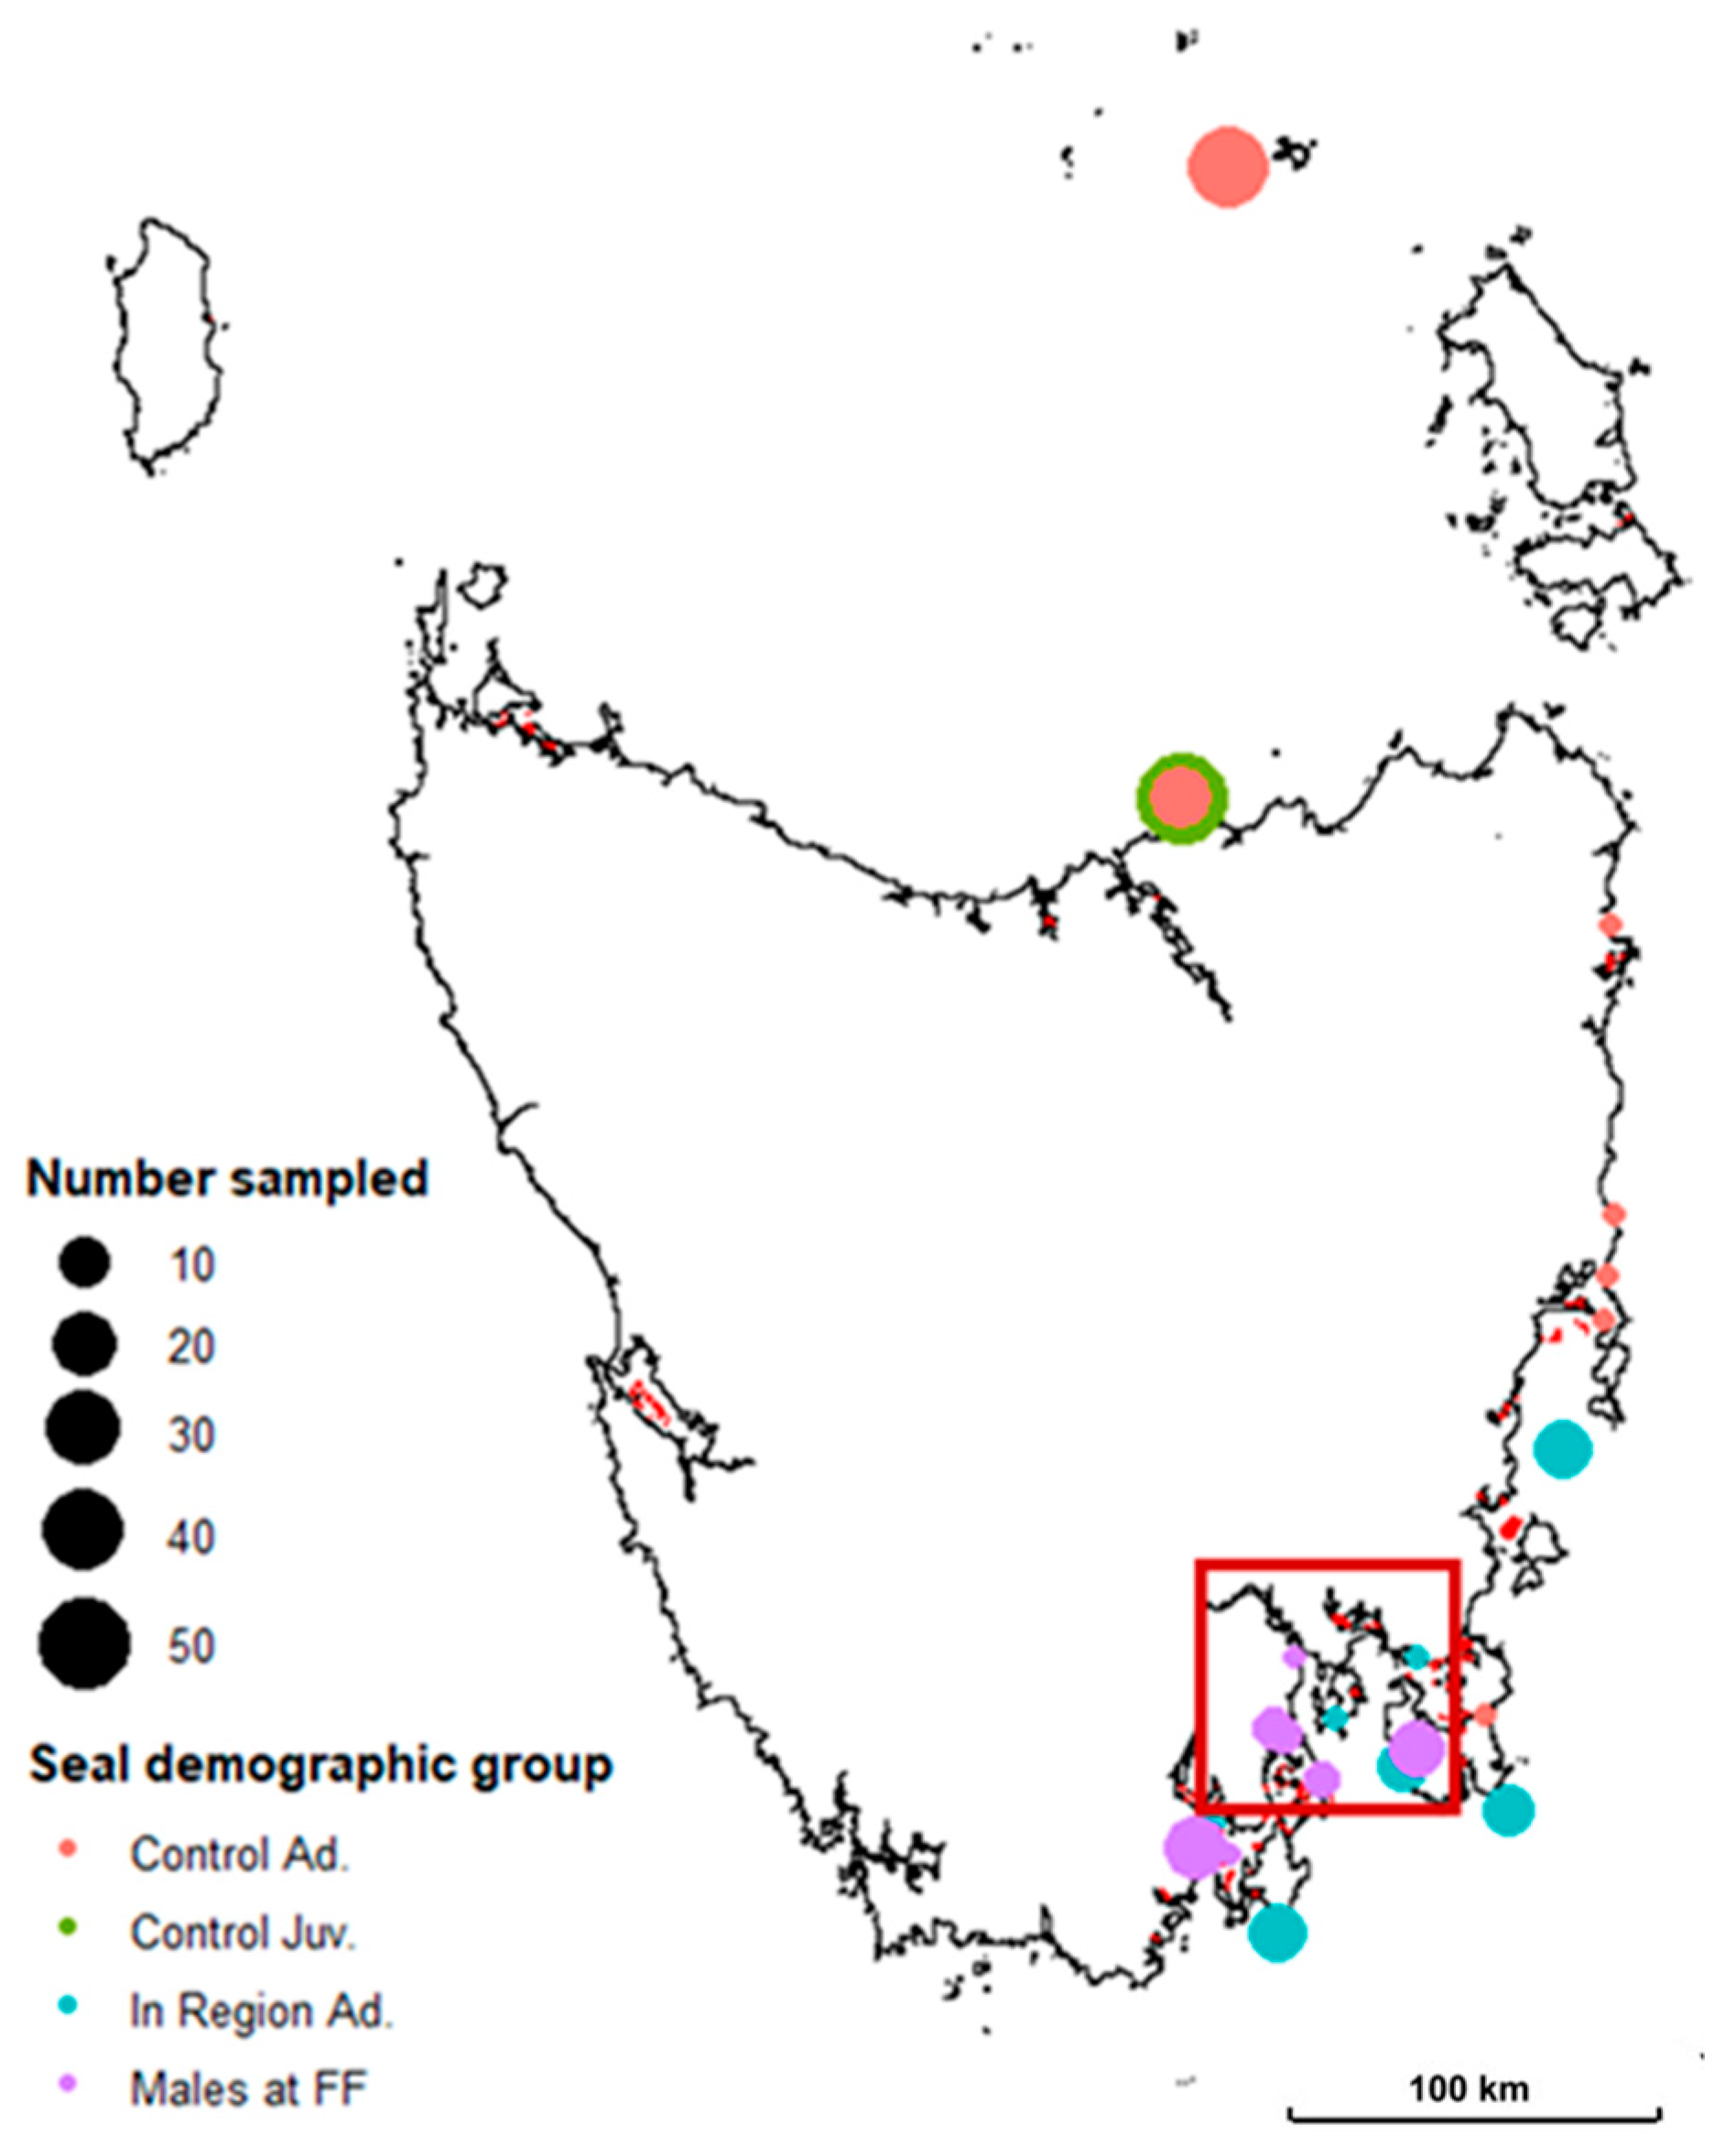
2.1. Sample Collection

Male fur seals (n = 41) were trapped at three salmon farm leases in the southern region of the state by the farm managers (who were permitted to do so) following the protocol set by the state government animal ethics committee and were then handled between May and November in both 2017 and 2018. Only males were trapped, as they are the only demographic that forage at the farms. Seals were trapped both inside and outside of salmon pens using baited pens, which close after a seal has grabbed the bait at the back of the trap, and were held overnight or up to 36 h in pens on land until sampling occurred under permits from the Department of Primary Industries, Parks, Water and Environment (2017/18: FA 17158 and 2018/19: FA 18114), and all handling of animals occurred under University of Tasmania Animal ethics (UTAS AEC project number: A0016754). At the time of collection, seals were sedated with Hypnovel (5 mg/mL Midazolam) (Roche products Pty Limited, Sydney, NSW, Australia) at a dose rate of 0.35–0.6 mg/kg, depending on the size of animal and its state of excitement. Rectal swabs were taken from each male, two were placed in RNAlater-like preservation buffer (40 mL of 0.5 M disodium EDTA (pH 8.0), 25 mL 1 M sodium citrate, 700 g ammonium sulfate, and 935 mL of sterile distilled water filtered through a 0.2 micron filter). The swabs/feces in the preservation buffer were frozen at −20 °C for later extraction.
For control samples, we sampled feces from adult animals that were present on haul-outs both in the region around farms and at rookery islands in the Bass Strait and took rectal swabs from pups handled at those same rookery islands (Figure 1). These controls were appropriate for our study considering the limitations related to fur seal life history/behavior, permissions, and resources available. Pups were swabbed at Tenth Island in January 2018 (n = 50). The sample handling and storage were the same as the above for males sampled at the farms. Feces from adults on Tenth Island and Judgement Island in January 2018 were also collected (n = 56) in 0.9% saline and preservation buffer as per the swab methods, fecal samples were collected by swabbing the outside of fresh feces to obtain approximately 500–800 mg of feces. In September and October (2018), whole fecal samples were collected and frozen by collaborators, and then 50 random samples of fresh scats from islands in the southeast of Tasmania were subsampled in preservation buffer to be included in the dataset. Necropsies were performed on freshly dead and moderately decomposed carcasses of fur seals from around Tasmania during this study, and fecal samples were collected in preservation buffer to be included in this study (n = 24), these were then assigned to the appropriate seal group based on the location of stranding.

2.2. DNA Extraction and Sequencing

The extraction of DNA from swab and fecal samples (180–200 mg feces/sample) was performed as per manufacturer protocol using the Qiagen DNeasy mini stool kit (Qiagen, Hilden, Germany) or the updated version of the same kit, Qiagen Fast stool mini kit (Qiagen, Hilden, Germany), using sterile techniques and was not carried out on days when salmon samples were processed in order to avoid contamination. A negative control was extracted and confirmed as negative via the PCR of the V1–V3 region of the 16S rRNA gene using 27F/519R universal primers. After extraction, DNA was stored at −20 °C until preparation for sequencing. Samples were tested for nucleic acid content and quality using the Nanodrop 8000 spectrophotometer (Thermo Scientific, Waltham, MA, USA) before sequencing. The sequencing was carried out at the Ramaciotti Centre for Genomics, Sydney, NSW, Australia, on the amplified product along with a sequencing control from implementation of the 27F/519R universal primers for the V1–V3 region of the 16S rRNA gene in order to compare the previously sequenced farmed salmon microbiomes directly, which also utilized the V1–V3 region gene target, and to increase resolution at the genus and species level in gut microbiome analysis [45,46]. The representative farmed Atlantic salmon gut microbiome sequences from the different farm leases in southern Tasmania, which are included in the analysis here, can be found in National Center for Biotechnology Information (NCBI) Sequence Read Archive under accession number SRP133157; these have been analyzed and have revealed no difference to salmon gut microbiomes from the same farms the seals were captured from and were determined to be representative of farmed salmon in Tasmania ([47] unpublished data are available through GenBank). Quality control, library preparation, and normalization was carried out before sequencing amplicons was carried out with a MiSeq v3 kit (Illumina, San Diego, CA, USA) for paired-end 300bp sequences on the Illumina MiSeq platform.
Groups for the seal and salmon combined analysis are as follows: salmon; males sampled at fish farms (FF); seals sampled in the region around salmon farms (InRegAd), which includes necropsied animals and feces collected from haul-outs in the same region of fish farms (<50 km away); control adults (feces and necropsied animals sampled from >50 km away from fish farms); and control juveniles (pups sampled at Tenth Island in the Bass Strait). The regions around FF and the sampling sites are shown on the map of Tasmania (Figure 1).

2.3. PCR and Sanger Sequencing of Enteric Isolates for Comparison to ASV Classification Post-Processing

The swabs and feces from the seals that were caught were lightly vortexed in 0.9% saline to suspend any bacteria on the swab in the solution, then the solution was serially diluted in sterile 0.9% saline to 10−1 and 10−2. These dilutions were then plated on brain heart infusion (BHI) agar, marine agar, thiosulfate–citrate–bile salts–sucrose agar (TCBS), xylose lysine deoxycholate (XLD), and eosin methylene blue agar (EMB) and grown for 48 h at 37 °C. After 48 h, morphologically distinct colonies from each agar type were lifted for isolation on BHI agar or marine agar dependent on the initial growth media. Isolate DNA was extracted for PCR and identification via Sanger sequencing by aseptically transferring a pure colony into 400 µL of sterile double-distilled water and heating at 100 °C for 10 min, then centrifuged for 1 min at 12,000 rpm to pellet cell particles. The supernatant was used as the genomic DNA in PCR reactions. The bacterial 16S rRNA V1–V3 region amplicon was amplified using conventional PCR methodologies with MyTaq red mix, 27F and 519R universal primers at 10 µM, genomic DNA, and sterile double distilled water (10 µL, 1 µL, 1 µL, and 11 µL, respectively, with water added to fill reactions to 25 µL) reactions were run on a Biorad thermocycler with the following parameters: 95 °C for 1 min, then 30 cycles of 95 °C for 1 min, 55 °C for 1 min, and 72 °C for 1 min, then final extension at 72 °C for 1 min and held at 10 °C until taken off the thermocycler. Sanger sequencing was used to sequence the 16S rRNA gene PCR product at Macrogen Inc., Seoul, Republic of Korea.

2.4. Microbiome Analysis

All analysis of bacterial 16S rRNA gene amplicon sequence data was carried out using QIIME 2 ver. 2021.8 (https://qiime2.org/ accessed 15/06/2023) and the R packages ‘tidyverse’, ‘qiime2R’, ‘vegan’, ‘scales’, ‘phyloseq’, ‘microbiome’, ‘ancom’, and ‘indicspecies’ in RStudio (https://posit.co/products/open-source/rstudio/ accessed 15/06/2023), employing R v.3.6.1 [48,49]. Seal samples and salmon samples were processed through Qiime2 separately due to their being processed and sequenced separately. For both, the bioinformatic pipeline is as follows. Forward and reverse reads had primers and adapters removed using ‘cutadapt’ then were denoised, edited for quality, and joined using DADA2 (ver 1.14) before classification using ‘sklearn’ and the SILVA 138 16S reference database at the default confidence threshold of 70% [50]. To avoid a loss of data, no rarefaction was used—only samples with more than 1000 sequences were utilized. Alpha and beta diversity were calculated for within-sample and between-sample diversity. Seal samples were analyzed for richness and Shannon diversity metrics, and differences between factors were tested for significance using pair-wise Wilcoxon rank-sum tests. Specifically, any potential diversity difference due to sample type were tested for in order to identify any bias due to swab or feces. The beta diversity metrics calculated were Bray–Curtis distances. To visualize and cluster samples, a principal component analysis (PCoA) of Bray–Curtis distances was used and to measure between group differences, a PERMANOVA of Bray–Curtis distances was used. Due to the expected high level of diversity differences between salmon and seal microbiomes and the lack of information this would add to testing our hypothesis, we did not test the diversity differences between seals and salmon. Alpha and beta diversity metrics were calculated in R using ‘vegan’ and ‘phyloseq’ packages and visualized using ‘ggplot2’ and ‘ggpubr’ [48,51,52].

2.5. Compositional Taxonomic Diversity Analysis

The analysis of taxonomic diversity was carried out in R v.3.6.1 using the packages ‘qiime2R’, ‘phyloseq’, ‘ancom’, ‘indicspecies’, ‘vegan’, ‘ape’, ‘exactRanktests’, ‘nlme’, ‘compositons’, ‘readr’, and dependent packages. Compositional differences in microbiomes between seal groups were determined using an analysis of the composition of microbiomes (ANCOM) using ANCOM v.2 in R. This is the preferred way to handle microbiome data due to the compositional nature of the data [53]. A random intercept model adjusted for other covariates was employed for the ANCOM analysis to account for random variation within samples and for the effects of covariates in seal samples (age class, region, animal status/sample type) [54]. The ASVs identified as significantly different between seal groups were then compared to the ASVs in salmon microbiomes to find any ASVs found in the salmon microbiome that were also found as differentially abundant across seal groups.

2.6. Isolate Sequence Database Construction and Utilization

To account for the novelty witnessed through the preliminary analysis of the taxonomic classifications of the ASVs in seal gut microbiomes, a local and species specific database was constructed using the isolates cultured from a subset of the same seals used in this comparative microbiome study. The V1–V3 region sequences from the isolates cultured and sequenced via Sanger sequencing, which has low error rates and high-quality reads, were annotated via NCBI nucleotide BLAST (blastn) and the top ten best hits for the sequences were identified. These higher quality sequences and their taxonomic assignments were used to classify the ASVs that were differentially abundant between seal groups via BLAST in Python to determine whether their assignment from the global reference database was accurate for assignment compared to a reference database from cultured isolates from seal microbiomes. All further analysis was carried out in R using the following packages: ‘taxonomizr’, ‘tibble’, and ‘tidyverse’. The BLAST results of the isolate sequences were reduced to one taxonomic assignment by selecting the highest percent identity, and when multiple accession numbers had the same percent identity, the least common ancestor was used. These classifications of ASVs were compared to the classification of the same ASVs via the Silva 138 reference database and sklearn classification. For each ASV, the higher percent identity taxonomic classification from the two reference databases was assigned to that ASV for the analysis of taxonomy presented for the differentially abundant ASVs.

3. Results

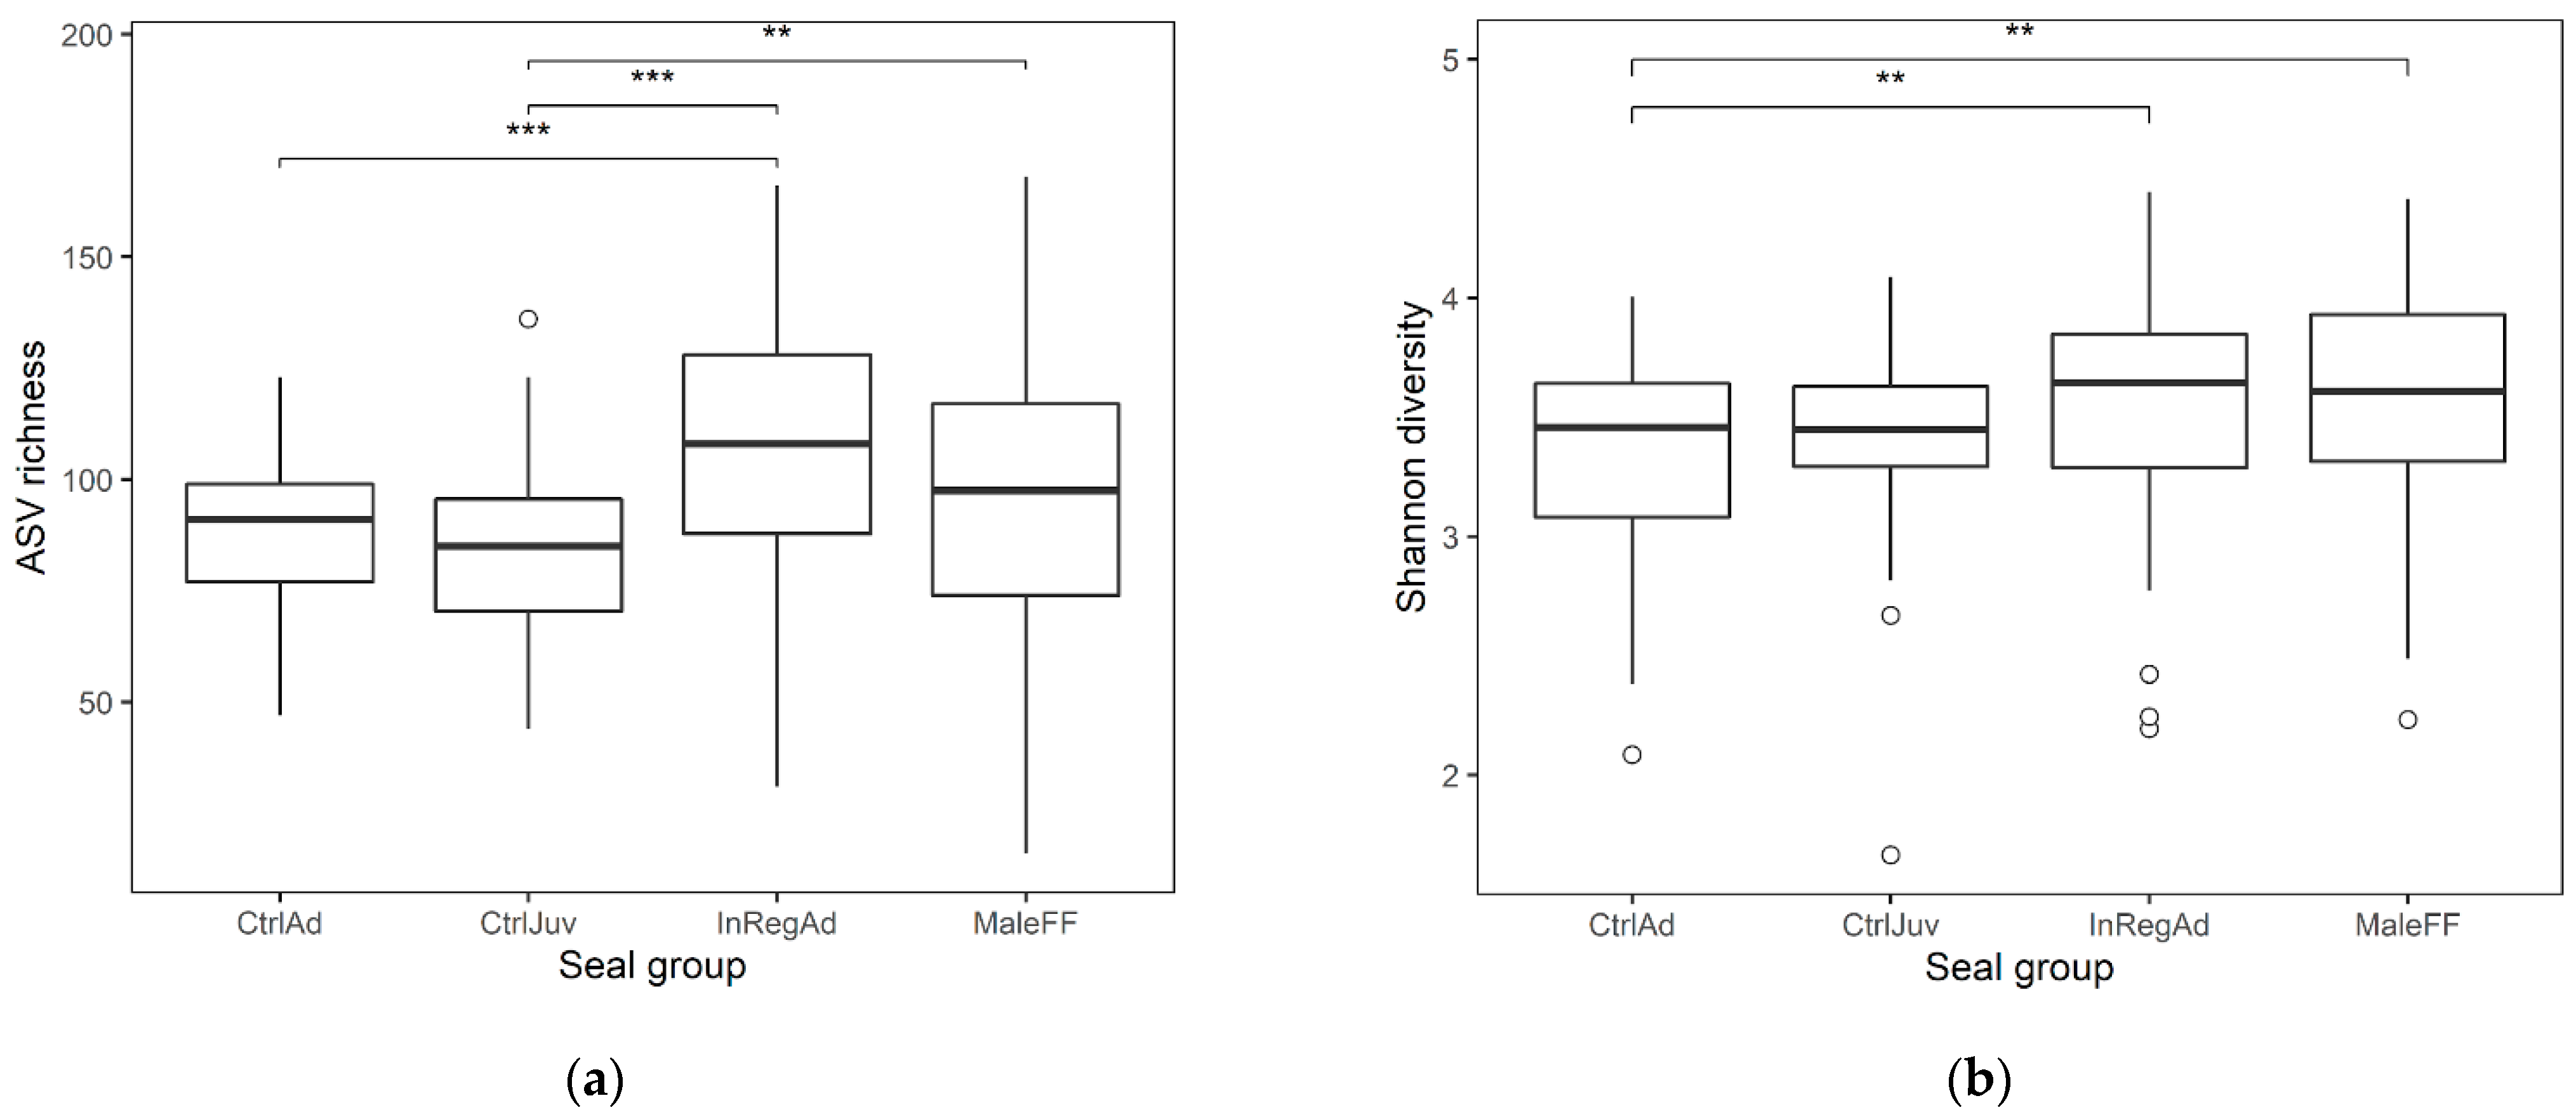
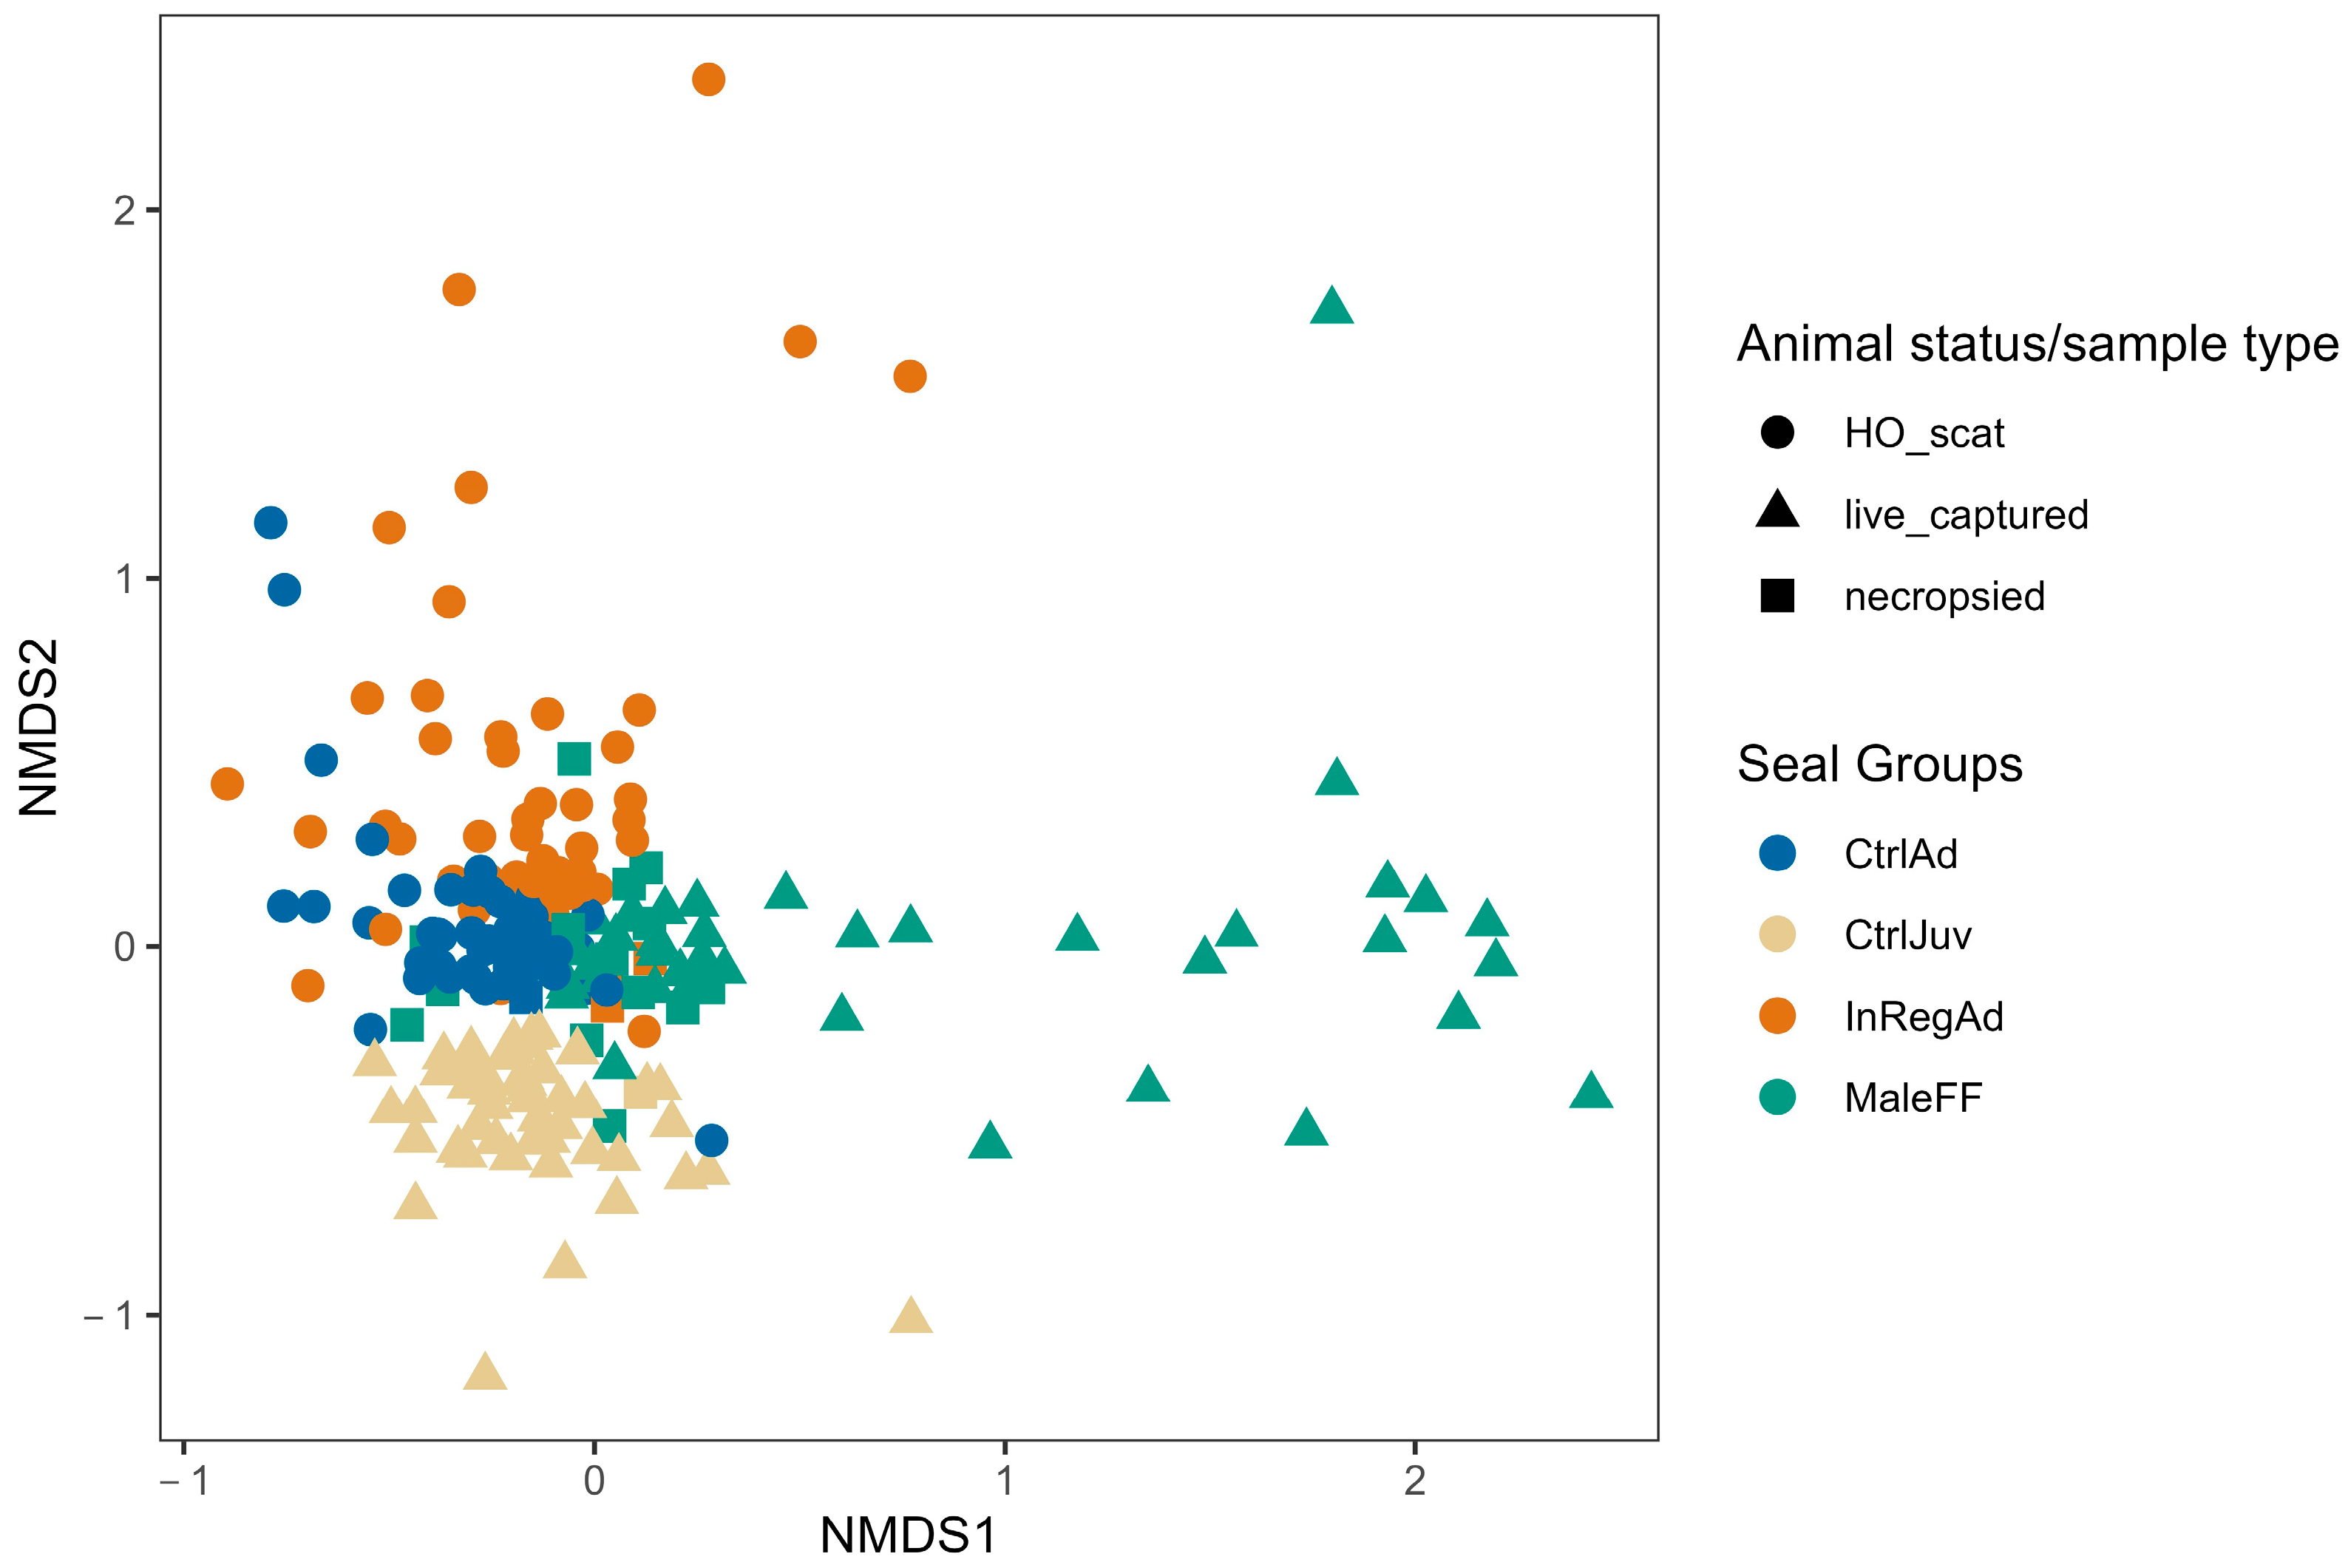
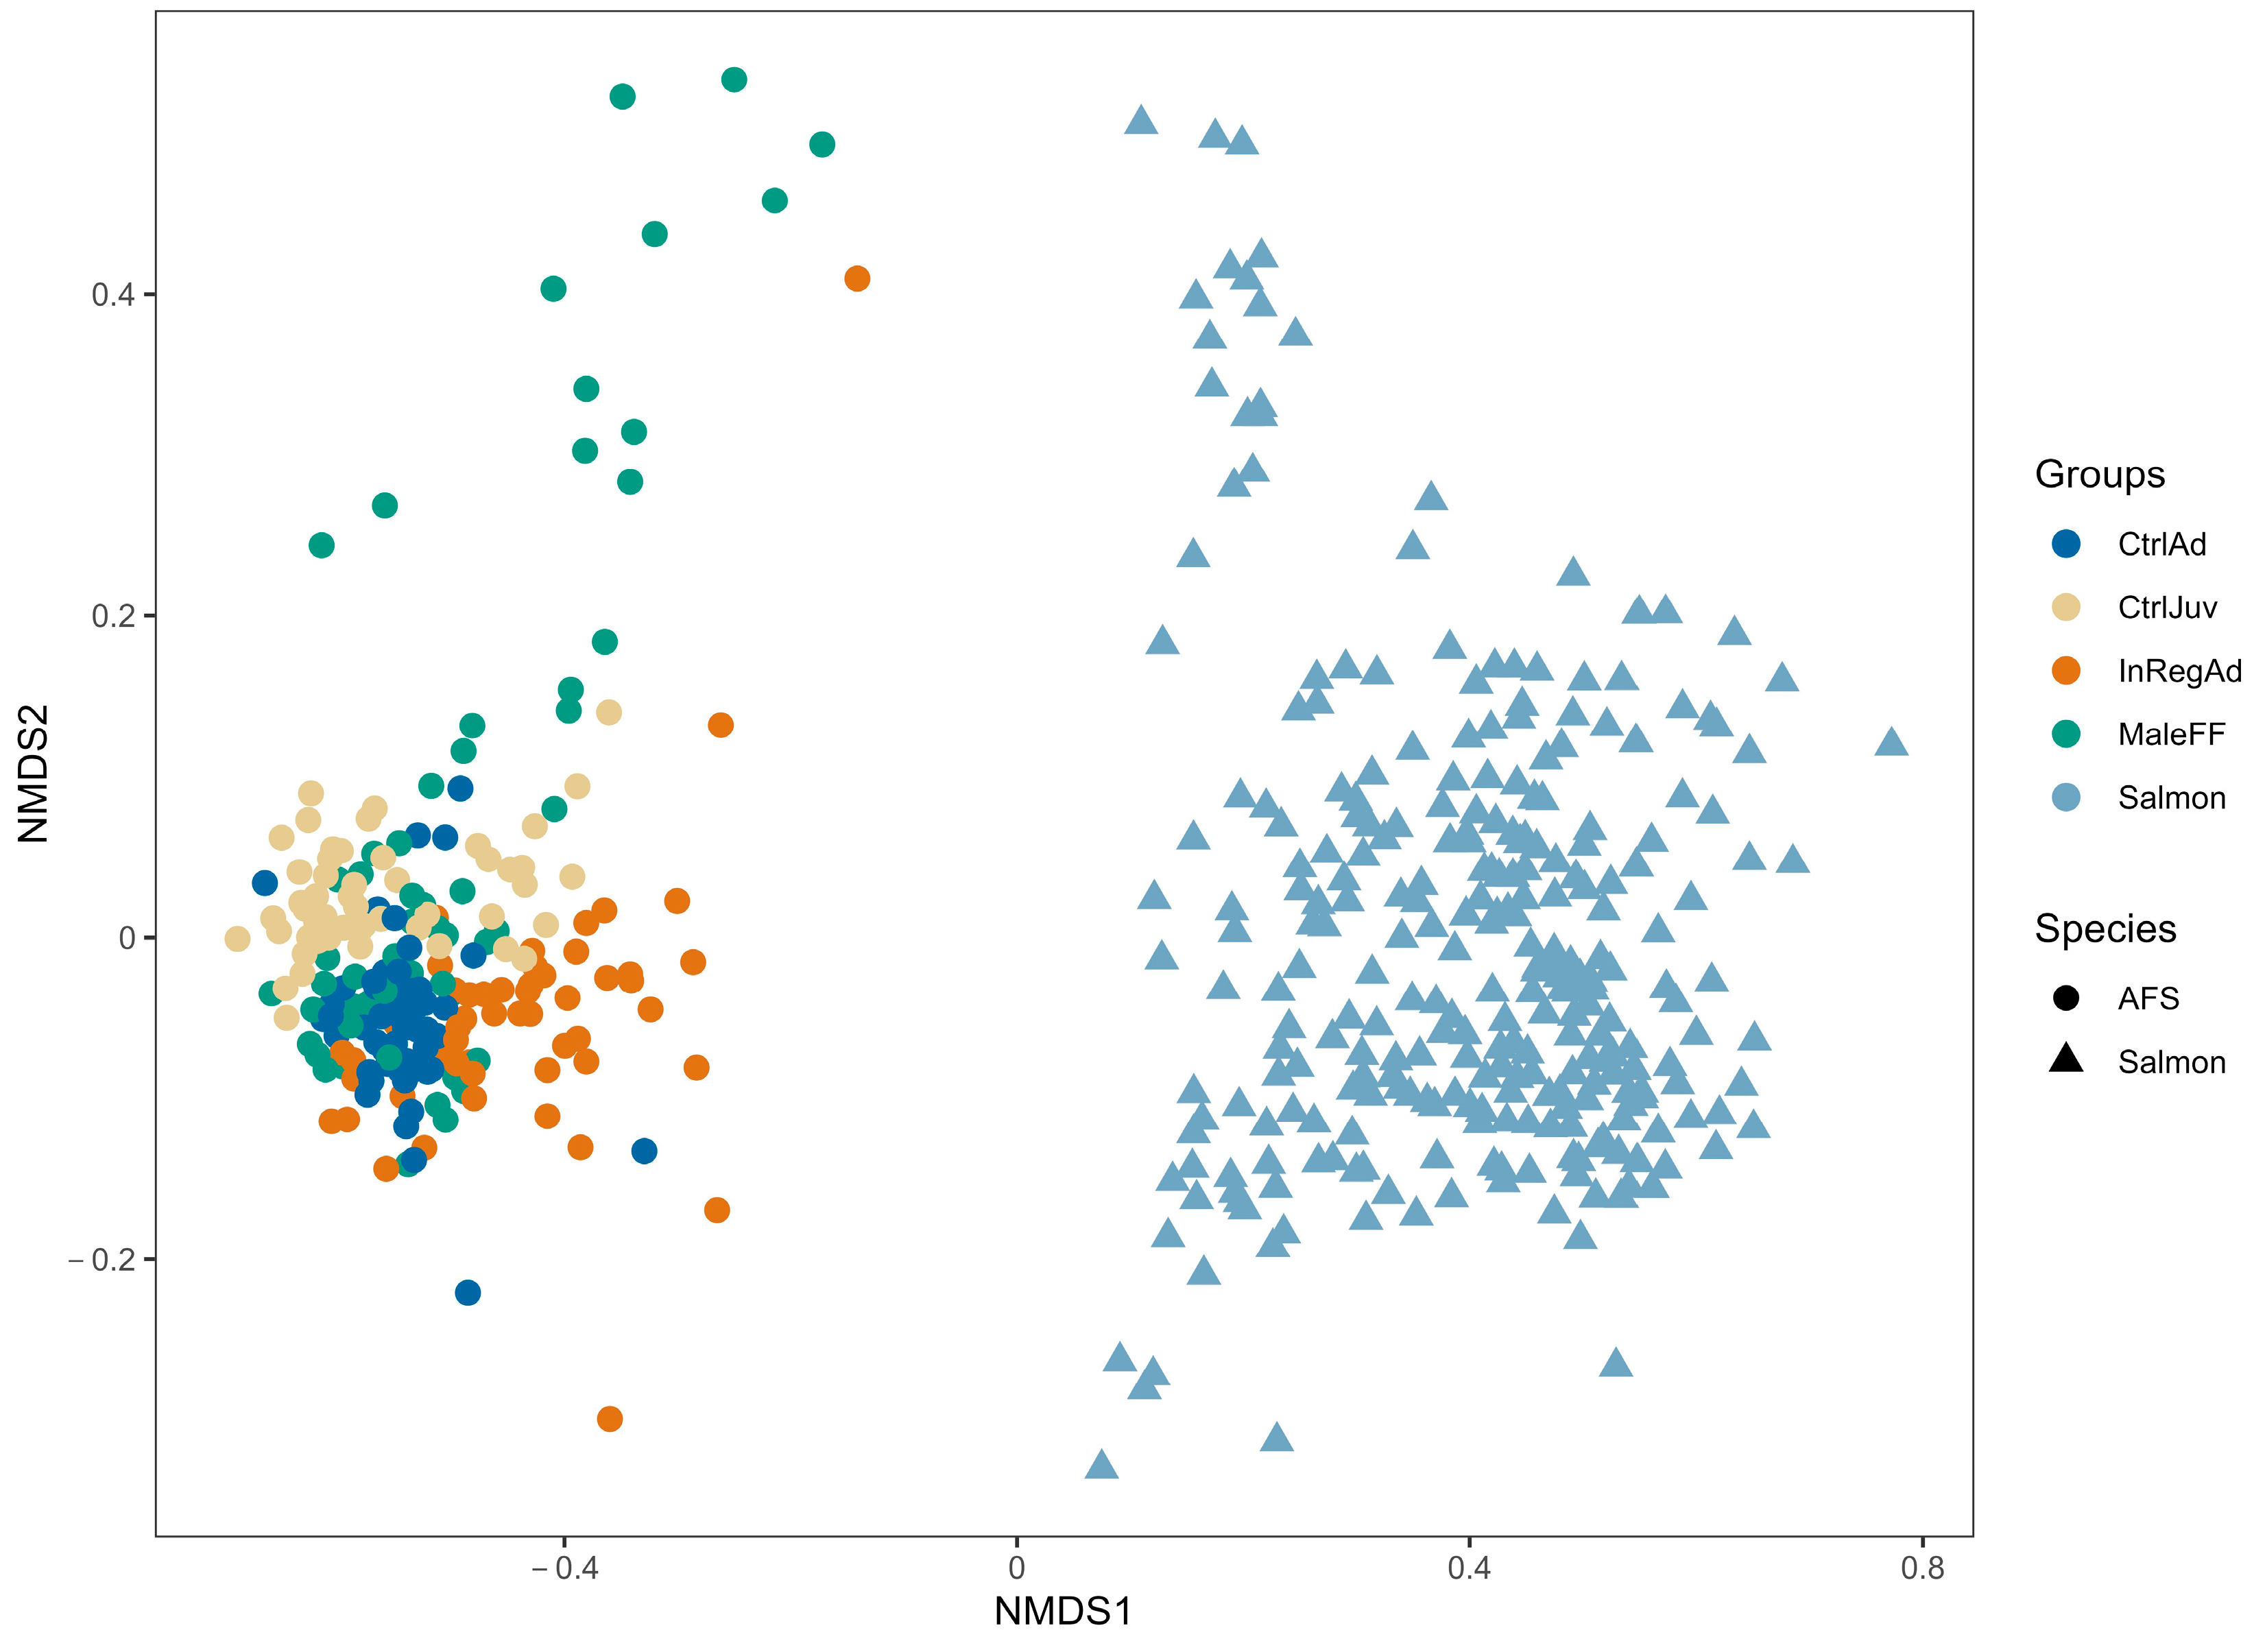
3.1. Seal Sample Alpha and Beta Diversity

For all seal samples (n = 216), after quality filtration, the mean of reads per sample was 11,521 reads (min: 1321; max: 65,245). The richness and the Shannon diversity indices were tested for differences between groups by testing with Wilcoxon rank-sum pairwise comparisons. There was no significant difference in richness or Shannon diversity between swabs and feces (p-values = 0.13 and 0.64, respectively), nor were there significant differences found between the scats collected at haul-outs, the live-captured seals, or the necropsy seals for either richness or Shannon diversity indices. There was a significant difference in richness between adults sampled and the juveniles sampled, as expected (p-value < 0.001), but not in the Shannon diversity index (p-value = 0.14) (Supplementary Material, Figures S1–S3). Some diversity differences were seen for richness and Shannon diversity when comparing all seal groups (control juveniles, control adults, in region adults, and males captured at farms). The Shannon diversities seen in each group are shown in Figure 2a, and the ASV richness is shown in Figure 2b. Significant differences existed between males from farms and control juveniles (p-value = 0.028) and scats collected from haul-outs in the region around farms and control adults (p-value = 0.0024) and control juveniles (p-value = 0.00027), but the in-region scats were not significantly different to swabs from males captured at the farms (p-value = 0.239) (Figure 2). As these groups were defined as distinct through the study design and the potential confounding factors showed minimal impact on the alpha diversity, we proceeded while using the groups assigned through the taxonomic diversity analysis.
The PERMANOVA of Bray–Curtis distances revealed significant community differences between multiple groups of seals. Significant differences between seal groups sampled were found (pseudo-F = 8.663, p = 0.001), while seals sampled in different regions of Tasmania also had significantly different community diversity (pseudo-F = 6.391, p = 0.001). In addition, juveniles and adult seals had significantly different community diversity (pseudo-F = 8.125, p = 0.001). To account for potentially confounding effects, we tested a PERMANOVA model using backwards selection, and the final model was selected, in which the significant variables included seal group, animal status (live captured and swabbed, haul-out scat, and necropsied animal samples), month, and region; this demonstrated significant differences between groups and, to a slightly lesser degree, the other variables (seal groups: pseudo-F = 9.008, p = 0.001; animal status: pseudo-F = 2.243, p = 0.001; month: pseudo-F = 1.674, p-value = 0.001; and region: pseudo-F = 1.414, p-value = 0.028). The Bray–Curtis dissimilarity distances show community differences between groups at the ASV level rather than the taxonomic level, with many males at fish farms forming an apparent cluster on PC1, as well as overlap seen in all group of seals with juveniles specifically showing similarity to all groups sampled (Figure 3).

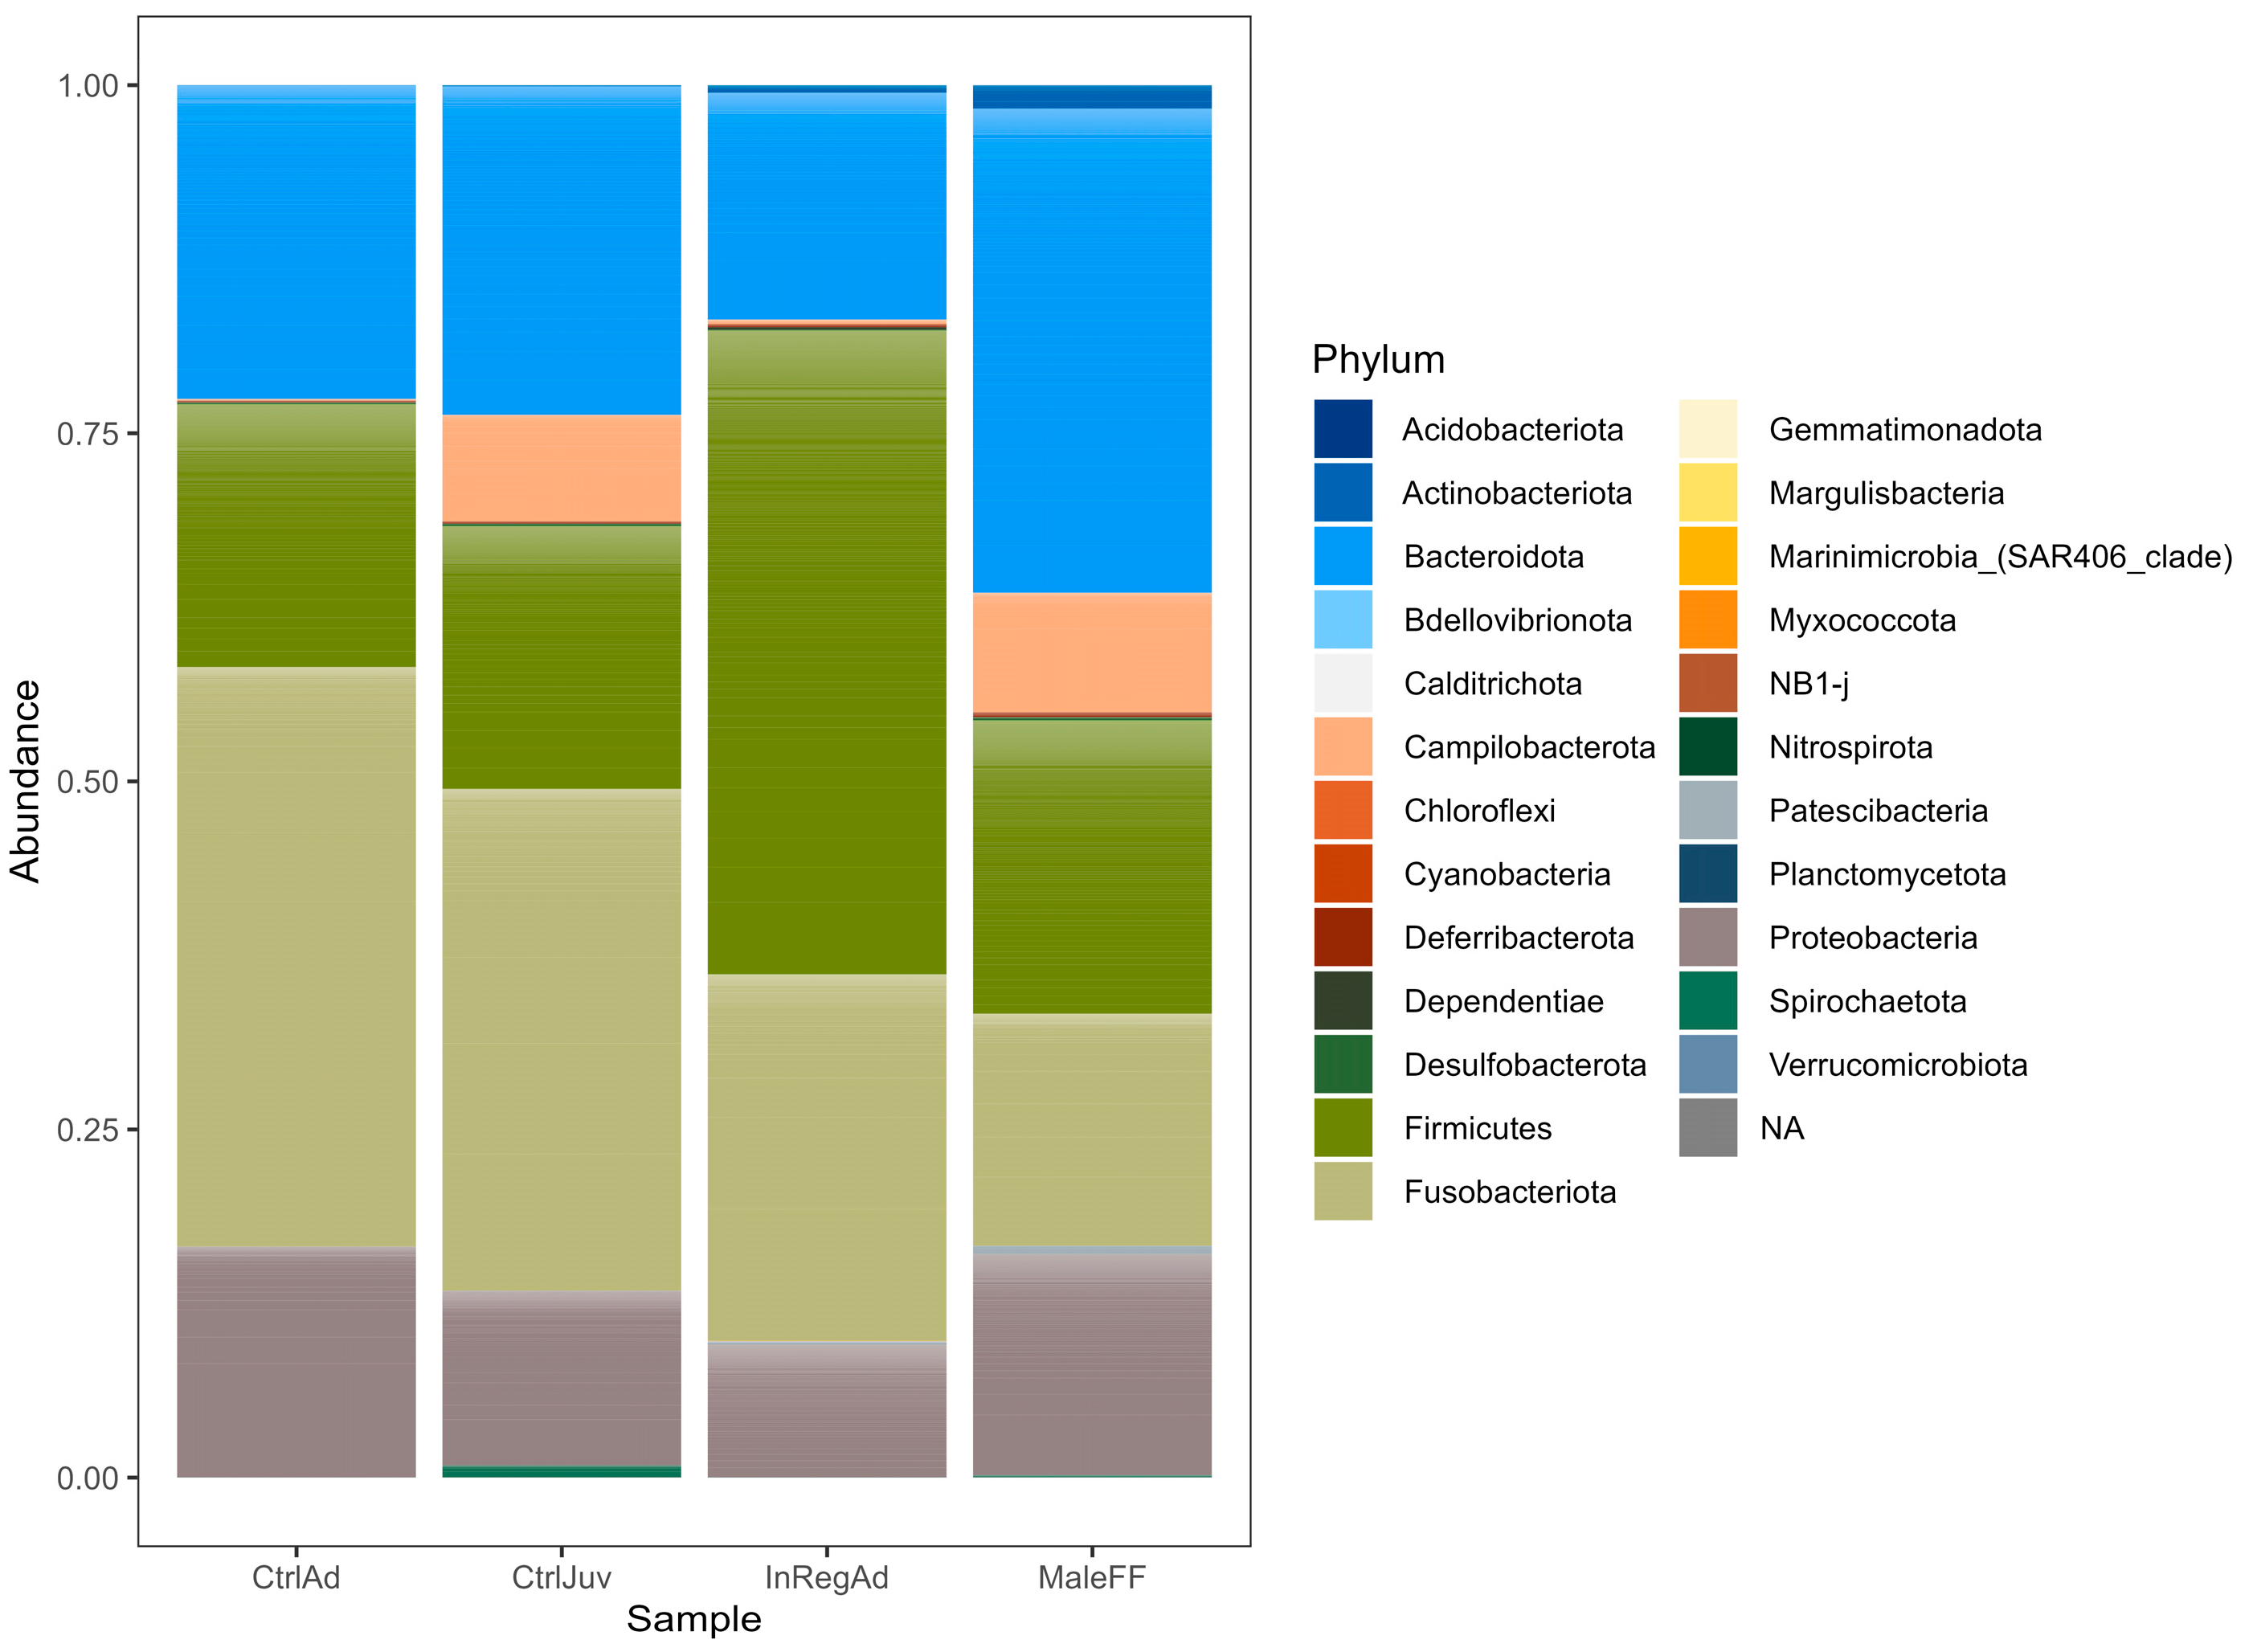
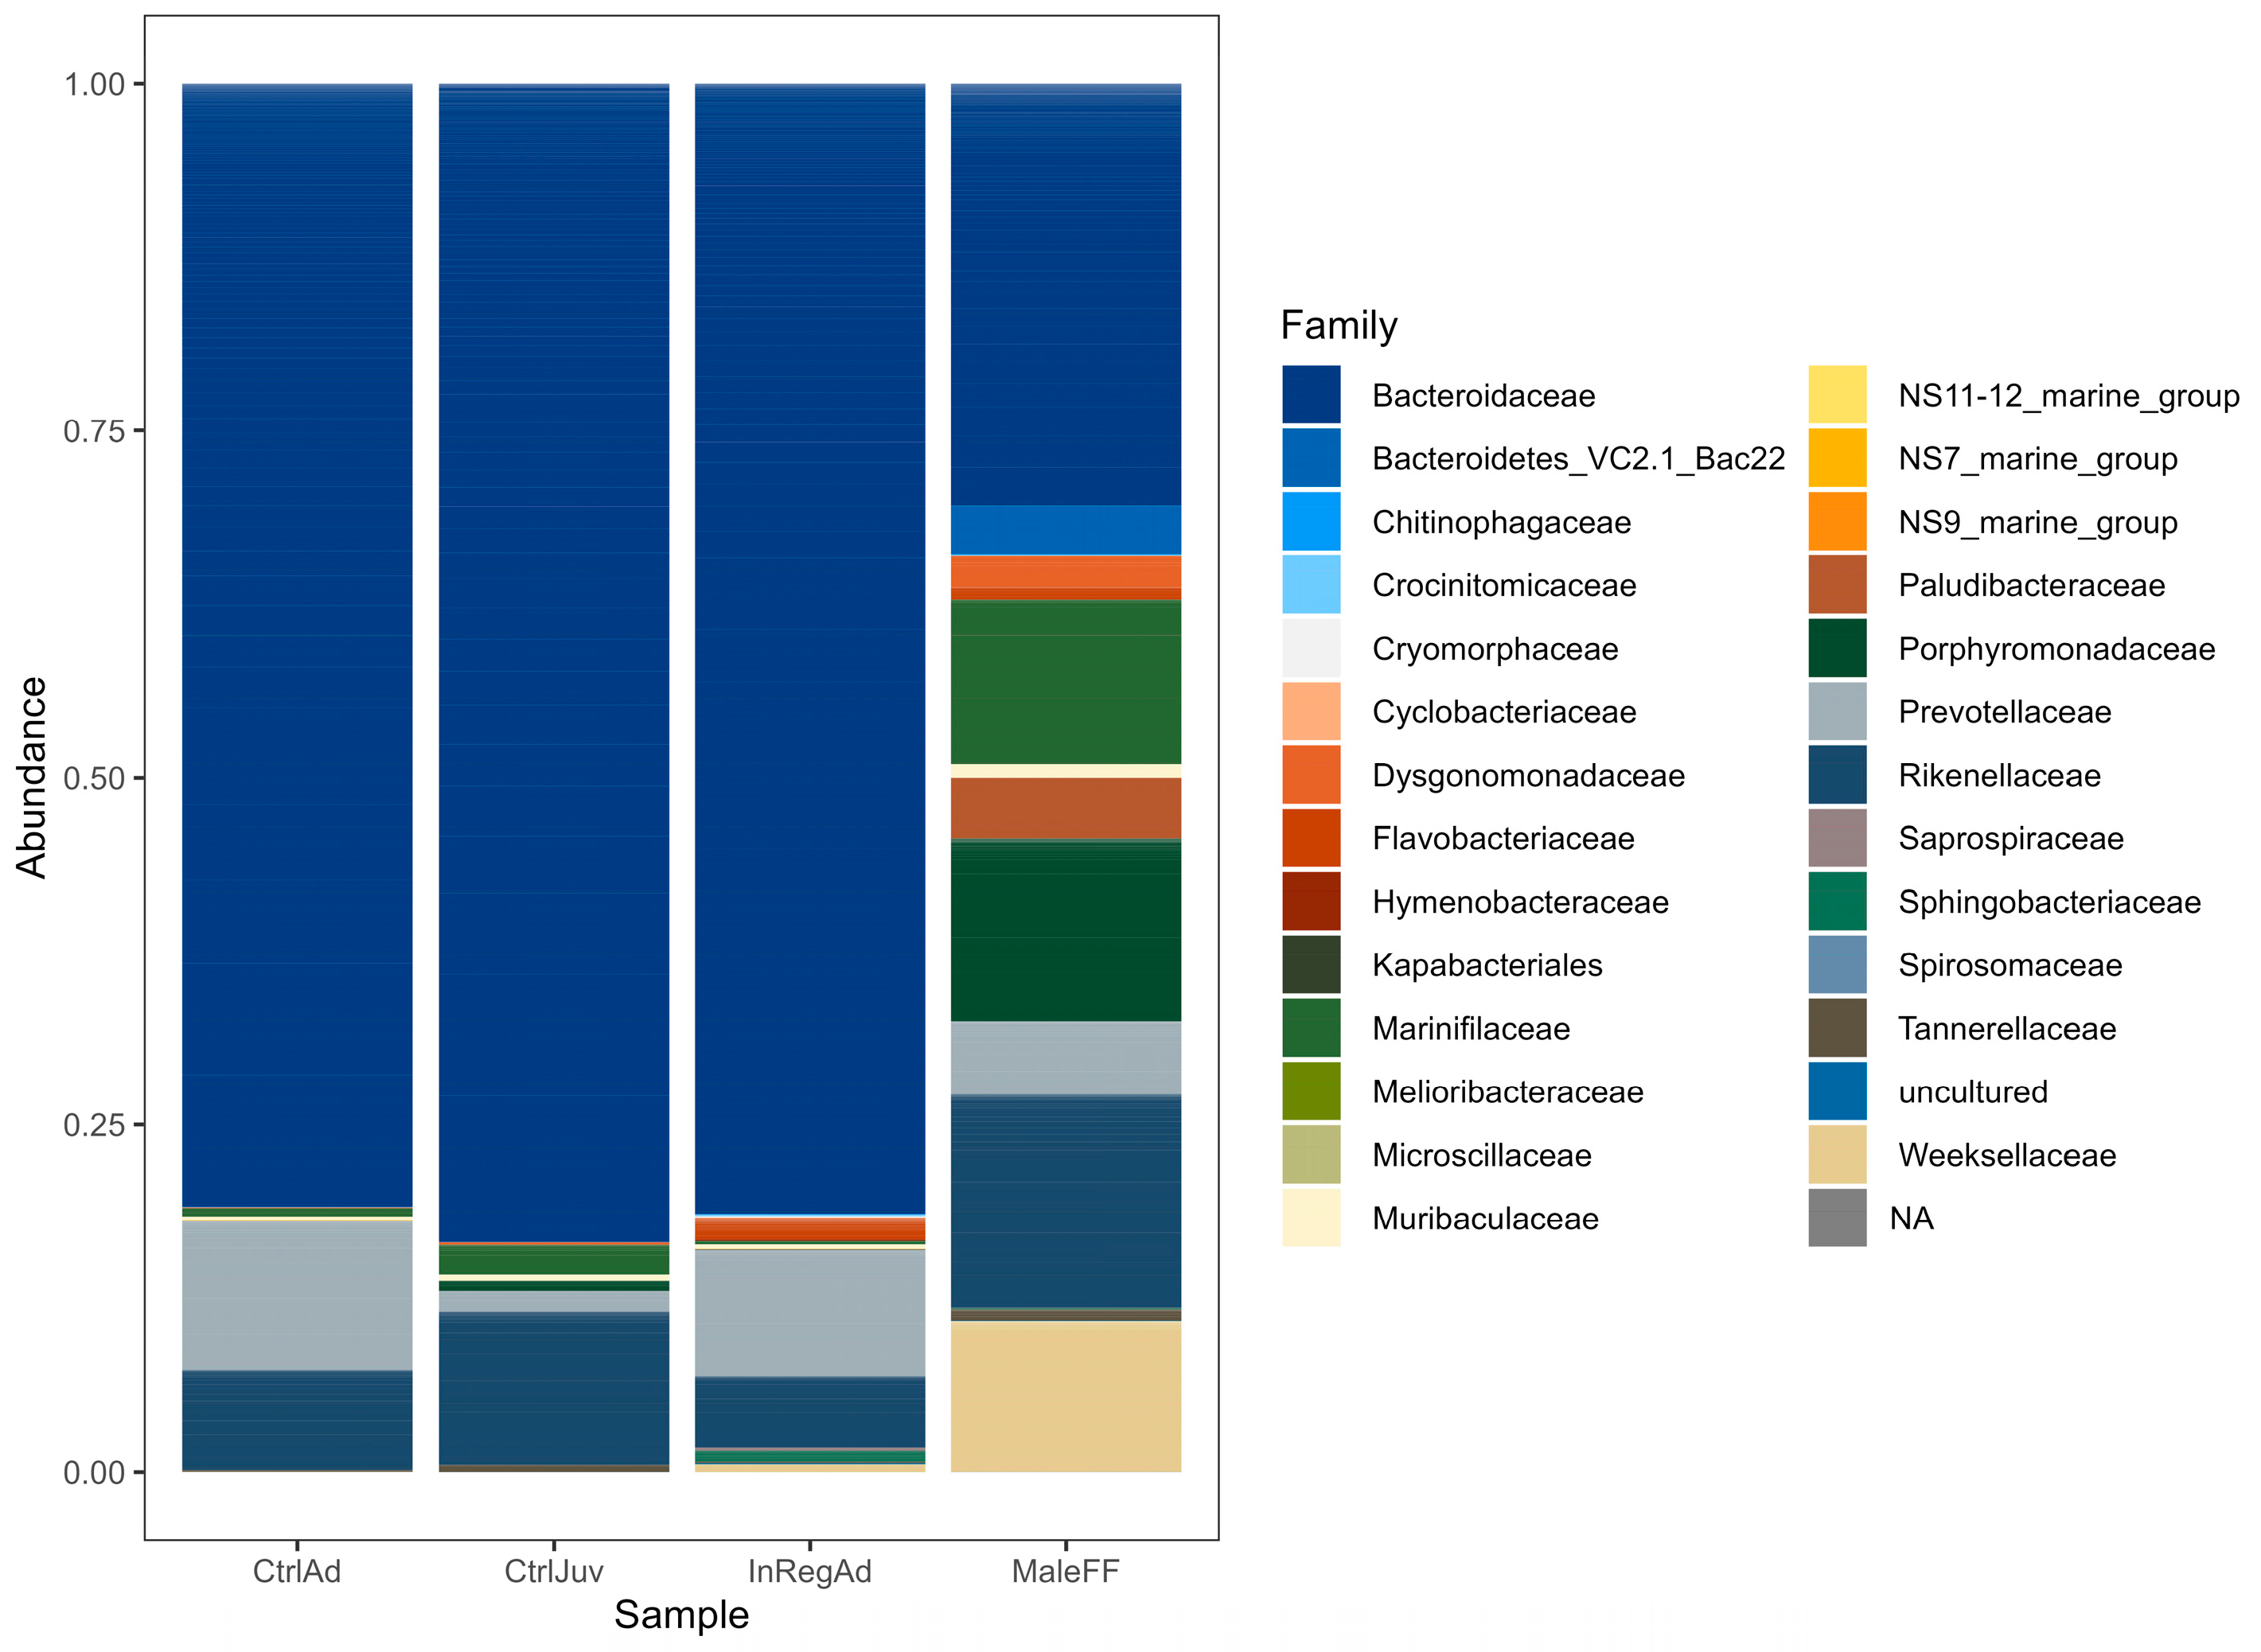
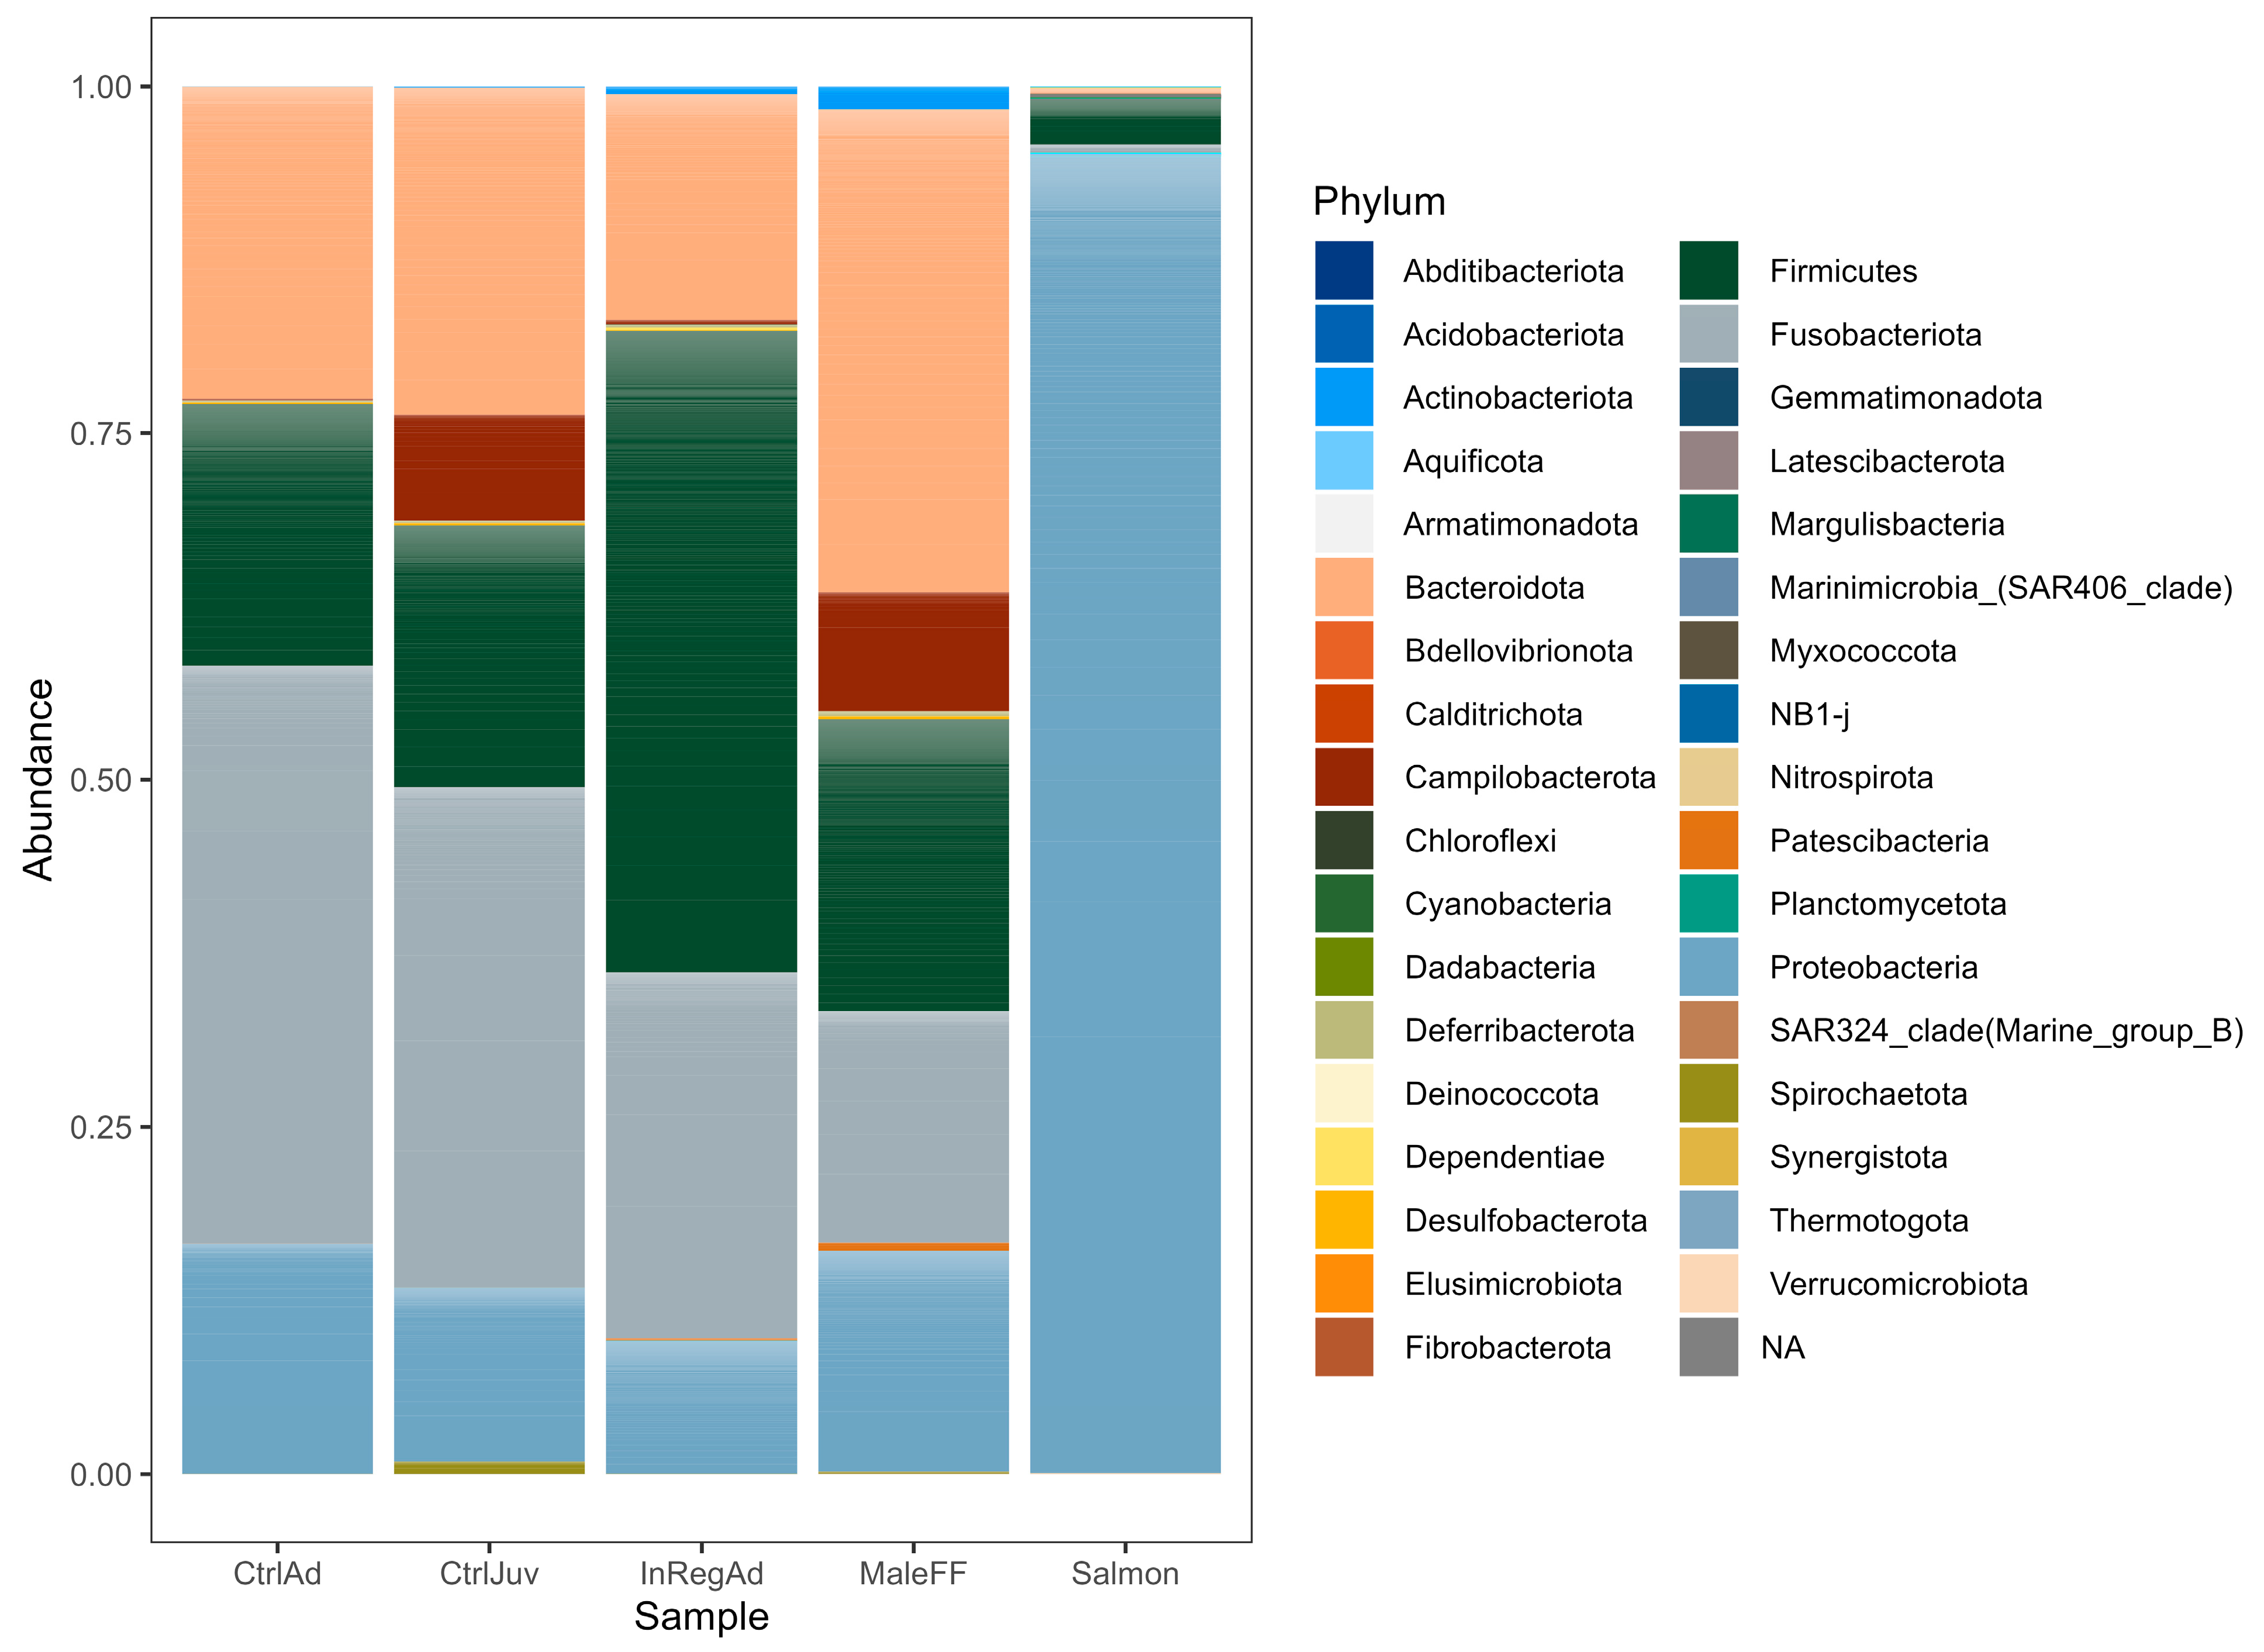
3.2. Taxonomic Diversity Differences within the Seals in Tasmania

Taxonomic differences between groups of seals sampled were analyzed for common and significantly different ASVs found within and between seals sampled. As multiple subsets of adults were sampled, the relative abundance of bacterial phyla represented in the four groups of seals are shown in Figure 4. Overall, the males sampled at the farms and the animals sampled in the regions around farms had more diversity within the phylum Bacteroidota than the other groups of seals. There were other phyla that appeared divergent, but this phylum was the most apparently different.
The proportions of families represented in Bacteroidota showed that the males captured on the farms were had a larger variation in the families represented (Figure 5).
The ANCOM analysis of seal microbiomes revealed 336 ASVs that were significantly different at a W-statistic threshold of 0.6 (W-statistic is a count of the sub-hypotheses passed during all of the pair-wise tests that make up the ANCOM) between seal groups when using sample-type as a covariate based on the sample-type being a confounding factor which would limit interpretation. Of the 336 ASVs, 80 ASVs were more abundant in males at fish farms than other groups of seals. Of the 202 ASVs that were differentially abundant at a stricter W-statistic threshold of 0.7, 61 were associated with males captured at the farms (Figure 6). ASVs that were found to be more significantly associated with salmon farm frequenting seals were a Weeksellaceae unclassified genus, Photobacterium damselae, Neisseria sp., Psychrobacter spp., Porphyromonas spp., Providencia alcalifaciens, and Campylobacter balseri; the rest are identified in Figure 6. The heatmap representing 79 differentially ASVs found most abundantly in adult scats sampled from the same region as the farms had several Bacillota (Firmicutes) and Actinomycetota (Actinobacteria) representatives, along with ASVs identified as Edwardsiella tarda (Supplementary Figure S4). From the culture results, which were used to create the local and specific reference database, a novel genus was identified. We sequenced the genome of a representative strain called Ap9-02, which is under the NCBI accession code GCA_009835005.1 (as part of bioproject PRJNA594230, the 16S rRNA sequence is on WTFG01000017.1). A full length 16S rRNA gene sequence retrieved from the draft genome confirms the closest relatives as the genera Ornithinobacterium, Moheibacter, and Faecalibacter in the family Weeksellaceae (phylum Bacteroidota) at a similarity of approximately 89–91% (using a full length 16S rRNA gene).
Six ASVs determined as differentially abundant between seal groups via ANCOM were assigned to an unclassified genus (16S rRNA gene sequence 91% similar to Ornithobacterium rhinotracheale (family Weeksellaceae, phylum Bacteroidetes), which had multiple isolates cultured from the seals captured at fish farms during this study; these ASVs were found significantly more frequently in the males from salmon farms (Figure 6). As the taxonomic evaluation of this unclassified Weeksellaceae genus (genome of representative strain Ap0902 is deposited under accession GCA_009835005.1) is ongoing due to its difficulty in being cryopreserved and revived, it will be referred to from hereon as “unclassified Weeksellaceae genus” in this study. All ASVs identified through ANCOM as differentially abundant that were classified as representing the unclassified Weeksellaceae genus were significantly related to males captured at fish farms compared to all other groups sampled, except one ASV, which was represented by 89 more reads in adult scats sampled in the same region as the farms than the males that were captured on the farms, and this ASV also had the lowest W-statistic of all six ASVs assigned to this unclassified Weeksellaceae genus.

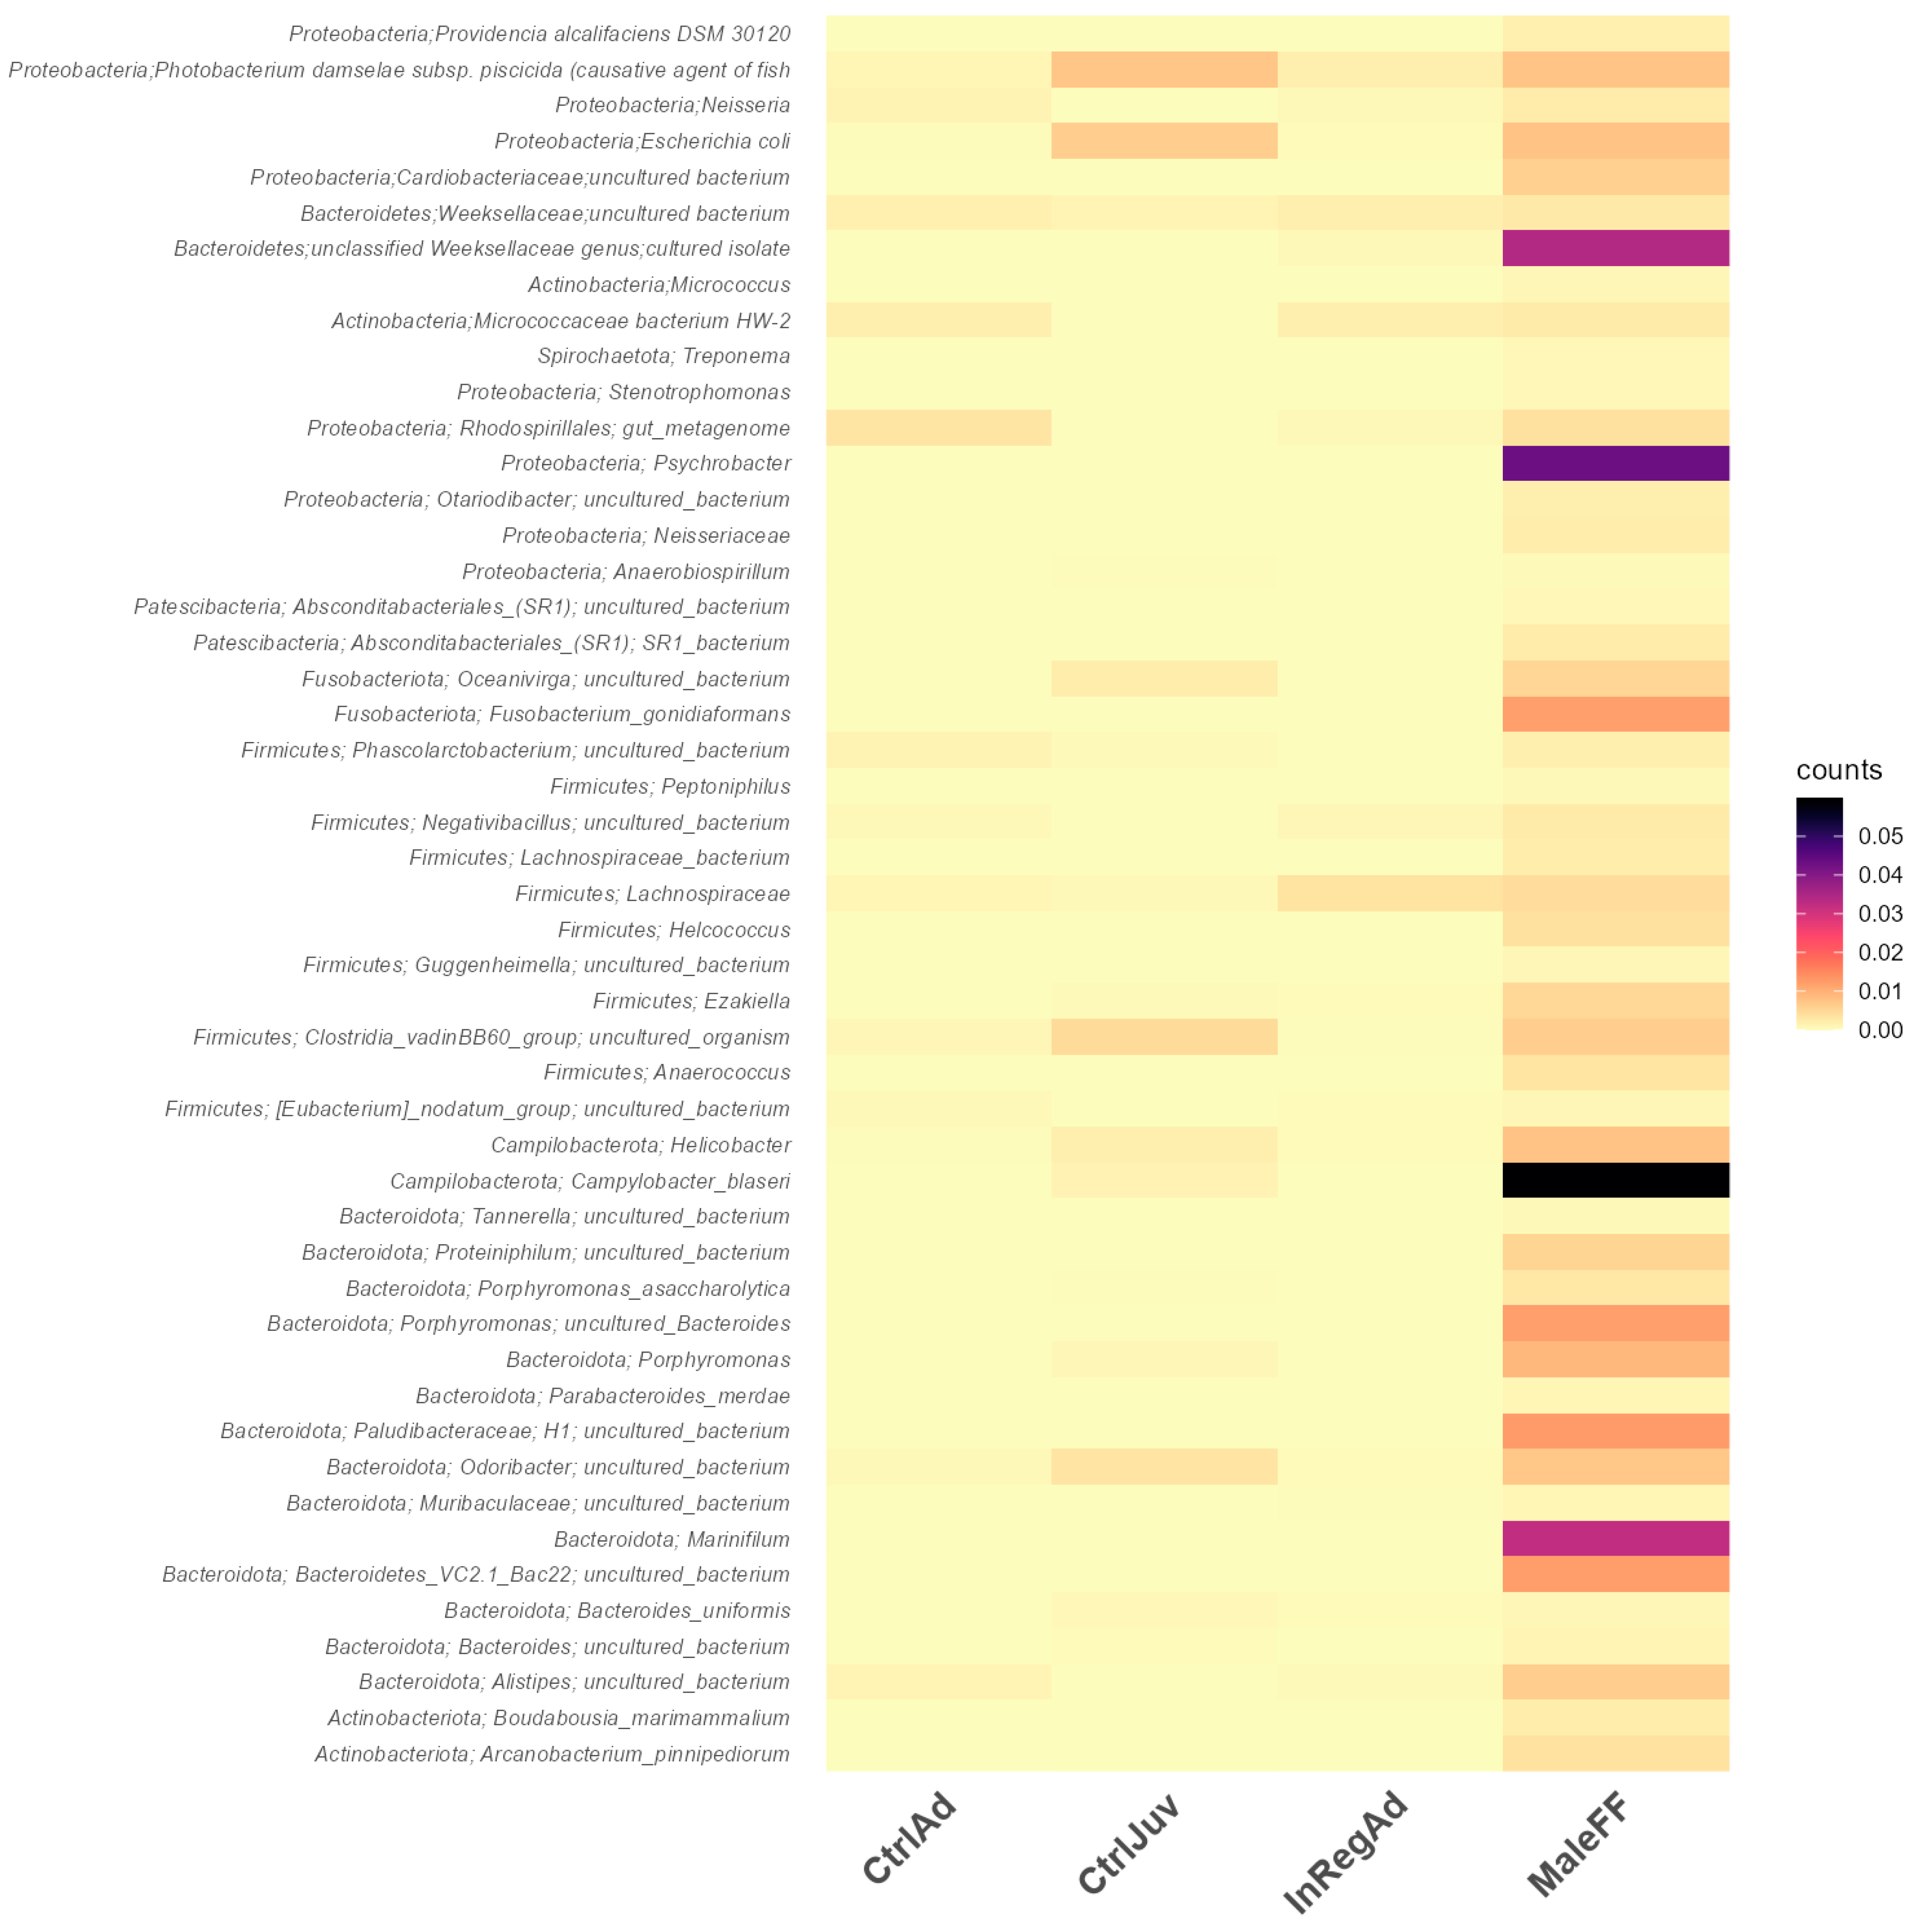
3.3. Differentially Abundant ASVs Also Present in Salmon

Salmon microbiome sequencing data had a mean read depth of 85,953 reads/sample (range 34–239,832 reads/sample), as this mean sampling depth is much higher than the seals, as was the range, and the comparisons of diversity between seals and salmon were deemed inappropriate for extensive analysis. Briefly, after removing samples with <1000 reads/sample to compare to the seal microbiomes, there were no significant differences in richness between salmon and any group of seals; however, the Shannon diversity in salmon microbiomes were significantly lower than in all groups of seals (p-value < 0.00001) (Supplementary Figure S5). In the beta diversity measured via Bray–Curtis distances, differences were extremely apparent between salmon microbiomes and seal microbiomes, forming two distinct clusters, one of seals and one of salmon, with no overlap (Figure 7).
To demonstrate why this may be the case taxonomically, the relative abundance of ASVs at the phyla level in salmon and the different seal groups are shown in Figure 8. These results illustrate how different the phyla represented are in the GI tracts of these two species, and that salmon have microbiota that are dominated by Pseudomonadota (Proteobacteria) (Figure 8).
We used the ASVs, identified through the ANCOM analysis, to determine whether any were also found in the GI microbiomes of farmed salmon. There were 18 ASVs found using ANCOM that were differentially abundant in seals and were also found in salmon gut microbiomes (Table 1). Of the 18 ASVs, 11 were most associated with scats sampled from seals in the region around farms and 2 were from the males at the farms. The remaining five were split between control juveniles and control adult scats. Interestingly, there were a number of potential pathogens that were found in both species: Providencia alcalifaciens, Photobacterium damselae subsp. damselae, and members of Clostridium sensu stricto 1 (Table 1). The ASVs assigned to the family Weeksellaceae found in salmon were not in the same genus as the novel ASVs found in seals. As the phylum Bacteroidota was the phylum with the greatest divergence among the groups of seals, we visualized the relative abundance of families in this phylum in the seal groups and salmon as well, which revealed more ASVs of the Flavobacteriaceae, Porphyromonadaceae, and Dysgonomonadaceae families in the males sampled from farms that were also found in farmed salmon (Supplementary Figure S6).

4. Discussion

This study documents taxonomic community and biodiversity differences in microbial communities in a wild pinniped gut in relation to presence at/near marine salmon aquaculture activity and a shared habitat with human development. Overall, alpha diversity differences seen between male seals sampled near or at fish farms and all other seals, suggest that microbiome biodiversity shifts seen in the males foraging at salmon farms and seals in the region may play a larger role in shaping fur seal gut microbiomes than age class does. However, beta diversity differences suggest that community makeup, rather than overall biodiversity, was implicated in the community diversity difference seen between groups of seals. The differences between pups and all adults were minor compared to the regionality or their foraging at or near farms, the differences witnessed were expected based on previous research indicating the community shifting as an animal ages [41]. The analysis of composition revealed several differentially abundant ASVs. Of the ones most associated with males captured at the farms or from the seal scats collected in the region around farms, one was an apparently a novel genus and a few others were potential pathogens, which could be used as microbes for biocontamination source tracking efforts.
One phylum where the differences between the males captured at the farms and the rest of seal groups was most obvious was Bacteroidota. At the family level within the Bacteroidota phylum, the differences between all adult groups sampled, indicating that the lower taxonomic differences in the present phyla was very different between seal groups, with males captured on the farms having higher diversity. This suggests that pups have a more basal microbial community which then shifts as a seal ages. Previously published work on fur seal pup gut microbiota in the region supports this and shows a change in microbial community between pup and adult fur seals [41,55]. We also noticed a similar proportion of AVSs in Campylobacterota between males captured at the farms and control juveniles; in all other aspects, the community diversity of pups overlapped with all other groups of seals. This may be an artifact of the representative bacteria in this phylum possibly degrading outside of the host faster than others and, therefore, the swabs from males at the farms and the live control pups were able to pick up this phylum up more readily. This limitation of comparing scat to swabs was unavoidable, but from our results, this difference appears minimal compared to the impacts of variables related to the seal groups tested.
Foraging on/near farmed salmon appears to have some effect on the biodiversity and taxonomic community of the seal microbiome, as seen by the differences in ASV richness, Shannon diversity index, Bray–Curtis dissimilarity distances, and the ANCOM results. Even when accounting for confounding factors, this trend appeared throughout the results. Due to the nature of sampling wild seals, we attempted to correct for the major confounding effects of sample type in all analysis, including the ANCOM model. It appears that taxonomic and bio-diversity differences transcend the effect of swabs vs. scat collection, and we found that the Bray–Curtis distances were partially explained by including animal status/sample type in the final model along with region and month (Figure 3). This suggests that sampling scat from haul-outs, feces from necropsied seals, and swabs from live handled seals does have some effect on the microbial community found via microbiome analysis. However, as the majority of samples cluster together, overlapping through their demographic groups regardless of sample type, with divergence in some samples from males captured at the farms and from scats collected in the region around farms, we believe that the driving factor is related to biological differences, not sample type/animal status. The majority of samples clustering together is expected as these groups annually intermix at the rookery islands, and even males captured at the farms spend different amounts of time in the region. When observing the Bray–Curtis distances via the NMDS ordination plot, there was a group of males caught at the farms that were more divergent from the rest of seal groups, regardless of sample type, and a group of scat samples of both control adults and adults in the regions around farms diverged from the main cluster. The diversity of these particular samples could be due to the life history of those seals, sample type, or a biological factor, such as age, sex, or other factor that we were not able to measure and account for due to the nature of sampling wild animals in a wild system. In the future, maintaining the same sample type from all individuals would be preferred, when possible, and sampling across the entire year and evenly across the sexes or limiting samples to males only would strengthen future results.
While this study included samples across the Tasmanian habitat, age range, and variable distances from salmon farms, it was limited to seals from the end of 2017 through the beginning of 2019. Therefore, changes over time and sex-specific differences were not captured, and as it is possible that seasonality could play a role, we included month in the PERMANOVA model selection, and it was significantly related to diversity differences; however, its inclusion had a smaller effect than seal group or animal status/sample type. Due to the life histories of Australian fur seals, it is impossible to separate seasonality or month from sampling groups other than haul-out scats, as pups can only be sampled during summer during pupping season when females leave them on the rookeries while foraging [56]. It is likely that male seals are over-represented compared to females in the haul-out samples in regions around farms, due to their natural behavior to forage in more southerly regions for most of the year [57]. However, as they are the only sex that forage at the farms, this limitation may have led to capturing of more fine-scale changes based on male diet and regionality rather than overall differences between sexes. Not knowing the sex from scat samples could lead to confounding results, but sex-biased results were not analyzed in this study. Further work should also include multiple years, representative samples from the rest of the species range, the targeted sampling of adult females and males in known proportions, and/or the pair metabarcoding of microbiomes with sex identification molecular methods [58].
The salmon microbiota samples included in this study were a representative sampling of all farmed salmon in Tasmania in net pens, as known from previous research on the entire salmon population; therefore, the differences seen between the seals and salmon are likely representative of overall differences between these two populations in the region, but likely would be improved if salmon gut microbiota could be sampled from the same seals that were captured over the same time period from the farms [59,60]. Such work would improve the ability to determine fine-scale taxonomic diversity similarities between seal and salmon microbial communities, which we were not able to do during this study. More broadly, the taxonomic analysis we performed revealed one phyla which was over-represented and more diverse in seals foraging at fish farms, compared to all other groups of seals. The increase in Bacteroidota indicates that these bacteria may be more prevalent in the area around farmed salmon leases and/or urban areas either from exposure through predation or merely through environmental exposure.
Community differences were analyzed further by ANCOM and these results were compared to ASVs in farmed salmon microbiomes. This revealed that male seals from fish farms appear to have bacterial taxa that are not typical in the rest of the fur seal population sampled during this study. An unclassified genus of bacteria designated as the unclassified Weeksellaceae genus was also successfully cultured and was found to be considerably more prevalent in the males sampled from fish farms. This taxon belongs to the family Weeksellaceae within Bacteroidota and clearly represents a novel group that potentially could have biological significance in seals but requires further study. Currently there are no known sequences that have a greater than 90% similarity in the SILVA database for the 16S rRNA V1-V3 region; therefore, the taxonomy is completely novel. The most similar species, O. rhinotracheale, is interestingly an aerobic respiratory pathogen of birds and not at all plausibly found in seal guts, nor was the percent identity high enough for us to consider it to be the same genus. The relatedness to genus Faecalibacter (F. macacae—Chen et al. IJSEM 2020), which includes strains from the Assam macaque, suggests that the general group the novel seal sequences falls into includes gut microbiome taxa, which remain so far unstudied in any detail. Through ANCOM, it was revealed the ASVs assigned to the cultured isolate sequences of the novel unclassified Weeksellaceae genus were also found more prevalently in males from salmon farms than any other group of seal and were only found in limited numbers in both adults in and outside of the regions around salmon farms. While it is interesting that the unclassified Weeksellaceae genus sequences appear over-represented in the males sampled at fish farms, it should be noted that none of the ASVs in salmon gut samples assigned to this family were in the same novel genus. This suggests that while this novel genus is more likely to be present in male seals foraging at the farms, it is highly unlikely to be derived from the salmon gut microbiota. Therefore, it is unclear where this novel genus identified in males at the farms is derived from. It may be from the environment, another form of prey, from the seal microbiomes themselves, or potentially predating on farmed salmon, but if the latter is the case, more evidence of it being associated with skin or gill microbiota would be required.
There were 13 ASVs that were conserved specifically between seals foraging near salmon farms and salmon microbiomes identified through the ANCOM compared to all ASVs found in the salmon gut microbiomes. None of these were of the unclassified Weeksellaceae, but several other species of Pseudomonadota were found as being shared between salmon and seals differentially. Specifically, ASVs representing Neisseria spp., Providencia alcalifaciens, Psychrobacter spp., and members of the genus Clostridium sensu stricto (cluster 1) were significantly more frequently found in seals sampled at the farms or in the regions around the farms than in the control seals. Providencia alcalifaciens, a Gram-negative bacterium, sometimes associated with diarrheal infections in animals and humans, was found to be more abundant in seals at or near farms and also in the gut microbiomes of salmon [61]. As this bacterium was isolated from soil, its presence both in aquaculture salmon and wild fur seals may be due to multi-species fecal run-off from terrestrial sources nearby, but more research, for instance, involving using environmental DNA to identify it in water and terrestrial sources, would be necessary [61]. Another differentially abundant taxa worth noting was the Gram-negative genus Psychrobacter, which includes species commonly found in saline environments and usually grows at low temperatures [62,63]. Since certain species of Psychrobacter have been identified as opportunistic, and in some cases virulent, pathogens in humans and animals, including opportunistic infections in farmed salmonids, the further identification of these species in seals could lead to a better understanding pathogens and transmission risk at this interface [63,64,65]. None of the ASVs that were assigned to the genus Psychrobacter had a species assignment, which may suggest the existence of a novel species that have yet to be cultured and speciated, occurring in fur seal microbiomes. The V1–V3 region of the 16S rRNA gene, does not allow for species resolution for all members of this genus.
Among these ASVs, the fish pathogen Photobacterium damselae subsp. piscicida was identified, along with members of Clostridium-assigned ASVs, as differentially abundant and present in both seals and salmon [66]. These species may be of concern for the health of wild and aquaculture fish populations, and potentially the marine mammals and the humans that interact with them, as all are at risk of the incidental infection of virulent strains in other regions where these bacteria are found; however, little evidence was obtained during this study to ascertain the level of risk [67,68,69,70,71,72].
The potential for pathogen transmission to and from aquaculture salmon and human development should be studied further. This study was limited to only one wild population of fur seals, which are known to forage regularly on farmed salmon stocks, while other seabird, marine mammal, shark, and wild fish species also interact with farmed salmon. Other limitations arose from the nature of sampling wild fur seals, as we could only swab captured seals and were permitted only to sample pups during pup surveys and the males that were already being captured at the farms for transport; therefore, we relied on scats for the rest of the microbiome analysis. While the majority of the diversity differences appeared to be related to proximity to farms, there certainly were differences which arose from this different type of sampling. It does appear in our study that those differences were likely minimal, which is useful for researchers in the field.
The full extent of risk from urban runoff and/or aquaculture activities to wildlife is not known from this study, and the risk to salmon exposed to regular wild seal predation and runoff from human development is largely unknown, beyond what potential pathogens may be carried and shed by fur seals in the region. This study suggests that foraging on farmed salmon and in the region around fish farms and urban areas affects the diversity and taxonomic make-up of microbial communities in seals. The full extent of bacterial sharing between fur seals and farmed salmon is not currently known and could not be elucidated by this study. Further monitoring of potential pathogens in this system should be undertaken at this interface in Tasmania and at similar wild predator and aquaculture interfaces globally.

Supplementary Materials

The following supporting information can be downloaded at: https://www.mdpi.com/article/10.3390/oceans4020014/s1, Figure S1: Shannon diversity of seal microbiomes by animal status at collection.; Figure S2. Shannon diversity of seal microbiomes by sample type upon collection.; Figure S3. Shannon diversity of seal microbiomes by the region in which they were collected.; Figure S4. Heatmap of 72 ASVs aggregated at the taxon level (39 taxa) found in significantly higher abundance in the adults sampled in the region around farms (InRegAd) than any of the other three groups of seals tested.; Figure S5. Richness (left panel) and Shannon diversity (right panel) differences between seal groups and salmon gut microbiomes. Figure S6. PCoA plot of Bray–Curtis distances between all seal and salmon samples with colors representing seal groups and salmon.

Author Contributions

Conceptualization, E.D., M.-A.L. and J.P.B.; methodology, E.D., J.P.B. and R.J.M.; software, R.J.M.; formal analysis, E.D. and R.J.M.; investigation, E.D.; resources, W.A.S., J.P.B. and M.-A.L.; data curation, E.D. and R.J.M.; writing—original draft preparation, E.D.; writing—review and editing, W.A.S., M.-A.L. and E.S.; visualization, E.D.; supervision, W.A.S. and J.P.B.; funding acquisition, W.A.S., J.P.B., M.-A.L. and E.D. All authors have read and agreed to the published version of the manuscript.

Funding

Funding for this project was provided Tassal Operations Pty Ltd.; the University of Tasmania; Tasmania Institute of Agriculture; University of California, Davis; Laboratory of Woutrina Smith; the Australian Department of Education for Endeavour fellowship funding; and the University of Tasmania, College of Science and Engineering grant funding.

Institutional Review Board Statement

The seal and salmon related study protocols used were approved by the Ethics Committee of the University of Tasmania and by the Department of Primary Industries, Parks, Water (DPIPWE)and the Environment now called the Department of Natural Resources and Environment Tasmania (NRET). Collection of seal fecal samples was approved under DPIPWE/NRET permit number FA17115. The handling and sampling of adult male seals at fish farms was approved under DPIPWE/NRET-granted scientific permit FA17158 and under University of Tasmania Animal Ethics permit A0016754. Fecal sampling of Atlantic salmon was approved under University of Tasmania Animal Ethics permit A0015452.

Data Availability Statement

The metadata and analytical scripts are accessible on github https://github.com/erdagnese/AFS-salmon-microbiome (accessed on 31 May 2023). The fastq files for seal data generated in this study are deposited under NCBI Project accession number PRJNA979964 (SAMN 35653418-35653644). The fastq files for the salmon DNA sequence data used are stored under NCBI BioProject Accession number PRJNA434528 and sequence read archive study number SRP133157.

Acknowledgments

We would like to acknowledge the Palawa/Pakana people as the traditional owners and ongoing custodians of Lutruwita (Tasmania) and pay our respects to their elder’s past, present, and future. We would like to thank The Marine Conservation Program and Princess Melikoff Trust Marine Mammal Conservation Program within the Department of Primary Industries, Parks, Water and Environment, for sampling support for the fur seals around Tasmania, specifically Sam Thalmann, Annie Phillips, and Cloe Cummings. We thank staff at Tassal Pty Ltd. for their assistance in sampling the adult male seals. farms was varied out with.

Conflicts of Interest

The authors declare no conflict of interest.

References

  1. Bowen, W.; Lidgard, D. Vertebrate Predator Control: Effects on Prey Populations in Terrestrial and Aquatic Ecosystems. 2011. Available online: https://publications.gc.ca/collections/collection_2013/mpo-dfo/Fs70-5-2011-028-eng.pdf (accessed on 28 March 2023).
  2. Gulland, J.A. Seals and fisheries: A case for predator control? Trends Ecol. Evol. 1987, 2, 102–104. [Google Scholar] [CrossRef] [PubMed]
  3. Kemper, C.; Pemberton, D.; Cawthorn, M.; Heinrich, S.; Mann, J.; Würsig, B.; Shaughnessy, P. Aquaculture and Marine Mammals: Co-Existence or Conflict? In Marine Mammals: Fisheries, Tourism and Management Issues; CSIRO: Canberra, Australia, 2003. [Google Scholar]
  4. Australian Bureau of Agricultural Resource Economics and Sciences (ABARES). Australian Fisheries and Aquaculture Statistics 2017; ABARES: Canberra, Australia, 2018. [CrossRef]
  5. Patterson, H.; Parsa, M.; Larcombe, J.; Noriega, R.; Emery, T.; Georgeson, L.; Marton, N.; Williams, A.; Woodhams, J.; Helidoniotis, F. Fishery Status Reports 2019; ABARES: Canberra, Australia, 2019.
  6. Kirkwood, R.; Pemberton, D.; Gales, R.; Hoskins, A.J.; Mitchell, T.; Shaughnessy, P.D.; Arnould, J.P.Y.; Kirkwood, R.; Pemberton, D.; Gales, R.; et al. Continued population recovery by Australian fur seals. Mar. Freshw. Res. 2010, 61, 695–701. [Google Scholar] [CrossRef]
  7. Deagle, B.E.; Kirkwood, R.; Jarman, S.N. Analysis of Australian fur seal diet by pyrosequencing prey DNA in faeces. Mol. Ecol. 2009, 18, 2022–2038. [Google Scholar] [CrossRef]
  8. Gales, R.; Pemberton, D. Diet of the Australian fur seal in Tasmania. Mar. Freshw. Res. 1994, 45, 653–664. [Google Scholar] [CrossRef]
  9. Nash, C.E.; Iwamoto, R.N.; Mahnken, C.V.W. Aquaculture risk management and marine mammal interactions in the Pacific Northwest. Aquaculture 2000, 183, 307–323. [Google Scholar] [CrossRef]
  10. Würsig, B.; Gailey, G.A. Marine mammals and aquaculture: Conflicts and potential resolutions. In Responsible Marine Aquaculture; CABI: Wallingford, UK, 2002; pp. 45–59. [Google Scholar] [CrossRef] [Green Version]
  11. Pemberton, D.; Shaughnessy, P.D. Interaction between seals and marine fish-farms in Tasmania, and management of the problem. Aquat. Conserv. Mar. Freshw. Ecosyst. 1993, 3, 149–158. [Google Scholar] [CrossRef]
  12. Robinson, S.; Terauds, A.; Gales, R.; Greenwood, M. Mitigating fur seal interactions: Relocation from Tasmanian aquaculture farms. Aquat. Conserv. 2008, 18, 1180–1188. [Google Scholar] [CrossRef]
  13. Scott, T.M.; Rose, J.B.; Jenkins, T.M.; Farrah, S.R.; Lukasik, J. Microbial source tracking: Current methodology and future directions. Appl. Environ. Microbiol. 2002, 68, 5796–5803. [Google Scholar] [CrossRef] [Green Version]
  14. González-Fernández, A.; Symonds, E.M.; Gallard-Gongora, J.F.; Mull, B.; Lukasik, J.O.; Rivera Navarro, P.; Badilla Aguilar, A.; Peraud, J.; Brown, M.L.; Mora Alvarado, D.; et al. Relationships among microbial indicators of fecal pollution, microbial source tracking markers, and pathogens in Costa Rican coastal waters. Water Res. 2021, 188, 116507. [Google Scholar] [CrossRef]
  15. Geldreich, E.E.; Litsky, W. Fecal coliform and fecal streptococcus density relationships in waste discharges and receiving waters. C R C Crit. Rev. Environ. Control 1976, 6, 349–369. [Google Scholar] [CrossRef]
  16. Murillo, T.; Schneider, D.; Heistermann, M.; Daniel, R.; Fichtel, C. Assessing the drivers of gut microbiome composition in wild redfronted lemurs via longitudinal metacommunity analysis. Sci. Rep. 2022, 12, 21462. [Google Scholar] [CrossRef]
  17. Mathai, P.P.; Staley, C.; Sadowsky, M.J. Sequence-enabled community-based microbial source tracking in surface waters using machine learning classification: A review. J. Microbiol. Methods 2020, 177, 106050. [Google Scholar] [CrossRef]
  18. Paruch, L.; Paruch, A.M. An overview of microbial source tracking using host-specific genetic markers to identify origins of fecal contamination in different water environments. Water 2022, 14, 1809. [Google Scholar] [CrossRef]
  19. Ahmed, W. Limitations of library-dependent microbial source tracking methods. Water (AWA) 2007, 34, 96–101. [Google Scholar]
  20. Bourne, D.G.; Dennis, P.G.; Uthicke, S.; Soo, R.M.; Tyson, G.W.; Webster, N. Coral reef invertebrate microbiomes correlate with the presence of photosymbionts. ISME J. 2013, 7, 1452–1458. [Google Scholar] [CrossRef]
  21. Kembel, S.W.; Jones, E.; Kline, J.; Northcutt, D.; Stenson, J.; Womack, A.M.; Bohannan, B.J.; Brown, G.Z.; Green, J.L. Architectural design influences the diversity and structure of the built environment microbiome. ISME J. 2012, 6, 1469–1479. [Google Scholar] [CrossRef] [Green Version]
  22. Knights, D.; Kuczynski, J.; Charlson, E.S.; Zaneveld, J.; Mozer, M.C.; Collman, R.G.; Bushman, F.D.; Knight, R.; Kelley, S.T. Bayesian community-wide culture-independent microbial source tracking. Nat. Methods 2011, 8, 761–763. [Google Scholar] [CrossRef] [PubMed] [Green Version]
  23. Boukerb, A.M.; Noël, C.; Quenot, E.; Cadiou, B.; Chevé, J.; Quintric, L.; Cormier, A.; Dantan, L.; Gourmelon, M. Comparative analysis of fecal microbiomes from wild waterbirds to poultry, cattle, pigs, and wastewater treatment plants for a microbial source tracking approach. Front. Microbiol. 2021, 12, 697553. [Google Scholar] [CrossRef] [PubMed]
  24. Holyoak, M.; Leibold, M.A.; Holt, R.D. Metacommunities: Spatial Dynamics and Ecological Communities; University of Chicago Press: Chicago, IL, USA, 2005. [Google Scholar]
  25. Miller, E.T.; Svanbäck, R.; Bohannan, B.J.M. Microbiomes as metacommunities: Understanding host-associated microbes through metacommunity ecology. Trends Ecol. Evol. 2018, 33, 926–935. [Google Scholar] [CrossRef] [PubMed]
  26. Unno, T.; Jang, J.; Han, D.; Kim, J.H.; Sadowsky, M.J.; Kim, O.-S.; Chun, J.; Hur, H.-G. Use of barcoded pyrosequencing and shared OTUs to determine sources of fecal bacteria in watersheds. Environ. Sci. Technol. 2010, 44, 7777–7782. [Google Scholar] [CrossRef] [PubMed]
  27. Unno, T.; Di, D.Y.W.; Jang, J.; Suh, Y.S.; Sadowsky, M.J.; Hur, H.-G. Integrated online system for a pyrosequencing-based microbial source tracking method that targets Bacteroidetes 16S rDNA. Environ. Sci. Technol. 2012, 46, 93–98. [Google Scholar] [CrossRef] [PubMed]
  28. Couch, C.; Sanders, J.; Sweitzer, D.; Deignan, K.; Cohen, L.; Broughton, H.; Steingass, S.; Beechler, B. The relationship between dietary trophic level, parasites and the microbiome of Pacific walrus (Odobenus rosmarus divergens). Proc. Biol. Sci. 2022, 289, 20220079. [Google Scholar] [CrossRef] [PubMed]
  29. Raza, S.; Kim, J.; Sadowsky, M.J.; Unno, T. Microbial source tracking using metagenomics and other new technologies. J. Microbiol. 2021, 59, 259–269. [Google Scholar] [CrossRef]
  30. Barko, P.C.; McMichael, M.A.; Swanson, K.S.; Williams, D.A. The gastrointestinal microbiome: A review. J. Vet. Intern. Med. 2018, 32, 9–25. [Google Scholar] [CrossRef] [Green Version]
  31. Grice, E.A.; Segre, J.A. The skin microbiome. Nat. Rev. Microbiol. 2011, 9, 244–253. [Google Scholar] [CrossRef]
  32. Christian, N.; Whitaker, B.K.; Clay, K. Microbiomes: Unifying animal and plant systems through the lens of community ecology theory. Front. Microbiol. 2015, 6, 869. [Google Scholar] [CrossRef] [Green Version]
  33. Xu, Z.; Knight, R. Dietary effects on human gut microbiome diversity. Br. J. Nutr. 2015, 113, S1–S5. [Google Scholar] [CrossRef] [Green Version]
  34. Bornbusch, S.L.; Greene, L.K.; Rahobilalaina, S.; Calkins, S.; Rothman, R.S.; Clarke, T.A.; LaFleur, M.; Drea, C.M. Gut microbiota of ring-tailed lemurs (Lemur catta) vary across natural and captive populations and correlate with environmental microbiota. Anim. Microbiome 2022, 4, 29. [Google Scholar] [CrossRef]
  35. Martinez-Guryn, K.; Leone, V.; Chang, E.B. Regional Diversity of the Gastrointestinal Microbiome. Cell Host Microbe 2019, 26, 314–324. [Google Scholar] [CrossRef] [PubMed]
  36. Campbell, T.P.; Sun, X.; Patel, V.H.; Sanz, C.; Morgan, D.; Dantas, G. The microbiome and resistome of chimpanzees, gorillas, and humans across host lifestyle and geography. ISME J. 2020, 14, 1584–1599. [Google Scholar] [CrossRef]
  37. Benson, A.K.; Kelly, S.A.; Legge, R.; Ma, F.; Low, S.J.; Kim, J.; Zhang, M.; Oh, P.L.; Nehrenberg, D.; Hua, K.; et al. Individuality in gut microbiota composition is a complex polygenic trait shaped by multiple environmental and host genetic factors. Proc. Natl. Acad. Sci. USA 2010, 107, 18933–18938. [Google Scholar] [CrossRef] [Green Version]
  38. Ley, R.E.; Lozupone, C.A.; Hamady, M.; Knight, R.; Gordon, J.I. Worlds within worlds: Evolution of the vertebrate gut microbiota. Nat. Rev. Microbiol. 2008, 6, 776–788. [Google Scholar] [CrossRef] [PubMed] [Green Version]
  39. Hills, R.D.; Pontefract, B.A.; Mishcon, H.R.; Black, C.A.; Sutton, S.C.; Theberge, C.R. Gut microbiome: Profound implications for diet and disease. Nutrients 2019, 11, 1613. [Google Scholar] [CrossRef] [PubMed] [Green Version]
  40. Pacheco-Sandoval, A.; Schramm, Y.; Heckel, G.; Brassea-Pérez, E.; Martínez-Porchas, M.; Lago-Lestón, A. The Pacific harbor seal gut microbiota in Mexico: Its relationship with diet and functional inferences. PLoS ONE 2019, 14, e0221770. [Google Scholar] [CrossRef] [PubMed]
  41. Smith, S.C.; Chalker, A.; Dewar, M.L.; Arnould, J.P.Y. Age-related differences revealed in Australian fur seal Arctocephalus pusillus doriferus gut microbiota. FEMS Microbiol. Ecol. 2013, 86, 246–255. [Google Scholar] [CrossRef] [Green Version]
  42. Faith, J.J.; Guruge, J.L.; Charbonneau, M.; Subramanian, S.; Seedorf, H.; Goodman, A.L.; Clemente, J.C.; Knight, R.; Heath, A.C.; Leibel, R.L.; et al. The long-term stability of the human gut microbiota. Science 2013, 341, 1237439. [Google Scholar] [CrossRef] [Green Version]
  43. De Leaniz, C.G.; Gajardo, G.; Consuegra, S. From Best to Pest: Changing perspectives on the impact of exotic salmonids in the southern hemisphere. Syst. Biodivers. 2010, 8, 447–459. [Google Scholar] [CrossRef]
  44. Buschmann, A.H.; Cabello, F.; Young, K.; Carvajal, J.; Varela, D.A.; Henríquez, L. Salmon aquaculture and coastal ecosystem health in Chile: Analysis of regulations, environmental impacts and bioremediation systems. Ocean Coast. Manag. 2009, 52, 243–249. [Google Scholar] [CrossRef]
  45. Allen, H.K.; Bayles, D.O.; Looft, T.; Trachsel, J.; Bass, B.E.; Alt, D.P.; Bearson, S.M.D.; Nicholson, T.; Casey, T.A. Pipeline for amplifying and analyzing amplicons of the V1–V3 region of the 16S rRNA gene. BMC Res. Notes 2016, 9, 380. [Google Scholar] [CrossRef] [Green Version]
  46. Huse, S.M.; Ye, Y.; Zhou, Y.; Fodor, A.A. A core human microbiome as viewed through 16S rRNA sequence clusters. PLoS ONE 2012, 7, e34242. [Google Scholar] [CrossRef] [Green Version]
  47. Zarkasi, K.Z.; Taylor, R.S.; Abell, G.C.J.; Tamplin, M.L.; Glencross, B.D.; Bowman, J.P. Atlantic salmon (Salmo salar L.) gastrointestinal microbial community dynamics in relation to digesta properties and diet. Microb. Ecol. 2016, 71, 589–603. [Google Scholar] [CrossRef]
  48. Bolyen, E.; Rideout, J.R.; Dillon, M.R.; Bokulich, N.A.; Abnet, C.C.; Al-Ghalith, G.A.; Alexander, H.; Alm, E.J.; Arumugam, M.; Asnicar, F.; et al. Reproducible, interactive, scalable and extensible microbiome data science using QIIME 2. Nat. Biotechnol. 2019, 37, 852–857. [Google Scholar] [CrossRef]
  49. Hall, M.; Beiko, R.G. 16S rRNA Gene Analysis with QIIME2. In Microbiome Analysis; Methods in Molecular Biology; Humana Press: Clifton, NJ, USA, 2018; Volume 1849, pp. 113–129. [Google Scholar] [CrossRef]
  50. Callahan, B.J.; McMurdie, P.J.; Rosen, M.J.; Han, A.W.; Johnson, A.J.A.; Holmes, S.P. DADA2: High-resolution sample inference from Illumina amplicon data. Nat. Methods 2016, 13, 581–583. [Google Scholar] [CrossRef] [PubMed] [Green Version]
  51. McMurdie, P.J.; Holmes, S. phyloseq: An R package for reproducible interactive analysis and graphics of microbiome census data. PLoS ONE 2013, 8, e61217. [Google Scholar] [CrossRef] [PubMed] [Green Version]
  52. Oksanen, J.; Blanchet, F.G.; Kindt, R.; Legendre, P.; Minchin, P.; O’Hara, R.; Simpson, G.; Solymos, P.; Stevenes, M.; Wagner, H. Vegan: Community Ecology Package, R Package Version 2.0-2; 2014. Available online: https://cran.r-project.org/web/packages/vegan/vegan.pdf (accessed on 28 March 2023).
  53. Gloor, G.B.; Macklaim, J.M.; Pawlowsky-Glahn, V.; Egozcue, J.J. Microbiome Datasets Are Compositional: And This Is Not Optional. Front. Microbiol. 2017, 8, 2224. [Google Scholar] [CrossRef] [Green Version]
  54. Mandal, S.; Van Treuren, W.; White, R.A.; Eggesbø, M.; Knight, R.; Peddada, S.D. Analysis of composition of microbiomes: A novel method for studying microbial composition. Microb. Ecol. Health Dis. 2015, 26, 27663. [Google Scholar] [CrossRef] [Green Version]
  55. Grosser, S.; Sauer, J.; Paijmans, A.J.; Caspers, B.A.; Forcada, J.; Wolf, J.B.W.; Hoffman, J.I. Fur seal microbiota are shaped by the social and physical environment, show mother-offspring similarities and are associated with host genetic quality. Mol. Ecol. 2019, 28, 2406–2422. [Google Scholar] [CrossRef] [Green Version]
  56. Pemberton, D.; Kirkwood, R.J. Pup production and distribution of the Australian fur seal, Arctocephalus pusillus doriferus, in Tasmania. Wildl. Res. 1994, 21, 341–351. [Google Scholar] [CrossRef]
  57. Kirkwood, R.; Lynch, M.; Gales, N.; Dann, P.; Sumner, M. At-sea movements and habitat use of adult male Australian fur seals (Arctocephalus pusillus doriferus). Can. J. Zool. 2006, 84, 1781–1788. [Google Scholar] [CrossRef]
  58. Schwarz, D.; Spitzer, S.M.; Thomas, A.C.; Kohnert, C.M.; Keates, T.R.; Acevedo-Gutiérrez, A. Large-scale molecular diet analysis in a generalist marine mammal reveals male preference for prey of conservation concern. Ecol. Evol. 2018, 8, 9889–9905. [Google Scholar] [CrossRef]
  59. Zarkasi, K.Z.; Abell, G.C.J.; Taylor, R.S.; Neuman, C.; Hatje, E.; Tamplin, M.L.; Katouli, M.; Bowman, J.P. Pyrosequencing-based characterization of gastrointestinal bacteria of Atlantic salmon (Salmo salar L.) within a commercial mariculture system. J. Appl. Microbiol. 2014, 117, 18–27. [Google Scholar] [CrossRef] [PubMed] [Green Version]
  60. Neuman, C.; Hatje, E.; Zarkasi, K.Z.; Smullen, R.; Bowman, J.P.; Katouli, M. The effect of diet and environmental temperature on the faecal microbiota of farmed Tasmanian Atlantic Salmon (Salmo salar L.). Aquac. Res. 2016, 47, 660–672. [Google Scholar] [CrossRef]
  61. Shah, M.M.; Odoyo, E.; Ichinose, Y. Epidemiology and pathogenesis of Providencia alcalifaciens infections. Am. J. Trop. Med. Hyg. 2019, 101, 290–293. [Google Scholar] [CrossRef] [PubMed]
  62. Bozal, N.; Montes, M.J.; Tudela, E.; Guinea, J. Characterization of several Psychrobacter strains isolated from Antarctic environments and description of Psychrobacter luti sp. nov. and Psychrobacter fozii sp. nov. Int. J. Syst. Evol. Microbiol. 2003, 53, 1093–1100. [Google Scholar] [CrossRef] [PubMed] [Green Version]
  63. Bowman, J.P. The Genus Psychrobacter. In The Prokaryotes: A Handbook on the Biology of Bacteria Volume 6: Pseudomonadota: Gamma Subclass; Dworkin, M., Falkow, S., Rosenberg, E., Schleifer, K.-H., Stackebrandt, E., Eds.; Springer: New York, NY, USA, 2006; pp. 920–930. [Google Scholar]
  64. Hisar, O.; Yanik, T.; Hisar, S.A. Clinical and pathological investigation of Psychrobacter immobilis infection in rainbow trout (Oncorhynchus mykiss, Walbaum). Isr. J. Aquac. 2002, 54, 189–196. [Google Scholar]
  65. Romanenko, L.A.; Lysenko, A.M.; Rohde, M.; Mikhailov, V.V.; Stackebrandt, E. Psychrobacter maritimus sp. nov. and Psychrobacter arenosus sp. nov., isolated from coastal sea ice and sediments of the Sea of Japan. Int. J. Syst. Evol. Microbiol. 2004, 54, 1741–1745. [Google Scholar] [CrossRef] [Green Version]
  66. Romalde, J.L. Photobacterium damselae subsp. piscicida: An integrated view of a bacterial fish pathogen. Int. Microbiol. 2002, 5, 3–9. [Google Scholar] [CrossRef]
  67. Austin, H.K.; Austin, D.A. Bacterial Fish Pathogens; Springer: Dordrecht, The Netherlands, 2012. [Google Scholar]
  68. Di Francesco, G.; Cammà, C.; Curini, V.; Mazzariol, S.; Proietto, U.; Di Francesco, C.E.; Ferri, N.; Di Provvido, A.; Di Guardo, G. Coinfection by Ureaplasma spp., Photobacterium damselae and an Actinomyces-like microorganism in a bottlenose dolphin (Tursiops truncatus) with pleuropneumonia stranded along the Adriatic coast of Italy. Res. Vet. Sci. 2016, 105, 111–114. [Google Scholar] [CrossRef] [Green Version]
  69. Dryden, M.; Legarde, M.; Gottlieb, T.; Brady, L.; Ghosh, H.K. Vibrio damsela wound infections in Australia. Med. J. Aust. 1989, 151, 540–541. [Google Scholar] [CrossRef]
  70. Fouz, B.; Larsen, J.; Nielsen, B.; Barja, J.; Toranzo, A. Characterization of Vibrio damsela strains isolated from turbot Scophthalmus maximus in Spain. Dis. Aquat. Organ. 1992, 12, 155–166. [Google Scholar] [CrossRef]
  71. Rivas, A.J.; Lemos, M.L.; Osorio, C.R. Photobacterium damselae subsp. damselae, a bacterium pathogenic for marine animals and humans. Front. Microbiol. 2013, 4, 283. [Google Scholar] [CrossRef] [PubMed] [Green Version]
  72. Tang, W.M.; Wong, J.W. Necrotizing fasciitis caused by Vibrio damsela. Orthopedics 1999, 22, 443–444. [Google Scholar] [CrossRef] [PubMed]
Figure 1. Map of sampling sites of fur seals around Tasmania, with colors representing seal groups sampled: control adults (Control Ad., n = 57), control juveniles (Control Juv., n = 51), adults samples from the region near farms (In Region Ad., n = 52), and male seals caught and samples at fish farms (Males at FF, n = 56). The size of the circle represents the number of animals sampled in that location. Red shapes show aquaculture leases of all types, including Atlantic salmon, other fin fish, and bivalves. The red square denotes the region studied, which includes the major urban region of Hobart, Tasmania.
Oceans 04 00014 g001
Figure 2. (a) The Shannon diversity indices and (b) the ASV richness found in each group of seals sampled: males at fish farms (MaleFF, n = 56), adults/scats sampled in the region directly around salmon (InRegAd, n = 52), juveniles sampled outside of the regions around farms (CtrlJuv, n = 51), adults/scats sampled outside the regions around farms (CtrlAd, n = 57). Significant differences are represented as *** p-value < 0.001 and ** p-value < 0.05.
Oceans 04 00014 g002
Figure 3. An NMDS plot of the Bray–Curtis distances between samples. Color groups of fur seals sampled in Tasmania: males at fish farms (MaleFF), adults/scats sampled in the region directly around salmon (InRegAd), juveniles sampled outside of the regions around farms (CtrlJuv), and adults/scats sampled outside the regions around farms (CtrlAd). Shapes represent the animal status upon sampling which accounts for different sample types.
Oceans 04 00014 g003
Figure 4. The relative abundance of bacterial phyla represented in the microbiomes of all four groups of fur seals sampled in Tasmania: males at fish farms (MaleFF), adults/scats sampled in the region directly around salmon (InRegAd), juveniles sampled outside of the regions around farms (CtrlJuv), adults/scats sampled outside the regions around farms (CtrlAd), NA refers to other/unidentified phylum.
Oceans 04 00014 g004
Figure 5. The families represented in the phylum in Bacteroidota in the microbiomes of all four groups of fur seals sampled in Tasmania: males at fish farms (MaleFF), adults/scats sampled in the region directly around salmon (InRegAd), juveniles sampled outside of the regions around farms (CtrlJuv), and adults/scats sampled outside the regions around farms (CtrlAd). NA refers to other/unidentified families in Bacteroidota.
Oceans 04 00014 g005
Figure 6. Heatmap of proportion of reads in each group of the 61 ASVs aggregated at the taxon level (46 taxa) found in significantly higher abundance in male seals sampled at fish farms (MaleFF) than any of the other three groups of seals tested, i.e., in region adults (InRegAd), control adults (CtrlAd), or control juveniles (CtrlJuv). These ASVs were found to be differentially abundant through the ANCOM analysis of ASVs in all seals sampled when assessing variability between groups and region as a co-variate in the model and using a W-statistic threshold of 0.7.
Oceans 04 00014 g006
Figure 7. The nMDS plot of Bray–Curtis distances between all seal and salmon samples with colors representing seal groups and salmon: males at fish farms (MaleFF), adults/scats sampled in the region directly around salmon (InRegAd), juveniles sampled outside of the regions around farms (CtrlJuv), adults/scats sampled outside the regions around farms (CtrlAd), and salmon.
Oceans 04 00014 g007
Figure 8. The relative abundance of the phyla represented in seals and farmed salmon in Tasmania for each group of seals sampled: males at fish farms (MaleFF), adults/scats sampled in the region directly around salmon (InRegAd), juveniles sampled outside of the regions around farms (CtrlJuv), adults/scats sampled outside the regions around farms (CtrlAd), and farmed salmon.
Oceans 04 00014 g008
Table 1. The ASVs and their taxonomic assignment of the significantly differentially abundant ASVs between groups of seals determined through ANCOM and the number of reads assigned to them in the farmed salmon microbiome data, as well as in each group of seal, and the group which had the most reads of each ASV. W-statistic represents the number of sub-hypotheses that were significant in the ANCOM model (threshold at 0.6).
Phylum; TaxonW *CtrlAdCtrlJuvInRegAdMaleFFHigh GroupSalmon Reads
Pseudomonadota; Photobacterium damselae subsp. damselae107344,14135673152CtrlAd664
Fusobacteriota; Cetobacterium ceti105410,07003029252CtrlAd401
Pseudomonadota; Neisseria;uncultured bacterium10332442123436926InRegAd1751
Pseudomonadota; Escherichia-Shigella10130277658018CtrlJuv161
Bacillota; Bacillus100813817191679203InRegAd206
Bacillota; Clostridium sensu stricto 110070161285282InRegAd477
Bacillota; Bacilli9913750275728InRegAd41
Pseudomonadota; Plesiomonas95600156872InRegAd179
Bacillota; Bacillus9322963654247337InRegAd183
Pseudomonadota; Providencia alcalifaciens DSM 301209263226146064InRegAd38
Bacillota; Peptostreptococcaceae8890027230InRegAd707
Pseudomonadota; Providencia alcalifaciens DSM 30120889000900MaleFF32
Bacillota; Clostridium moniliforme81900884207InRegAd63
Pseudomonadota; Escherichia coli UMEA 4075-1767011800CtrlJuv29
Pseudomonadota; Psychrobacter692009920InRegAd42
Pseudomonadota; Escherichia-Shigella690015307CtrlJuv10
Pseudomonadota; Providencia alcalifaciens DSM 30120665300410MaleFF74
* Abbreviation for the ANCOM W-value, which is an estimate of the number of sub-hypotheses that have passed for a given species.
Disclaimer/Publisher’s Note: The statements, opinions and data contained in all publications are solely those of the individual author(s) and contributor(s) and not of MDPI and/or the editor(s). MDPI and/or the editor(s) disclaim responsibility for any injury to people or property resulting from any ideas, methods, instructions or products referred to in the content.

