Article

Environmentally-Driven Variation in the Physiology of a New Caledonian Reef Coral

by
Anderson B. Mayfield
1,2,3,* and
Alexandra C. Dempsey
4
1
Cooperative Institute for Marine and Atmospheric Studies, University of Miami, Miami, FL 33149, USA
2
Atlantic Oceanographic and Meteorological Laboratory, National Oceanic and Atmospheric Administration, Miami, FL 33149, USA
3
Coral Reef Diagnostics, Miami, FL 33129, USA
4
Khaled bin Sultan Living Oceans Foundation, Annapolis, MD 21403, USA
*
Author to whom correspondence should be addressed.
Oceans 2022, 3(1), 15-29; https://doi.org/10.3390/oceans3010002
Submission received: 4 August 2021 / Revised: 15 December 2021 / Accepted: 20 December 2021 / Published: 6 January 2022

Abstract

:
Given the widespread threats to coral reefs, scientists have lost the opportunity to understand the basic biology of “pristine” corals whose physiologies have not been markedly perturbed by human activity. For instance, high temperature-induced bleaching has been occurring annually since 2014 in New Caledonia. Because most corals cannot withstand repeated years when bleaching occurs, an analysis was undertaken to showcase coral behavior in a period just before the onset of “annual severe bleaching” (ASB; November 2013) such that future generations might know how these corals functioned in their last bleaching-free year. Pocillopora damicornis colonies were sampled across a variety of environmental gradients, and a subset was sampled during both day and night to understand how their molecular biology changes upon cessation of dinoflagellate photosynthesis. Of the 13 environmental parameters tested, sampling time (i.e., light) most significantly affected coral molecular physiology, and expression levels of a number of both host and Symbiodiniaceae genes demonstrated significant diel variation; endosymbiont mRNA expression was more temporally variable than that of their anthozoan hosts. Furthermore, expression of all stress-targeted genes in both eukaryotic compartments of the holobiont was high, even in isolated, uninhabited, federally protected atolls of the country’s far northwest. Whether this degree of sub-cellular stress reflects cumulative climate change impacts or, instead, a stress-hardened phenotype, will be unveiled through assessing the fates of these corals in the wake of increasingly frequent marine heatwaves.

1. Introduction

Climate change threatens reefs across the globe [1,2], from locales once thought to be “pristine” (e.g., Chagos [3]) to those abutting high human population density areas such as Taiwan [4], Mexico’s Pacific Coast [5], and South Florida (USA) [6]. Unfortunately, many of Earth’s (potentially) most precious, high-biodiversity coral reefs are unknown to science (and perhaps only to local fisherfolk); see Darling et al. [7] for a thorough (albeit incomplete) depiction of areas from which coral reef data have been collected as of 2018. This lack of data unfortunately means that we may not even know or understand what will be lost in the coming decades as ocean temperatures continue to rise [8]. To this end, the Khaled bin Sultan Living Oceans Foundation (LOF) began its “Global Reef Expedition” (GRE) in 2010 with the intent of surveying, sampling, and, more generally, providing data for Earth’s most difficult-to-access, poorly studied, and presumably least-impacted reefs. Although we may never know what these coral reefs were like in their pre-industrial states, such research missions nevertheless permitted the generation of a dataset against which further change can be assessed, and the results from a number of research missions (typically divided by country) can be found on the LOF website as field reports (https://www.livingoceansfoundation.org/publications/field-reports/, accessed on 1 December 2021), as well as in the peer-reviewed literature (e.g., [9]).
In many cases, LOF scientists had the opportunity to survey coral reefs never before studied, and this was the case in November 2013 when the LOF research ship M.Y. Golden Shadow visited reefs at the southern and uninhabited northern reaches of New Caledonia. For general information on the cruise (e.g., goals, itinerary, personnel, site meta-data, and maps), readers are referred to the field report: https://www.livingoceansfoundation.org/publication/new-caledonia-field-report/, accessed on 1 December 2021. Although reefs around New Caledonia’s main island, Grand Terre, have featured in prior works [10], the northern reefs and atolls (NRE) have not, and, given their remote and governmentally protected nature, we found that the physiology of the model scleractinian coral Pocillopora damicornis [11] was distinct from conspecifics of relatively more impacted reefs of the south (namely around the nickel mine at Prony Bay, Grand Terre) [12]. In an attempt to develop a more rigorous understanding of the environmental drivers of variability [13,14,15] in the molecular physiology of this model coral species [16], we performed an additional analysis on previously published data [12] whereby we focused not only on spatial heterogeneity (among locations and across environmental gradients), but also intraspecific (inter-genotype) and even intra-individual (colony) variation within locations and over time. By relating intraspecific variability in 10 key response variables (RV) across 13 environmental parameters (EP), we also sought to outline a baseline of coral performance and physiological plasticity [17] prior to the occurrence of “annual severe bleaching” (ASB; [18]) in 2014 [19]. These baseline data will be critical for developing models capable of accurately forecasting coral resilience; failure to incorporate natural sources of physiological variation could instead lead to unsubstantiated attribution of behavioral shifts to climate change and other stressors (i.e., type I statistical errors). In the event that the local corals cannot adapt or acclimatize, this dataset may instead serve as the last record of how these animal–plant symbioses behaved in the period before their cellular biology was fundamentally and constitutively perturbed by anthropogenic impact.

2. Materials and Methods

2.1. Overview of Research Expedition and Analytical Goals

For static maps of the 79 reef sites surveyed across both the southern and northern regions of New Caledonia, please see Mayfield et al. [12]; detailed, interactive habitat maps can instead be found at https://maps.lof.org/lof (accessed on 1 December 2021) (see prior works, e.g., [20], for map generation details). P. damicornis colonies were sampled (~50-mg biopsies/colony) across numerous environmental gradients (Table 1), with a series of RV assessed in each (described in detail previously [12] but with pertinent information provided below, Table 1, and in the Supplementary Materials). Originally, 15 EP were hypothesized to influence coral physiology: the 13 listed in Table 1 plus sampling date and reef site. Since sample sizes on any given date or for any given reef were generally small, only those 13 EP listed in Table 1 and Table 2 featured in model building. Please note that, although Symbiodiniaceae assemblage and colony color are both technically properties of the coral colonies themselves, they were considered EP herein given that they were hypothesized to influence the RV discussed below.

2.2. Night Coral Sampling

Prior work with P. damicornis revealed extensive temporal variation in gene expression [21], even in genes known to exhibit temporally stable expression in other eukaryotes (e.g., cytoskeleton genes, such as beta-actin and alpha-tubulin). This temporal variation has generally invalidated the use of housekeeping genes in real-time PCR-based target mRNA analyses of corals [22] and was actually a methodological impetus for this project. To document natural temporal variation in coral molecular biology in the relative absence of localized anthropogenic stressors, P. damicornis colonies (n = 4–9, dependent on local abundance) in the vicinity of one another (but with >10-m separation) at 10 ± 1 m depth (std. dev. for this and all other error terms unless stated otherwise) were tagged with glow sticks at three southern and one NRE reefs (all physically protected/sheltered reefs due to the complexity of night diving operations in remote locations), sampled within one hour of solar noon (typically 11:30–13:00), and then re-sampled (ensuring that a branch >20 cm away from the initial lesion was sampled) 30–60 min after sunset (typically 18:00–19:00). Photosynthetically active radiation (PAR) was measured next to each colony at the time of sampling with a Diving-PAM fluorometer (Walz) calibrated against a LiCor 193SA “4-pi” sensor.
Across the entire, month-long mission, 104 unique pocilloporid colonies were sampled, 36 of which were re-sampled at night; this resulted in 140 coral biopsies. Each biopsy was frozen at −150 °C in a liquid nitrogen vapor shipper (MVE Chart) upon return to the small craft vessel, and RNAs, DNAs, and proteins were extracted from these coral biopsies as described previously [12] after export under a CITES permit to A.B.M. to Taiwan. Specifically, 30 colonies sampled during both day and night (n = 60 biopsies), as well as 33 additional biopsies sampled only during the day, underwent extraction (n = 93). Of these, four of the daytime biopsies yielded degraded RNA and were not analyzed, resulting in a final sample size of 30 night and 59 daytime samples (of which 52 represented matched-pair light–dark sampling of the same 26 colonies). Please see (1) the online supplemental data file (OSDF) for meta-data associated with all sampled colonies/biopsies and (2) the Supplementary Materials for genotyping and data filtering details.

2.3. Response Variables (RV)

Ten RV were analyzed in each of 89 coral biopsies, including the RNA/DNA ratio (a proxy for total gene expression), the Symbiodiniaceae genome copy proportion (GCP; a molecular proxy for endosymbiont density [22]), and the expression of four host coral and four Symbiodiniaceae mRNAs. Based on prior transcriptomic analyses [23,24], these mRNAs were hypothesized to be environmentally sensitive and useful in physiology-based resilience model building. The eight mRNAs encode proteins involved in metabolism, photosynthesis, the stress response, and other key cellular processes (Table 1). It is worth noting here, though, that endosymbiosis-tailored protocols developed in our prior works [22,23] were adopted to ensure that spatio-temporally variable host/endosymbiont nucleic acid ratios did not bias gene expression analyses. After first normalizing gene expression (inverse-log raw threshold cycle (Ct) values) to recovery of an exogenous RNA spike (Solaris®, Thermo-Fisher Scientific, Waltham, MA, USA), we then normalized the dinoflagellate spike-normalized gene expression values to the aforementioned Symbiodiniaceae GCP to control for the fact that samples with high endosymbiont densities would inherently demonstrate higher dinoflagellate gene expression levels. Raw, spike-normalized only, and spike- and GCP-normalized data for all eight target genes can be found in the OSDF.

2.4. Multivariate Data Analysis

A series of multivariate approaches were undertaken with JMP® Pro (ver. 16) to determine which EP drove the greatest proportion of the variation in the molecular biology of P. damicornis (assessed from the 10 RV) in New Caledonia. Briefly, principal components analysis (PCA), discriminant analysis (DCA), permutational multivariate ANOVA (PERMANOVA; instead undertaken with PRIMER (ver. 6)), stepwise regression (SRA), and partial least squares (PLS) were used to uncover relationships among coral samples across the 13 EP (Table 1), as well as to identify the RV(s) most impacted by environmental heterogeneity (multivariate alpha = 0.045). PCA was also used to depict relationships among RV, while DCA was used to quantify the differences evident from PCA in two ways: calculation of (1) Wilks’ lambda (i.e., multivariate ANOVA (MANOVA)) and (2) a PLS model misclassification rate (% of samples misclassified by the associated predictive model). The former was presented in the figures but not interpreted since, unlike PLS, MANOVA is poorly suited for highly collinear datasets featuring non-normally distributed data (Shapiro–Wilk p < 0.01) such as the one produced herein. In addition to PLS, PERMANOVA is also robust against non-normally distributed datasets featuring high degrees of multicollinearity since the similarities (i.e., distances) among samples, rather than absolute differences in levels of individual RVs, are instead tested in response to the EP(s) of interest. In a separate PLS, in which the first four coordinates from a multi-dimensional scaling (MDS) analysis of standardized data from the 10 coral RV were the model Y terms, each EP was tested as a predictor, and the percent variation in the multivariate trait space was calculated (NIPALS fit with k-fold validation of 7). SRA was only used to assess multivariate effects for light and time (see Supplementary Materials) and served mainly to corroborate findings from the non-parametric univariate analyses of the 10 RV (next section).

2.5. Univariate Data Analysis

Since the multivariate analyses pointed to an effect of sampling time and light on coral physiology (Table 2), several univariate statistical approaches were used to model light vs. dark differences in individual RV. First, rank-based Wilcoxon tests were utilized to determine the effect of PAR (n = 2 bins: 0 = night vs. >0 = day) with the entire, 89-sample dataset for each of the 10 RV. Similarly, Kruskal–Wallis tests were carried out across three sampling time windows: morning (before 10:00), midday (10:00–14:00), and night (18:00–19:00). In another two analyses, the differences (light minus dark, i.e., matched pairs) and relative differences (light/dark) between light and dark values were calculated for each RV for the 26 night dive samples only. The goals of these latter two analyses were to test the null hypotheses that the mean differences were significantly different from 0 and 1, respectively, and this was undertaken with non-parametric sign-rank tests (alpha = 0.02 for all univariate tests). Log2-transformed ratio data for each colony can be found in Figure S1.

3. Results

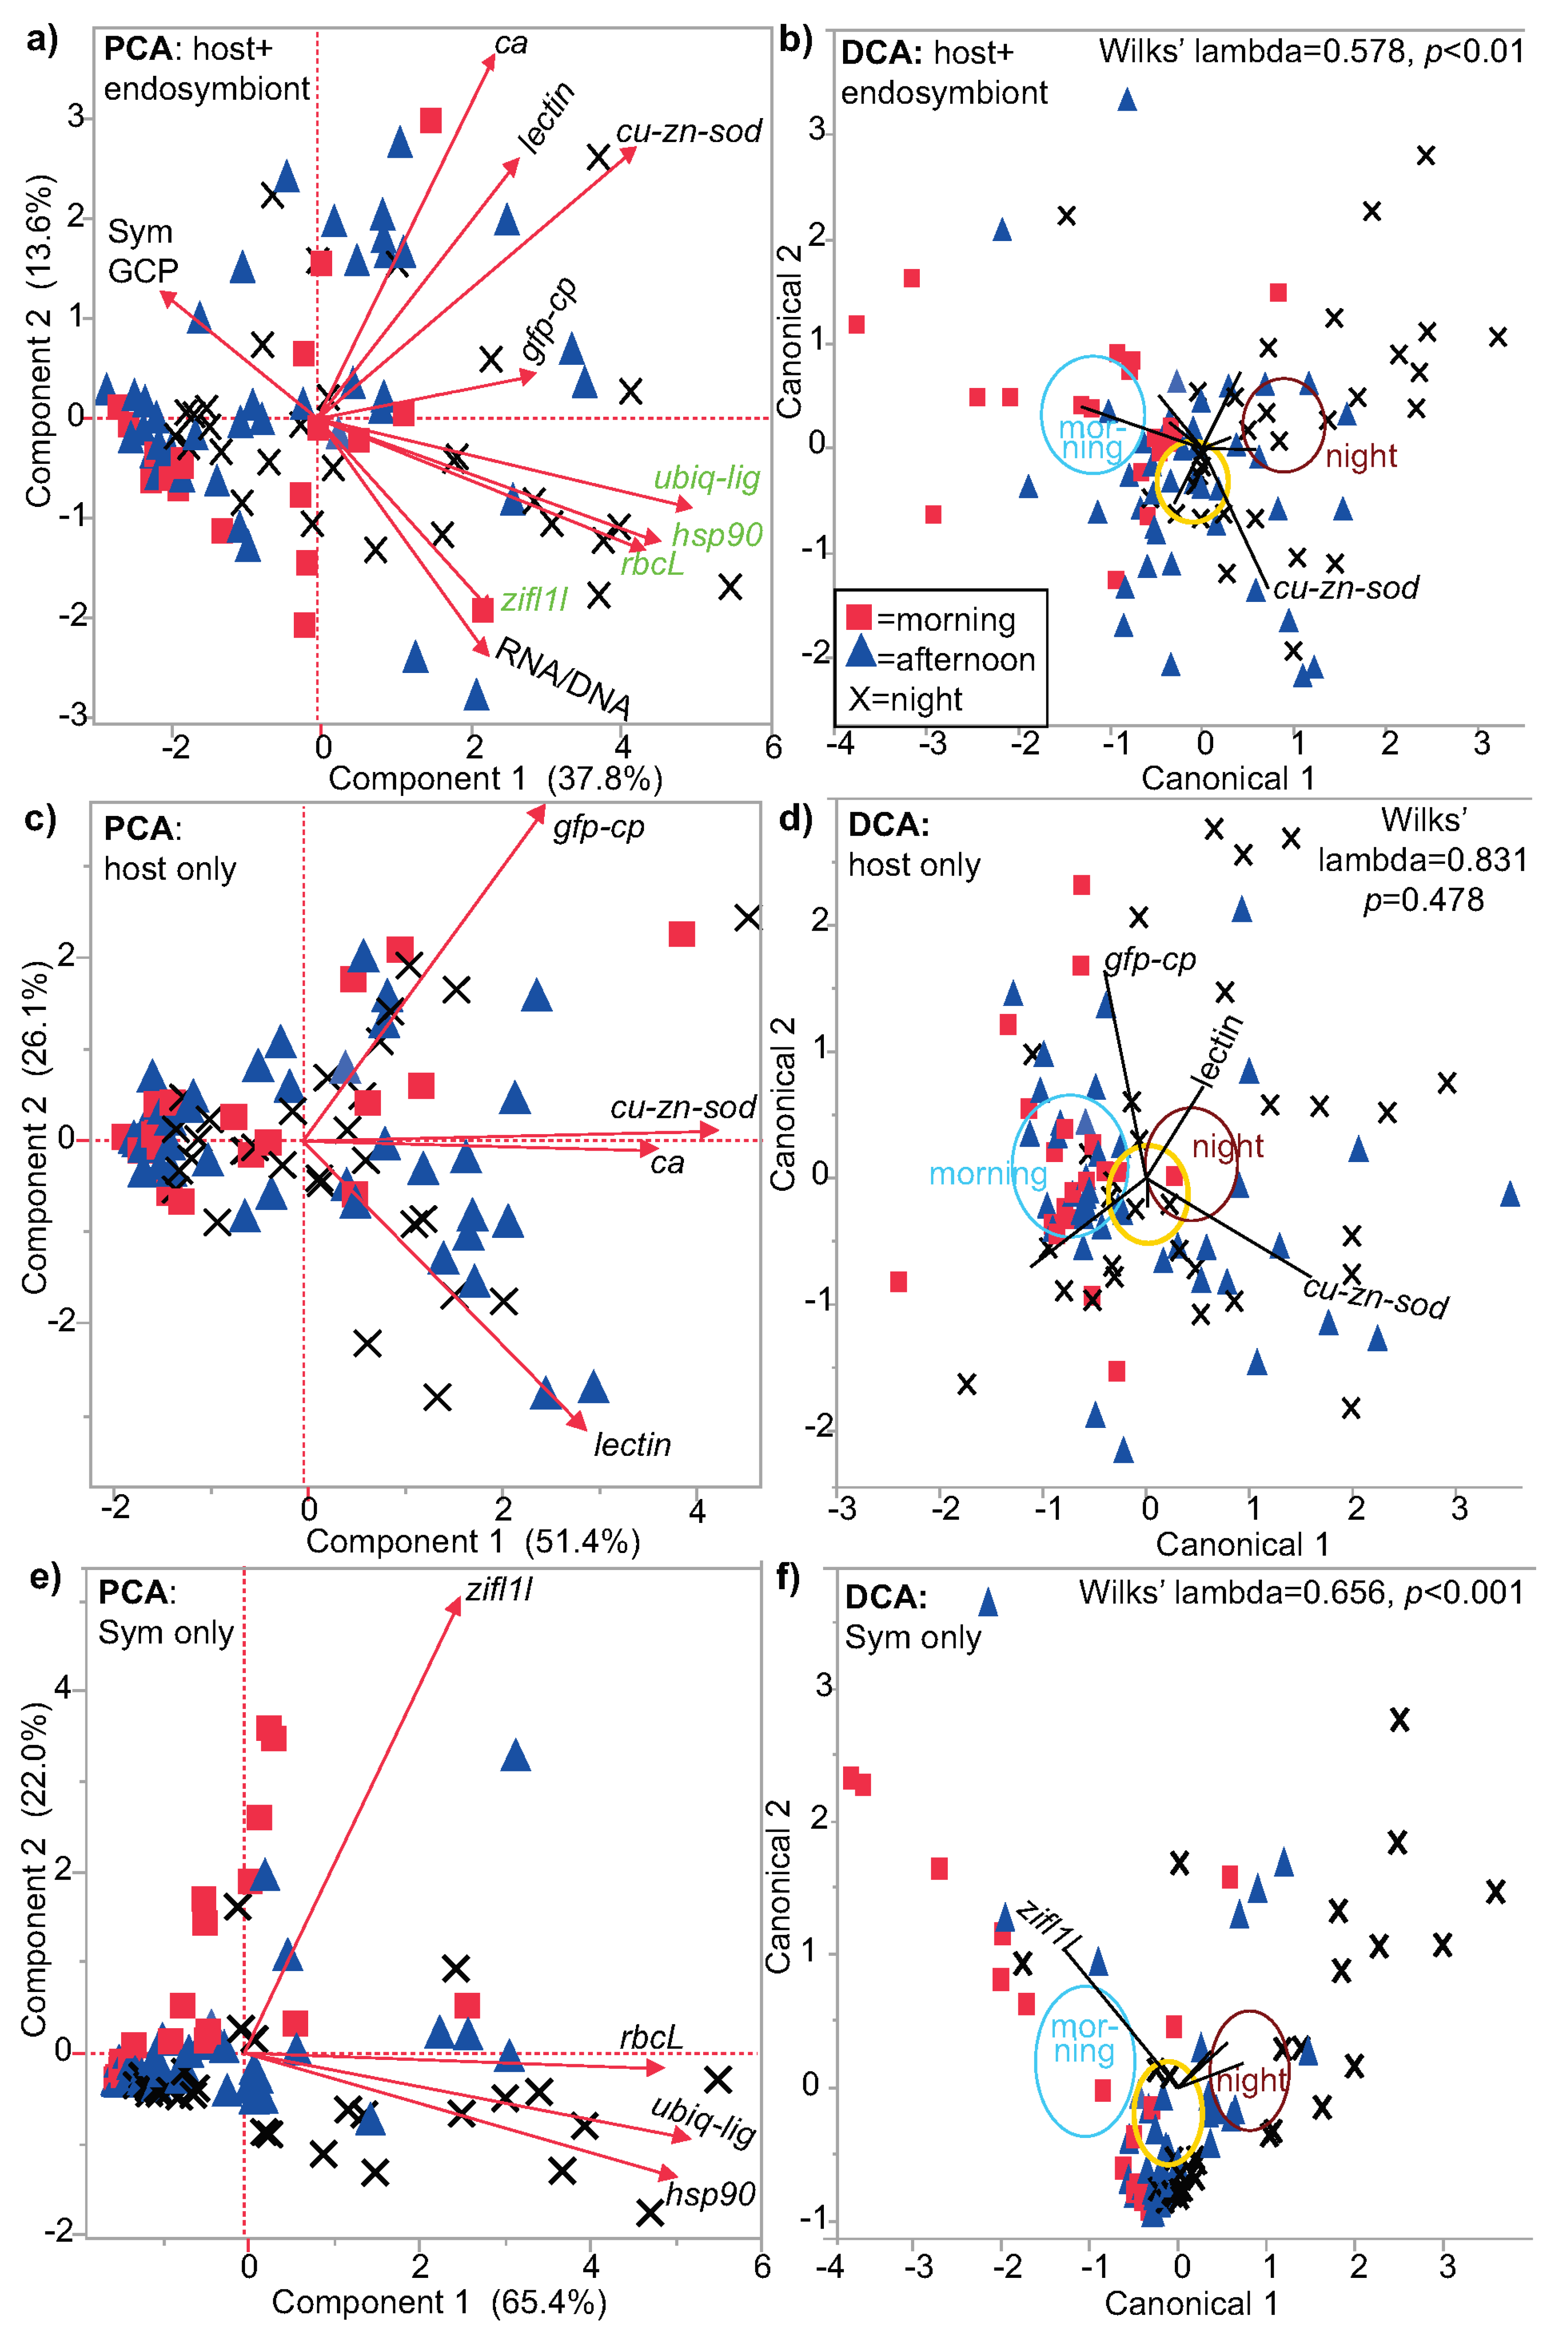
3.1. Multivariate Analysis

PERMANOVA revealed a number of EP that significantly affected similarity among coral colonies (Table 2 and Table S3). Only salinity, reef zone, and the endosymbiont assemblage did not significantly influence multivariate similarity among sample groups. Despite highly significant PERMANOVA p-values, the PLS models were not characterized by particularly high predictive power, and misclassification rates ranged from ~25 to ~50% (Table 2); this is partially a testament to the high inter-colony variation associated with the dataset (see OSDF for raw values). Furthermore, no EP in isolation explained more than 15% of the variation in the multivariate coral trait space (Table 2).
Because sampling time (three bins) and light (two bins: PAR = 0 vs. >0 µmol/photons m2/s) both significantly affected similarity among corals and were characterized by modestly low PLS misclassification rates (Table 2), a detailed look was taken at temporal variation in the multivariate trait space. First, PCA and DCA were performed with all 10 RV (Figure 1a and Figure 1b, respectively), the host genes only (Figure 1c and Figure 1d, respectively), and the four Symbiodiniaceae genes only (Figure 1e and Figure 1f, respectively). When looking at the holobiont and host coral data with PCA (Figure 1a and Figure 1c, respectively), the temporal effects are less obvious; only when the endosymbiont genes were assessed in isolation was there more noted separation between samples of the three sampling times (morning, afternoon, and night; Figure 1e). This observation was recapitulated by DCA; although the multivariate effect was not significant for the coral response only (Figure 1d; MANOVA p > 0.40), the endosymbiont DCA of time (Figure 1f) was highly significant.

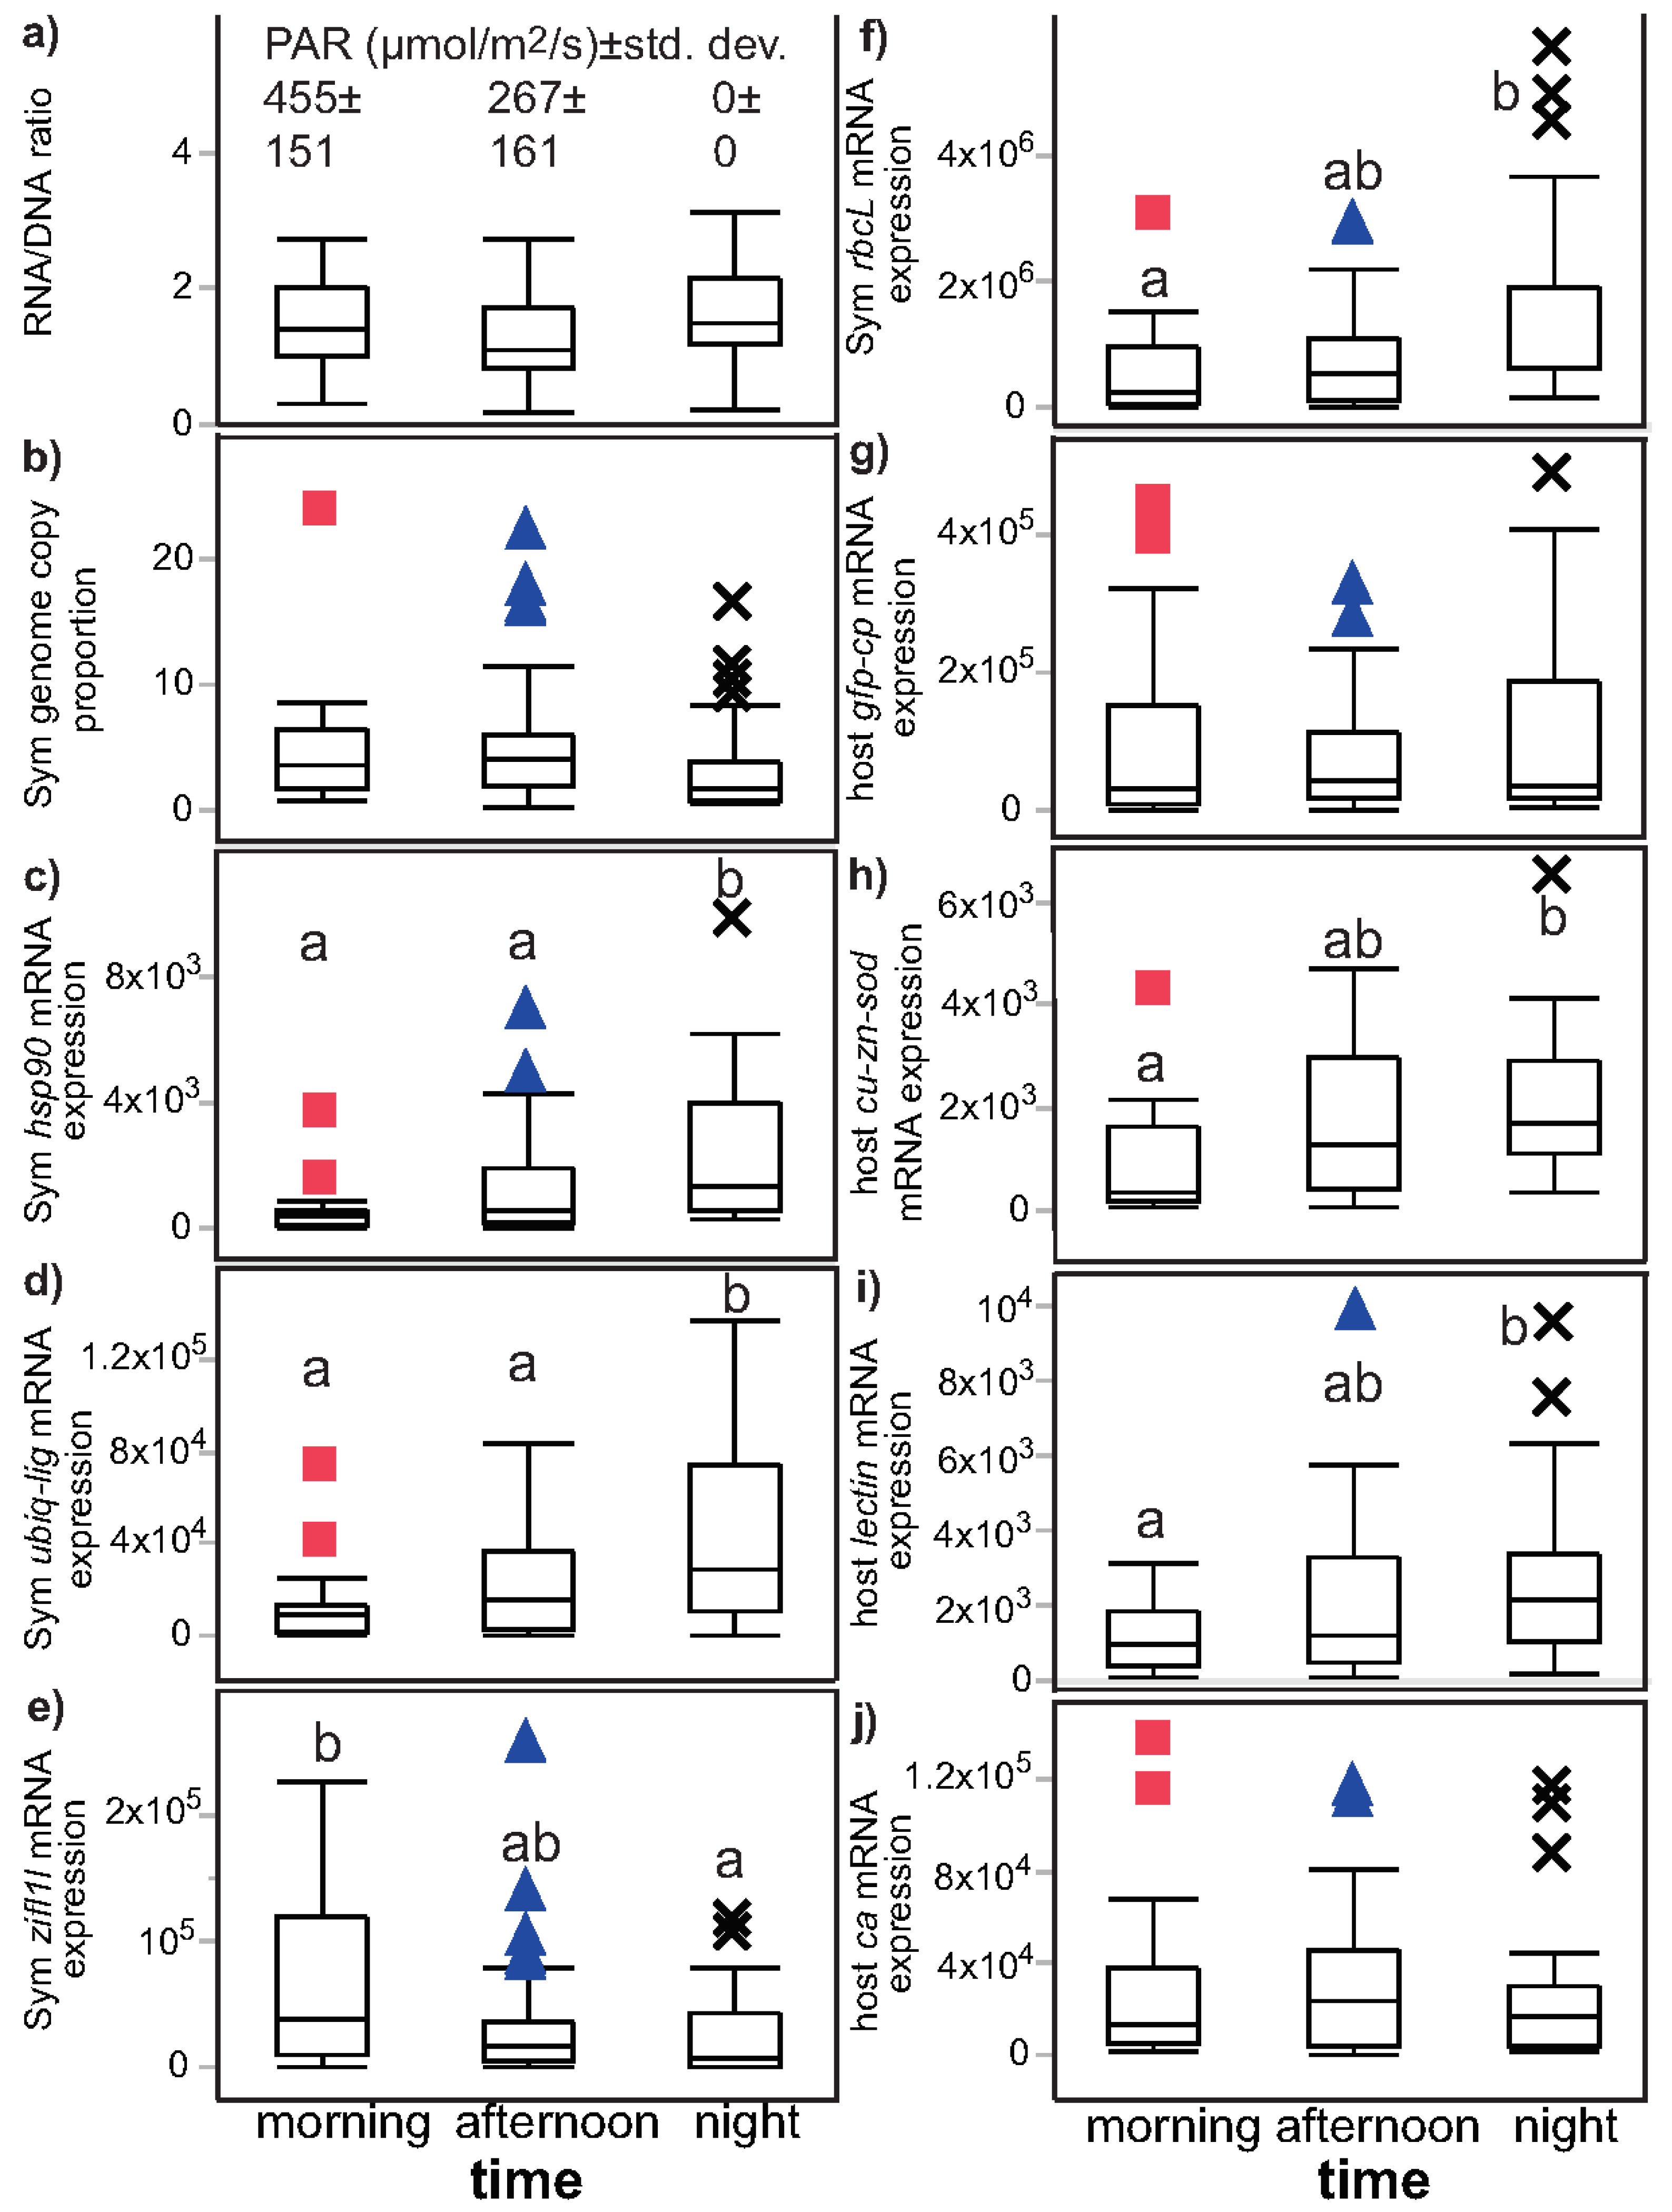
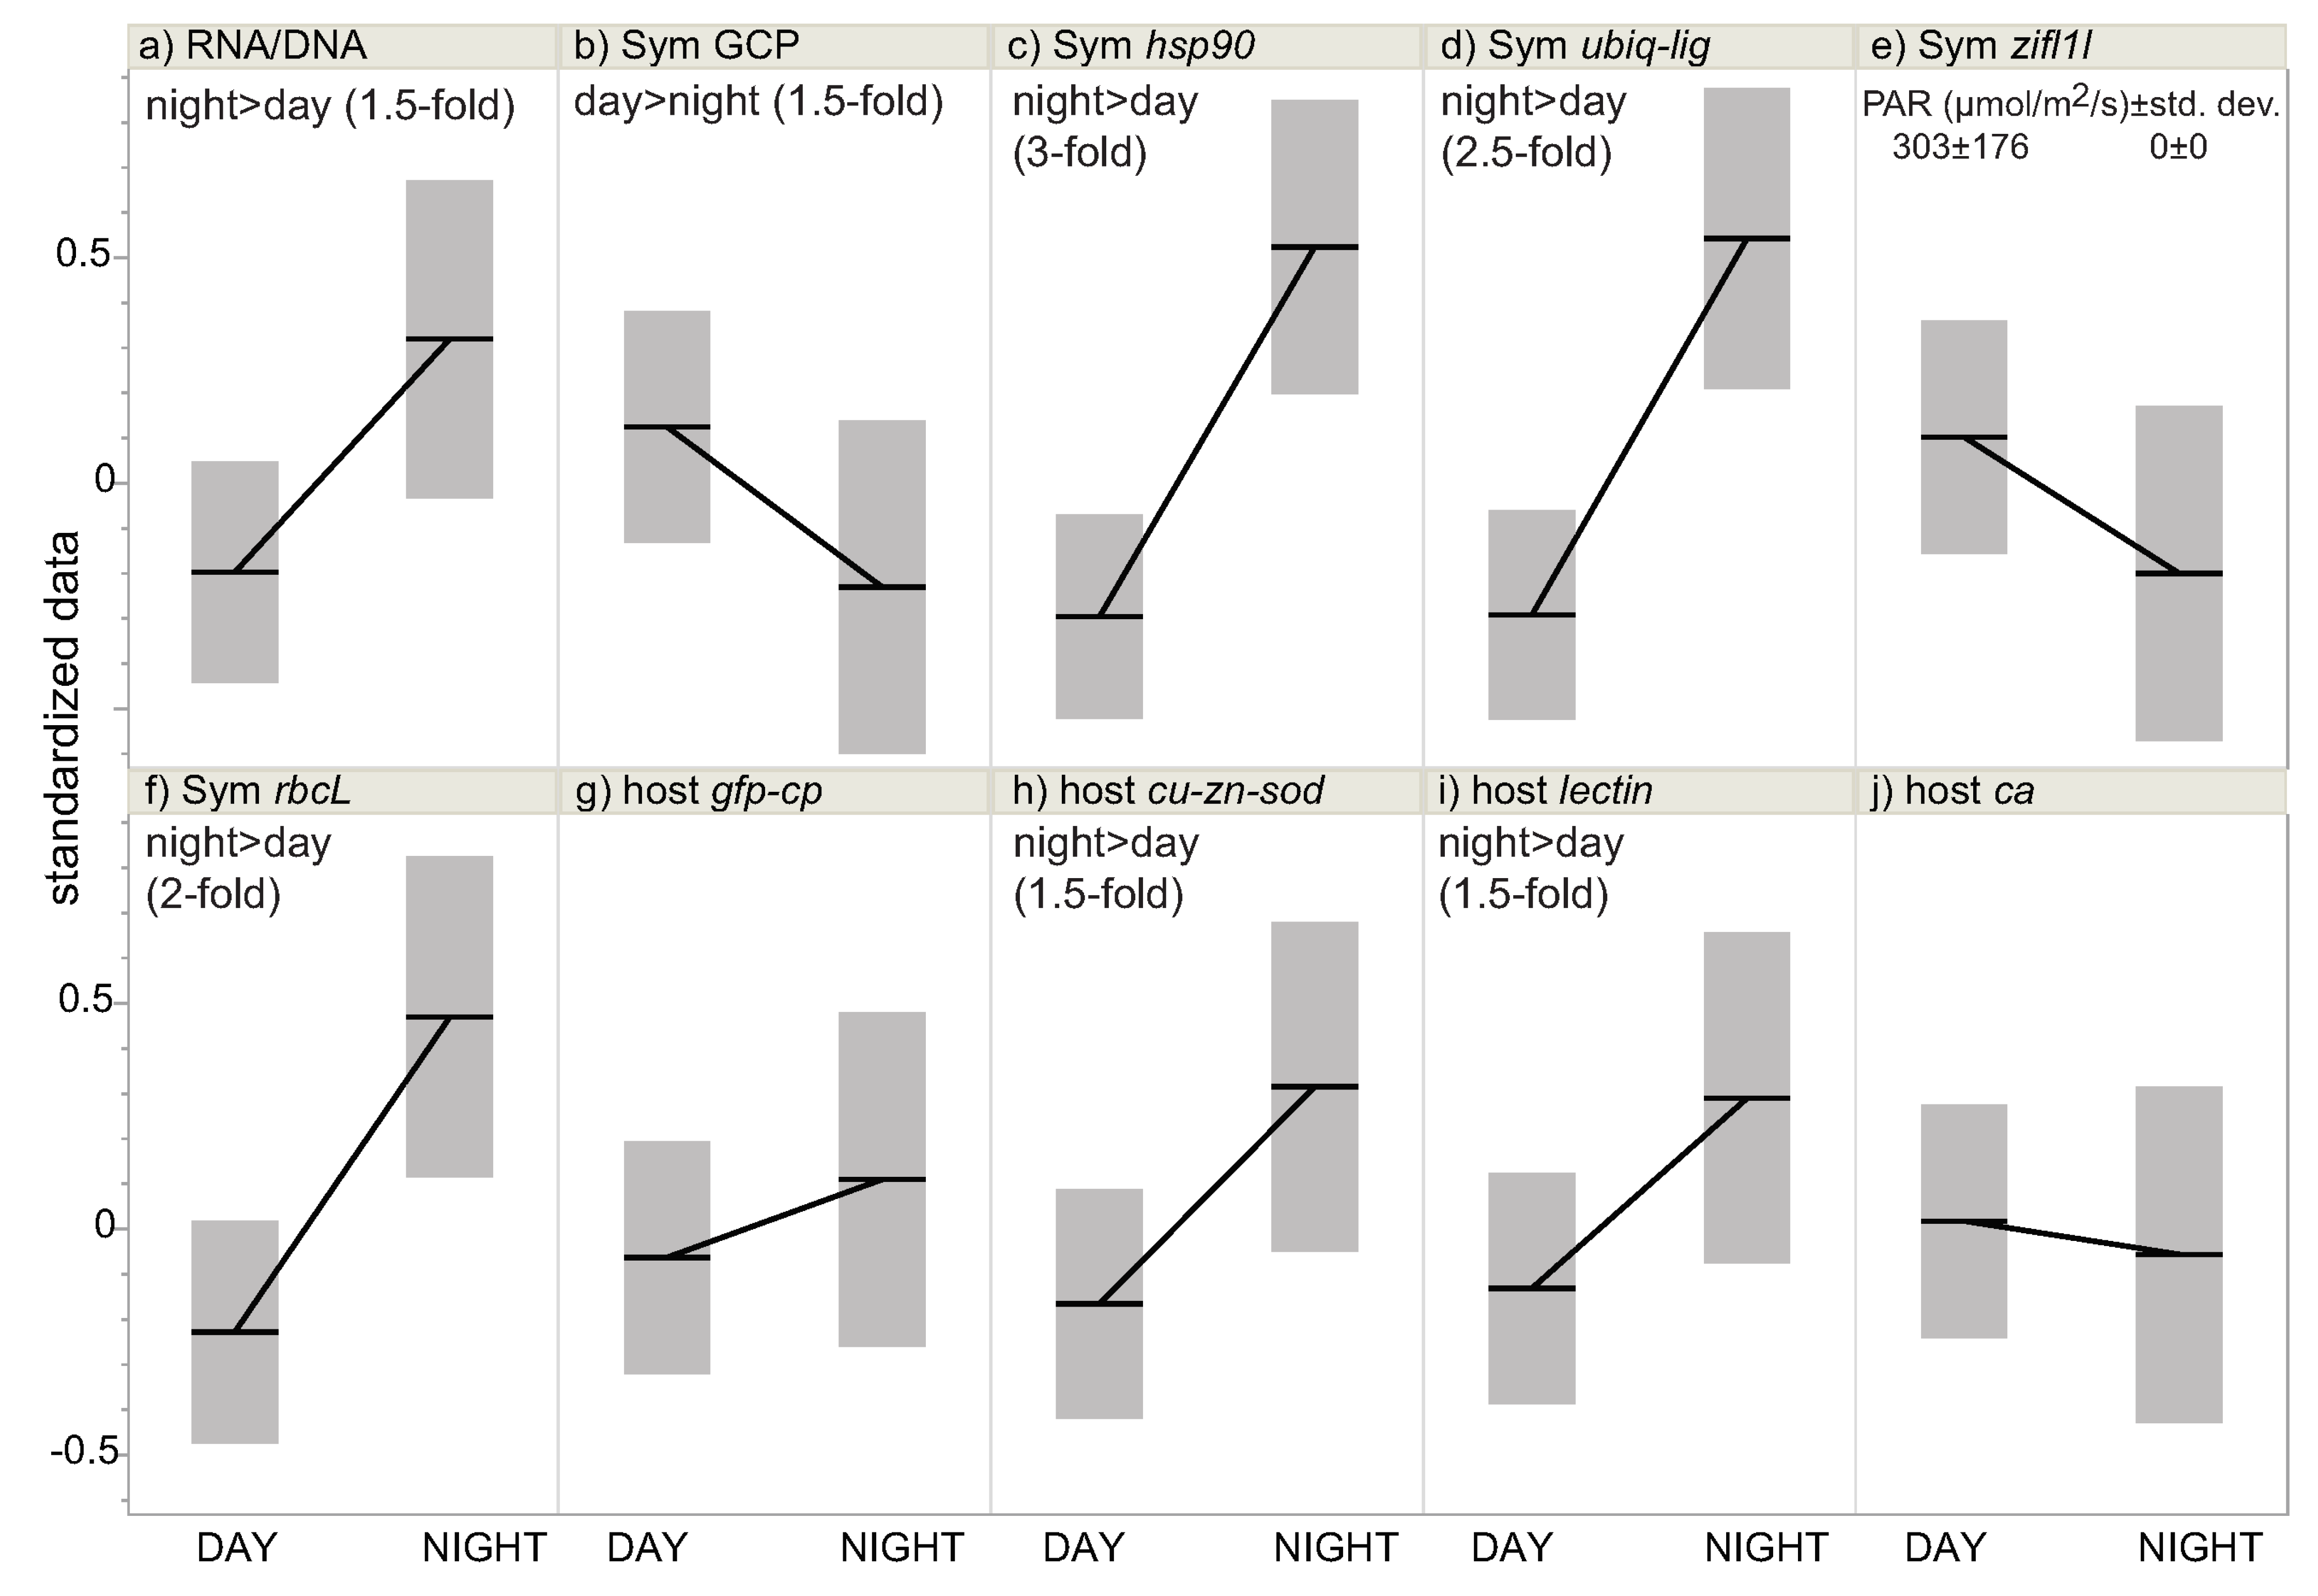
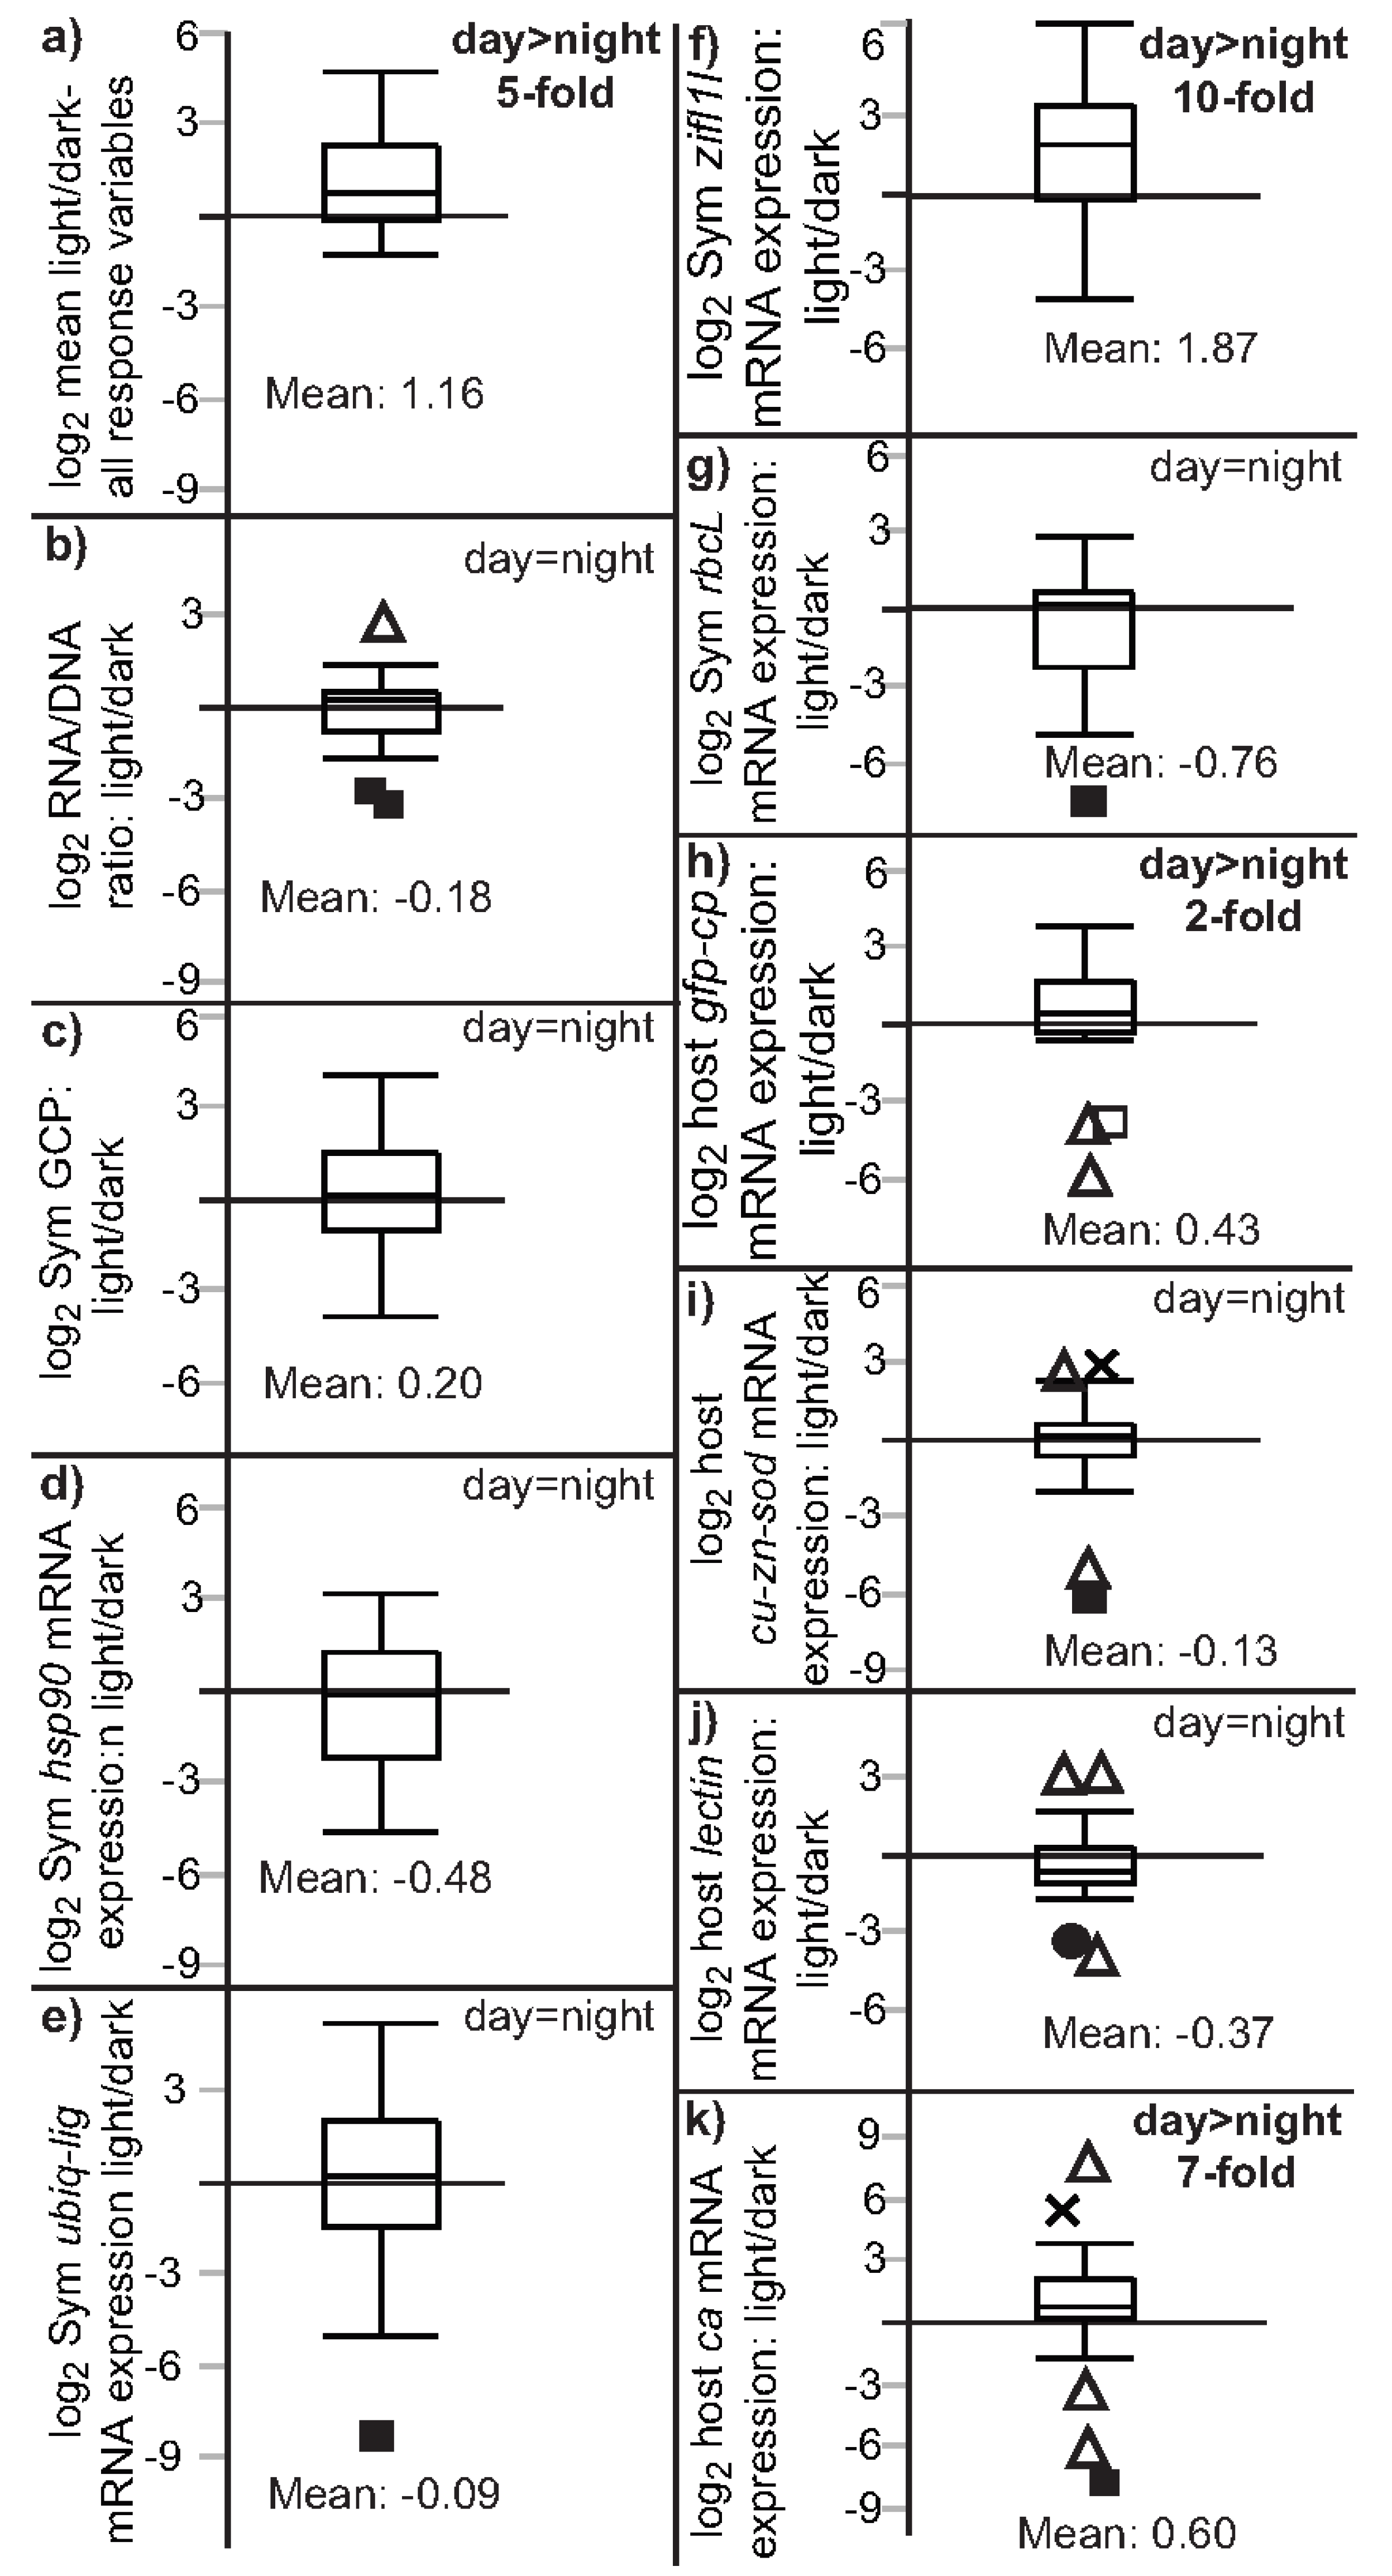
3.2. Univariate Effects of Time and Light on Coral Response Variables

Given these multivariate temporal differences, temporal and light/dark effects on the individual RV were assessed, and the univariate data were analyzed in several different ways. First, the mean values of each of the 10 RV were compared over the three time windows: morning, afternoon, and night (Figure 2 and Table 3). Wilcoxon tests were used to assess the temporal variation for each since the data were non-normally distributed, and six of the RV demonstrated significant temporal variation. Symbiodiniaceae hsp90 (Figure 2c), ubiq-lig (Figure 2d), and rbcL (Figure 2f) mRNA expression were all significantly higher at night; zifl1l expression (Figure 2e) instead peaked in the morning. Two host coral genes varied in expression over time, cu-zn-sod (Figure 2h) and lectin (Figure 2i), and both were instead higher at night relative to morning.
As a secondary means of assessing light vs. dark differences, the morning and afternoon data were pooled, and one-way, day (n = 59) vs. night (n = 30) comparisons on ranks were made with Wilcoxon tests (also known as Kruskal–Wallis tests). When analyzing data in this manner (Figure 3 and Table 3), seven of the ten RV varied significantly between day and night. These generally included those identified in Figure 2, with the exception of Symbiodiniaceae zifl1l mRNA expression (Figure 3e), which was not found by this secondary approach to differ between light and dark sampling times. However, two RV that did not differ in Figure 2, RNA/DNA and endosymbiont density (GCP), were found to differ significantly between day and night (Figure 3a and Figure 3b, respectively) using this pooled, less conservative statistical approach. Specifically, the RNA/DNA ratio was 50% higher at night, and the Symbiodiniaceae GCP was 50% higher in the day.
As a more conservative approach for assessing temporal variation for each of the 10 coral RV, both the difference between light and dark (assessed by non-parametric matched-pairs tests; Table 3) and the light/dark ratio were compared for a subset of 26 corals that were sampled in both the day and night. In this analysis (Figure 4), only three RV demonstrated significant variation between day and night (i.e., light minus dark > 0 and light/dark > 1): Symbiodiniaceae zifl1l mRNA expression (light > dark; Figure 4f) and host coral gfp-cp (light > dark; Figure 4h) and ca mRNA expression (light > dark; Figure 4k). These univariate data are summarized in Table 3.

4. Discussion

Prior works have found that anthozoan–dinoflagellate endosymbioses vary significantly in molecular composition (e.g., endosymbiont density and lipid levels) and gene expression over short- (mins–hrs [24]), medium (hrs–days [25]), and long-term (days–months [26]) timescales (including control corals not exposed to stress-inducing conditions); however, in many cases, these findings have either been made from laboratory specimens (e.g., [27]) or from opportunistic sampling regimens (e.g., [28]). Herein, we instead had the opportunity to re-sample field corals at multiple points in the light–dark cycle (for a subset of samples) to assess intra-day changes in molecular physiology, and expression levels of a subset of both host coral and endosymbiont genes varied over time (as well as across other environmental gradients). This represents the first opportunity to observe natural variation in field coral molecular physiology in New Caledonia, and several notable observations are highlighted below.
Prior to doing so, however, it must be mentioned that, until coral reef researchers make a more concerted effort to account for the endosymbiotic, multi-compartmental nature of corals in their analyses of, in particular, RNA-Seq- or real-time PCR-derived datasets, it will be difficult to compare results to those obtained using the symbiosis-tailored approaches taken herein and in our prior works that accommodate the spatio-temporally dynamic nature of the coral holobiont [21]. For this reason, we generally abstained from making comparisons to prior laboratory analyses of diel variation in coral gene expression (e.g., [29,30,31,32,33]). It is our hope, though, that symbiologists will more carefully consider the dynamic nature of the endosymbiosis in future works on anthozoan cell biology, particularly those seeking to quantify concentrations of molecular analytes. This will be especially critical when attempting to analyze bleached or bleaching coral samples (provided that bleaching occurs via the loss of endosymbiont cells [34], rather than simply their pigments); unless proper controls are taken, bleached corals will artifactually demonstrate global increases and decreases in host coral and endosymbiont gene expression, respectively, simply because there is a higher host/endosymbiont ratio in these samples (i.e., not because expression levels of particular genes were actually changing within the cells analyzed). Herein it was found that endosymbiont densities, in fact, changed over the course of the day; were the molecular data not normalized to accommodate differing host/endosymbiont ratios over time, the gene expression data would have been inherently biased (i.e., higher endosymbiont gene expression measured at times of higher endosymbiont densities and vice versa).
As a second diversion to discussing the predominant findings of interest, one limitation of the approach employed herein must be addressed: only 10 RV were assessed in a subset of 89 coral samples. As such, this dataset in and of itself does not signify that, for instance, salinity does not affect the physiology of P. damicornis; it surely does [35]. Rather, it did not influence any of the RV assessed, nor did it explain multivariate variation/similarity among samples. The lack of influence may stem not only from having profiled non-responsive analytes, but instead, from low variation in salinity across the survey reefs [12]. In other words, both a lack of environmental variation and the incorporation of non-sensitive analytes could explain the lack of statistically significant influence of certain EP (additionally including reef zone and endosymbiont assemblage). By analyzing data from multiple LOF GRE research missions in the near future, we will ultimately gain a greater understanding of the EP that drive variation in coral physiology on a pan-ocean (sensu [36]), not just intra-country, scale.
Expression levels of both Symbiodiniaceae (hsp90 and ubiq-lig) and host coral (cu-zn-sod) stress-targeted genes were high in all samples (see normalized, transformed, and standardized values in Figure 2, Figure 3, Figure 4, and the OSDF). As has been found in prior works in laboratory (e.g., [37]) and field [38] settings, high molecular chaperone levels (e.g., hsp40, hsp70, and hsp90) are characteristic of all corals and dinoflagellate endosymbionts analyzed to date. Whether this signifies that all corals are under some degree of stress or, more optimistically, that they are simply stress-hardened in a manner in which cells are “prepared” (at the mRNA level) for environmental change at all times (not just when temperatures, for instance, are dramatically elevated) remains to be determined. In certain, more recent proteomic works, this mRNA-based finding was, in fact, not corroborated; molecular chaperones were not generally concentrated at high levels in control or high-temperature-challenged pocilloporid corals [39]. This lack of congruency between the mRNA- and protein-level stress responses must certainly be addressed, especially by those interested in creating molecular biomarker tests for proactive coral health assessment. As for now, it appears that pocilloporid corals and their endosymbionts express high levels of stress-targeted mRNAs alongside low levels of the stress proteins encoded by these genes (global gene vs. protein R2 = 0).
Despite the fact that a mix of genes were responsive to sampling time/light level in both compartments, the endosymbionts were a stronger driver of the multivariate variation among times and light levels. Whether wider temporal and temperature-driven shifts in gene expression are indicative of relatively less control of cellular homeostasis than their anthozoan hosts or, in contrast, simply represent a greater degree of transcriptomic scope or plasticity (i.e., a desirable attribute), remains to be determined. Actually, the temporal variation observed in both compartments was anticipated based on prior studies that found that dinoflagellate metabolism and lipid composition fundamentally differ between day and night as a result of photosynthesis [40]. The consequent diel alternation between autotrophy and heterotrophy was also found to affect host gene expression [41] and could explain why carbonic anhydrase levels were temporally variable given the role of the encoded protein in (1) carbon regulation within the holobiont and (2) biomineralization [42].
Three of the four endosymbiont genes were expressed at higher levels at night, the exception being zifl1l (whose expression instead peaked in the morning; discussed below). The high nocturnal expression of rbcL was unexpected and conflicts with prior findings using laboratory cultures [43]; in cultured endosymbionts, rbcL expression indeed rises over the course of the evening (as was observed herein), but in laboratory-reared sea anemones, endosymbiont rbcL levels in hospite are generally lower at night. This could signify that the molecular regulation of carbon fixation differs between anemone–dinoflagellate and coral–dinoflagellate endosymbioses. Ultimately, though, there is no correlation between rbcL expression and RBCL protein concentrations in cultured or in hospite dinoflagellates [43], and so it will be critical to measure the concentrations of key photosynthesis-associated proteins or, alternatively, profile the entire proteomes of these coral samples in the future to better understand the molecular mechanisms underlying diel hysteresis in coral photosynthesis. In addition to the transfer of photosynthetically fixed carbon products (e.g., glycerol and glucose), the synthesis, modulation, mobilization, and translocation of lipid bodies surely play roles in the temporally dynamic metabolism of these mutualistic holobionts [44].
It is also possible that diel fluctuations in reactive oxygen species (ROS) levels resulting from even normal levels of photosynthesis-driven oxygen evolution from the endosymbionts to the hosts [45] could have driven not only changes in the expression of photosynthesis-targeted genes but also the aforementioned stress markers (in both compartments); indeed, oxidative stress is a key regulator of both gene expression and protein levels in corals [46]. Although cu-zn-sod levels and ubiq-lig levels were higher at night, it is worth mentioning that corals were sampled only an hour after sunset; corals were no longer photosynthesizing, yet this nevertheless could reflect the peak period of ROS production given the inherent lag between oxygen generation and macromolecular damage. Future work should attempt to sample later in the evening to determine when stress marker levels eventually drop to their lower daytime levels.
The most temporally variable RV assessed was the endosymbiont gene zifl1l, which encodes the zinc-induced facilitator protein. Not only did expression of this gene vary between morning and night, but it contributed highly to the partitioning of biopsies by sampling time in the multivariate analyses. Furthermore, SRA found it to be the most influential gene in building a predictive model for light vs. dark behavior. Interestingly, expression of this gene was found to be down-regulated at high temperatures in prior works [25,26]. The encoded protein is in the major facilitator superfamily and was hypothesized to function in the drought response of higher plants [47]. In single-celled organisms, though, it likely plays a more general role in proton efflux from the vacuole; given this putative role in osmoregulation, concentrations of this protein could indeed be hypothesized to change over the day given the dynamic, photosynthesis-driven osmoregulatory strategy of the anthozoan–dinoflagellate endosymbiosis, in which the osmotic pressure of both members can change over the day as osmolytes are continually synthesized/replenished and then rapidly respired. Then again, given the aforementioned lack of congruency between gene expression and protein levels in reef corals, it will be critical to first show that the temporal and temperature sensitivity of this gene is corroborated at the protein level. Regardless, the importance of the zinc-induced facilitator in reef coral homeostasis over diel cycles should be addressed in future works.

5. Conclusions

Herein, we uncovered numerous drivers of variation in coral physiology in a never-before-studied/sampled region of the Coral Triangle, with light levels significantly affecting the molecular biology of the P. damicornis colonies sampled. Whether the large temporal swings in the expression of genes involved in the stress response and other cellular processes are simply indicative of normal phenotypic plasticity or are, in contrast, testament to considerable deviations in cellular homeostasis that could be energetically expensive, cannot be determined at present. However, these reefs have bleached annually in all years following the late-2013 LOF GRE survey [35], potentially providing evidence for the latter hypothesis. Provided that a subset of these corals ultimately withstand ASB via acclimatization or adaptation, then this dataset could be used to build physiologically based resilience models that consider the degree to which short-term fluctuations in molecular biology reflect a coral’s scope and, consequently, likelihood of persisting into the next century. If no such resilience is documented, then this dataset may only have value in serving as a record for future scientists to understand how New Caledonian corals functioned in the last bleaching-free year. Indeed, the preserved tissue biopsies may unfortunately reflect the last biological record of the coral colonies from which they were sampled, many of which have likely already perished on account of climate change.

Supplementary Materials

The following are available online at https://www.mdpi.com/article/10.3390/oceans3010002/s1: Supplementary Materials containing supplemental methods, Tables S1–S3, Figure S1, and the online supplemental data file (xlsx).

Author Contributions

Conceptualization, A.B.M.; methodology, A.B.M. and A.C.D.; analysis, A.B.M.; writing, A.B.M.; visualization, A.B.M. All authors have read and agreed to the published version of the manuscript.

Funding

This would not have been possible without the gracious support of the Khaled bin Sultan Living Oceans Foundation, which funded the research trip to New Caledonia in 2013 in its entirety. A.B.M. would also like to thank the MacArthur Foundation and the United States Fulbright Program for supporting the laboratory portion of this analysis.

Institutional Review Board Statement

Not applicable.

Informed Consent Statement

Not applicable.

Data Availability Statement

All data presented within this manuscript can either be found in a previously published work [12] or in the online supplemental data file. The data and maps are also publicly accessible on the following LOF websites: www.livingoceansfoundation.org and maps.lof.org/lof. Images of all sampled coral colonies, as well as the associated sequence data used to genotype them, can be found at coralreefdiagnostics.com (accessed on 1 December 2021).

Acknowledgments

Thanks are given to the dedicated crew of the M.Y. Golden Shadow.

Conflicts of Interest

The authors declare no conflict of interest, and the funders had no role in the design of the study; in the collection, analyses, or interpretation of the data; in the writing of the manuscript; or in the decision to publish the results. The article’s content does not necessarily reflect the stance of the United States’ government or any of the funding agencies.

References

  1. Hoegh-Guldberg, O.; Poloczanska, E.S.; Skirving, W.; Dove, S. Coral reef ecosystems under climate change and ocean acidification. Front. Mar. Sci. 2017, 4, 158. [Google Scholar] [CrossRef] [Green Version]
  2. Hughes, T.P.; Barnes, M.L.; Bellwood, D.R.; Cinner, J.E.; Cumming, G.S.; Jackson, J.B.C.; Kleypas, J.; van de Leemput, I.A.; Lough, J.M.; Morrison, T.H.; et al. Coral reefs in the anthropocene. Nature 2017, 546, 82–90. [Google Scholar] [CrossRef]
  3. Sheppard, C.; Sheppard, A.; Mogg, A.; Bayley, D.; Dempsey, A.C.; Roche, R.; Turner, J.; Purkis, S. Coral bleaching and mortality in the Chagos Archipelago. Atoll Res. Bull. 2017, 613, 1–26. [Google Scholar] [CrossRef]
  4. Mayfield, A.B.; Chen, M.; Meng, P.J.; Lin, H.J.; Chen, C.S.; Liu, P.J. The physiological response of the reef coral Pocillopora damicornis to elevated temperature: Results from coral reef mesocosm experiments in Southern Taiwan. Mar. Environ. Res. 2013, 86, 1–11. [Google Scholar] [CrossRef] [PubMed]
  5. Cruz-García, R.; Rodríguez-Troncoso, A.P.; Rodríguez-Zaragoza, F.A.; Cupul-Magaña, A.L.; Mayfield, A.B. Ephemeral effects of El Niño southern oscillation events on an eastern tropical Pacific coral community. Mar. Freshw. Res. 2020, 71, 1259–1268. [Google Scholar] [CrossRef]
  6. Gintert, B.E.; Manzello, D.P.; Enochs, I.C.; Kolodziej, G.; Carlton, R.D.; Gleason, A.C.R.; Gracias, N. Marked annual coral bleaching resilience of an inshore patch reef in the Florida Keys: A nugget of hope, aberrance, or last man standing? Coral Reefs 2018, 37, 533–547. [Google Scholar] [CrossRef] [Green Version]
  7. Darling, E.S.; McClanahan, T.R.; Maina, J.; Gurney, G.G.; Graham, N.A.J.; Januchowski-Hartley, F.; Cinner, J.E.; Mora, C.; Hicks, C.C.; Maire, E.; et al. Social–environmental drivers inform strategic management of coral reefs in the Anthropocene. Nat. Ecol. Evol. 2019, 3, 1341–1350. [Google Scholar] [CrossRef]
  8. IPCC. Impacts, adaptation and vulnerability. In Fourth Assessment Report on the Intergovernmental Panel on Climate Change; Cambridge University Press: Cambridge, UK, 2007. [Google Scholar]
  9. Mayfield, A.B.; Chen, C.S.; Dempsey, A.C.; Bruckner, A.W. The molecular ecophysiology of closely related pocilloporids from the South Pacific: A case study from the Austral and Cook Islands. Platax 2016, 13, 1–25. [Google Scholar]
  10. Andrefouet, S.; Cabioch, G.; Flamand, B.; Pelletier, B. A reappraisal of the diversity of geomorphological and genetic processes of New Caledonian coral reefs: A synthesis from optical remote sensing, coring and acoustic multibeam observations. Coral Reefs 2009, 28, 691–707. [Google Scholar] [CrossRef]
  11. Cunning, R.; Bay, R.A.; Gillette, P.; Baker, A.; Traylor-Knowles, N. Comparative analysis of the Pocillopora damicornis genome highlights role of immune system in coral evolution. Sci. Rep. 2018, 8, 16134. [Google Scholar] [CrossRef] [PubMed] [Green Version]
  12. Mayfield, A.B.; Chen, C.S.; Dempsey, A.C. The molecular ecophysiology of closely related pocilloporid corals of New Caledonia. Platax 2017, 14, 1–45. [Google Scholar]
  13. Barshis, D.J.; Stillman, J.H.; Gates, R.D.; Toonen, R.J.; Smith, L.W.; Birkeland, C. Protein expression and genetic structure of the coral Porites lobata in an environmentally extreme Samoan back reef: Does host genotype limit phenotypic plasticity? Mol. Ecol. 2010, 19, 1705–1720. [Google Scholar] [CrossRef]
  14. Putnam, H.M.; Edmunds, P.J.; Fan, T.Y. Effect of a fluctuating thermal regime on adult and larval reef corals. Invertebr. Biol. 2010, 129, 199–209. [Google Scholar] [CrossRef]
  15. Edmunds, P.J.; Cumbo, V.; Fan, T.Y. Effects of temperature on the respiration of brooded larvae from tropical reef corals. J. Exp. Biol. 2011, 214, 2783–2790. [Google Scholar] [CrossRef] [Green Version]
  16. Schmidt-Roach, S.; Miller, K.J.; Lundgren, P.; Andreakis, N. With eyes wide open: A revision of species within and closely related to the Pocillopora damicornis species complex (Scleractinia; Pocilloporidae) using morphology and genetics. Zool. J. Linnaean Soc. 2014, 170, 1–33. [Google Scholar] [CrossRef]
  17. Putnam, H.M.; Barott, K.; Ainsworth, T.D.; Gates, R.D. The vulnerability and resilience of reef-building corals. Curr. Biol. 2017, 27, R528–R540. [Google Scholar] [CrossRef] [Green Version]
  18. van Hooidonk, R.; Maynard, J.; Tamelander, J.; Gove, J.; Ahmadia, G.; Raymundo, L.; Williams, G.; Heron, S.F.; Planes, S. Local-scale projections of coral reef futures and implications of the Paris Agreement. Sci. Rep. 2016, 6, 39666. [Google Scholar] [CrossRef]
  19. UNEP. Projections of Future Coral Bleaching Conditions Using IPCC CMIP6 Models: Climate Policy Implications, Management Applications, and Regional Seas Summaries; United Nations Environment Programme: Nairobi, Kenya, 2020.
  20. Saul, S.; Purkis, S. Semi-automated object-based classification of coral reef habitat using discrete choice models. Remote Sens. 2015, 7, 15894–15916. [Google Scholar] [CrossRef] [Green Version]
  21. Mayfield, A.B.; Hsiao, Y.Y.; Fan, T.Y.; Chen, C.S.; Gates, R.D. Evaluating the temporal stability of stress-activated protein kinase and cytoskeleton gene expression in the Pacific corals Pocillopora damicornis and Seriatopora hystrix. J. Exp. Mar. Biol. Ecol. 2010, 395, 215–222. [Google Scholar] [CrossRef]
  22. Mayfield, A.B.; Hirst, M.B.; Gates, R.D. Gene expression normalization in a dual compartment system: A real-time PCR protocol for symbiotic anthozoans. Mol. Ecol. Res. 2009, 9, 462–470. [Google Scholar] [CrossRef]
  23. Putnam, H.M.; Mayfield, A.B.; Fan, T.Y.; Chen, C.S.; Gates, R.D. The physiological and molecular responses of larvae from the reef-building coral Pocillopora damicornis exposed to near-future increases in temperature and pCO2. Mar. Biol. 2013, 160, 2157–2173. [Google Scholar] [CrossRef]
  24. Mayfield, A.B.; Fan, T.Y.; Chen, C.S. Real-time PCR-based gene expression analysis in the model reef-building coral Pocillopora damicornis: Insight from a salinity stress study. Platax 2013, 10, 1–29. [Google Scholar]
  25. Mayfield, A.B.; Chen, C.S.; Liu, P.J. Decreased green fluorescent protein-like chromoprotein gene expression in specimens of the reef-building coral Pocillopora damicornis undergoing high temperature-induced bleaching. Platax 2014, 11, 1–23. [Google Scholar]
  26. Mayfield, A.B.; Wang, Y.B.; Chen, C.S.; Chen, S.H.; Lin, C.Y. Compartment-specific transcriptomics in a reef-building coral exposed to elevated temperatures. Mol. Ecol. 2014, 23, 5816–5830. [Google Scholar] [CrossRef] [Green Version]
  27. Chen, W.N.U.; Kang, H.J.; Weis, V.M.; Mayfield, A.B.; Fang, L.S.; Chen, C.S. Diel rhythmicity of lipid body formation in a coral-Symbiodinium endosymbiosis. Coral Reefs 2012, 31, 521–534. [Google Scholar] [CrossRef]
  28. Mayfield, A.B.; Hsiao, Y.Y.; Fan, T.Y.; Chen, C.S. Temporal variation in RNA/DNA and protein/DNA ratios in four anthozoan-dinoflagellate endosymbioses of the Indo-Pacific: Implications for molecular diagnostics. Platax 2012, 9, 1–24. [Google Scholar]
  29. Wall, C.B.; Ritson-Williams, R.; Popp, B.N.; Gates, R.D. Spatial variation in the biochemical and isotopic composition of corals during bleaching and recovery. Limnol. Oceanogr. 2019, 64, 2011–2028. [Google Scholar] [CrossRef]
  30. Hoadley, K.D.; Szmant, A.M.; Pyott, S.J. Circadian clock gene expression in the coral Favia fragum over diel and lunar reproductive cycles. PLoS ONE 2011, 6, e19755. [Google Scholar] [CrossRef] [Green Version]
  31. Levy, O.; Kaniewska, P.; Alon, S.; Eisenberg, E.; Karako-Lampert, S.; Bay, L.K.; Reef, R.; Miller, D.J.; Hoegh-Guldberg, O. Complex diel cycles of gene expression in coral-algal symbiosis. Science 2011, 331, 175. [Google Scholar] [CrossRef]
  32. Bertucci, A.; Forêt, S.; Ball, E.E.; Miller, D.J. Transcriptomic differences between day and night in Acropora millepora provide new insights into metabolite exchange and light-enhanced calcification in corals. Mol. Ecol. 2015, 24, 4489–4504. [Google Scholar] [CrossRef]
  33. Hemond, E.M.; Vollmer, S.V. Diurnal and nocturnal transcriptomic variation in the Caribbean staghorn coral, Acropora cervicornis. Mol. Ecol. 2015, 24, 4460–4473. [Google Scholar] [CrossRef] [PubMed]
  34. Gates, R.D. Seawater temperature and sublethal coral bleaching in Jamaica. Coral Reefs 1990, 8, 193–197. [Google Scholar] [CrossRef]
  35. Mayfield, A.B.; Gates, R.D. Osmoregulation in anthozoan-dinoflagellate symbiosis. Comp. Biochem. Physiol. 2007, 147, 1–10. [Google Scholar] [CrossRef] [PubMed]
  36. Fox, M.D.; Williams, G.J.; Johnson, M.D.; Radice, V.Z.; Zgliczynski, B.J.; Kelly, E.L.A.; Rohwer, F.L.; Sandin, S.A.; Smith, J.E. Gradients in primary production predict trophic strategies of mixotrophic corals across spatial scales. Curr. Biol. 2018, 28, 3355–3363. [Google Scholar] [CrossRef] [PubMed] [Green Version]
  37. Barshis, D.J.; Ladner, J.T.; Oliver, T.A.; Seneca, F.O.; Traylor-Knowles, N.; Palumbi, S.R. Genomic basis for coral resilience to climate change. Proc. Natl. Acad. Sci. USA 2013, 110, 1387–1392. [Google Scholar] [CrossRef] [PubMed] [Green Version]
  38. Mayfield, A.B.; Chen, Y.J.; Lu, C.Y.; Chen, C.S. Proteins responsive to variable temperature exposure in the reef-building coral Seriatopora hystrix. In Coral Reefs: Ecosystems, Environmental Impact and Current Threats; Ortiz, S., Ed.; NOVA Publishing: New York, NY, USA, 2016; pp. 1–72. [Google Scholar]
  39. Mayfield, A.B.; Wang, Y.B.; Chen, C.S.; Chen, S.H.; Lin, C.Y. Dual-compartmental transcriptomic+proteomic analysis of a marine endosymbiosis exposed to environmental change. Mol. Ecol. 2016, 25, 5944–5958. [Google Scholar] [CrossRef]
  40. Peng, S.E.; Chen, W.N.U.; Chen, H.K.; Lu, C.Y.; Mayfield, A.B.; Chen, C.S. Lipid bodies in coral-dinoflagellate endosymbiosis: Ultrastructural and proteomic analyses. Proteomics 2011, 17, 3540–3555. [Google Scholar] [CrossRef] [PubMed]
  41. Levy, O.; Achituv, Y.; Schnider, K.; Dubinsky, Z.; Gorbunov, M. Diurnal hysteresis in coral photosynthesis. Mar. Ecol. Prog. Ser. 2004, 268, 105–117. [Google Scholar] [CrossRef]
  42. Moya, A.; Tambutté, S.; Lotto, S.; Allemand, D.; Zoccola, D. Carbonic anhydrase in the scleractinian coral Stylophora pistillata: Characterization, localization, and role in biomineralization. J. Biol. Chem. 2008, 283, 25475–25484. [Google Scholar] [CrossRef] [Green Version]
  43. Mayfield, A.B.; Hsiao, Y.Y.; Chen, H.K.; Chen, C.S. Rubisco expression in the dinoflagellate Symbiodinium sp. is influenced by both photoperiod and endosymbiotic lifestyle. Mar. Biotech. 2014, 16, 371–384. [Google Scholar] [CrossRef]
  44. Chen, H.K.; Song, S.N.; Wang, L.H.; Mayfield, A.B.; Chen, Y.J.; Chen, W.N.U.; Chen, C.S. A compartmental comparison of major lipid species in a coral-Symbiodinium endosymbiosis: Evidence that the coral host regulates lipogenesis of its cytosolic lipid bodies. PLoS ONE 2015, 10, e0132519. [Google Scholar] [CrossRef] [PubMed]
  45. Lesser, M.P. Oxidative stress causes coral bleaching during exposure to elevated temperatures. Coral Reefs 1997, 16, 187–192. [Google Scholar] [CrossRef]
  46. Lesser, M.P. Oxidative stress in marine environments: Biochemistry and physiological ecology. Annu. Rev. Physiol. 2006, 68, 253–278. [Google Scholar] [CrossRef] [PubMed] [Green Version]
  47. Cabrito, T.R.; Teixeira, M.C.; Duarte, A.A.; Duque, P.; Sa Correia, I. Heterologous expression of a Tpo1 homolog from Arabidopsis thaliana confers resistance to the herbicide 2,4-D and other chemical stresses in yeast. Appl. Microbiol. Biotechnol. 2009, 84, 927–936. [Google Scholar] [CrossRef] [PubMed]
Figure 1. Multivariate effects of sampling time on coral physiology. Both PCA (on correlations; (a,c,e)) and DCA (on standardized data; (b,d,f)) were used to depict molecular-physiological data in two dimensions such that relationships among corals sampled at different times—morning (<10:00; red squares), afternoon (10:00–14:00; blue triangles), and night (18:00–20:00; black exes)—could be explored. All 10 response variables (both compartments; (a,b)), as well as the four host coral (c,d) and four Symbiodiniaceae (Sym) genes ((e,f); highlighted in green in the holobiont plots (a,b)) were included in the PCA and DCA, respectively. The results of multivariate ANOVA (as Wilks’ lambda), which is calculated as part of DCA, are shown in (b,d,f); these results were corroborated with the more conservative and robust PERMANOVA (Table 2). Not all vectors are labeled in the DCA plots due to spatial constraints, and the blue, yellow, and brown ellipses signify 95% confidence for the morning, afternoon, and night multivariate means, respectively. Multi-dimensional scaling of standardized data yielded a similar solution to the PCAs (data not shown).
Oceans 03 00002 g001
Figure 2. Sampling time effects on the 10 pocilloporid coral-Symbiodiniaceae response variables. When the Wilcoxon test determined a statistically significant effect of time (df = 2; squares, triangles, and exes for morning (before 10:00), afternoon (10:00–14:00), and night (after 18:00), respectively) for any of the 10 response variables (aj), rank-based post-hoc tests (i.e., Dunn’s joint-ranking tests) were carried out among individual sampling time means (p < 0.05; as lowercase letters). Mean PAR levels for each sampling bin are included at the top of panel (a).
Oceans 03 00002 g002
Figure 3. Light effects on 10 coral response variables. In contrast to Figure 2, data were pooled across the two light sampling windows (before 10:00 and 10:00–14:00; PAR = 455 ± 151 and 267 ± 161 µmol/m2/s, respectively) in this figure, with the differences vs. dark-sampled colonies tested with Wilcoxon tests (on ranks) for each of the 10 response variables (aj). Grey bands depict 95% confidence, and the trend and fold difference included in the upper left-hand corner of the plot represent statistical significance according to the Wilcoxon test (p < 0.02). Mean day and night PAR levels at the position of the sampled coral colonies are included at the top of panel (e).
Oceans 03 00002 g003
Figure 4. Mean light/dark ratios for the 26 coral colonies sampled at both midday and night. Ratio data were log2-transformed, and signed-rank (non-parametric) tests were used to determine whether the transformed values of the geometric mean (a) plus the 10 response variables (bk) were significantly higher than 0 (equivalent to whether the untransformed ratios were significantly higher than 1); only the geometric mean (a), Symbiodiniaceae (Sym) zifl1l (f) mRNA expression, and host coral gfp-cp (h) and ca (k) mRNA expression fulfilled this criterion (p < 0.02 for all). The null hypothesis value of 0 is plotted as a solid horizontal line in each panel. The icon legend follows Figure 2.
Oceans 03 00002 g004
Table 1. Environmental parameters (EP) and coral response variables (RV) measured. Please note that the first two RV were not generally featured in the statistical models. PAR = photosynthetically active radiation.
EP (n = 13)Number and Description of Categories/Bins
Region2: south vs. north
Island/atoll6: see Figures 1 and 2 of Mayfield et al. [12] a
Reef exposure3: protected, intermediate, exposed
Reef zone4: backreef, forereef, lagoon, channel b
Reef type4: patch reef, fringing reef, barrier reef, atoll
Time3: <10:00, 10:00–14:00, >18:00
Light (PAR)2: >0 (light) vs. 0 (dark) µmol/photons m2/s
Depth6: 5–10, 10–15, 15–20, 20–25, 25–30, >30 m
Coral cover3: 15–30, 30–45%, undetermined
Temperature 5: 23–24, 24–25, 25–26, >26 °C, undetermined
Salinity4: 34.9, 35.1, 35.2, 35.3
Colony color5: normal, pale, very pale, green, purple
Symbiodiniaceae assemblage2: Cladocopium only vs. Symbiodinium + Cladocopium
RV (n = 12)Function/Notes
Maximum colony length (cm)colony size
Planar surface area (cm2)colony size
RNA/DNA ratioproxy for total gene expression level
Symbiodiniaceae genome copy proportionproxy for endosymbiont density
Symbiodiniaceae rbcL mRNA expressionribulose-1,5-bisphosphate carboxylase/oxygenase (photosynthesis)
Symbiodiniaceae ubiq-lig mRNA expressionubiquitin ligase (stress response)
Symbiodiniaceae hsp90 mRNA expressionheat shock protein 90 (stress response)
Symbiodiniaceae zifl1l mRNA expressionzinc-induced facilitator-like 1-like (unknown/osmoregulation)
Host coral ca mRNA expressioncarbonic anhydrase (metabolism)
Host coral lectin mRNA expressioncell adhesion
Host coral cu-zn-sod mRNA expressioncopper-zinc superoxide dismutase (stress response)
Host coral gfp-like cp mRNA expressiongreen fluorescent protein-like chromoprotein (light regulation)
a No P. damicornis colonies were found at Prony Bay or Pelotas Atoll. b No P. damicornis colonies were found within sheltered bays (a 5th reef zone considered previously).
Table 2. Comparison of methods on the Pocillopora damicornis multivariate response (10 response variables). Permutational multivariate ANOVA (PERMANOVA; similarity (Euclidean distances) among standardized data) and partial least squares (PLS) were carried out with the exclusion of eight outliers and two samples collected in the late afternoon (n = 89). Environmental parameters with the same PERMANOVA p-values are ranked based on their “predictor score,” defined as: accuracy (1-PLS % misclassified) + PLS % variation explained. Unmeasured EP contributed ~10% of the residual variation. NS = not statistically significant (p > 0.045). Sym = Symbiodiniaceae.
Environmental ParameterPERMANOVA PLS-% Variation ExplainedPLS-% MisclassifiedPredictor Score
lightp < 0.0017.02681
timep < 0.017.44067
coral coverp < 0.019.04564
temperaturep < 0.0111.64864
colony colorp < 0.017.35156
regionp = 0.014.02480
reef typep < 0.0459.94070
reef exposurep < 0.0454.43668
island/atollp < 0.0459.65258
depthp < 0.0457.75157
salinityNS2.83370
Sym assemblageNS1.13566
reef zoneNS7.44958
Table 3. Effects of light and time on coral response variables (RV). Rank-based tests were used for all RV due to lack of normality. When considering the entire dataset (n = 59 light vs. 30 dark), time was tested as three bins (“Time (df = 2):” morning, afternoon, or night), with light as two (“Light (df = 1):” PAR = 0 vs. >0 µmol/photons m2/s). When analyzing only the 26 colonies that were sampled twice (approximately solar noon and 1-hr post-sunset), both non-parametric matched-pairs tests (i.e., signed-rank of “Light minus dark”), or one-sample signed-rank tests of the mean “Light/dark” ratio against a null hypothesis of 1 were instead undertaken. Sample sizes for the three southern and lone northern night dive sites were 9, 4, 7, and 6, respectively (n = 26 total). NS = not statistically significant (p > 0.02).
Effect typeTime (df = 2)Light (df = 1)Light minus darkLight/dark
Sample size89892626
Type of testWilcoxon testWilcoxon testMatched pairs
(signed-rank)
Signed-rank vs. 1
FigureFigure 2Figure 3Not plottedFigure 4 and Figure S1
Response variable
RNA/DNANS (p = 0.055)night > day (p = 0.012) aNS (p = 0.853)NS (p = 0.824)
Sym GCPNS (p = 0.044)day > night (p = 0.010)NS (p = 0.261)NS (p = 0.108)
Sym hsp90night > day (p < 0.001) anight > day (p < 0.001) aNS (p = 0.683)NS (p = 0.890)
Sym ubiq-lignight > day (p = 0.002)night > day (p = 0.001)NS (p = 0.612)NS (p = 0.351)
Sym zifl1lday > night (p = 0.019) aNS (p = 0.222) bday > night (p = 0.001)day > night (p < 0.001)
Sym rbcLnight > day (p = 0.008)night > day (p = 0.002)NS (p = 0.971)NS (p = 0.931)
host caNS (p = 0.724)NS (p = 0.585)day > night (p = 0.012)day > night (p = 0.003)
host lectinnight > day (p = 0.018)night > day (p = 0.014)NS (p = 0.053)NS (p = 0.831)
host cu-zn-sodnight > day (p = 0.006)night > day (p = 0.006)NS (p = 0.170)NS (p = 0.107)
host gfp-cpNS (p = 0.874)NS (p = 0.863)day > night (p = 0.007)day > night (p = 0.009)
a supported by stepwise regression. b contradicted by stepwise regression.
Publisher’s Note: MDPI stays neutral with regard to jurisdictional claims in published maps and institutional affiliations.

