Article

Divergent Proteomic Responses Offer Insights into Resistant Physiological Responses of a Reef-Foraminifera to Climate Change Scenarios

by
Marleen Stuhr
1,2,3,*,
Louise P. Cameron
3,4,
Bernhard Blank-Landeshammer
5,
Claire E. Reymond
3,
Steve S. Doo
3,
Hildegard Westphal
3,6,
Albert Sickmann
5,7,8 and
Justin B. Ries
3,4
1
Interuniversity Institute for Marine Sciences, Eilat 8810302, Israel
2
The Mina and Everard Goodman Faculty of Life Sciences, Bar-Ilan University, Ramat Gan 52900, Israel
3
Leibniz Centre for Tropical Marine Research (ZMT), 28359 Bremen, Germany
4
Department of Marine and Environmental Sciences, Marine Science Center, Northeastern University, Boston, MA 01908, USA
5
Leibniz Institut für Analytische Wissenschaften-ISAS-e.V., 44139 Dortmund, Germany
6
Department of Geosciences, Bremen University, 28359 Bremen, Germany
7
Medizinische Fakultät, Medizinische Proteom-Center (MPC), Ruhr-Universität Bochum, 44801 Bochum, Germany
8
Department of Chemistry, University of Aberdeen, Old Aberdeen, Scotland AB24 3UE, UK
*
Author to whom correspondence should be addressed.
Oceans 2021, 2(2), 281-314; https://doi.org/10.3390/oceans2020017
Submission received: 31 December 2020 / Revised: 17 March 2021 / Accepted: 25 March 2021 / Published: 1 April 2021

Abstract

:
Reef-dwelling calcifiers face numerous environmental stresses associated with anthropogenic carbon dioxide emissions, including ocean acidification and warming. Photosymbiont-bearing calcifiers, such as large benthic foraminifera, are particularly sensitive to climate change. To gain insight into their responses to near-future conditions, Amphistegina lobifera from the Gulf of Aqaba were cultured under three pCO2 conditions (492, 963, 3182 ppm) crossed with two temperature conditions (28 °C, 31 °C) for two months. Differential protein abundances in host and photosymbionts were investigated alongside physiological responses and microenvironmental pH gradients assessed via proton microsensors. Over 1000 proteins were identified, of which > 15% varied significantly between treatments. Thermal stress predominantly reduced protein abundances, and holobiont growth. Elevated pCO2 caused only minor proteomic alterations and color changes. Notably, pH at the test surface decreased with increasing pCO2 under all light/dark and temperature combinations. However, the difference between [H+] at the test surface and [H+] in the seawater—a measure of the organism’s mitigation of the acidified conditions—increased with light and pCO2. Combined stressors resulted in reduced pore sizes and increased microenvironmental pH gradients, indicating acclimative mechanisms that support calcite test production and/or preservation under climate change. Substantial proteomic variations at moderate-pCO2 and 31 °C and putative decreases in test stability at high-pCO2 and 31 °C indicate cellular modifications and impacts on calcification, in contrast to the LBFs’ apparently stable overall physiological performance. Our experiment shows that the effects of climate change can be missed when stressors are assessed in isolation, and that physiological responses should be assessed across organismal levels to make more meaningful inferences about the fate of reef calcifiers.

1. Introduction

Anthropogenic carbon dioxide (CO2) emissions affect ecosystems worldwide [1]. Marine environments are impacted by both ocean warming (OW) and ocean acidification (OA) that result from rising atmospheric CO2. The associated rise in seawater temperature poses a major threat to coral reef ecosystems [2]. Alongside the altered carbonate chemistry and saturation states [3,4,5], warming represents a substantial challenge for marine calcifiers to overcome [6] as it leads to the breakdown of the symbiosis between host organisms, like corals and foraminifera, and their photosymbionts. OA has various impacts on biomineralization and skeleton construction [7,8], with photosymbiotic reef organisms, such as scleractinian corals, often showing non-linear and even parabolic responses [9,10,11]. The responses of photosymbiotic organisms can be difficult to predict due to their differential yet potentially complementary modification of carbonate chemistry within their cytoplasm, but also in their microenvironment, during photosynthesis and calcification [12,13,14]. Moreover, global stressors are acting in concert, potentially compounding the physiological responses of shallow-water marine calcifiers [15], which adds to the complexity of predicting the fate of coral reef organisms under future global change scenarios.
Large benthic foraminifera (LBF) are protistan eukaryotes that build calcareous shells, known as tests, and host endosymbiotic microalgae. The proliferation of these and other calcifying tropical/subtropical reef organisms, including corals, are augmented by photosynthesizing endosymbiotic microalgae. The energetic advantages of this association arise from the photosynthate-derived carbohydrates that are released by the symbionts to the host [16,17], thus facilitating LBF to be major calcium carbonate producers within reef ecosystems and contribute significantly to the global carbon cycle [18,19]. The taxonomic family Amphisteginidae has occurred in the fossil record for the past 50–60 million years, and is one of the most scientifically recognized and widespread modern families of LBF [20]. Amphistegina spp. appear more resilient to thermal stress than many other LBF [21,22,23], which could be an adaptation from ancestors of the Paleogene, when atmospheric CO2 fluctuated substantially and was generally 2- to 3-fold higher than Neogene levels [24]. During the middle Eocene, Amphistegina spp. and other hyaline LBF were extremely diverse and dominant in shallow tropical marine carbonate environments [25], when atmospheric CO2 was similar to or higher than today [26]. Recently, 18S SSU rDNA markers have shown how rich diversification and broad geographic distribution have contributed to the withstanding of Amphistegina spp. to extinction events throughout evolutionary history [27], however, it remains unclear which adaptive traits exactly facilitated these photosymbiotic calcifiers to thrive throughout such variable environmental conditions and maintain their long-lasting evolutionary success. In modern settings, Amphistegina spp. are prevalent throughout the tropical/subtropical coastal environments [28,29], and are known to occur in such high densities that they can locally represent > 1500 g per m2 CaCO3 of marine sediments [30], contributing substantially to sand production and beach nourishment.
Generally, LBF seem to be more tolerant of and adaptive to ocean warming and acidification compared to corals, but the underlying mechanisms of variations in sensitivity to global change are not fully understood [31]. Ocean warming and high light intensities are known to cause LBF bleaching [32,33]. The reductions in photosymbiont densities or pigmentations are associated with impaired host performance, including reduced photosynthesis and respiration, motility, growth and antioxidant production (e.g., [23,34,35]). Such effects are often accompanied by increased proportions of malformed or broken tests, infections, and reproductive dysfunction [36]. Yet, there are LBFs with remarkably high thermal thresholds, such as A. lobifera from the Gulf of Aqaba [22]—similar to many other marine species from the northern Red Sea [37,38]. The results of laboratory and field-based experiments on the effects of OA, however, range from predicting extinction of LBF by 2100 [39], and other negative impacts like test dissolution, reduced growth, lower chl a concentration and photosynthesis (790–1100 µatm [21,40,41,42,43,44]), to no significant effects on photosynthesis, chl a and net production/growth (up to 1925 µatm [41,45]) or positive effects such as increased symbiont performance or higher growth rates (580–770 µatm or 1169–1662 μatm [40,41,44,45,46,47]).
The effects of the combination of these stressors on LBF physiology has received little study thus far [21,41,48]. Each compartment of the holobiont (photosymbiont or host) could react depending on the environmental conditions, functional group and life cycle of the organisms, and the test mineralogy [19], thus making the interactive effects of future global change on LBF hard to predict. Mass spectrometry-based bottom-up proteomics was recently proven to be a powerful tool for detecting cellular responses among Amphistegina spp. [49], especially as this approach allows quantification of changes in algal symbiont and/or the host foraminifera simultaneously. Application of proteomics approaches may thus reveal the bio-functional mechanisms involved in maintaining homeostasis and symbiosis under rapidly changing environmental conditions.
To test the tolerance of a globally distributed shallow-water LBF to the independent and combined effects of OA and OW, a crossed-factor laboratory experiment was set up. Amphistegina lobifera from the northern Red Sea were cultured under elevated temperature (T, control = 28 °C and high = 31 °C) and three pCO2 scenarios (ambient/control = 492 ppm, year 2100/moderate = 963 ppm, and year 2500/high = 3182 ppm [1]) for two months. Effects on its physiological performance, diffusive boundary layer (DBL) pH, and host and photosymbiont proteomes were investigated by measuring proton concentrations on the test surface and in the surrounding seawater during dark and light (via microsensors), holobiont mortality (as frequency of empty tests), growth (as changes in cross-sectional area area), and color (on the L*a*b* color scale as proxy for photophysiological condition), chlorophyll a concentration (as proxy for photosymbiont biomass), test pore size (on newest chamber), as well as changes in relative abundance of proteins associated with host foraminifera and/or their photosymbiotic diatoms (via liquid chromatography-tandem mass spectrometry [LC-MS/MS] proteomics). This combined approach focuses on detecting molecular alterations at the proteomic level, representing mechanisms that contribute to holobiont functioning, as well as the downstream functional performance development of LBF to future climate change. Elucidating the cellular mechanisms responsible for acclimatization and resilience of photosymbiotic calcifiers will ultimately contribute to our understanding of how coral reefs evolve, aiding in their conservation and restoration.

2. Materials and Methods

Amphistegina lobifera harbor diatoms as endosymbionts [22,50,51,52]. Adult specimens of A. lobifera reach sizes of > 1 mm in diameter [53,54], the spherical perforate test is built of intermediate-Mg calcite,~4–6 mol% MgCO3 [55]. At depths < 10 m A. lobifera is the shallowest dwelling foraminifera of the genus and is commonly found attached to coral rubble in the upper reef slope, reef flat, and back reef zones [56,57]. This genus has a broad geographic distribution and specimens from the Red Sea, along with populations from the western Indian Ocean and the Mediterranean Sea, belong to lineage Ia [27].

2.1. Sample Collection

Collection procedures followed established protocols [58]. Initially, coral rubble was collected from the narrow and patchy fringing reef (29°30.619 N, 34°55.247 E) in the northernmost extension of the Red Sea, the Gulf of Aqaba (GoA) [28,59]. Samples were obtained by snorkeling in 2–4 m deep water in front of the Inter-University Institute for Marine Sciences (IUI) in Eilat, Israel, in March 2016. LBF specimens were removed from the rubble and transported to the Leibniz Centre for Tropical Marine Research (ZMT), Bremen, in thermally insulated containers for < 12 h. Temperature loggers (Onset HOBO®, Bourne, MA, USA) were placed in the containers at a temperature of 23.3 °C (standard deviation (SD) = 1.3), which is within the normal daily temperature range for the species. Upon arrival at the marine experimental facility (MAREE) at ZMT, the samples were cultured under low-light intensities of 15–20 µmol photons m−1 s−1 (LICOR LI-250) to recover from transport. Since the water temperature during collection at springtime (~23 °C) was relatively low compared to the target-temperatures of the experiment (28 °C, 31 °C), the specimens were slowly acclimated to the experimental target temperatures by exposing them to a temperature of 24 °C–25.5 °C during the first week. After this, the foraminifera were distributed amongst the experimental aquaria initially maintained at 26 °C, after which the temperature was ramped up by 1 °C per day until the final temperature levels of 28 °C or 31 °C were reached. Although mean annual temperatures at the collection site in the GoA rarely reach 28 °C, that temperature was selected as the control because a prior study showed that growth and photosynthetic performance of A. lobifera from the GoA were not impacted by a three-week exposure to temperatures of up to 30 °C [22]. As their thermal threshold appears to be slightly above this value, and because global sea-surface temperatures are expected to rise by an average of 3 °C (RCP 8.5 [1]), 31 °C was used as the high-temperature treatment. These experimental temperatures also correspond to the summertime thermal range at the sampling location (Fine et al., 2013, [37]). Temperatures were maintained at 28 °C (SD 0.2) and 31 °C (SD 0.3) using 125-watt aquarium heaters (EHEIM, Deizisau, Germany).

2.2. Experimental Design

A crossed-factor laboratory experiment with six treatments, two T levels (control = 28 °C, high = 31 °C), and three pCO2 scenarios (ambient/control = 492 ppm; year 2100/moderate = 963 ppm; year 2500/high = 3182 ppm [1]) were replicated four times (n = 24 tanks in total), was set up. The culturing array consisted of six 284-L seawater reservoirs, which were comprised of two seawater basins and four 10-L replicate tanks. Specimens were reared for eight weeks in each of the 10-L aquaria (≥ 18 specimens per replicate tank, > 432 specimens in total). This study was conducted in parallel with scleractinian coral specimens in the same experimental array. Corals held in the same experimental array [15,60] were fed live Artemia sp. hatched from ~40 mg of eggs within 24 h every second day, which also supplied sufficient organic matter and nutrients to the foraminifera maintained in the same tanks, especially since A. lobifera has previously been shown to depend very little on heterotrophic feeding [61,62]. Natural oligotrophic seawater collected from Svalbard, Norway, was used.
Foraminifera were housed in 48 custom-made transparent plastic containers cut open on both sides (approximately 1 × 2 × 5 cm) and covered with 400-µm nylon mesh fixed by coral glue (EcoTech Marine, Bethlehem, PA, USA). This arrangement allowed water to circulate through the submerged containers. Two of these containers were placed in each of the 24 10-L replicate tanks (4 replicate tanks per treatment). One of the two containers held eight specimens that served for assessing growth and mortality. The other container held at least ten specimens, one to two of which underwent pH microelectrode measurements, chl a extractions, and scanning electron microscopy (SEM) imaging, while the remaining eight specimens were used for proteomic analysis.
The tanks were illuminated for 12 h per day with compact fluorescent lights (ultra-actinic and white; 96 W, 1000 K) combined with standard white fluorescent lights (32 W, T8, 6500 K), with a maximum photosynthetically active radiation (PAR) of ~250 µmol photons m−2 s−1 to meet the light intensity needed for the zooxanthellate corals cultured in the same experiment. To account for the needs of A. lobifera, the irradiance was reduced by a factor of ten (to 25–35 µmol photons m−1 s−1) by shading with the black nylon mesh. Light measurements were conducted using a quantum light meter (LI-COR LI-250A) with a submersible spherical micro-quantum sensor (Walz, Effeltrich, Germany).
The seawater in all of the experimental tanks was equilibrated with mixed gases formulated at three pCO2 levels. The control-pCO2 treatment was set at 492 ppm (SD 80) to emulate control (C) present-day conditions, the moderate-pCO2 treatment (M) was set at 963 ppm (SD 134) to emulate predicted year-2100 conditions, and the high-pCO2 treatment (H) was set at 3182 ppm (SD 817) to emulate predicted year-2500 conditions [1,5]. To achieve the target pCO2 conditions, CO2-free air and pure CO2 gas were mixed with solenoid-valve-controlled mass flow controllers and bubbled via flexible microporous air stones into the two large seawater reservoirs of each experimental treatment group.
Seawater was continuously pumped from the lower large reservoir to the four replicate tanks contained within the upper large reservoir of each treatment group using a 30-watt aquarium pump (output = 2700 L h−1, Aqua Medic Eco Runner 2700). Seawater was distributed to each replicate tank via two horizontal pipes with holes drilled along their long-axes and placed at both ends of the tank, one at the top of the tank and one at the bottom, so that the corals and foraminifera specimens received laminar, circulating flow. Seawater overflowed the replicate tanks into the large upper reservoir then into the lower reservoir where it was filtered by activated charcoal (Deltec brand protein skimmer) and a filter medium pad. The seawater was continuously recirculated from the lower reservoir to the replicate tanks in the upper reservoirs using an aquarium pump. Seawater from the reserve tank was added to each experimental treatment group at a rate of 0.6 L h−1, which allows seawater to mix at near-equilibrium within each tank, thereby maintaining target carbonate chemistry of the experimental seawater’s dissolved constituents via calcification and photosynthesis (e.g., Ca2+, alkalinity, nutrients). Each treatment group was covered with a transparent Plexiglas lid to prevent in-/outgassing from the seawater and to minimize evaporation.
Following the methods of Guillermic et al. [15], salinity, pH, and temperature were measured three times per week in all of the replicate tanks using a combination probe kit (WTW Multi 3430 Set K). The pH and salinity sensors (Thermo OrionTM) were calibrated at the appropriate tank temperature (28 °C or 31 °C) before each measurement using NIST-traceable pH 4 and 7 NBS buffers and Certified Seawater Reference Material (Dickson standard batch #154) of salinity 33.347, respectively. Total alkalinity (TA) and dissolved inorganic carbon (DIC) samples were collected once per week at midday, thereby minimizing disparities in DIC due to diurnal variations in the photosynthetic activity and respiration of the tank inhabitants. DIC samples were collected in sealed 25 mL borosilicate glass vials and TA samples were collected in 50 mL centrifuge tubes that were twice flushed with seawater prior to use. Subsequently, DIC and TA samples were preserved with 10 µm and 20 µm, respectively, of saturated mercuric chloride solution and refrigerated until analysis. TA was measured by open-cell potentiometric Gran titration (accuracy ±20 μmol kg−1) and DIC was measured with a Shimadzu DOC analyzer converted for DIC analysis (accuracy ±10 μmol kg−1). Every seventh sample, the TA and DIC instruments were calibrated with Certified Seawater Reference Material (Dickson Batch #154). Concentration of carbonate ions, bicarbonate ions, aqueous CO2, aragonite (ΩA), and calcite saturation states (ΩC) were calculated from measured TA, DIC, salinity, and temperature with CO2SYS software [63] using Roy et al. [64] values for the K1 and K2 carbonic acid constants, the Mucci [65] value for the stoichiometric aragonite and calcite solubility products and with an atmospheric pressure of 1.015 atm.

2.3. Physiological Assessment

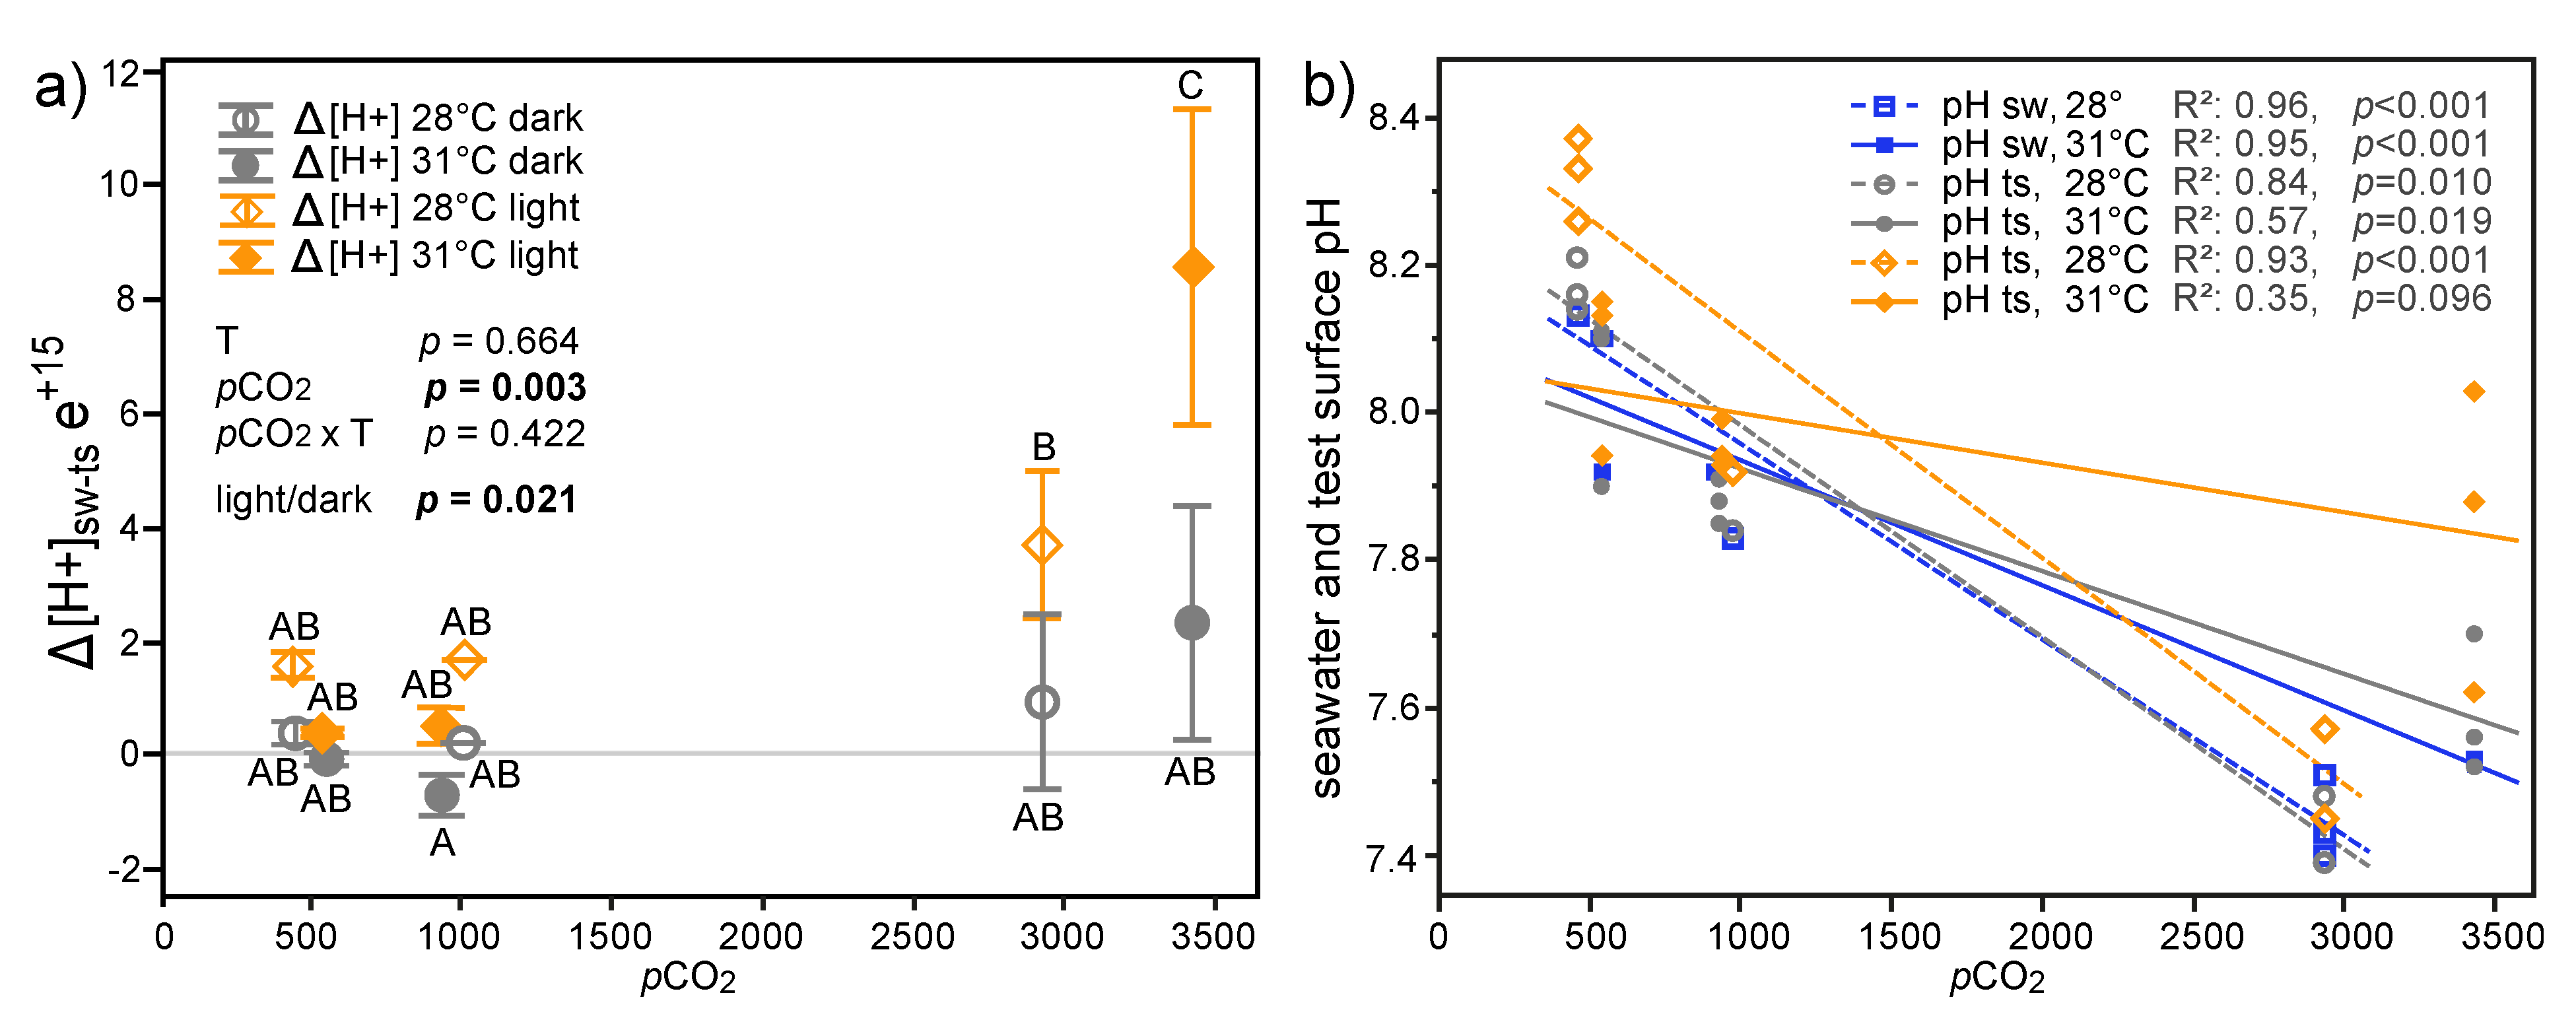
2.3.1. Microelectrode Measurements

Microsensors are commonly used to characterize the DBL that exists between the surface of an organism and the surrounding seawater (e.g., [7,12,66,67]). Among foraminifera, oxygen and pH gradients of the DBL reflect photosynthesis, respiration, and biomineralization activity [12,13,14]. To investigate the DBL of LBF, liquid ion exchange (LIX) pH microelectrodes were fabricated in the de Beer laboratory (Max Planck Institute for Marine Microbiology, Bremen). Microsensors were produced following de Beer et al. [68], but were filled with hydrogen ionophore II cocktails A and B (Sigma-Aldrich, Darmstadt, Germany), with cocktail B having an epoxy added to it to prevent leakage of the ionophore out of the sensor. Microelectrode measurements were performed in two reservoirs of seawater, sourced from the corresponding experimental treatment tanks, located adjacent to the experimental tanks and the microelectrode system. These reservoirs were bubbled with the corresponding treatment gases and maintained at the corresponding treatment temperature using 125-watt aquarium heaters (EHEIM, 2015), mimicking the respective treatment conditions in the experimental aquaria. The seawater was circulated between the two reservoirs through two 5.4 L flow-through chambers (30 × 12 × 15 cm). All pH microelectrode measurements were performed within these smaller flow-through chambers, with gentle water movement maintained with a small powerhead (12 V Tarwig). Following the methods of Glas et al. [12], single specimens were carefully removed from the experimental culturing setup and placed on the bottom of aquaria. LIX membrane microelectrodes (8–20 µm tip diameter, ≤ 20 s response time) connected to a high-impedance mV meter were mounted on a motorized micromanipulator (Micos VT-80). Prior to measurements, the microelectrodes were prepared and calibrated in pH buffer solutions (Mettler Toledo, pHNBS 7.0 and 9.21) at treatment temperature, following de Beer et al. [68]. Microelectrode tips were positioned on the LBF test surface. Exact positioning of the specimen and the microsensor tip was achieved using a Stemi SV6 binocular (Zeiss, Oberkochen, Germany).
To determine the effects of photosynthesis and respiration on the pH microenvironment under the different pCO2 and temperature treatments, the gradient in pH away from the test surface was measured in three specimens per treatment. The foraminifera were allowed to acclimate to the conditions and recover from handling for five min before initiating pH measurements. Measurements were first conducted under light until a stable signal was reached, after which the light was turned off. When pH at the test surface reached a constant level, the light was turned on again and measurement was continued until a stable measurement was reached. This was followed by moving the microelectrode along a 1000-µm vertical profile away from the LBF test surface. A step size of 1 µm was used for the first 100 µm in order to generate high-spatial-resolution pH profiles within the DBL at the surface of the test. After this, step size was increased to 20 µm in order to characterize pH of the seawater adjacent to the DBL. Between measurements, a fine brush was gently applied to the LBF to prevent it from articulating and moving away from the sensor. The difference in [H+] between the DBL (immediately adjacent to test surface) and the seawater (‘∆[H+]’) was calculated as an indicator of the specimen’s mitigation of the acidified conditions.

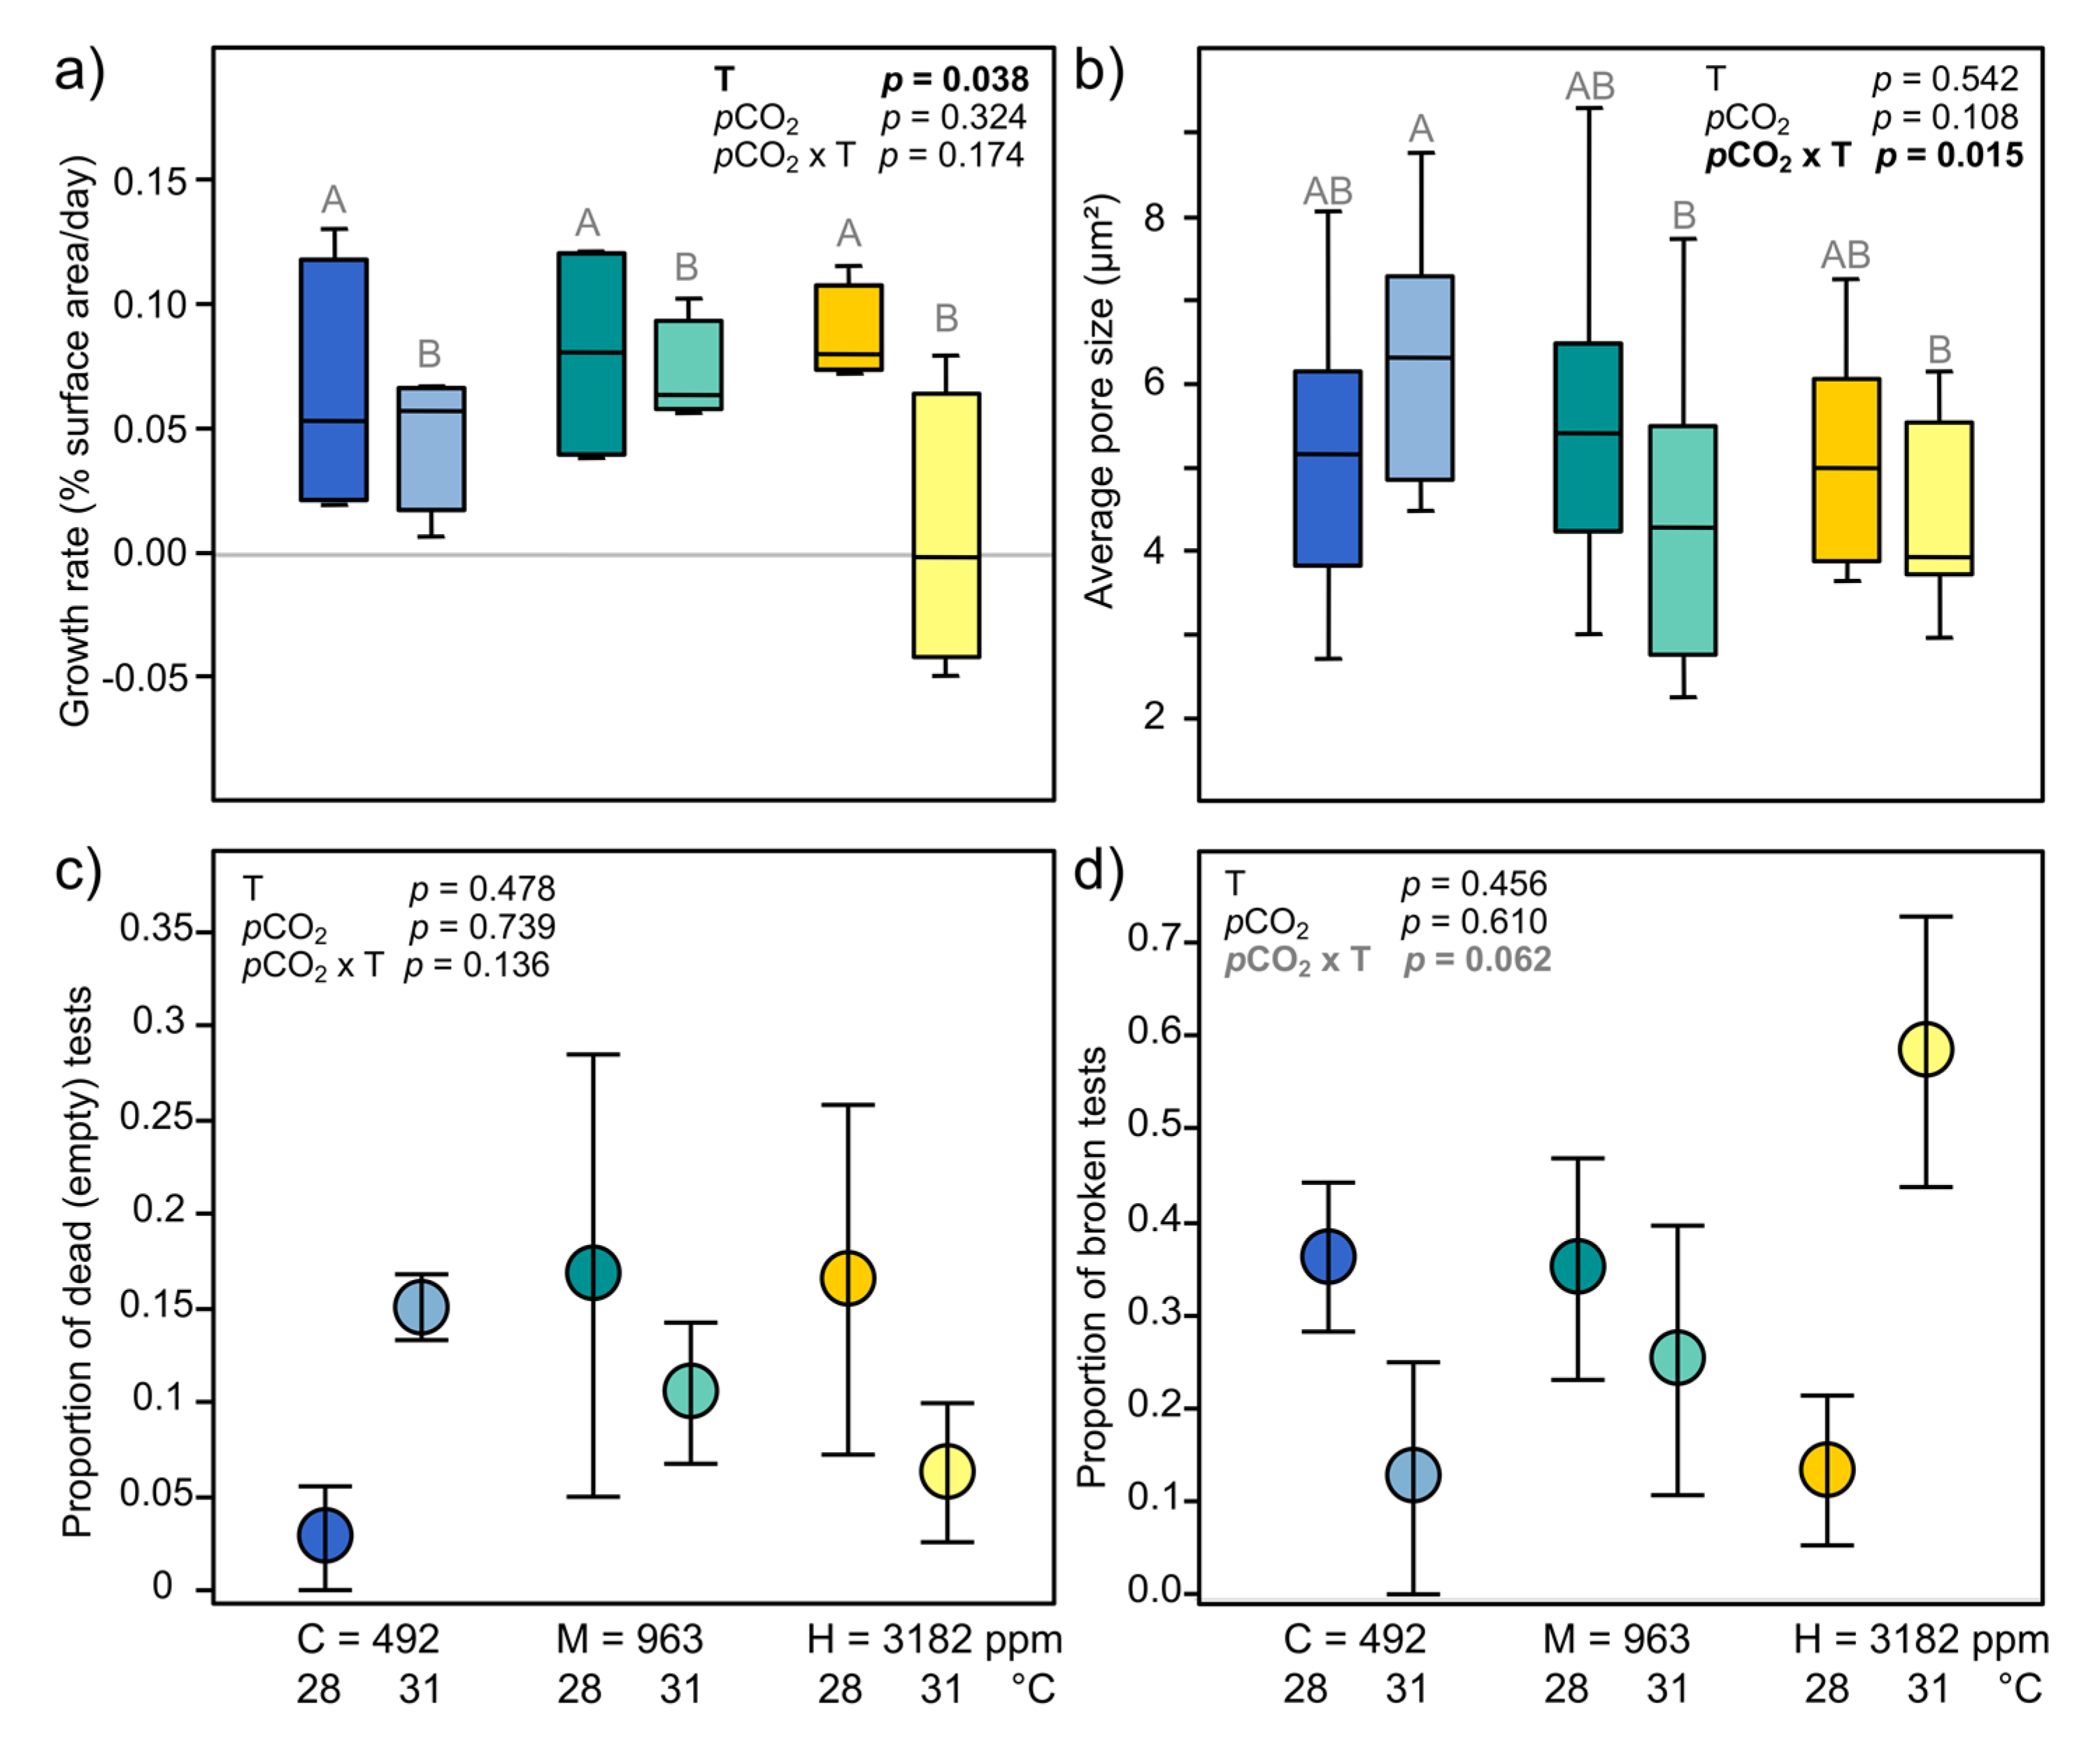
2.3.2. Holobiont Mortality and Growth

At the end of the 8-week experiment, the proportions of live-to-dead specimens in each treatment were recorded. Empty tests, determined by lack of cytoplasmic color and reticulopodial activity [69], indicate either stress-related death, natural death (old age), or reproduction in which the host’s cytoplasm undergoes either asexual or sexual, leading to the release of hundreds of juvenile cells into the environment. Based on test size homogeneity, it is assumed all specimens used were from the same cohort. Additionally, there was no evidence of reproduction throughout the experimental period (i.e., no juvenile cells). Therefore, the occurrence of empty tests is assumed most likely to be due to a response to stress resulting in mortality. Mortality rate was calculated as a percentage of all specimens (n = 195) from each treatment.
A subset of LBF from each treatment (n = 4 replicates per treatment) was photographed with a digital light microscope (VHX-5000, Keyence, Neu-Isenburg, Germany) using fixed settings immediately before and after the experiment (as described in Stuhr et al. [23]). The surface areas of all specimens were determined with the image analysis software Fiji [70]. Growth was calculated as the average daily increase in cross-sectional surface area of all specimens from each sample over the eight-week experimental period following ter Kuile and Erez [54].

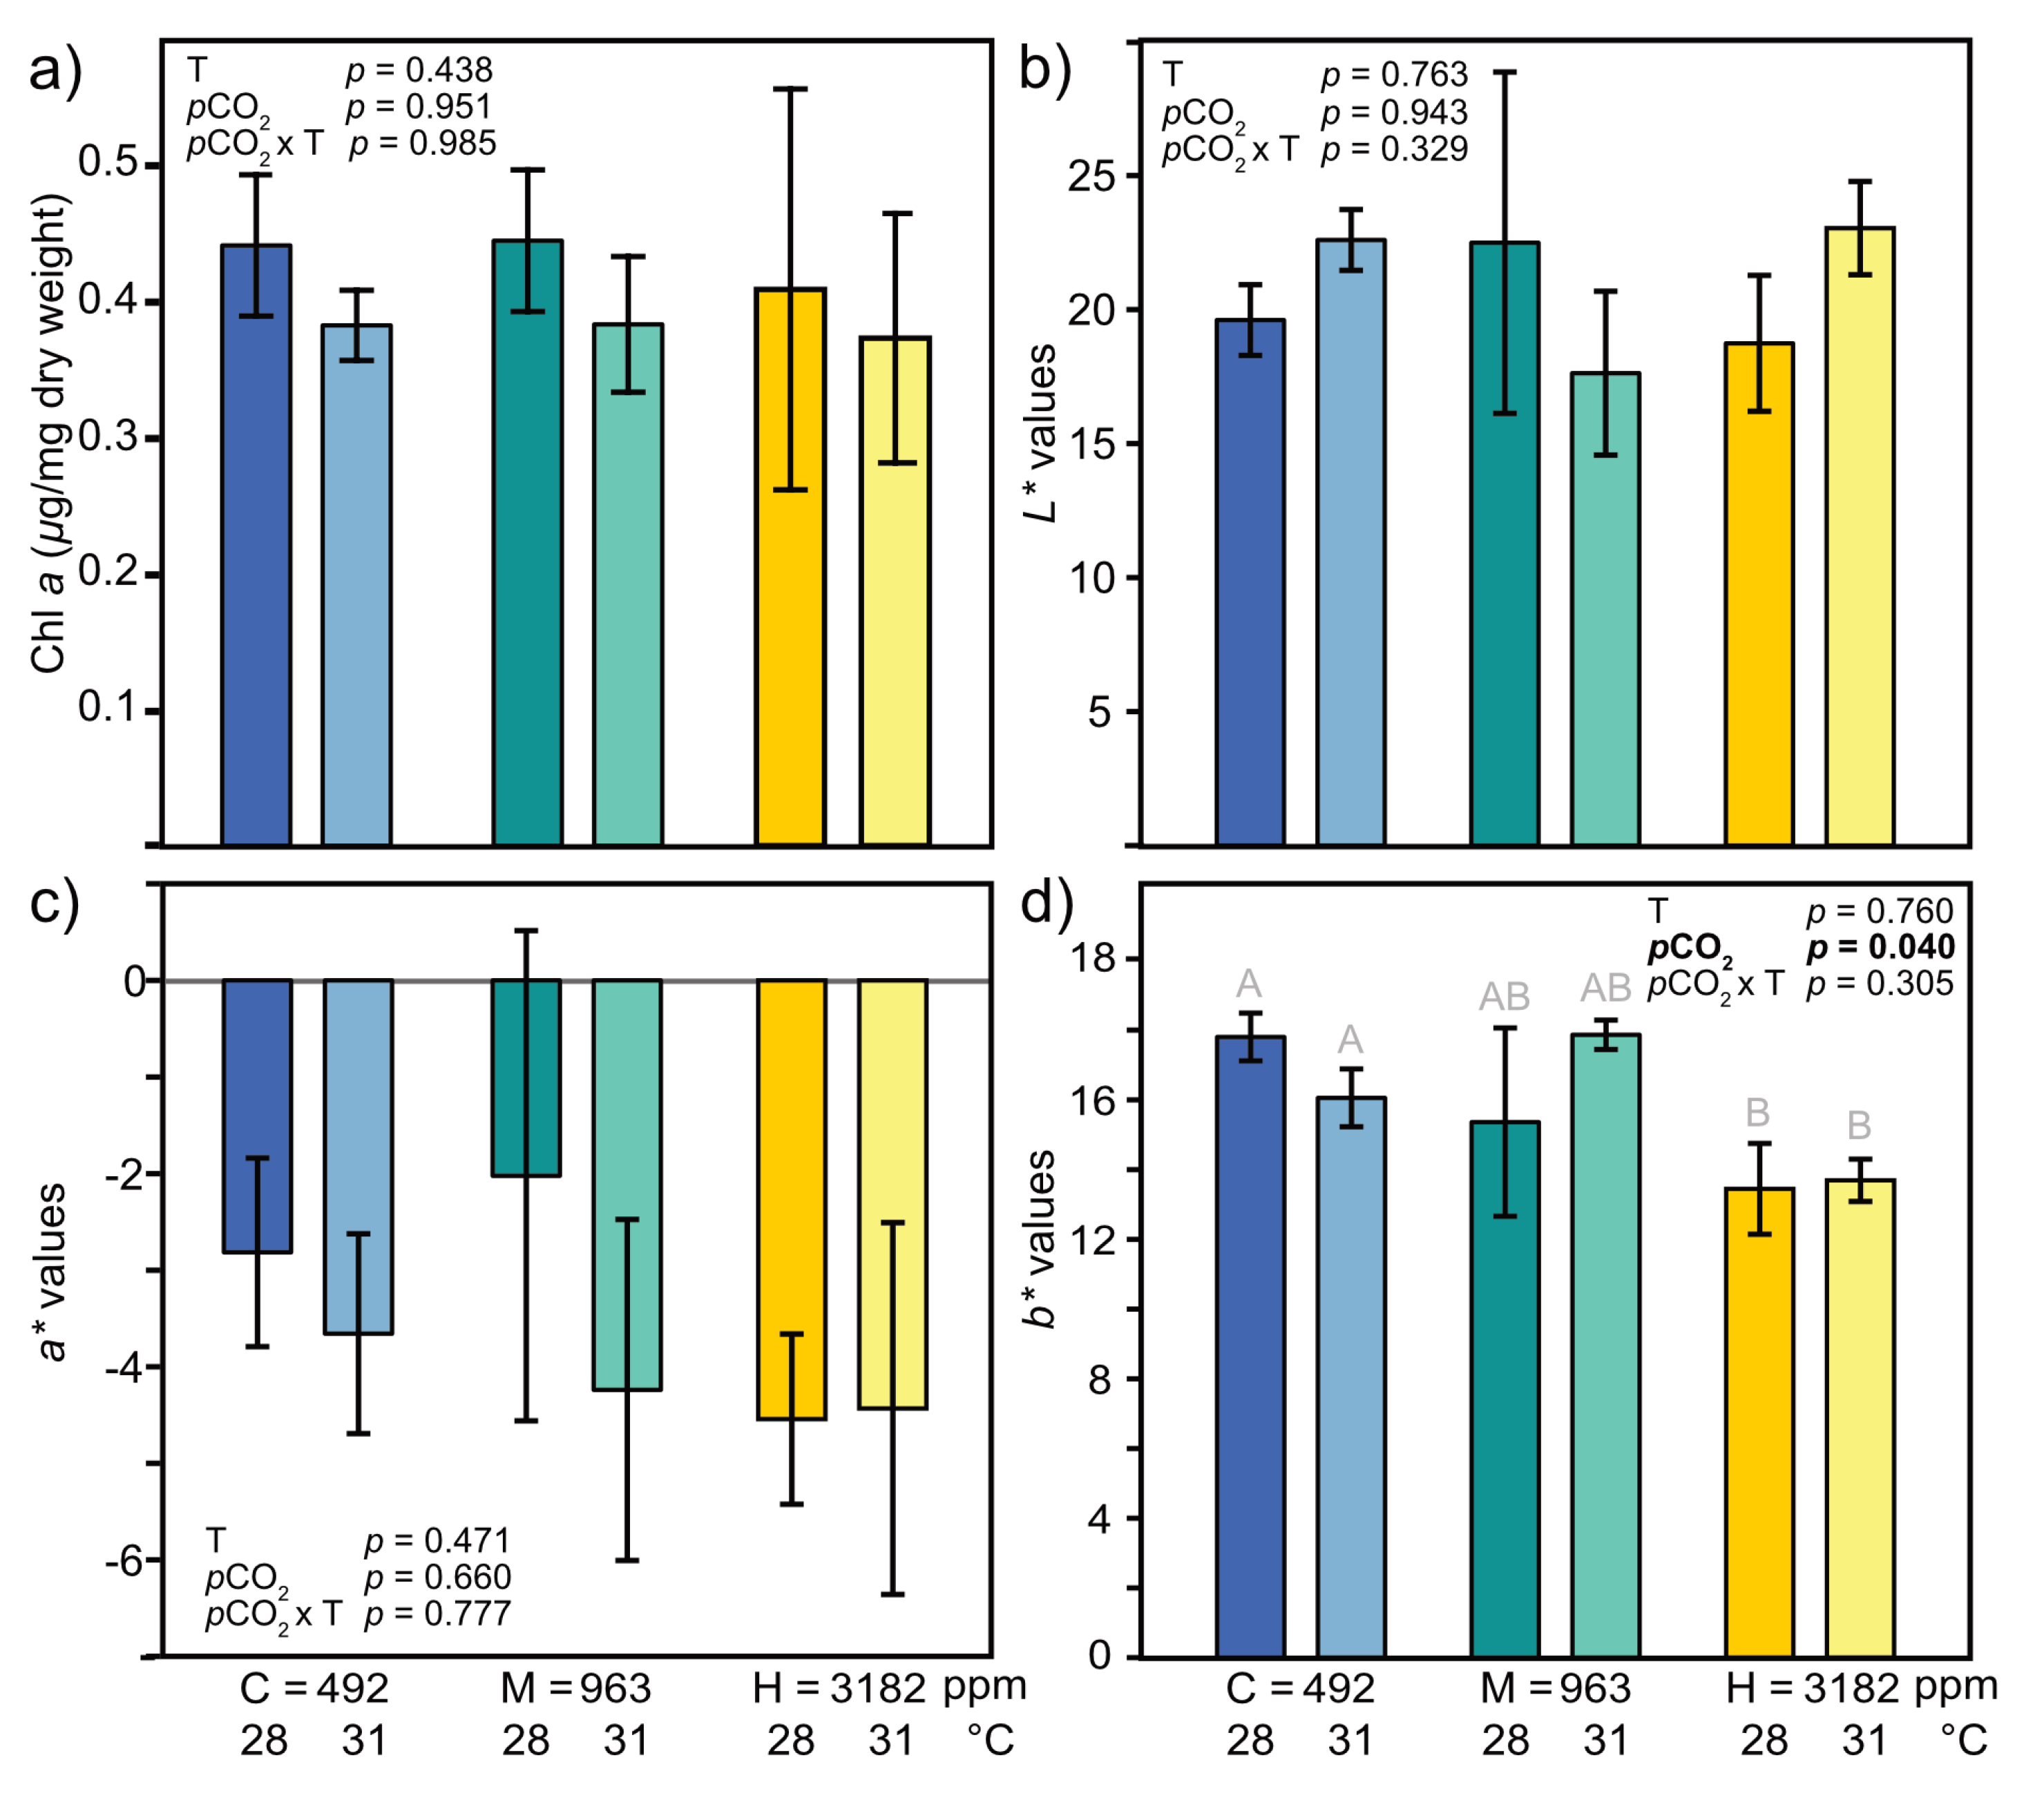
2.3.3. Color and Chlorophyll a

Holobiont color, as a proxy for photophysiological condition, was determined using the International Commission on Illumination (CIE) L*a*b* color space values of each specimen following Hosono et al. (2012) [71]. In each image, holobiont color and background color were transformed into CIE L*a*b* color space by using the color space converter in Fiji [72], as described in Stuhr et al. [23]. The resulting color values represent the three coordinates within the CIE color space: L* indicates whiteness (brightness) of the color (0 = black, 100 = white) and was shown to correlate to photosynthetic performance as measured via oxygen production rate [71], while a* indicates the position between green (negative values) and magenta (positive values), and b* indicates the position between blue (negative values) and yellow (positive values), serving as indicators for photopigment content. A total of 175 specimens (i.e., those that were alive at the end of the experiment) were used for color measurements.
Chl a concentration was analyzed as a proxy of photosymbiont biomass, adapted from established protocols [32]. Single specimens from three randomly chosen tanks from each treatment, which were also used for microelectrode measurements (n = 3 per treatment), were each placed into 320 µL of 90% ethanol to extract pigment, heated to 78 °C for 5 min, vortexed, and extracted in the dark for 24 h at 4 °C. Then 300 µL of the extraction liquid was measured at absorbances of 630, 663, and 750 nm using a microplate reader (Tecan infinite M200 PRO). After extraction, specimens were dried at 40 °C for 24 h and weighed with an analytical balance (Mettler Toledo MX5). Chl a concentrations were calculated following the method of Jeffrey and Humphrey (1975) and normalized to dried test weight [23]. The same procedure was repeated with the remaining specimens (n = 1–4 per replicate tank/7–10 per treatment) to ensure that the single specimens selected for microelectrode measurements represent the average photosymbiont condition of their respective treatment. The results of prior total chl a contents were added to the respective replicates of these measurements and normalized by their collective dry weight to calculate average chl a concentrations.

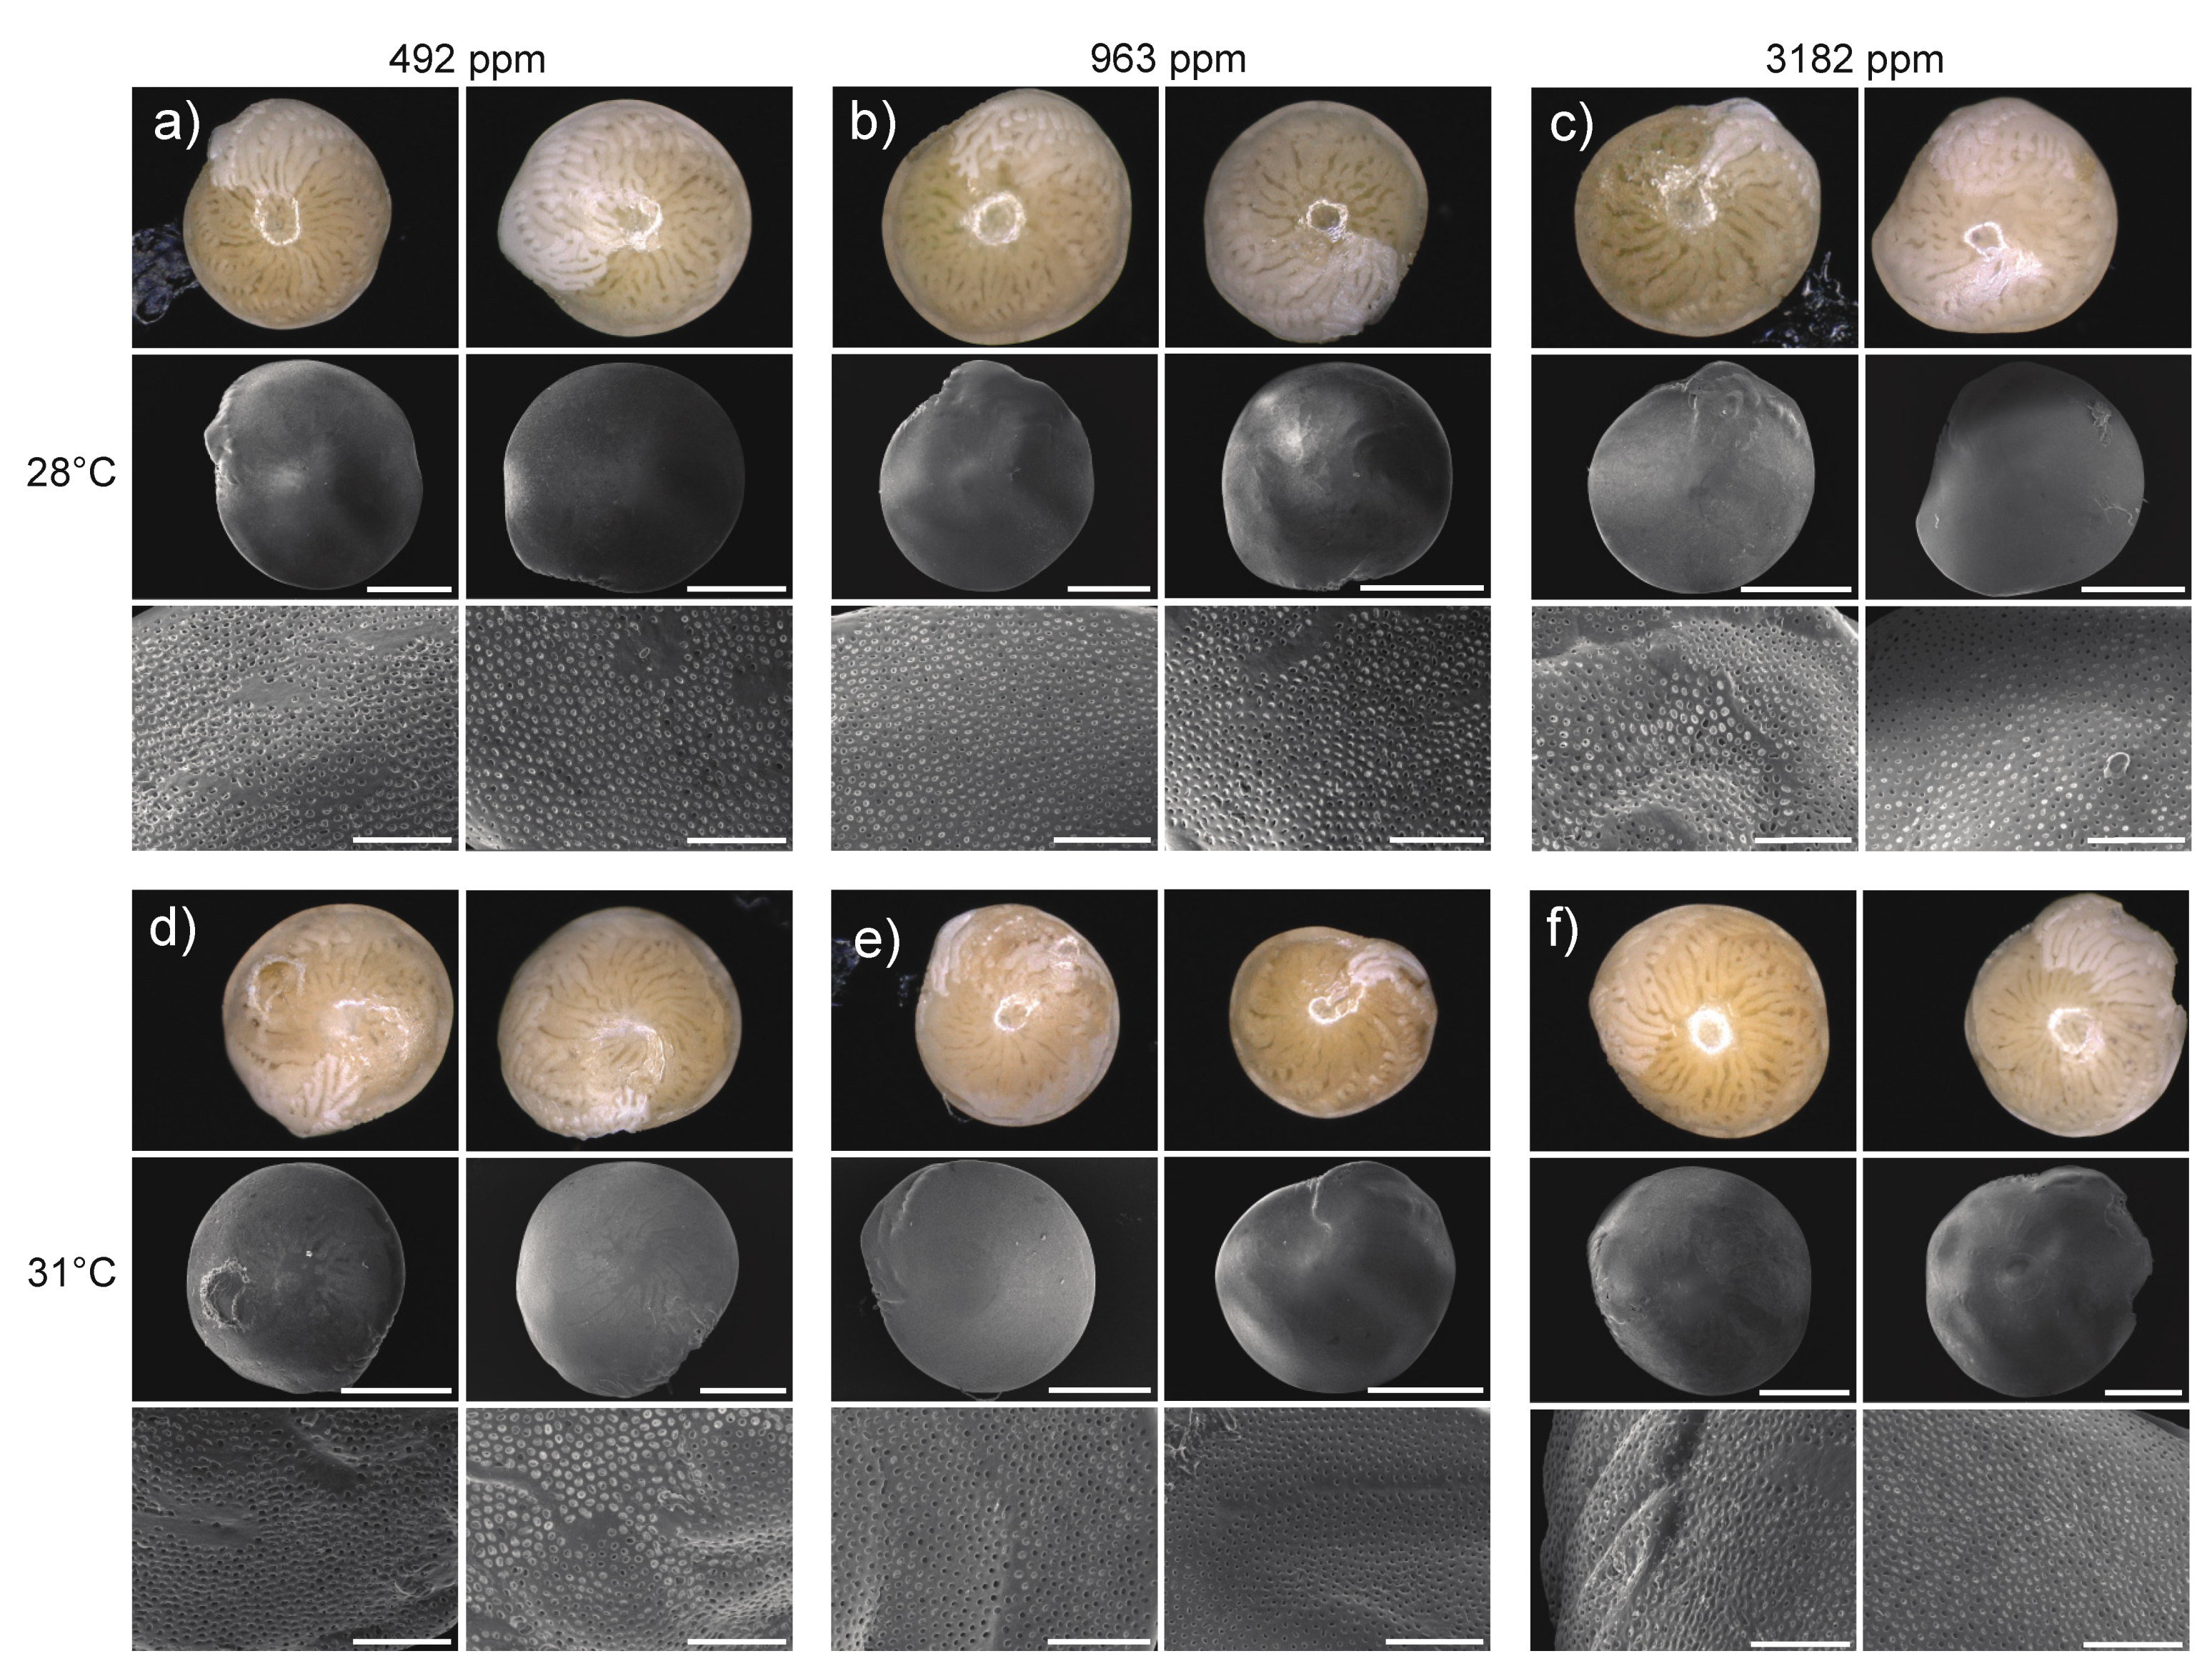
2.3.4. Test Surface, Pore Size and Breakage

Images of all remaining LBF ‘tests’ were made by scanning electron microscopy (SEM) to detect dissolution or other alteration of the test surface. The dried samples were mounted on conductive carbon discs attached to specimen stubs and sputter-coated with gold for 35 sec under vacuum. Images of the surface morphology of the mounted specimens were made by secondary electron (SE) microscopy (Tescan VEGA3 XMU), initially at the highest magnification that maintained the entire test in the SEM’s field of view, and then at ~2250-fold magnification. As Amphistegina add a new layer of calcite to their entire test surface during chamber addition (growth), these high magnification images revealed the newest growth of each specimen. Dissolution of each specimen’s test surface was assessed visually by comparison with tests formed under the control condition and also by comparison with images of LBF reference samples that were cultured under control conditions. Representative sets of images were assembled for each treatment. Changes in test microstructure were quantitatively assessed by comparing average pore sizes determined in SE images (n = 72) using the function ‘Analyze particles’ in ImageJ (Version 1.52 f; method modified from [73]). The occurrence of partial test breakage visible in SE images, possibly induced during handling, was counted and its percentage in each treatment was calculated.

2.3.5. Statistics

Permutational multivariate analyses of variance (PERMANOVA) were conducted on all ∆[H+] data, using PAST 4.04. Two-way analysis was used for the fixed effects of pCO2 and T, and a one-way analysis for the fixed effect of light (vs. dark). This was followed by pairwise comparison of ∆[H+] data amongst treatments, with p-values adjusted for multiple testing following Benjamini and Hochberg [74] at a false-discovery-rate (FDR) q-threshold of 0.1. For statistical analyses of physiological parameters, residual and normality plots indicated that assumptions of equal group variance and normality were not violated for chl a concentrations, L*a*b* values, growth rates, or pore sizes, and the Shapiro-Wilk test was used to confirm normal distribution of these data. Changes in these parameters under the respective fixed factors T and pCO2, or their interaction, were analyzed using linear models for two-factorial analysis of variance (ANOVA). In cases where the linear model indicated significant effects of either of the factors, or a significant interaction between the factors, a posthoc Tukeys’ Honest Significant Difference (HSD) test was conducted. For the binary mortality (dead) and breakage data, a nominal logistic model was used with the fixed factors T and pCO2 or their interaction. All analyses of physiological parameters were conducted in JMP Pro 14.3.0.

2.4. Identification of Photosymbionts

LBF are known to harbor a wide range of microalgae. To identify the dominant photosymbiont species in the A. lobifera population from Eilat, a 442-base pairs (bp) fragment of the 3′ end of the 18S rDNA was extracted from six specimens, amplified, and sequenced as described in Stuhr et al. [35]. The resulting diatom sequences were deposited at European Nucleotide Archive (ENA) under the study accession number PRJEB33832. Sanger sequences were trimmed and assembled using Geneious 8.1.9. All resulting consensus sequences were identified via BLASTn [75] searches using the default settings for highly similar sequences (megablast) against the NCBI database (accessed December 2018) and several representative sequences (with an e-value below 1 × 10−166) were manually selected from the results. These sequences were complemented with foraminifera symbiont sequences from [22,35], and other closely related algae formerly reported as photosymbionts in LBF (e.g., in Lee et al. [50]). The collected sequences were aligned using MAFFT v7.310 [76] with the default options and trimmed to equal length at the 3’ and 5’ prime end in BioEdit [77]. Subsequently, identical sequences were removed using Alter [78] and the collapse haplotypes command. The final 407-bp alignment was used to calculate a Maximum Likelihood phylogenetic tree based on the GTR model with gamma distribution and 1000 bootstrap replicates in Mega 6.06 [79]. The final tree is shown with a 50% bootstrap cut-off (Figure S1).

2.5. Proteomics

2.5.1. Label-Free Peptide Quantification and Protein Identification

To gain insight into the underlying cellular responses of the photosymbionts and the host foraminifera, a label-free quantitative proteomics approach based on liquid chromatography coupled to tandem mass-spectrometry was applied, as described in Stuhr et al. [49] and provided in Appendix A. At the end of the experiment, eight or nine pooled specimens from three replicate tanks for each treatment (i.e., > 144 specimens in total) were frozen at −80 °C and used for the proteomics analysis. As three out of the initial four biological replicate samples from the control treatment (control pCO2 and 28 °C = ‘C28’) were damaged during sample preparation due to defective laboratory equipment, this treatment had to be removed from further statistical analysis. However, technical replicates of the remaining C28 sample, as well as biological replicates from samples that were collected before the temperature ramping of the experiment (t0), were measured. These data are provided along with all final treatment data in the ProteomeXchange Consortium via the PRIDE partner repository [80] (dataset identifier PXD009890).
A homology-based search approach allowed peptide sequences to be assigned to either the host or photosymbiont component and identified at the protein level. An updated and enlarged reference dataset for foraminifera, containing the recently published genome sequences of the calcareous benthic foraminifera Globobulimina [81] was used, combined with the publicly available genome data of three diatom species used previously [49]. Clusters of homologous protein sequences were generated from amino acid sequences of all proteins identified in the database search with a sequence identity cut-off of 0.7. Normalized abundance values of the peptides were used to calculate protein cluster abundances. Subsequently, protein descriptions and gene ontology (GO) annotation were obtained via eggNOG-mapper v2 [82,83] using default settings (minimum hit e-value = 0.001, minimum hit bit-score = 60, minimum% of query coverage = 20).

2.5.2. Differential Protein Abundance and Functional Annotations

To identify proteins with significantly different abundances between the treatments, multivariate analyses with post hoc identifications were conducted in R 4.0.0. [84], adapting procedures of proteomics studies on anemones [85,86]. To aid in parametric model-fitting, data were log-transformed, and Bray-Curtis dissimilarities were calculated for each pairwise sample comparison to identify the differentially abundant protein-clusters. Analysis of variance by permutation of dissimilarities was conducted using the “adonis” function in the R package “vegan” version 2.5-6 [87]. First, a PERMANOVA, with fixed effects of pCO2, T, and their interaction, was conducted on log-transformed normalized abundance values of all proteins, only host-associated proteins, and only photosymbiont-associated proteins. This was followed by pairwise comparisons for significant differences using the “pairwise.perm.manova” function in the R package “RVAideMemoire” [88], with p-values adjusted for multiple testing at a FDR of 0.05 [74]. All PERMANOVAs used 9999 permutations. Then, a generalized linear model (GLM) with fixed effect treatments was fitted and compared against a null model (intercept only) using an analysis of deviance χ2 test with α = 0.05. Differentially abundant proteins (DAPs) were identified with the FDR procedure [74] at a q-threshold of 0.05, correcting for multiple testing. The corresponding log2 fold-changes (log2FC) were derived from average normalized abundance values between treatments.
Further descriptions of DAPs were extracted via OmicsBox 1.3.11 (BioBam Bioinformatics, 2019) by searching via the blast program blastp-fast against all organisms deposited in the public NCBI non-redundant protein sequence database on 9 July 2020 (e-value-hit-filter: 0.001, annotation cut-off: 55, HSP length cut-off: 33, number of hits: 20). Any proteins without a match were designated as hypothetical proteins. For proteins without description in the non-redundant NCBI database, those given by the Swiss-Prot database or eggNOG annotations were used, if available. DAPs were grouped by major functional categories inferred from GO term annotations describing molecular functions, biological processes, and cellular components, though it should be noted that most of them can function in multiple ways and are not restricted to these categories.
A Fisher’s Exact test was conducted to determine whether DAP frequencies differed between host and photosymbionts, and multivariate analyses of log-transformed abundance values of DAPs in JMP Pro 14.3.0. Hierarchical cluster analyses of proteins and samples or treatments, using average distance linkage, as well as principal component analysis (PCA) on row-wise correlations, were performed. Further PCAs were run on total normalized abundance values of each functional category of host- or photosymbiont-associated DAPs. To further focus on those most ‘regulated’ proteins that varied significantly in abundance between treatments and also showed pronounced fold-changes, only DAPs with log2FC ≥|1| between those treatments with Tukeys’ p ≤ 0.05 were extracted and highlighted.

3. Results

3.1. Physicochemical Parameters of Seawater Treatments

A summary of the measured aquarium seawater parameters T, DIC, TA, calculated seawater pH on seawater-scale (pHSW), calcite (ΩC) and aragonite saturation states (ΩA) of the treatment seawater, and pCO2 of gas in equilibrium with seawater are provided in Table 1. Salinity and carbonate ion concentrations are found in the supplementary material (Table S1). In all treatments, temperature was maintained at either 28 ± 0.2 °C (± indicates SD) or 30.9 ± 0.3 °C, salinity stayed at 35.6 ± 0.6, and seawater remained supersaturated with respect to aragonite (ΩA > 1) and calcite (ΩC > 1). Calculated pHSW of the experimental treatments was 8.16 ± 0.11, 7.97 ± 0.07, and 7.50 ± 0.11 in the control (491 ppm), moderate (963 ppm), and high (3192 ppm) pCO2 treatments, respectively.

3.2. Identification of Photosymbionts

The photosymbiont sequences recovered from these A. lobifera represent previously non-sequenced taxa, but phylogenetic analysis as well as BLAST searches confirm that the photosymbionts are a member of the same diatom assemblage as described previously from A. lobifera and other amphisteginids [22,35,52,89]. Molecular fingerprinting of symbionts in the present study revealed that the directly sequenced A. lobifera specimens (n = 6) contained six slightly variable haplotypes (Figure S1) clustering closely with sequences from A. lobifera photosymbionts, collected from the Red and the Mediterranean Sea [22], within the order Fragilariales.

3.3. Physiological Assessments of Holobiont and Photosymbiont Condition

3.3.1. Microelectrode Measurements

Microsensor measurements showed that pH at the test surface (pHts) decreased with increasing pCO2 under all light/temperature conditions (Figure 1b). Furthermore, the difference in proton concentration between seawater and test surface (∆[H+] = [H+]sw − [H+]ts) significantly affected by pCO2 (PERMANOVA p = 0.003, Table S3; Figure 1a). Furthermore, there was a significant effect of light/dark condition on ∆[H+] (p = 0.021). Pairwise comparison of all ∆[H+] revealed a significantly higher ∆[H+] at high-pCO2×31 °C under light (photosynthesis) compared to all other treatments (adjusted p ≤ 0.062), and at high-pCO2×28 °C under light compared to moderate-pCO2×31 °C under dark (respiration) condition (adjusted p ≤ 0.096). Hence, at high-pCO2, these isolated effects indicated an increase in ∆[H+] with light and temperature. The most-elevated pH at the test surface in comparison to the surrounding water was consequently found at high-pCO2×31 °C under light (Figure 1b).

3.3.2. Color and Chlorophyll a

There was no interactive effect of pCO2 and T on L*, a*, or b* values, nor on chl a concentration (Figure 2, Table S4). However, there was a significant effect of pCO2 on b* (ANOVA p = 0.040, Figure 2d). Post-hoc tests suggest a marginally significant (Tukeys’ p = 0.053) color shift from yellower to bluer tones at high-pCO2 compared to control-pCO2 regardless of temperature.

3.3.3. Holobiont Mortality and Growth

Holobiont mortality remained low throughout the experiment ranging between 2.9% in the control (28 °C, 492 ppm) and 15.2% at control-pCO2×31 °C (Figure 3c). There was no significant effect of pCO2 or T on mortality rates throughout the experiment (p ≥ 0.136; Table S2). There was no interactive effect of pCO2 and T (p = 0.174) on test growth, however, there was a significant reduction in growth under elevated T (p = 0.038, Table S4, Figure 3a).

3.3.4. Test Surface, Pore Size and Breakage

No apparent treatment-dependent alterations of test surfaces, such as signs of corrosion, were observed (Figure 4). The frequency of partially broken tests recorded in SE images (Figure 3d) was not significantly impacted by any treatment (p = 0.456, 0.610, and 0.062 for T, pCO2, and pCO2×T, respectively; Table S2). However, the p-value for the interaction term is marginally significant (defined as 0.05 < p < 0.07), suggesting a possible interaction between pCO2 and temperature on breakage frequency.
Mean pore size was significantly impacted by the interaction of pCO2×T (p = 0.015, Figure 2 and Figure 3b). Tukeys’ HSD post-hoc analysis shows that at 31 °C, under moderate and high pCO2, pore size was significantly reduced when compared to control-pCO2 conditions (Tukeys’ p = 0.030 and p = 0.040, respectively; Table S4).

3.4. Proteomics

3.4.1. Label-Free Peptide Quantification and Protein Identification

A total of 1103 protein clusters (i.e., groups of proteins with ≥ 70% sequence identity) were detected and identified from A. lobifera and its photosymbiotic diatoms (Table S5). Fifteen of these clusters were comprised of specific protein sequences belonging to tubulins, actin, heat shock proteins (HSPs), and peptidyl-prolyl cis-trans isomerase, from both the host and photosymbionts. Approximately 40% of the protein clusters (hereafter referred to as ‘proteins’) were assigned to the photosymbionts, whereas 60% were associated with the host foraminifera (Figure 5a). The relative proportion of host and symbiont proteins was relatively stable across treatments. The only successfully recovered sample from the control treatment (control-pCO2×28 °C) was removed from further analyses due to the lack of replication.
Permutational multivariate analyses of variance conducted on all proteins, as well as only those associated with either host or photosymbionts, all indicated significant single effects of pCO2 or T (2-way PERMANOVA, p = 0.030 and 0.018, respectively, Table 2) and no interactive effects. However, adjusted p-values of post-hoc pairwise comparisons were non-significant. Nevertheless, the effect of T was overall more significant than the effect of pCO2, especially for the photosymbionts.

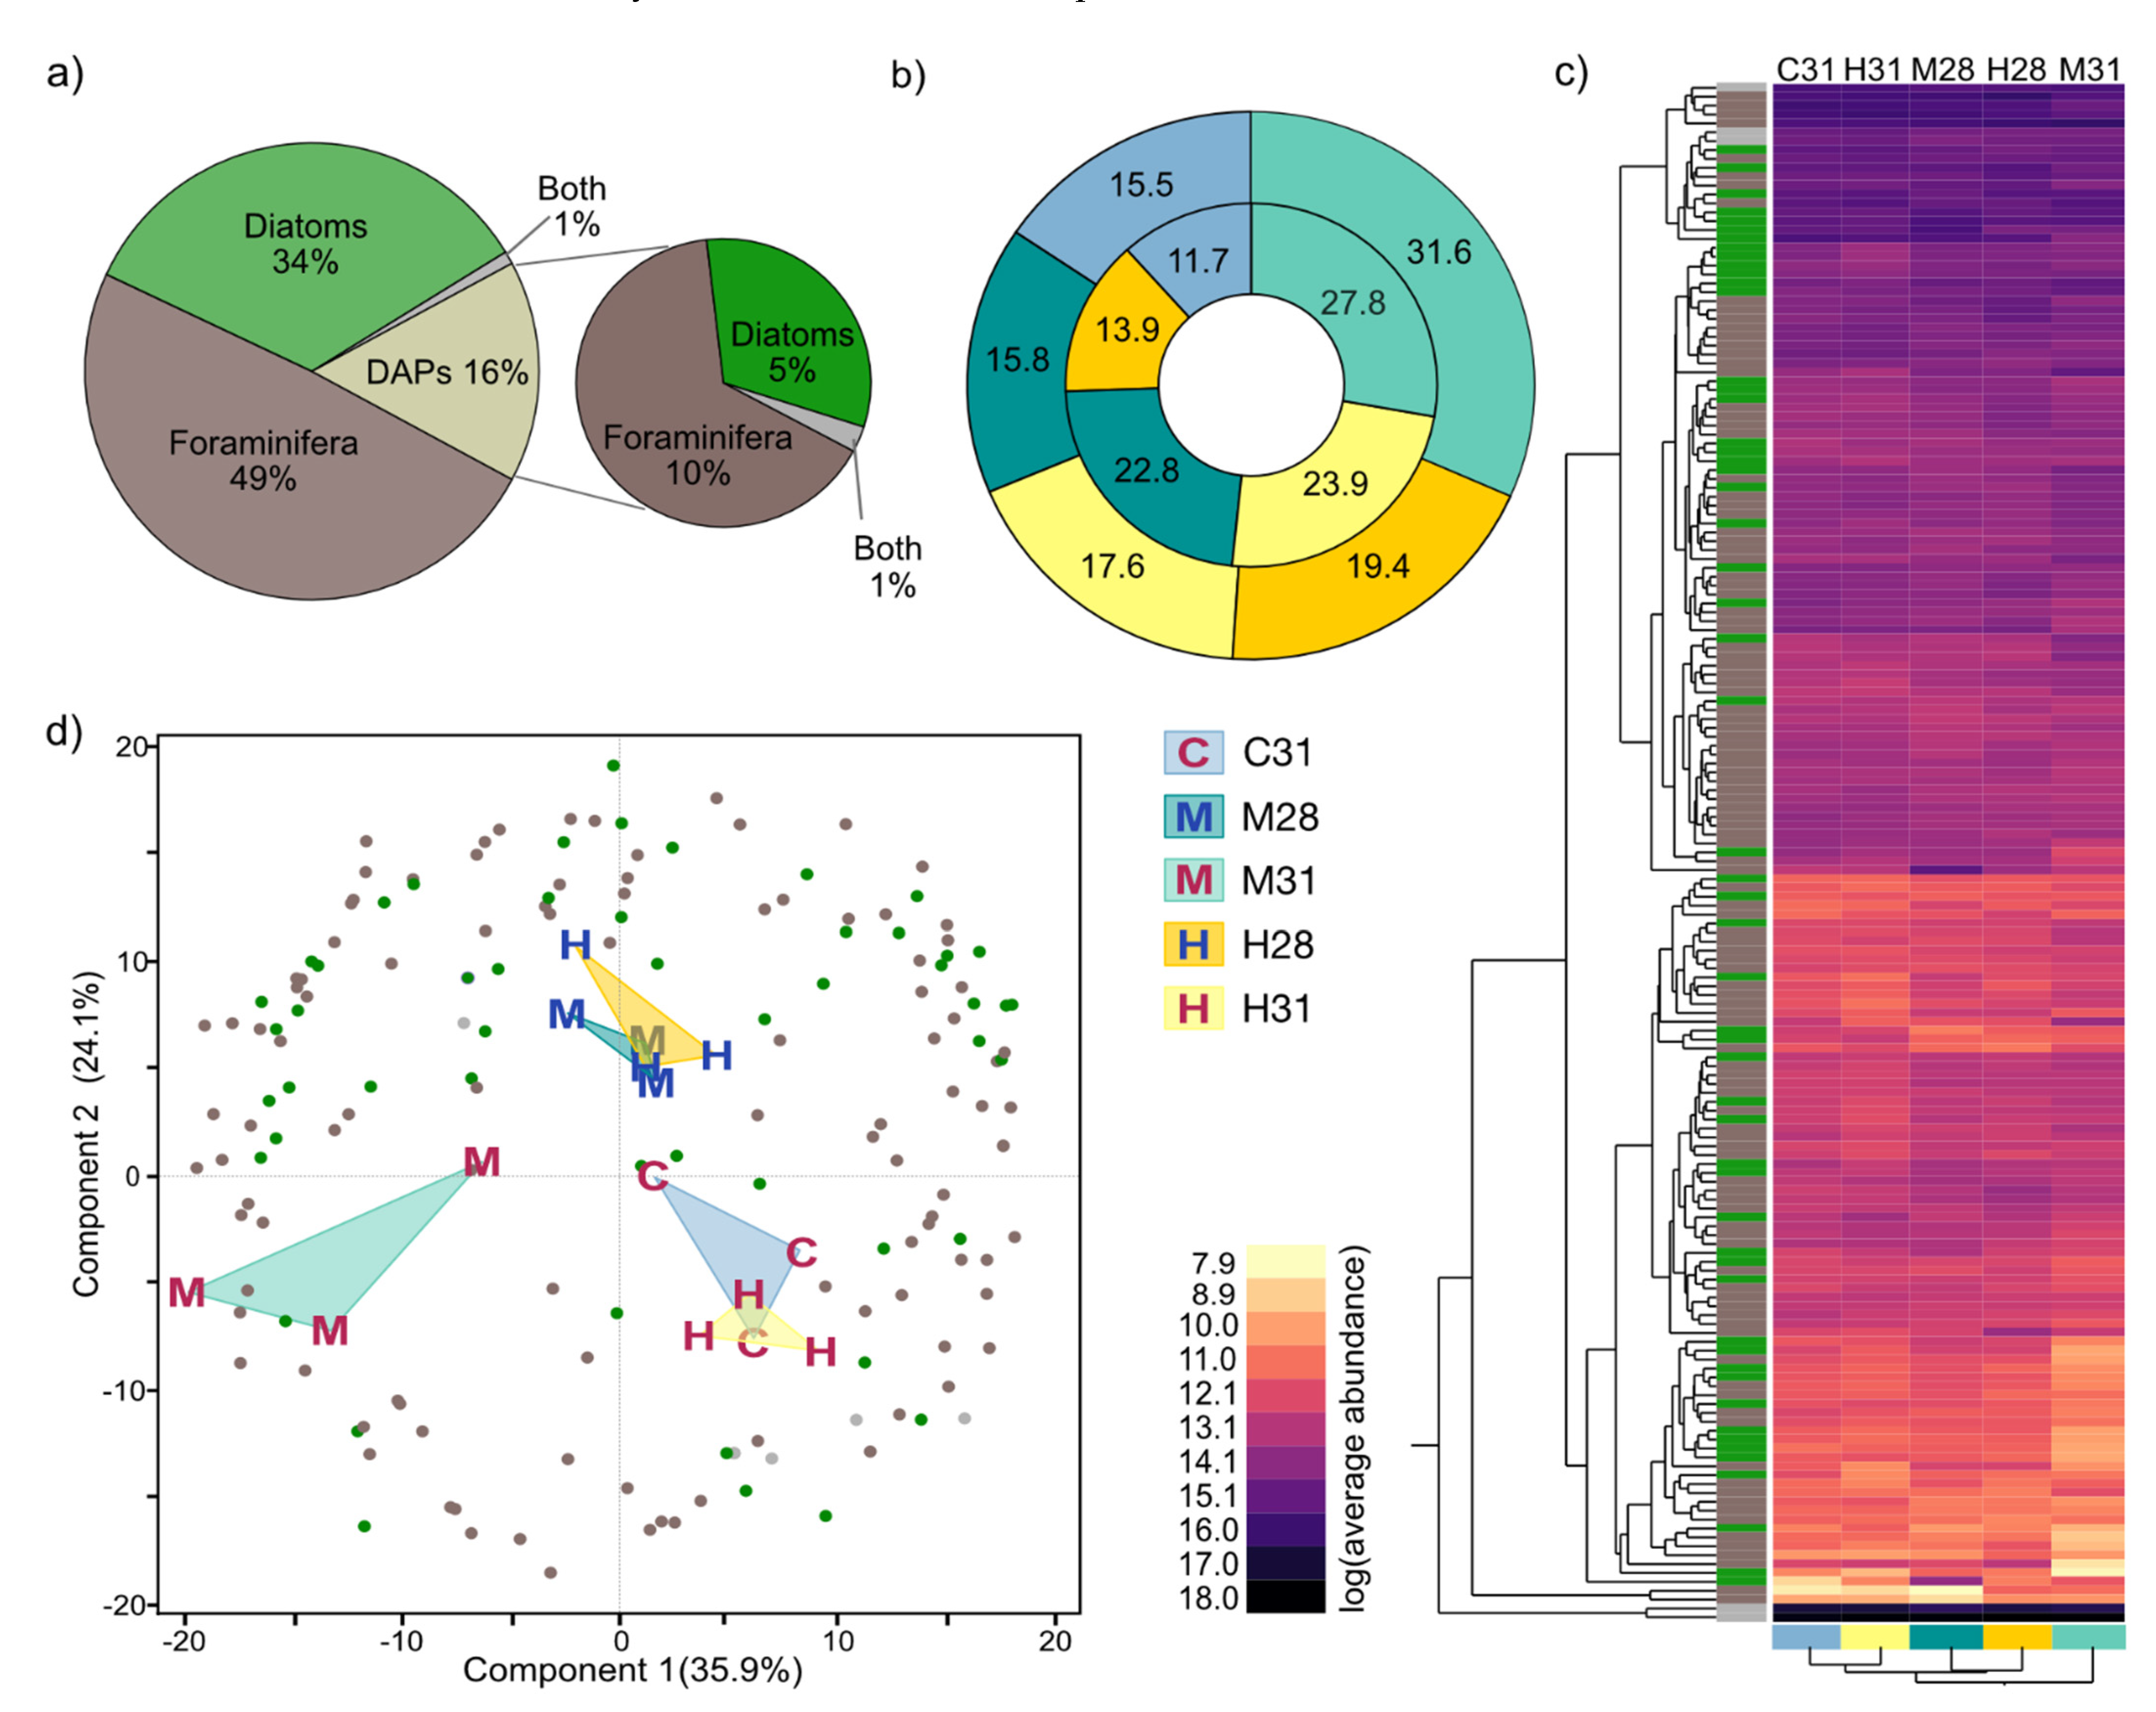
3.4.2. Differential Abundant Protein (DAP) Distribution in Treatments and Compartments

We employed a GLM using the five remaining ‘treatment’ combinations as single factors to detect significant differences in protein abundance. In total, 173 proteins were significantly differently abundant between treatments (q < 0.05, Table S6). Of these DAPs, 55 were from the symbiont, 113 were from the host, and 5 were assigned to both (Figure 5a). Hence, the proportion of differentially abundant host proteins was significantly higher than that of photosymbiont proteins (2-tailed Fisher’s exact test, p = 0.049). Most significant differences were found between moderate-pCO2×31 °C in contrast to all other treatments in both compartments, and least at control-pCO2×31 °C (Figure 5b, Table S7). Second highest percentage of DAPs in the host was found in response to high-pCO2×°C, while it was comparably low in the photosymbionts, where high-pCO2×31 caused the second most DAPs.
Multivariate analyses of all DAPs confirmed this distinction of the moderate-pCO2×31 °C treatment, and further illustrated high similarities among protein abundance patterns of control-pCO2×31 °C and high-pCO2×31 °C treatments, as well as moderate-pCO2×28 °C and high-pCO2×28 °C treatments (Figure 5c). The strong overlap between samples of these treatments led to partial clustering of alike samples (Figure S2). However, the distinction of moderate-pCO2×31 °C from all other treatments and the otherwise main grouping by temperature were evident throughout, as well as when host and photosymbiont DAPs were analyzed separately (Figures S3 and S4). Principal component analysis (PCA) showed that 35.9% of overall variations were explained by the differentiation along the x-axis, which mainly differentiated moderate-pCO2×31 °C from all other treatments, while 24.1% were explained by the separation of temperature treatment groups along the y-axis (Figure 5d). In moderate-pCO2×31 °C, most proteins were less abundant, but those clustering close to this treatment were highly abundant and mostly host-associated. The differentiation between 31 °C and 28 °C was associated with overall reduced protein abundances in the host and, particularly, the photosymbionts, as most proteins clustered in the upper half of the diagram (Figure 5d and Figure S6).
The origin of the most abundant proteins, beta tubulin and polyubiquitin, could not be determined due to their strong homology among organisms. Also, three other highly conserved and abundant proteins [actin, heat shock protein (HSP) 90, and ADP-ribosylation factor] could not be clearly associated to either host or photosymbionts. Polyubiquitin increased with pCO2, but not at 31 °C. In contrast, the other four proteins were most abundant in control- and high-pCO2×31 °C, but not at moderate-pCO2×31 °C. HSP90 and ADP-ribosylation factor, which are responsible for protein folding and transport, also showed increases at high-compared to moderate-pCO2 at 28 °C and 31 °C, respectively (Figure S2, Table S6). All proteins of unclear origin were removed from downstream analyses. Separate analyses of host and photosymbiont-associated DAPs showed overall alike patterns of protein variations (Figures S3–S6). Differences were mainly found for moderate-pCO2×28 °C, which was overall most similar to the other 28 °C treatment in the host, but highly similar to control-pCO2×31 °C in the photosymbionts. Generally, there was a further separation along the y-axis in the photosymbiont, showing more distinct proteome variations of moderate-pCO2×28 °C and high-pCO2×31 °C in comparison to the host.

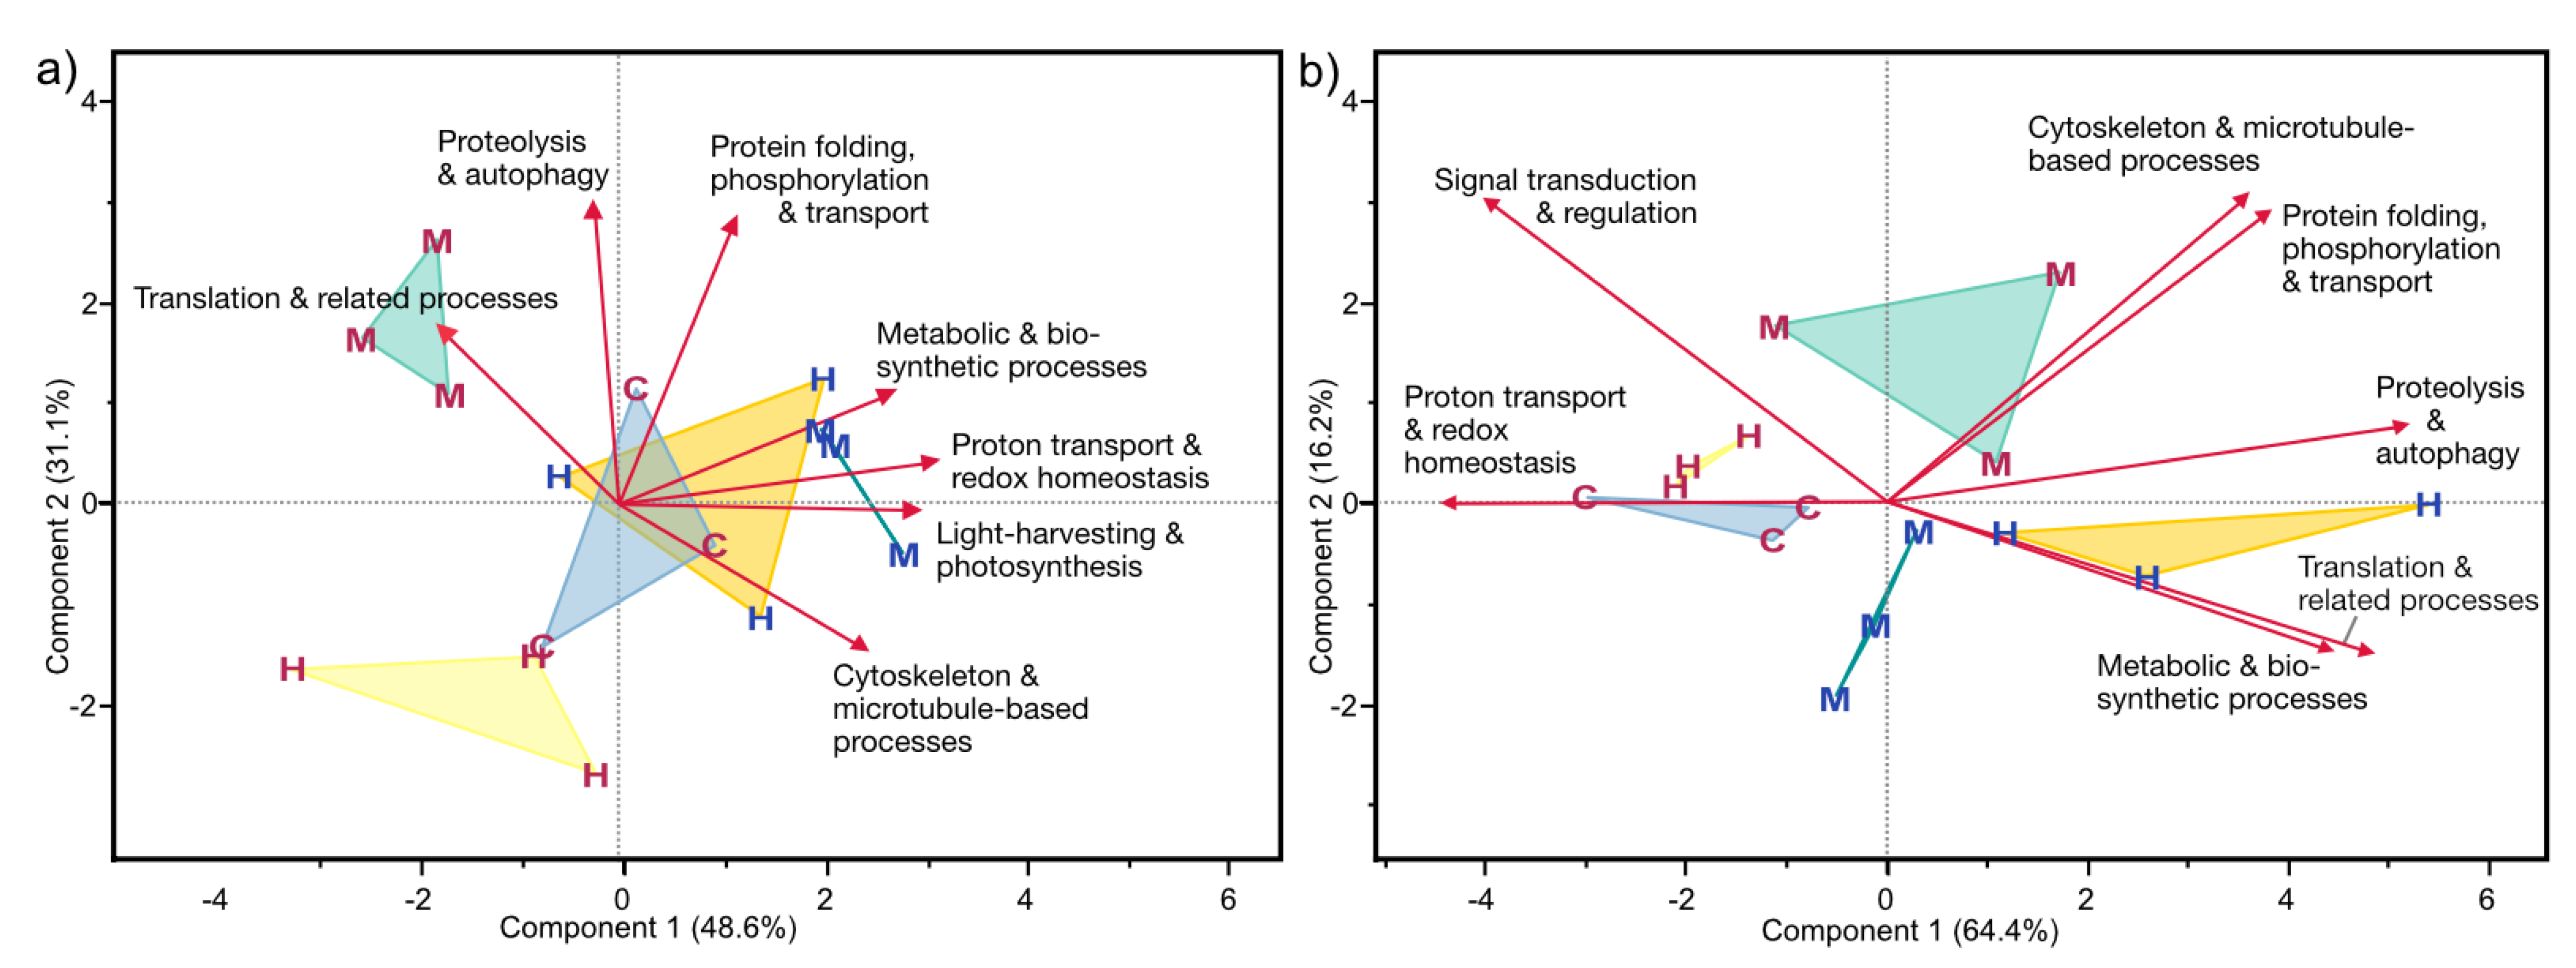
3.4.3. Functional Categories of Photosymbiont- and Host-Associated DAPs

The gene ontology analysis of DAPs revealed the biological processes, molecular functions, and cellular components these proteins are involved in (Table S6, Figures S3 and S4). The 97 most strongly regulated proteins (i.e., DAPs that also showed log2FC ≥ |1| between treatments with Tukeys’ p ≤ 0.05) were grouped by major functional categories based on GO annotations and summarized (Table 3 and Table 4). PCAs of total DAP abundances per functional category revealed the underlying contribution of these groups driving the proteomic differences between treatments (Figure 6).
In the photosymbionts, a separation along the x-axis explained 48.6% of the variation, mostly separating 31 °C from 28 °C treatments (Figure 6a). High T (31 °C) dominantly caused decreases of proteins involved in light-harvesting and photosynthesis, proton transport or cell redox homeostasis, metabolic and (fatty acid or other) biosynthetic processes, but also cytoskeleton (development) and protein transport decreased, while some proteins involved in translation, protein folding, biosynthetic processes, and proton transmembrane transport showed increases. High-pCO2×31 °C led to a decrease of enzymes involved in fatty-acid and other biosynthetic processes, whereas proteins responsible for protein folding increased. At moderate-pCO2×31 °C, stronger decreases were found, specifically of proteins involved in photosynthetic light-harvesting, (carbohydrate) metabolism, biosynthetic, and transport processes. At moderate-pCO2×28 °C, some proteins of photosystem I, or involved in metabolism (e.g., the citric acid cycle) and cytoskeleton development-related processes were relatively elevated (Table 3).
In the host, the impact of these functional protein groups on treatment differentiation was even stronger (Figure 6b). Elevated temperature (31 °C) caused general decreases of ribosomal and other translation-related proteins, and various metabolic (catalytic) enzymes (e.g., those involved in the citric acid cycle, pentose-phosphate pathway, and electron transport). Likewise, some proteasomal and proteins involved in the regulation of protein folding or ubiquitination, cytoskeleton organization, or microtubule-based movement, decreased. In contrast, some proteins responsible for protein (re-)folding and degradation (proteasome subunits), and microtubule-based transport processes, increased, especially at moderate-pCO2×31 °C. In comparison, proteins responsible for (transmembrane) ion transport or signal transduction were particularly increased at control- and high-pCO2×31 °C. Several proteasomal, metabolic and biosynthetic proteins were increased with pCO2, especially at high-pCO2×28 °C, whereas proton transporters seemed to decrease under that treatment (Table 4).

4. Discussion

LBF are important CaCO3 producers and ecological indicators integral to tropical marine habitats [19]. Increasing global CO2 emissions lead to simultaneous ocean acidification and warming, representing two major environmental threats to calcifying marine organisms. Understanding thresholds of physiological tolerance and possible acclimatization mechanisms to changing physicochemical conditions will help to better understand resilience mechanisms and the potential for persistence of coral reef organisms under near-future climate change. The geologic record of LBF throughout periods with high and strongly fluctuating atmospheric pCO2 and temperatures [24,25] has spurred interest in the abilities of photosymbiont-bearing foraminifera to withstand or adapt to rapidly changing ocean conditions. In our experiment, A. lobifera persists under the combined stressors of elevated pCO2 and T over an eight-week interval, showing only few effects induced by single stressor treatments or their interaction at the organism-level, but significant effects of temperature or pCO2 on the host and photosymbiont proteome.

4.1. Climate Change Impacts on Photosymbiont and Holobiont Performance

4.1.1. Bleaching and Mortality

Consistent with some previous studies on A. lobifera [12,43], we did not see significant impacts of elevated temperature or pCO2 (or their combined effects) on photosymbiont physiology as expressed by holobiont color and chl a (Figure 2). While ocean warming is currently considered the most harmful factor of climate change on coral reef organisms, our study documented a resistance to 31 °C and elevated pCO2. Importantly, we did not observe any significant effects on A. lobifera mortality in response to either of these global stressors, nor to their combined effects (Figure 3c). However, similar studies have shown that elevated pCO2, in combination with high temperatures [21,41] or elevated copper concentrations [46], induces bleaching and lowered chl a concentration in other species of LBF. This suggests a species-specific and perhaps a study-specific response to significant interactions between multiple stressors on symbiont physiology. While elevated temperature alone has been documented to disrupt photosymbiosis as evidenced by reductions in photosymbiont density, pigment density, rate of photosynthesis, or coloration [23,32,35,90], it is important to note the thermal history of specimens used in other studies likely differed from that of the present study—in which LBF were collected from a site previously shown to harbor highly thermally resistant populations of LBF and scleractinian corals [22,37]. Ultimately, the present study is consistent with previous experiments demonstrating no or low mortality in various LBF species exposed to OA [41,46,47,91].
The proteomic response of the photosymbiont compartment offers interesting mechanistic insights into responses to OW/OA, showing these were primarily driven by elevated T and only secondarily by elevated pCO2. At 31 °C, particularly at moderate pCO2×31 °C, proteins involved in photosynthesis (e.g., fucoxanthin chlorophyll a/c protein, thylakoid lumenal 15 kDa protein 2, PSI P700 apoproteins), several enzymes involved in (carbohydrate) metabolic processes (e.g., fructose-bisphosphate aldolase, alanine dehydrogenase, inorganic pyrophosphate), and various biosynthetic processes (e.g., uroporphyrinogen decarboxylase, 3-isoproylmalate dehydrogenase) were decreased. In contrast, proteins associated with unfolded protein response (e.g., HSP90, HSP70-type, ATP-dependent chaperone ClpB) were elevated at 31 °C (Figure 5, Figure 6a, Figures S3, S5 and S6). Thus, we document here a similar but less intense proteomic symbiont stress response to OW compared to former studies on A. gibbosa [49]. Concurrently, the only changes observed between pCO2 treatments at 28 °C in diatom-associated proteins included slightly elevated chaperones, which are responsible for protein folding and repair, signifying a minor response of the photosymbionts to pCO2 levels approaching 3000 ppm (Table 3 and Table S6). Minimal gene expression responses to OA were correspondingly found for the in hospite photosymbiotic dinoflagellates of corals [92,93], which suggest that host-derived tissue may act as a buffer, or lower susceptibility of endosymbiotic microalgae to OA. This is also in line with the significantly lower proportion of DAPs in the photosymbionts compared to the host found here amongst A. lobifera from the GoA. As responses suggesting cellular stress or acclimatization mechanisms are only detectable at the proteome level, and not reflected in bleaching or mortality data, our results confirm the comparably high stability of the photosymbiosis of A. lobifera originating from the GoA [22], and emphasize corresponding proteomic responses to ocean warming to lessen the physiological impact of ocean warming and acidification conditions expected for years 2100 and 2500 (RCP 8.5 [1]). The high resilience of A. lobifera is further evident from an exposure experiment showing that seven species of LBF (including three Amphistegina species) surviving a five-day incubation at temperatures up to 40 °C and at pH between 5.9 and 7.4 [21].

4.1.2. Growth

While the LBF in our study did not exhibit significant mortality and bleaching, mean growth rates (2D planar extension) were generally lower under 31 °C than under 28 °C (Figure 3). Such reduced growth is consistent with prior temperature-stress studies on LBF (e.g., [23,32,35,41]). This is confirmed by the significant decrease in host protein abundances at 31 °C (Figure 5, Figure 6b and Figures S4–S6) in the present study. This caused a depletion of mitochondrial components (e.g., metabolic enzymes involved in the tricarboxylic acid cycle) and components of the electron transport chain (e.g., putative glyoxalase I, UDP-glucose 4-epimerase, isocitrate dehydrogenase [NADP], cytochrome c oxidase 1), but also of ribosomal and others proteins involved in translation (e.g., 60S and 40S ribosomal proteins, ribonuclease P protein subunit p25-like). Downregulation of reactive oxygen species (ROS)-producing reactions is a common proteomic response to reduce oxidative stress in marine organisms exposed to heat stress [94], while pathways that generate NADPH as a reducing equivalent for scavenging ROS may increase. This also emphasizes a potential decrease in energy production, which may affect resource allocation to the host or other cellular processes. Moreover, proteasome regulatory components (e.g., 26S proteasome non-ATPase regulatory subunit 1 homologue) decreased at 31 °C, while proteasome subunits responsible for protein catabolic processes increased (Table 4 and Table S6). Simultaneously, increases in abundance were detected for a few proteins involved in protein transport and folding, or stress response (e.g., endoplasmin, chaperone proteins), and various proteins responsible for signal transduction, which may partly play roles in exocytosis, phagocytosis, or programmed cell death (Rab GTPase, Ras-related C3 botulinum toxin substrate 1, Ras-related protein RABB1c). All of these functional groups are likewise major traits of differential gene expression in the heat and bleaching responses of corals [95]. Hence, the dominant decreases in proteins from the 31 °C treatments suggest cellular damage, reductions in energy production and cell-cycle related processes, and mild enhancement of unfolded protein response and repair processes.
The result of these proteomic changes suggests that fewer energy resources were available as a result of being reallocated to stress response mechanisms, potentially compromising growth. In comparison, one-month exposure of A. gibbosa to thermal stress (32 °C) likewise lead to reduced growth, but also to putative inhibition of reproduction, and to visible bleaching along with impacts on photophysiological parameters [23]. Accordingly, the proteomic response of A. gibbosa was more prominent, e.g., by stronger increased abundance of protein-folding and stress-related proteins [49]. These disparities indicate a higher resistance of A. lobifera to OW, which may be related to the differing photosymbiont responses. While A. gibbosa hosts only one lineage of photosymbiotic diatoms [35], A. lobifera in contrast hosts a much higher diversity of photosymbionts [22,52], such that the higher flexibility in the photosymbiotic association may facilitate increased overall resilience of the holobiont. This is supported by the proteomic data, which show that despite reductions in photosynthesis-related, metabolic, and biosynthetic proteins in the photosymbiont, overall bleaching and mortality was not induced by elevated temperature.
An effect of elevated pCO2 alone on LBF growth was not found in the present study, which is similar to growth results of the closely related LBF species A. gibbosa that was not impacted by pCO2 of up to ~2000 ppm [43], suggesting that energetic reserves are relatively stable under OA conditions. Conversely, Prazeres et al. [47] detected significantly reduced buoyant weight growth rates in A. lessonii in response to seawater pH levels of 7.7 and lower, while no significant impacts on growth rates expressed by changes in surface area were found for the same individuals. Fujita et al. [40] likewise found heavier tests at intermediate pCO2 (580 and 770 µatm), but lower test weight at 970 µatm in two other hyaline diatom-bearing foraminifera species. Recent work on the impacts of OA on coral calcification have documented a reduction in skeleton density, but not linear extension, in response to increasing pCO2 [96]. In our study, although not statistically significant, the lowest growth rates were found in the high-pCO2×31 °C treatment (Figure 3a). A marginally significant increase in the frequency of partial breakage was also observed in this treatment (Figure 3d), which may have arisen from underlying changes in test structure and density associated with the reduced growth rates under these conditions. Future studies into the effects of ocean acidification on LBF should therefore use methods that assess changes in test density, weight, and calcification rate.
Another impact of OA documented in the present study is a significant decrease in test pore size under high-pCO2×31 °C compared to control-pCO2×31 °C (Figure 3b), which suggests that the structure of LBF tests may change under elevated pCO2, at least when combined with thermal stress. Such reduction in LBF pore size could limit the gas exchange between the environment and the LBF’s inner cell. A 14CO2-experiment demonstrated that the pores of amphisteginids allow the exchange of photosynthesis- and respiration-related gases, but not larger molecules [97]. Leutenegger and Hansen [97] also showed very slow CO2-uptake in A. lobifera compared to other species, and suggested that the organic pore elements may influence transport rates. Hence, the foraminiferal endoplasm and intercellular photosymbionts may confer some degree of protection from acidified environmental conditions.

4.2. Buffering of OA in the LBF Microenvironment

Contrary to the majority of results documenting strong negative responses to CO2-induced OA, such as dissolution of biogenic CaCO3 [98,99] and reducing overall fitness [43], the present study showed a generally mild response of LBF to OA. This is further documented through SEM images of test surfaces from living A. lobifera in treatments, which show no obvious signs of dissolution (Figure 4). Some prior studies on the response of amphisteginid and other LBF tests to environmental stress [21,40,43] suggest that the foraminiferal organic matrix, its ectoplasm, and/or reticulopodial network help protect the test from dissolution [100]. These processes are likely assisted by increasing pH—as observed in the present study—and, thus, calcite saturation state of the DBL around LBF tests.
Our study notably shows that pH at the test surface (pHts) during dark is similar to surrounding seawater pH (pHSW), while under light conditions pHts at the LBF surface is elevated relative to pHSW (Figure 1b)—apparently due to the drawdown of DIC via symbiont photosynthesis under light conditions. Because DIC is a limiting substrate for photosynthesis in LBF [101], elevated pCO2 could therefore raise the photosynthetic output of the photosymbionts. Light-induced photosynthetic drawdown of DIC [67], as well as CO2-uptake for fixation in the Calvin cycle in the dark, outweighing respired CO2 [12] and/or active regulation of CO2 in the foraminiferal microenvironment have been previously proposed for LBF [13,102], all of which would effectively minimize test dissolution by elevating pHts. Under light, the difference in proton concentration between seawater and test surface (∆[H+]) became significantly larger at high-pCO2×31 °C (Figure 1a), such that the resulting pHts (7.84 ± 0.21) was approaching pHts at moderate-pCO2×31 °C (7.96 ± 0.04). Such elevated pH at the LBFs’ test surface under light was similarly observed in A. radiata at 1141 and 2151 µatm [12], potentially indicating a shielding effect of maintaining a strong proton gradient in the DBL due to enhanced photosynthetic uptake of aqueous CO2 under conditions of elevated pCO2. Ecologically, photosynthesis and DBL thickness of LBF depend on flow rates [67], which they can control to some degree through their own motility, potentially allowing them to control DBL thickness and its protective function.
The mechanisms primarily considered responsible for the observed persistence of calcification in LBF under OA are active elevation of pH at the site of calcification via proton pumping (e.g., by V-type H+-ATPase, Ca2+-ATPase and Mg-ATPase [47,103]) and/or antiporter exchange, and/or drawdown of aqueous CO2 via photosynthesis [67], which compensate for the CO2-induced decrease in seawater pH and maintain pH homeostasis for cellular function [104]. Yet, proton gradients (∆[H+]) in the LBF microenvironment weakened significantly under dark conditions (Figure 1a), with pH at the test surface becoming nearly indistinguishable from seawater pH) under all treatments (Figure 1b)—suggesting that light is essential for maintaining the chemically protective pH gradients in the DBL of this species.
Notably, the A. lobifera maintained a much higher pHts and stronger ∆[H+] in the highest pCO2 treatment under 31 °C compared with 28 °C, suggesting that this species is able to mitigate the impacts of extreme OA under the higher temperature treatment. This trend is not borne out in the growth data (as measured by change in cross-sectional area of test), which under the highest pCO2 treatment showed higher growth under 28 °C versus 31 °C. Interestingly, members of several electron transport complexes (e.g., cytochrome b-c1 complex subunit Rieske, cytochrome c oxidase subunit 5b-1, NADH-ubiquinone oxidoreductase, NADH dehydrogenase [ubiquinone] flavoprotein 1) increased with elevated pCO2, particularly at high-pCO2×28 °C (H28), but not at 31 °C (Figures S4–S6, Table 4 and Table S6), suggesting that these may contribute to cellular homeostasis of this species under OA in the absence of thermal stress, but that these processes are not reflected in DBL chemistry.
Although the PERMANOVA indicated significant effects of pCO2 on global protein abundances in both compartments, the generally low number of DAPs and lack of proteomic data showing consistent regulation of common proton pumps (i.e., V-type proton ATPase subunits and vacuolar membrane proton pumps) under the elevated pCO2 treatments suggest that host cellular pH homeostasis was maintained without substantial regulatory response. Only a slight increase of these in control- and high-pCO2×31 °C hint at active regulation of CO2 in the LBFs’ microenvironment. In contrast, direct comparison of proteomic responses to high- and moderate-pCO2×28 °C (Table 4 and Table S6) suggests slightly reduced ion transport and protein phosphorylation (pyrophosphate-energized vacuolar membrane proton pump 1-like, V-type proton ATPase subunits, CAMK/CDPK protein kinase) under high compared to moderate pCO2. The few increased host-proteins under high pCO2 were involved in carbohydrate metabolic processes and proteolysis (e.g., UDP-glucose 4-epimerase GalE, proteasome subunit alpha type-4-3). Similarly, a surprising lack of changes in abundance of ATP-driven proton pumps or even lower levels of proton pumps were evident in similarly designed coral OA experiments [105,106]. Nevertheless, though not statistically significant, ∆H+ was also apparently enhanced at high-pCO2×31 °C in the dark (Figure 1a), suggesting that other mechanisms facilitating proton regulation in the DBL may have been at work. These mechanisms could include higher activity of known ion pumps, or enhancement of so far unrecognized proton-regulating mechanisms and/or proteins.

4.3. Non-Linear Responses to Multiple Climate Change Stressors

The overall fitness in A. lobifera was largely unaffected by the climate change scenarios to which they were exposed in the present study. However, contrasting responses to the interaction of OA and OW were identified. Previous studies have highlighted taxon-specific and non-linear responses ([8,11]) to OA, which were observed in the present study in the high amounts of DAPs, indicating cellular acclimatization mechanisms that facilitate the physiological functions of LBF, in response to moderate-pCO2×31 °C, but not to high-pCO2×31 °C.
The proteomic response to moderate-pCO2×31 °C is clearly anomalous in intensity and direction of variation (Figure 5c and Figure 6), although this treatment did not cause detectable differences in other aspects of LBF physiology. The abundances of most DAPs decreased in the moderate-pCO2×31 °C treatment, with only a small proportion increasing. The decreased proteins are involved in light harvesting, metabolic processes and proton-transmembrane transport (e.g., fucoxanthin chlorophyll a/c proteins, divinyl chlorophyllide a 8-vinyl-reductase, thylakoid luminal 15 kDa protein 2), lipid trafficking (translocation protein sec 62), or cytoplasm organization (tubulin-specific chaperone, cell division protein FtsZ), biosynthetic processes and cell redox homeostasis (e.g., uroporphyrinogen decarboxylase, thioredoxin). Proteins involved in chlorophyll biosynthesis (e.g., geranylgeranyl reductase) increased, probably to offset the decrease in light-harvesting antenna proteins. Simultaneously, other proteins involved in biosynthetic and metabolic processes or cell redox homeostasis (e.g., aspartate-ammonia ligase, 40S ribosomal protein, dihydrolipoyl dehydrogenase), and protein folding and degradation (e.g., Clp-protease ATP binding subunit, ATP-dependent chaperone ClpB) increased. Overall, this hints at a stress-induced response of the photosymbionts under the moderate-pCO2×31 °C treatment, probably related to oxidative stress. Although not detectable in chl a (Figure 2a), the photophysiological condition of the symbionts may have been compromised. Hence, despite a presumably fertilizing effect of elevated DIC availability on photosynthesis, the ∆H+ under light in this treatment stayed at the same level as under the control-pCO2×31 °C treatment (Figure 1). Thus, the proteomic response observed at moderate-pCO2×31 °C was probably caused by oxidative and cell-redox stress offsetting the benefit of increased DIC available for symbiont photosynthesis under the year-2100 scenario.
Such cellular responses in the photosymbionts may affect holobiont performance by reducing transfer of resources. In the host proteome, in contrast, various proteins were enriched, and respiratory activity was highest in this treatment, as indicated by the lowered pHts in the dark. Some proteins involved in fatty-acid oxidation and mitochondrial electron transport (e.g., fatty-acid CoA synthase, phytanoyl-CoA dioxygenase) were increased, while other enzymes involved in fatty-acid and glucose metabolism (e.g., long-chain-fatty-acid-CoA ligase, fructose-bisphosphate aldolase) were depleted. Altered fatty-acid metabolism was previously identified as part of the core transcriptomic response of corals to OA [107]. The downregulation of fatty-acid catabolism and simultaneous upregulation of a fatty-acid synthesis indicate increased lipid storage, possibly a common acclimatization mechanism of photosymbiotic calcifiers to long-term acidification. However, several other metabolic proteins decreased, along with cell cycle-related processes (e.g., cullin-associated NEDD8-dissociated protein 1, eukaryotic initiation factor 4E), and signal transduction and regulation (e.g., GTPase HRas, Ras-related protein Rab-21), while proteins involved in translational, protein folding and degradation (e.g., 60S ribosomal protein L5, molecular chaperone Dank/HSP70, peroxiredoxin, autophagy-related protein 3), cytoskeleton or microtubule movement (dynein intermediate and heavy chain, clathrin light chain, villin-2), and protein phosphorylation or transport (e.g., putative vesicle-fusing ATPase, sorting nexin 1), increased. These processes likely reflect an oxidative stress response, including repair mechanisms and cytoskeleton restructuring, as observed previously [49,85].
LBF from the high-pCO2×31 °C treatment exhibited an unexpectedly low number of DAPs and showed high similarity to LBF from the control-pCO2×31 °C treatment (Figure 5, Figure 6 and Figures S2–S4, Table S7). Yet, pHts was significantly elevated to ~7.84 in the light (Figure 1) under high-pCO2×31 °C. This indicates enhanced photosynthesis at ~high-pCO2×31 °C, although no significant change in chl a, color, or photosynthesis-related proteins were detected (Figure 2, Table 3 and Table S6). Thus, higher chloroplast efficiency under elevated pCO2 possibly enhanced photosynthetic productivity [12] without further proteomic adjustments. Decreases of a few proteins related to biosynthetic processes, oxidative stress, and cell redox homeostasis (e.g., acetyl-coA carboxylase, taurine catabolism dioxygenase TauD, glutamate synthase 2, L-ascorbate peroxidase,) and increases of DAPs, related to protein folding and proton transport (e.g., T-complex protein 1 subunit eta, V-type proton ATPase proteolipid subunit), imply minor cellular effects that could indicate an acclimative mechanism that can potentially maintain cell redox homeostasis. This mild response underscores the high fitness of photosymbionts in the high-pCO2×31 °C treatment, potentially facilitated by the fertilizing effect of OA on diatoms [8] and enhanced enzyme activities at high T. This further means the response of LBF photosymbionts to OA is non-linear when combined with warming. Hence, the impacts of 31 °C and putative cell redox stress observed in moderate-pCO2×31 °C are neutralized by the fertilizing effects of elevated pCO2 at a threshold between ~1000 and 3000 ppm. This seems to contradict the observation that DIC uptake of A. lobifera is close to saturation at ambient pCO2 [101], as higher temperatures facilitate higher enzymatic activities, which were presumably a limiting factor for CO2-fixation via symbiont photosynthesis in previous studies.
In the host proteome, only a very minor response was detectable at high-pCO2×31 °C, therefore, no major proteomic responses were required, probably due to fully functional photosymbionts and/or the chemical protection conferred from the strong proton gradient maintained in their DBL, or limitations in gas exchange through reductions in pore size. This underscores how well-adjusted these prolific calcifiers are to low pH environments, as long as the activity of their photosymbionts is unaffected.

5. Conclusions

Climate change will have diverse and complex ecological consequences for marine ecosystems. Overall, the effects of two-months exposure to 31 °C elicited a more adverse response than exposure to CO2-induced acidification at pCO2 conditions up to ~3000 ppm, which indicates the relatively high tolerance of A. lobifera to OA, potentially a result of a conserved adaptive trait in this and many other photosymbiotic Red Sea species [22,37,38,108,109]. However, both elevated pCO2 and temperature, but not their interaction, had significant effects on foraminifera and diatom proteomes. The frequency of these differentially abundant proteins was significantly higher in the foraminifera, indicating a stronger proteomic response in the host compared to its endosymbiotic diatoms. A mild heat-stress response was shown by the predominant decrease in protein abundances and reduced holobiont growth, indicating reduced holobiont performance through chronic sublethal cellular stress. OA showed even fewer effects on LBF. All pCO2 scenarios appear to be within the adaptive range of A. lobifera from the GoA. This sets their CO2 threshold above those previously proposed for Amphistegina spp. (e.g., for Great Barrier Reef populations: 1141 µatm pCO2/pHNBS 7.85 [12]) and other hyaline foraminifera (e.g., from the northwest Pacific ~1000 µatm/pHSW 7.7 [40]). Yet at 31 °C, elevated pCO2 induced cellular and morphological alterations (e.g., strongest proteome variations at moderate-pCO2 [year-2100]), indicating non-linear responses to combined stressors, and adaptive mechanism. Microenvironmental proton gradients [∆H+] increasing with elevated pCO2 and light denote the organism’s ability to mitigate the acidified conditions, especially during photosynthetic activity of the endosymbiotic diatoms. These responses may come at energetic costs that ultimately limit the host’s resistance to climate change, as previous studies suggest [40,47], resulting in the reduced test growth and marginally increased frequency in test breakage under higher-pCO2 conditions observed in the present study. In general, the effects of OA (and its combination with other stressors) on LBF are highly variable amongst species and studies [19], possibly owing to differences in test structure (hyaline vs. porcellaneous), mineral polymorph solubility (aragonite vs. low-Mg calcite vs. high-Mg calcite [110]), calcification mechanism [111], environmental preconditioning, compounding environmental factors (e.g., light, flow, nutrient availability, pesticides), life stage, flexibility in feeding strategies, and/or photosymbiont community.
Ancestral Amphisteginidae and other hyaline LBF, such as nummulitids, were diverse and dominant in shallow tropical marine carbonate environments during the middle Eocene [24,25], when atmospheric CO2 levels were similar to or markedly higher than today and underwent strong fluctuations [26,112]. The survival and, in some cases, proliferation of foraminifera throughout this interval invited the hypothesis that LBF possess important adaptations to changing pCO2. The ability of Amphistegina to continue calcifying under a wide range of pCO2 conditions, as observed in the present study, may have allowed this family of LBF to thrive during the middle Eocene and may facilitate their persistence in the future. The relative tolerance of these LBF to near-future climate change suggests a growing dominance in inter-reef and reef flat foraminifera assemblages [57] and further range expansions [22,113], along with a potential increased importance as carbonate producers. It also confirms the low susceptibility of coral reef organisms from the Gulf of Aqaba [22,37], which suggests that the northern Red Sea is a potentially important marine refuge from climate change [114], requiring strengthened protection and study.
The presented exploration of LBF holobiont response to the combined and singular effects of OA and OW at the level of the proteome yields valuable information about cellular stress responses, and the potential for physiological plasticity and resilience in the face of global climate change. Whether the putative acclimatization mechanisms can uphold overall fitness over longer time scales, and at what costs (e.g., energetic costs and/or physiological tradeoffs), should be assessed in future studies. With regard to the lack of signs of stress in the evaluated physiological parameters, but apparent proteomic responses, this study highlights the importance of considering impacts at several functional levels of the organism, as sublethal effects that can be (temporarily) overcome by acclimatization mechanisms at the molecular level, may not be detectable otherwise. Our experiment also shows that the effects of climate change can be missed when related stressors are assessed in isolation, and that physiological responses should be assessed across a range of organismal levels in order to make more realistic projections about the fate of reef calcifiers.

Supplementary Materials

The following are available online at https://www.mdpi.com/article/10.3390/oceans2020017/s1, Figure S1: Phylogenetic assignment of photosymbionts; Figure S2: Heatmap of differentially abundant proteins per sample; Figure S3: Heatmap of differentially abundant proteins in photosymbionts; Figure S4: Heatmap of differentially abundant proteins of the host foraminifera; Figure S5: Principal component analysis of differentially abundant proteins in (a) photosymbionts and (b) foraminiferal host including GO term summaries; Figure S6: Principal component analysis of differentially abundant proteins in (a) photosymbionts and (b) foraminiferal host including protein descriptions; Figure S7: Number of up- and down-regulated proteins comparing all treatments; Figure S8: Bar plots showing the number of gene ontology term hits of (a) pCO2- and (b) temperature-regulated proteins; Table S1: Additional data for mean chemical conditions; Table S2: Results of nominal logistic models for the frequencies of test breakage and mortality; Table S3: PERMANOVA and pairwise comparison results for ∆[H+]; Table S4: Results of two-factorial ANOVA of the measured physiological parameters; Table S5: List of all proteins detected; Table S6: List of normalized abundances values and log2FC of all DAPs; Table S7: Number of DAPs observed in experimental treatments.

Author Contributions

Conceptualization, M.S., J.B.R., and C.E.R.; methodology, M.S., L.P.C., C.E.R. and B.B.-L.; sample collection, M.S., C.E.R.; experimental setup, J.B.R., L.P.C.; proteomics analysis, B.B.-L.; data analysis, M.S.; writing—original draft preparation, M.S.; writing—review and editing, C.E.R., S.S.D., L.P.C., B.B.-L., J.B.R., H.W.; visualization, M.S.; supervision, J.B.R., H.W., A.S.; funding acquisition, J.B.R., H.W., A.S. All authors have read and agreed to the published version of the manuscript.

Funding

This project was supported by a Hanse Wissenschaftskolleg (HWK) senior fellowship and NSF BIO-OCE grant (funding number 1437371) awarded to J.B.R., and a grant from the Leibniz Association (funding number SAW-ISAS-2014) awarded to A.S. and H.W. Further, the Leibniz Centre for Tropical Marine Research (ZMT), and the Leibniz Institut für Analytische Wissenschaften (ISAS) contributed to the funding. M.S. was supported by the Minerva Foundation.

Data Availability Statement

The data presented in this study are openly available in PANGAEA at https://doi.pangaea.de/10.1594/PANGAEA.904656, diatom sequences were deposited at European Nucleotide Archive (ENA) under the project accession number PRJEB33832, and proteomic data in the ProteomeXchange Consortium via the PRIDE partner repository under dataset identifier PXD009890.

Acknowledgments

We warmly acknowledge Amatzia Genin and the Interuniversity Institute of Marine Science (IUI) for supporting sampling at the IUI, as well as Christian Wöhle and Alexandra-Sophie Roy for providing their protein prediction data set. We thank Silvia Hardenberg, Nico Steinel, and Christian Brandt for their assistance with the aquarium facilities at ZMT, and Achim Meyer for support with symbiont sequencing. We thank Dirk de Beer and the technicians from the Microsensor Group, especially Anja Niclas, at the Max-Planck Institute for Marine Microbiology.

Conflicts of Interest

The authors declare no conflict of interest. The funders had no role in the design of the study; in the collection, analyses, or interpretation of data; in the writing of the manuscript, or in the decision to publish the results.

Appendix A

Proteomics Analysis

The following chemicals were obtained from Sigma Aldrich, Steinheim, Germany: anhydrous magnesium chloride (MgCl2), guanidine hydrochloride (GuHCl), iodoacetamide (IAA), ammonium bicarbonate (NH4HCO3), and urea. Sodium chloride (NaCl) and calcium chloride (CaCl2) were from Merck, Darmstadt. Sodium dodecyl sulfate (SDS) was bought from Carl Roth, Karlsruhe, Germany. Tris base was purchased from Applichem Biochemica, Darmstadt, Germany. Dithiothreitol (DTT), EDTA-free protease inhibitor (Complete Mini) tablets were obtained from Roche Diagnostics, Mannheim, Germany. Sequencing grade-modified trypsin was bought from Promega, Madison, WI USA. All chemicals for ultra-pure HPLC solvents such as formic acid (FA), trifluoroacetic acid (TFA), and acetonitrile (ACN) were obtained from Biosolve, Valkenswaard, the Netherlands.
Lysis of pooled specimens was performed in 1.5 mL Eppendorf tubes. 100 µL of lysis buffer (50 mM Tris-HCl, pH 7.8, 150 mM NaCl, 1% SDS, and Complete Mini) were added, followed by mechanical grinding and storage on ice for 30 min. For clarification, samples were centrifuged at 4 °C and 10000 rcf for 10 min.
Protein concentration was estimated based on reference samples of which the exact protein concentration was determined by amino acid analysis as previously described [115,116]. Reduction and alkylation was performed by addition of DTT to a final concentration of 10 mM and incubation at 56 °C for 30 min, followed by treatment with 30 mM IAA at room temperature in the dark.
A filter aided sample preparation workflow (FASP) [117,118] with slight changes was used for buffer exchange and proteolysis. Lysates corresponding to an approximated protein concentration of 8 µg were diluted 5-fold by addition of freshly prepared 8.0 M Urea/100 mM Tris-HCl (pH 8.5) [119] and transferred onto the centrifugal device (PALL Nanosep, 30 kDa cutoff). After an initial centrifugation step for 30 min at 13500 rcf at RT, all following centrifugation steps were performed for 15 min, keeping the other parameters constant. Three wash steps with 100 µL of 8.0 M Urea/100 mM Tris-HCl (pH 8.5) were followed by three steps of buffer exchange with 100 µL of 50 mM NH4HCO3 (pH 7.8). 100 µL of proteolysis buffer comprising trypsin (1:20 w/w ratio of enzyme to substrate), 0.2 M GuHCl, and 2 mM CaCl2 in 50 mM NH4HCO3 (pH 7.8) was added to each sample. After incubation at 37 °C for 14 h, digested peptides were recovered by centrifugation followed by consecutive washing steps with 50 µL of 50 mM NH4HCO3 and 50 µL of ultra-pure water. Samples were acidified by addition of 20 µL of 10% TFA, desalted using SPEC C18, 4 mg sorbent (Agilent) as per manufacturer’s instructions, and quality controlled as described previously [120].
A TIC based normalization was performed by measurement of aliquots of all samples on a nano LC-MS system to account for systematic errors. Samples (each 1 µg after normalization) were analyzed using an Ultimate 3000 nano RSLC system coupled to a Q Exactive HF mass spectrometer (both Thermo Scientific). Preconcentration on a 100 µm × 2 cm C18 trapping column for 10 min using 0.1% TFA with a flow rate of 20 µL min−1 was followed by separation on a 75 µm × 50 cm C18 main column (both PepMap RSLC, Thermo Scientific) with a 120 min LC gradient ranging from 3–35% of buffer B: 84% ACN, 0.1% FA at a flow rate of 250 nL min−1. The Q Exactive HF was operated in data-dependent acquisition mode and MS survey scans were acquired from m/z 300 to 1500 at a resolution of 60,000 using the polysiloxane ion at m/z 371.101236 as lock mass [121]. Quadrupole isolation was set to 0.4 m/z and the fifteen most intense signals (Top15) were subjected to higher energy collisional dissociation with a normalized collision energy of 27% at a resolution of 15,000 and a dynamic exclusion of 12 s. Automated gain control target values were set to 3 × 10⁶ for MS and 5 × 10⁴ MS/MS. Maximum injection times were 120 ms and 250 ms, respectively. Precursor ions with charge states of +1, > +5 or unassigned were excluded from MS/MS analysis.
Progenesis LC-MS software (version 3.0.6039.34628) from Nonlinear Dynamics (Newcastle upon Tyne, UK) and the statistical software R (version 3.3.162) [84] were used for label-free quantification. Raw MS data was imported into Progenesis and aligned to one automatically selected LC-MS reference file. After peak picking, MS/MS spectra were exported .mgf files. Identification of proteins and peptides was performed by the PEAKS Studio software suite, version 7.5, de novo to SPIDER [122]. Searches were performed in a decoy-fusion manner against a concatenated database comprising an updated and enlarged reference dataset for foraminifera, containing the recently published genome sequences of the calcareous benthic foraminifera Globobulimina [81], combined with the publicly available genome data of three diatom species (Bacillariophyta) from the NCBI database on 15 March 2016. Protein sequence databases were used as such, while nucleotide sequences were translated in all six reading frames prior to concatenation. Precursor mass tolerance was set to 10 ppm and fragment ion tolerance to 0.02 Da. Full tryptic enzyme specificity was selected, allowing a maximum of two missed cleavages. For de novo and DB search, carbamidomethylation of cysteines was defined as fixed modification and oxidation of methionine as variable modification. A maximum number of two variable modifications per peptide was allowed for de novo and DB search, while for the PTM and SPIDER search the default settings were used. PSM- and peptide-level FDR was limited to 1% and proteins had to be identified with at least one unique peptide in order to be reported. Identifications meeting these criteria were re-imported into Progenesis to calculate the normalized abundances on the peptide-level.
Amino acid sequences of all proteins identified in the database search were uploaded in .fasta file format to the CD-HIT suite web server of the Weizhong Li Lab [123] in order to generate cluster of homologous protein sequences. Sequence identity cut-off was set to 0.7 and minimum alignment coverage for the longer sequence was set to 0.0. All other parameters were left as default. Normalized abundance-values of the peptides were used to calculate protein cluster abundance. Only peptides unique to a given protein cluster were used for quantification, hence, peptides that could not be clearly assigned to either of the compartments (host or symbionts) were removed from further analysis.

References

  1. Field, C.B.; Barros, V.R. (Eds.) Climate Change 2014–Impacts, Adaptation and Vulnerability: Regional Aspects; Cambridge University Press: Cambridge, UK; New York, NY, USA, 2014. [Google Scholar]
  2. Hughes, T.P.; Kerry, J.T.; Álvarez-Noriega, M.; Álvarez-Romero, J.G.; Anderson, K.D.; Baird, A.H.; Babcock, R.C.; Beger, M.; Bellwood, D.R.; Berkelmans, R.; et al. Global warming and recurrent mass bleaching of corals. Nature 2017, 543, 373–377. [Google Scholar] [CrossRef]
  3. Caldeira, K.; Wickett, M.E. Anthropogenic carbon and ocean pH. Nature 2003, 425, 365. [Google Scholar] [CrossRef]
  4. Feely, R.A.; Alin, S.R.; Newton, J.; Sabine, C.L.; Warner, M.; Devol, A.; Krembs, C.; Maloy, C. The combined effects of ocean acidification, mixing, and respiration on pH and carbonate saturation in an urbanized estuary. Estuar. Coast. Shelf Sci. 2010, 88, 442–449. [Google Scholar] [CrossRef]
  5. Orr, J.C.; Fabry, V.J.; Aumont, O.; Bopp, L.; Doney, S.C.; Feely, R.A.; Gnanadesikan, A.; Gruber, N.; Ishida, A.; Joos, F.; et al. Anthropogenic ocean acidification over the twenty-first century and its impact on calcifying organisms. Nature 2005, 437, 681. [Google Scholar] [CrossRef]
  6. Pandolfi, J.M.; Connolly, S.R.; Marshall, D.J.; Cohen, A.L. Projecting coral reef futures under global warming and ocean acidification. Science 2011, 333, 418–422. [Google Scholar] [CrossRef] [Green Version]
  7. Ries, J.B. A physicochemical framework for interpreting the biological calcification response to CO2-induced ocean acidification. Geochim. Cosmochim. Acta 2011, 75, 4053–4064. [Google Scholar] [CrossRef]
  8. Kroeker, K.J.; Kordas, R.L.; Crim, R.; Hendriks, I.E.; Ramajo, L.; Singh, G.S.; Duarte, C.M.; Gattuso, J.P. Impacts of ocean acidification on marine organisms: Quantifying sensitivities and interaction with warming. Glob. Chang. Biol. 2013, 19, 1884–1896. [Google Scholar] [CrossRef] [PubMed] [Green Version]
  9. Castillo, K.D.; Ries, J.B.; Bruno, J.F.; Westfield, I.T. The reef-building coral Siderastrea siderea exhibits parabolic responses to ocean acidification and warming. Proc. R. Soc. B Biol. Sci. 2014, 281. [Google Scholar] [CrossRef] [Green Version]
  10. Ries, J.B.; Cohen, A.L.; McCorkle, D.C. Marine calcifiers exhibit mixed responses to CO2-induced ocean acidification. Geology 2009, 37, 1131–1134. [Google Scholar] [CrossRef]
  11. Ries, J.B.; Cohen, A.L.; McCorkle, D.C. A nonlinear calcification response to CO2-induced ocean acidification by the coral Oculina arbuscula. Coral Reefs 2010, 29, 661–674. [Google Scholar] [CrossRef]
  12. Glas, M.S.; Fabricius, K.E.; de Beer, D.; Uthicke, S. The O2, pH and Ca2+ microenvironment of benthic foraminifera in a high CO2 world. PLoS ONE 2012, 7, e50010. [Google Scholar] [CrossRef] [Green Version]
  13. De Nooijer, L.J.; Toyofuku, T.; Kitazato, H. Foraminifera promote calcification by elevating their intracellular pH. PNAS 2009, 106, 15374–15378. [Google Scholar] [CrossRef] [Green Version]
  14. Toyofuku, T.; Matsuo, M.Y.; de Nooijer, L.J.; Nagai, Y.; Kawada, S.; Fujita, K.; Reichart, G.-J.; Nomaki, H.; Tsuchiya, M.; Sakaguchi, H.; et al. Proton pumping accompanies calcification in foraminifera. Nat. Commun. 2017, 8, 14145. [Google Scholar] [CrossRef]
  15. Guillermic, M.; Cameron, L.; De Corte, I.; Misra, S.; Bijma, J.; De Beer, D.; Reymond, C.; Westphal, H.; Ries, J.B.; Eagle, R. Thermal stress reduces Pocilloporid coral resilience to ocean acidification by impairing control over calcifying fluid chemistry. Sci. Adv. 2021, 7, eaba9958. [Google Scholar] [CrossRef]
  16. Hallock, P. Symbiont-bearing foraminifera: Harbingers of global change? Micropaleontology 2000, 46, 95–104. [Google Scholar]
  17. Lee, J.J.; Saks, N.M.; Kapiotou, F.; Wilen, S.H.; Shilo, M. Effects of host cell extracts on cultures of endosymbiotic diatoms from larger foraminifera. Mar. Biol. 1984, 82, 113–120. [Google Scholar] [CrossRef]
  18. Langer, M.R. Assessing the contribution of foraminiferan protists to global ocean carbonate production. J. Eukaryot. Microbiol. 2008, 55, 163–169. [Google Scholar] [CrossRef] [PubMed]
  19. Narayan, G.R.; Reymond, C.E.; Stuhr, M.; Doo, S.; Schmidt, C.; Mann, T.; Westphal, H. Response of large benthic foraminifera to climate and local changes: Implications for future carbonate production. Sedimentology 2021. [Google Scholar] [CrossRef]
  20. Hallock, P. Why are larger Foraminifera large? Paleobiology 1985, 11, 195–208. [Google Scholar] [CrossRef]
  21. Engel, B.E.; Hallock, P.; Price, R.E.; Pichler, T. Shell dissolution in larger benthic foraminifers exposed to pH and temperature extremes: Results from an in situ experiment. J. Foraminifer. Res. 2015, 45, 190–203. [Google Scholar] [CrossRef]
  22. Schmidt, C.; Morard, R.; Prazeres, M.; Barak, H.; Kucera, M. Retention of high thermal tolerance in the invasive foraminifera Amphistegina lobifera from the Eastern Mediterranean and the Gulf of Aqaba. Mar. Biol. 2016, 163, 228. [Google Scholar] [CrossRef]
  23. Stuhr, M.; Reymond, C.E.; Rieder, V.; Hallock, P.; Westphal, H.; Kucera, M. Reef calcifiers are adapted to episodic heat stress but vulnerable to sustained warming. PLoS ONE 2017, 12, e0179753. [Google Scholar] [CrossRef]
  24. Pomar, L.; Baceta, J.I.; Hallock, P.; Mateu-Vicens, G.; Basso, D. Reef building and carbonate production modes in the west-central Tethys during the Cenozoic. Mar. Pet. Geol. 2017, 83, 261–304. [Google Scholar] [CrossRef]
  25. Hallock, P.; Silva, I.P.; Boersma, A. Similarities between planktonic and larger foraminiferal evolutionary trends through Paleogene paleoceanographic changes. Palaeogeogr. Palaeoclimatol. Palaeoecol. 1991, 83, 49–64. [Google Scholar] [CrossRef]
  26. Pearson, P.; Palmer, M. Middle eocene seawater pH and atmospheric carbon dioxide concentrations. Science 1999, 284, 1824–1826. [Google Scholar] [CrossRef] [PubMed] [Green Version]
  27. Prazeres, M.; Morard, R.; Roberts, T.E.; Doo, S.; Schmidt, C.; Stuhr, M.; Renema, W.; Kucera, M. High dispersal capacity and biogeographic breaks shape the genetic diversity of a globally-distributed reef-dwelling calcifier. Ecol. Evol. 2020, 10, 5976–5989. [Google Scholar] [CrossRef]
  28. Langer, M.R.; Hottinger, L. Biogeography of selected “larger” foraminifera. Micropaleontology 2000, 46, 105–126. [Google Scholar]
  29. Langer, M.R.; Weinmann, A.E.; Lötters, S.; Bernhard, J.M.; Rödder, D. Climate-driven range extension of Amphistegina (Protista, Foraminiferida): Models of current and predicted future ranges. PLoS ONE 2013, 8, e54443. [Google Scholar] [CrossRef] [Green Version]
  30. Doo, S.S.; Hamylton, S.; Finfer, J.; Byrne, M. Spatial and temporal variation in reef-scale carbonate storage of large benthic foraminifera: A case study on One Tree Reef. Coral Reefs 2016, 36, 293–303. [Google Scholar] [CrossRef]
  31. Kawahata, H.; Fujita, K.; Iguchi, A.; Inoue, M.; Iwasaki, S.; Kuroyanagi, A.; Maeda, A.; Manaka, T.; Moriya, K.; Takagi, H.; et al. Perspective on the response of marine calcifiers to global warming and ocean acidification—Behavior of corals and foraminifera in a high CO2 world “hot house”. Prog. Earth Planet. Sci. 2019, 6, 37. [Google Scholar] [CrossRef]
  32. Schmidt, C.; Heinz, P.; Kucera, M.; Uthicke, S. Temperature-induced stress leads to bleaching in larger benthic foraminifera hosting endosymbiotic diatoms. Limnol. Oceanogr. 2011, 56, 1587–1602. [Google Scholar] [CrossRef]
  33. Talge, H.K.; Hallock, P. Ultrastructural responses in field-bleached and experimentally stressed Amphistegina gibbosa (Class Foraminifera). J. Eukaryot. Microbiol. 2003, 50, 324–333. [Google Scholar] [CrossRef] [PubMed]
  34. Fujita, K.; Okai, T.; Hosono, T. Oxygen metabolic responses of three species of large benthic foraminifers with algal symbionts to temperature stress. PLoS ONE 2014, 9, e90304. [Google Scholar] [CrossRef] [PubMed] [Green Version]
  35. Stuhr, M.; Meyer, A.; Reymond, C.E.; Narayan, G.R.; Rieder, V.; Rahnenführer, J.; Kucera, M.; Westphal, H.; Muhando, C.A.; Hallock, P. Variable thermal stress tolerance of the reef-associated symbiont-bearing foraminifera Amphistegina linked to differences in symbiont type. Coral Reefs 2018, 37, 811–824. [Google Scholar] [CrossRef]
  36. Hallock, P.; Williams, D.; Toler, S.; Fisher, E.M.; Talge, H.K. Bleaching in reef-dwelling foraminifers: Implications for reef decline. Int. Coral Reef Symp. 2006, 737, 729–737. [Google Scholar]
  37. Fine, M.; Gildor, H.; Genin, A. A coral reef refuge in the Red Sea. Glob. Chang. Biol. 2013, 19, 3640–3647. [Google Scholar] [CrossRef]
  38. Osman, E.O.; Smith, D.J.; Ziegler, M.; Kürten, B.; Conrad, C.; El-Haddad, K.M.; Voolstra, C.R.; Suggett, D.J. Thermal refugia against coral bleaching throughout the northern Red Sea. Glob. Chang. Biol. 2018, 24, 474–484. [Google Scholar] [CrossRef]
  39. Uthicke, S.; Momigliano, P.; Fabricius, K.E. High risk of extinction of benthic foraminifera in this century due to ocean acidification. Sci. Rep. 2013, 3, 1769. [Google Scholar] [CrossRef] [Green Version]
  40. Fujita, K.; Hikami, M.; Suzuki, A.; Kuroyanagi, A.; Kawahata, H. Effects of ocean acidification on calcification of symbiont-bearing reef foraminifera. Biogeosci. Discuss. 2011, 8, 1809–1829. [Google Scholar]
  41. Schmidt, C.; Kucera, M.; Uthicke, S. Combined effects of warming and ocean acidification on coral reef foraminifera Marginopora vertebralis and Heterostegina depressa. Coral Reefs 2014, 33, 805–818. [Google Scholar] [CrossRef]
  42. Uthicke, S.; Fabricius, K.E. Productivity gains do not compensate for reduced calcification under near-future ocean acidification in the photosynthetic benthic foraminifer species Marginopora vertebralis. Glob. Chang. Biol. 2012, 18, 2781–2791. [Google Scholar] [CrossRef]
  43. McIntyre-Wressnig, A.; Bernhard, J.M.; McCorkle, D.C.; Hallock, P. Non-lethal effects of ocean acidification on the symbiont-bearing benthic foraminifer Amphistegina gibbosa. Mar. Ecol. Prog. Ser. 2013, 472, 45–60. [Google Scholar] [CrossRef]
  44. Reymond, C.E.; Lloyd, A.; Kline, D.I.; Dove, S.G.; Pandolfi, J.M. Decline in growth of foraminifer Marginopora rossi under eutrophication and ocean acidification scenarios. Glob. Chang. Biol. 2013, 19, 291–302. [Google Scholar] [CrossRef] [PubMed]
  45. Vogel, N.; Uthicke, S. Calcification and photobiology in symbiont-bearing benthic foraminifera and responses to a high CO2 environment. J. Exp. Mar. Bio. Ecol. 2012, 424–425, 15–24. [Google Scholar] [CrossRef]
  46. Marques, J.A.; de Barros Marangoni, L.F.; Bianchini, A. Combined effects of sea water acidification and copper exposure on the symbiont-bearing foraminifer Amphistegina gibbosa. Coral Reefs 2017, 36, 489–501. [Google Scholar] [CrossRef]
  47. Prazeres, M.; Uthicke, S.; Pandolfi, J.M. Ocean acidification induces biochemical and morphological changes in the calcification process of large benthic foraminifera. Proc. R. Soc. B Biol. Sci. 2015, 282, 8–11. [Google Scholar] [CrossRef] [Green Version]
  48. Sinutok, S.; Hill, R.; Doblin, M.; Wuhrer, R.; Ralph, P. Warmer more acidic conditions cause decreased productivity and calcification in subtropical coral reef sediment-dwelling calcifiers. Limnol. Oceanogr. 2011, 56, 1200–1212. [Google Scholar] [CrossRef]
  49. Stuhr, M.; Blank-Landeshammer, B.; Reymond, C.E.; Kollipara, L.; Sickmann, A.; Kucera, M.; Westphal, H. Disentangling thermal stress responses in a reef-calcifier and its photosymbionts by shotgun proteomics. Sci. Rep. 2018, 8, 3524. [Google Scholar] [CrossRef]
  50. Lee, J.J. Algal symbiosis in larger foraminifera. Symbiosis 2006, 42, 63–75. [Google Scholar]
  51. Lee, J.J.; McEnery, M.E.; ter Kuile, B.; Erez, J.; Röttger, R.; Rockwell, R.F.; Faber, W., Jr.; Lagziel, A.; Faber, W., Jr.; Lagziel, A. Identification and distribution of endosymbiotic diatoms in larger foraminifera. Micropaleontology 1989, 35, 353–366. [Google Scholar] [CrossRef]
  52. Prazeres, M.; Roberts, T.E.; Ramadhani, S.F.; Doo, S.S.; Schmidt, C.; Stuhr, M.; Renema, W. Diversity and flexibility of algal symbiont community in globally distributed larger benthic foraminifera of the genus Amphistegina. BMC Microbiol. 2021. in review. [Google Scholar]
  53. Hallock, P. Production of carbonate sediments by selected large benthic foraminifera on two Pacific coral reefs. J. Sediment. Petrol. 1981, 51, 467–474. [Google Scholar]
  54. ter Kuile, B.; Erez, J. In situ growth rate experiments on the symbiont-bearing foraminifera Amphistegina lobifera and Amphisorus hemprechii. J. Foraminifer. Res. 1984, 14, 262–276. [Google Scholar] [CrossRef]
  55. Segev, E.; Erez, J. Effect of Mg/Ca ratio in seawater on shell composition in shallow benthic foraminifera. Geochem. Geophys. Geosyst. 2006, 7, Q02P09. [Google Scholar] [CrossRef]
  56. Hallock, P. Distribution of selected species of living algal symbiont-bearing foraminifera on two Pacific coral reefs. J. Foraminifer. Res. 1984, 14, 250–261. [Google Scholar] [CrossRef]
  57. Renema, W. Terrestrial influence as a key driver of spatial variability in large benthic foraminiferal assemblage composition in the Central Indo-Pacific. Earth Sci. Rev. 2018, 177, 514–544. [Google Scholar] [CrossRef]
  58. Hallock, P.; Forward, L.B.; Hansen, H.J. Influence of environment on the test shape of Amphistegina. J. Foraminifer. Res. 1986, 16, 224–231. [Google Scholar] [CrossRef]
  59. Hansen, H.J.; Buchard, B. Depth distribution of Amphistegina in the Gulf of Elat, Israel. In Depth-Relationships of Recent Larger Foraminifera in the Gulf of Aqaba-Elat; Reiss, Z., Leutenegger, S., Hottinger, L., Fermont, W.J.J., Meulenkamp, J.E., Thomas, E., Hansen, H.J., Buchardt, B., Larsen, A.R., Drooger, C.W., Eds.; Micropaleontological Bulletins: Utrecht, The Netherlands, 1977; pp. 205–224. [Google Scholar]
  60. Cameron, L.P.; Reymond, C.E.; Bijma, J.; Büscher, J.V.; de Beer, D.; Eagle, R.T.; Gunnell, J.; Müller-Lundin, F.; Schmidt-Grieb, G.M.; Westfield, I.; et al. Impacts of warming and acidification on corals linked to symbiont abundance and pH-regulation. Preprints 2021. [Google Scholar] [CrossRef]
  61. Lee, J.; Erez, J.; ter Kuile, B.; Lagziel, A.; Burgos, S. Feeding rates of two species of larger foraminifera Amphistegina lobifera and Amphisorus hemprichii, from the Gulf of Eilat (Red Sea). Symbiosis 1988, 5, 61–102. [Google Scholar]
  62. Lee, J.J.; Sang, K.; ter Kuile, B.; Strauss, E.; Lee, P.J.; Faber, W.W. Nutritional and related experiments on laboratory maintenance of three species of symbiont-bearing, large foraminifera. Mar. Biol. 1991, 109, 417–425. [Google Scholar] [CrossRef]
  63. Lewis, E.; Wallace, D. Program Developed for CO2 System Calculations; Environmental Sciences Division publication: Oak Ridge, TN, USA, 1998. [Google Scholar]
  64. Roy, R.N.; Roy, L.N.; Vogel, K.M.; Portermoore, C.; Pearson, T.; Good, C.E.; Millero, F.J.; Campbell, D.M. The dissociation constants of carbonic acid in seawater at salinities 5 to 45 and temperatures 0 to 45 °C. Mar. Chem. 1993, 44, 249–267. [Google Scholar] [CrossRef]
  65. Mucci, A. The solubility of calcite and aragonite in seawater at various salinities, temperatures and one atmosphere total pressure. Am. J. Sci. 1983, 283, 780–799. [Google Scholar] [CrossRef]
  66. Cai, W.J.; Ma, Y.; Hopkinson, B.M.; Grottoli, A.G.; Warner, M.E.; Ding, Q.; Hu, X.; Yuan, X.; Schoepf, V.; Xu, H.; et al. Microelectrode characterization of coral daytime interior pH and carbonate chemistry. Nat. Commun. 2016, 7, 1–8. [Google Scholar] [CrossRef] [PubMed] [Green Version]
  67. Köhler-Rink, S.; Kühl, M. Microsensor studies of photosynthesis and respiration in larger symbiotic foraminifera. I The physico-chemical microenvironment of Marginopora vertebralis, Amphistegina lobifera and Amphisorus hemprichii. Mar. Biol. 2000, 137, 473–486. [Google Scholar] [CrossRef]
  68. de Beer, D.; Schramm, A.; Santegoeds, C.M.; Kühl, M. A nitrite microsensor for profiling environmental biofilms. Appl. Environ. Microbiol. 1997, 63, 973–977. [Google Scholar] [CrossRef] [PubMed] [Green Version]
  69. Bernhard, J.M. Distinguishing live from dead foraminifera: Methods review and proper applications. Micropaleontology 2000, 46, 38–46. [Google Scholar]
  70. Schindelin, J.; Arganda-Carreras, I.; Frise, E.; Kaynig, V.; Longair, M.; Pietzsch, T.; Preibisch, S.; Rueden, C.; Saalfeld, S.; Schmid, B.; et al. Fiji: An open-source platform for biological-image analysis. Nat. Methods 2012, 9, 676–682. [Google Scholar] [CrossRef] [Green Version]
  71. Hosono, T.; Fujita, K.; Kayanne, H. Estimating photophysiological condition of endosymbiont-bearing Baculogypsina sphaerulata based on the holobiont color represented in CIE L*a*b* color space. Mar. Biol. 2012, 159, 2663–2673. [Google Scholar] [CrossRef]
  72. Schwartzwald, D. Color Space Converter Plugin for Imagej. Available online: https://imagej.nih.gov/ij/plugins/color-space-converter.html (accessed on January 2017).
  73. Petersen, J.; Riedel, B.; Barras, C.; Pays, O.; Guihéneuf, A.; Mabilleau, G.; Schweizer, M.; Meysman, F.J.R.; Jorissen, F.J. Improved methodology for measuring pore patterns in the benthic foraminiferal genus Ammonia. Mar. Micropaleontol. 2016, 128, 1–13. [Google Scholar] [CrossRef]
  74. Benjamini, Y.; Hochberg, Y. Controlling the False Discovery Rate—A practical and powerful approach to multiple testing. J. R. Stat. Soc. Ser. B 1995, 57, 289–300. [Google Scholar] [CrossRef]
  75. Zhang, Z.; Schwartz, S.; Wagner, L.; Miller, W. A greedy algorithm for aligning DNA sequences. J. Comput. Biol. 2000, 7, 203–214. [Google Scholar] [CrossRef]
  76. Katoh, K.; Misawa, K.; Kuma, K.I.; Miyata, T. MAFFT: A novel method for rapid multiple sequence alignment based on fast Fourier transform. Nucleic Acids Res. 2002, 30, 3059–3066. [Google Scholar] [CrossRef] [PubMed] [Green Version]
  77. Hall, T.A. BioEdit: A user friendly biological sequence alignment editor and analysis program for Windows 95/98/NT. Nucleic Acids Symp. Ser. 1999, 41, 95–98. [Google Scholar]
  78. Glez-Peña, D.; Gómez-Blanco, D.; Reboiro-Jato, M.; Fdez-Riverola, F.; Posada, D. ALTER: Program-oriented conversion of DNA and protein alignments. Nucleic Acids Res. 2010, 38, 14–18. [Google Scholar] [CrossRef] [PubMed]
  79. Tamura, K.; Stecher, G.; Peterson, D.; Filipski, A.; Kumar, S. MEGA6: Molecular Evolutionary Genetics Analysis. Mol. Biol. Evol. 2013, 30, 2725–2729. [Google Scholar] [CrossRef] [PubMed] [Green Version]
  80. Vizcaíno, J.A.; Csordas, A.; Del-Toro, N.; Dianes, J.A.; Griss, J.; Lavidas, I.; Mayer, G.; Perez-Riverol, Y.; Reisinger, F.; Ternent, T.; et al. Update of the PRIDE database and its related tools. Nucleic Acids Res. 2016, 44, D447–D456. [Google Scholar] [CrossRef] [PubMed]
  81. Woehle, C.; Roy, A.-S.; Glock, N.; Wein, T.; Weissenbach, J.; Rosenstiel, P.; Hiebenthal, C.; Michels, J.; Schönfeld, J.; Dagan, T. A novel eukaryotic denitrification pathway in foraminifera. Curr. Biol. 2018, 28, 2536–2543. [Google Scholar] [CrossRef] [Green Version]
  82. Huerta-Cepas, J.; Szklarczyk, D.; Heller, D.; Hernández-Plaza, A.; Forslund, S.K.; Cook, H.; Mende, D.R.; Letunic, I.; Rattei, T.; Jensen, L.J.; et al. EggNOG 5.0: A hierarchical, functionally and phylogenetically annotated orthology resource based on 5090 organisms and 2502 viruses. Nucleic Acids Res. 2019, 47, 309–314. [Google Scholar] [CrossRef] [PubMed] [Green Version]
  83. Huerta-Cepas, J.; Forslund, K.; Coelho, L.P.; Szklarczyk, D.; Jensen, L.J.; Von Mering, C.; Bork, P. Fast genome-wide functional annotation through orthology assignment by eggNOG-mapper. Mol. Biol. Evol. 2017, 34, 2115–2122. [Google Scholar] [CrossRef] [Green Version]
  84. R Core Team. R: A Language and Environment for Statistical Computing; R Core Team: Vienna, Austria, 2016. [Google Scholar]
  85. Oakley, C.A.; Durand, E.; Wilkinson, S.P.; Peng, L.; Weis, V.M.; Grossman, A.R.; Davy, S.K. Thermal shock induces host proteostasis disruption and endoplasmic reticulum stress in the model symbiotic cnidarian Aiptasia. J. Proteome Res. 2017, 16, 2121–2134. [Google Scholar] [CrossRef]
  86. Sproles, A.E.; Oakley, C.A.; Matthews, J.L.; Peng, L.; Owen, J.G.; Grossman, A.R.; Weis, V.M.; Davy, S.K. Proteomics quantifies protein expression changes in a model cnidarian colonised by a thermally tolerant but suboptimal symbiont. ISME J. 2019, 13, 2334–2345. [Google Scholar] [CrossRef]
  87. Oksanen, J.; Blanchet, F.G.; Kindt, R.; Legendre, P.; Minchin, P.R.; O’Hara, R.B.; Simpson, G.L.; Solymos, P.; Stevens, M.H.H.; Wagner, H. Vegan: Community Ecology Package. Available online: https://cran.r-project.org/web/packages/vegan (accessed on May 2020).
  88. Hervé, M. Aide-Mémoire de Statistique Appliquée à la Biologie—Construire son Étude et Analyser les Résultats à L’aide du Logiciel R. Available online: https://cran.r-project.org/doc/contrib/Herve-Aide-memoire-statistique.pdf (accessed on January 2021).
  89. Barnes, K.H. Diversity and distribution of diatom endosymbionts in Amphistegina spp. (Foraminifera) based on molecular and morphological techniques; University of South Florida: Tampa, FL, USA, 2016. [Google Scholar]
  90. Doo, S.S.; Fujita, K.; Byrne, M.; Uthicke, S. Fate of calcifying tropical symbiont-bearing large benthic foraminifera: Living sands in a changing ocean. Biol. Bull. 2014, 226, 169–186. [Google Scholar] [CrossRef] [PubMed] [Green Version]
  91. McIntyre-Wressnig, A.; Bernhard, J.M.; McCorkle, D.C.; Hallock, P. Non-lethal effects of ocean acidification on two symbiont-bearing benthic foraminiferal species. Biogeosci. Discuss. 2011, 8, 9165–9200. [Google Scholar]
  92. Davies, S.W.; Ries, J.B.; Marchetti, A.; Castillo, K.D. Symbiodinium functional diversity in the coral Siderastrea siderea is influenced by thermal stress and reef environment, but not ocean acidification. Front. Mar. Sci. 2018, 5, 150. [Google Scholar] [CrossRef]
  93. González-Pech, R.A.; Vargas, S.; Francis, W.R.; Wörheide, G. Transcriptomic resilience of the Montipora digitata holobiont to Low pH. Front. Mar. Sci. 2017, 4, 403. [Google Scholar] [CrossRef] [Green Version]
  94. Tomanek, L. Proteomic responses to environmentally induced oxidative stress. J. Exp. Biol. 2015, 218, 1867–1879. [Google Scholar] [CrossRef] [Green Version]
  95. Cleves, P.A.; Shumaker, A.; Lee, J.M.; Putnam, H.M.; Bhattacharya, D. Unknown to known: Advancing knowledge of coral gene function. Trends Genet. 2020, 36, 93–104. [Google Scholar] [CrossRef] [PubMed]
  96. Mollica, N.R.; Guo, W.; Cohen, A.L.; Huang, K.F.; Foster, G.L.; Donald, H.K.; Solow, A.R. Ocean acidification affects coral growth by reducing skeletal density. Proc. Natl. Acad. Sci. USA 2018, 115, 1754–1759. [Google Scholar] [CrossRef] [PubMed] [Green Version]
  97. Leutenegger, S.; Hansen, H.J. Ultrastructural and radiotracer studies of pore function in foraminifera. Mar. Biol. 1979, 54, 11–16. [Google Scholar] [CrossRef]
  98. Kleypas, J.A.; Buddemeier, R.W.; Archer, D.; Gattuso, J.P.; Langdon, C.; Opdyke, B.N. Geochemical consequences of increased atmospheric carbon dioxide on coral reefs. Science 1999, 284, 118–120. [Google Scholar] [CrossRef]
  99. Ries, J.B.; Ghazaleh, M.N.; Connolly, B.; Westfield, I.; Castillo, K.D. Impacts of seawater saturation state (ΩA = 0.4–4.6) and temperature (10, 25 °C) on the dissolution kinetics of whole-shell biogenic carbonates. Geochim. Cosmochim. Acta 2016, 192, 318–337. [Google Scholar] [CrossRef] [Green Version]
  100. Travis, J.; Bowser, S. The motility of foraminifera. In Biology of Foraminifera; Academic Press: London, UK, 1991; pp. 91–155. [Google Scholar]
  101. Ter Kuile, B.; Erez, J.; Padan, E. Mechanisms for the uptake of inorganic carbon by two species of symbiont-bearing foraminifera. Mar. Biol. 1989, 103, 241–251. [Google Scholar] [CrossRef]
  102. Bentov, S.; Brownlee, C.; Erez, J. The role of seawater endocytosis in the biomineralization process in calcareous foraminifera. Proc. Natl. Acad. Sci. USA 2009, 106, 21500–21504. [Google Scholar] [CrossRef] [PubMed] [Green Version]
  103. Erez, J. The source of ions for biomineralization in foraminifera and their implications for paleoceanographic proxies (Review). Rev. Miner. Geochem. 2003, 54, 115. [Google Scholar] [CrossRef] [Green Version]
  104. Sutton, J.N.; Liu, Y.W.; Ries, J.B.; Guillermic, M.; Ponzevera, E.; Eagle, R.A. δ11B as monitor of calcification site pH in divergent marine calcifying organisms. Biogeosciences 2018, 15, 1447–1467. [Google Scholar] [CrossRef] [Green Version]
  105. Moya, A.; Huisman, L.; Ball, E.E.; Hayward, D.C.; Grasso, L.C.; Chua, C.M.; Woo, H.N.; Gattuso, J.P.; Forêt, S.; Miller, D.J. Whole transcriptome analysis of the coral Acropora millepora reveals complex responses to CO2-driven acidification during the initiation of calcification. Mol. Ecol. 2012, 21, 2440–2454. [Google Scholar] [CrossRef] [Green Version]
  106. Rocker, M.M.; Noonan, S.; Humphrey, C.; Moya, A.; Willis, B.L.; Bay, L.K. Expression of calcification and metabolism-related genes in response to elevated pCO2 and temperature in the reef-building coral Acropora millepora. Mar. Genom. 2015, 24, 313–318. [Google Scholar] [CrossRef]
  107. Kenkel, C.D.; Moya, A.; Strahl, J.; Humphrey, C.; Bay, L.K. Functional genomic analysis of corals from natural CO2-seeps reveals core molecular responses involved in acclimatization to ocean acidification. Glob. Chang. Biol. 2018, 24, 158–171. [Google Scholar] [CrossRef] [PubMed]
  108. Bellworthy, J.; Fine, M. Beyond peak summer temperatures, branching corals in the Gulf of Aqaba are resilient to thermal stress but sensitive to high light. Coral Reefs 2017, 36, 1071–1082. [Google Scholar] [CrossRef]
  109. Krueger, T.; Horwitz, N.; Bodin, J.; Giovani, M.-E.; Escrig, S.; Meibom, A.; Fine, M. Common reef-building coral in the northern Red Sea resistant to elevated temperature and acidification. R. Soc. Open Sci. 2017, 4, 170038. [Google Scholar] [CrossRef] [Green Version]
  110. Ries, J.B. Skeletal mineralogy in a high-CO2 world. J. Exp. Mar. Bio. Ecol. 2011, 403, 54–64. [Google Scholar] [CrossRef]
  111. Robbins, L.L.; Knorr, P.O.; Wynn, J.G.; Hallock, P.; Harries, P.J. Interpreting the role of pH on stable isotopes in large benthic foraminifera. ICES J. Mar. Sci. 2017, 74, 955–964. [Google Scholar] [CrossRef] [Green Version]
  112. Purton, L.M.A.; Brasier, M.D. Giant protist Nummulites and its Eocene environment: Life span and habitat insights from δ18O and δ13C data from Nummulites and Venericardia, Hampshire basin, UK. Geology 1999, 27, 711–714. [Google Scholar] [CrossRef]
  113. Weinmann, A.E.; Rödder, D.; Lötters, S.; Langer, M.R. Heading for new shores: Projecting marine distribution ranges of selected larger foraminifera. PLoS ONE 2013, 8, 14. [Google Scholar] [CrossRef]
  114. Kleinhaus, K.; Al-Sawalmih, A.; Barshis, D.J.; Genin, A.; Grace, L.N.; Hoegh-Guldberg, O.; Loya, Y.; Meibom, A.; Osman, E.O.; Ruch, J.-D.; et al. Science, diplomacy, and the Red Sea’s unique coral reef: It’s time for action. Front. Mar. Sci. 2020, 7, 00090. [Google Scholar] [CrossRef] [Green Version]
  115. Cohen, S.A.; Michaud, D.P. Synthesis of a fluorescent derivatizing reagent, 6-aminoquinolyl-N-hydroxysuccinimidyl carbamate, and its application for the analysis of hydrolysate amino acids via high-performance liquid chromatography. Anal. Biochem. 1993, 211, 279–287. [Google Scholar] [CrossRef] [PubMed]
  116. Shindo, N.; Nojima, S.; Fujimura, T.; Taka, H.; Mineki, R.; Murayama, K. Separation of 18 6-aminoquinolyl-carbamyl-amino acids by ion-pair chromatography. Anal. Biochem. 1997, 249, 79–82. [Google Scholar] [CrossRef]
  117. Manza, L.L.; Stamer, S.L.; Ham, A.-J.L.; Codreanu, S.G.; Liebler, D.C. Sample preparation and digestion for proteomic analyses using spin filters. Proteomics 2005, 5, 1742–1745. [Google Scholar] [CrossRef] [PubMed]
  118. Wisniewski, J.R.; Zougman, A.; Nagaraj, N.; Mann, M. Universal sample preparation method for proteome analysis. Nat. Methods 2009, 6, 359–362. [Google Scholar] [CrossRef]
  119. Kollipara, L.; Zahedi, R.P. Protein carbamylation: In vivo modification or in vitro artefact? Proteomics 2013, 13, 941–944. [Google Scholar] [CrossRef]
  120. Burkhart, J.M.; Schumbrutzki, C.; Wortelkamp, S.; Sickmann, A.; Zahedi, R.P. Systematic and quantitative comparison of digest efficiency and specificity reveals the impact of trypsin quality on MS-based proteomics. J. Proteom. 2012, 75, 1454–1462. [Google Scholar] [CrossRef] [PubMed]
  121. Olsen, J.V.; de Godoy, L.M.; Li, G.; Macek, B.; Mortensen, P.; Pesch, R.; Makarov, A.; Lange, O.; Horning, S.; Mann, M. Parts per million mass accuracy on an Orbitrap mass spectrometer via lock mass injection into a C-trap. Mol. Cell. Proteom. 2005, 4, 2010–2021. [Google Scholar] [CrossRef] [PubMed] [Green Version]
  122. Zhang, J.; Xin, L.; Shan, B.; Chen, W.; Xie, M.; Yuen, D.; Zhang, W.; Zhang, Z.; Lajoie, G.A.; Ma, B. PEAKS DB: De novo sequencing assisted database search for sensitive and accurate peptide identification. Mol. Cell. Proteom. 2012, 11, 010587. [Google Scholar] [CrossRef] [Green Version]
  123. Huang, Y.; Niu, B.; Gao, Y.; Fu, L.; Li, W. CD-HIT Suite: A web server for clustering and comparing biological sequences. Bioinformatics 2010, 26, 680–682. [Google Scholar] [CrossRef] [PubMed]
Figure 1. Changes in (a) ∆[H+], i.e., the difference in proton concentration between the seawater (sw) and the test surface (ts) (n ≤ 3) and (b) pH at the test surface of Amphistegina lobifera and the seawater (blue rectangles) in response to pCO2 crossed with 28 °C (open) or 31 °C (filled), measured by pH microelectrode during exposure to light (yellow diamonds) and dark (grey circles). (a) PERMANOVA p-values are given for two-way analysis of the effects of pCO2 (C = 492 ppm, M = 963 ppm, H = 3182 ppm) and temperature (T: 28 °C, 31 °C), as well as for one-way analysis of the effect of light vs. dark. Bold values indicate significant effects (p < 0.05). Treatments lacking common capital letters are significantly different in pair-wise comparison of all ∆[H+], corrected for multiple testing at an FDR threshold of 0.1. (b) Lines represent linear regressions for each treatment under light/dark conditions, with R2 indicating coefficient of correlation and respective p-values of F-test statistic (n ≤ 3).
Oceans 02 00017 g001
Figure 2. Changes in chlorophyll a (chl a) and CIE L*a*b* color space values of the Amphistegina lobifera indicate photosymbiont performance in response to elevated pCO2 (C = 492 ppm, M = 963 ppm, H = 3182 ppm) crossed with 28 °C and 31 °C. (a) Chl a concentration is a proxy for photosymbiont biomass (n = 3), (b) L* is a measure of whiteness (n = 4), (c) a* is a measure of green (-) to magenta (+) (n = 4), and (d) b* is a measure of blue (-) to yellow (+) (n = 4). Bar plots represent means with standard errors. Two-way ANOVA p-values are given in the respective panels, with bold values indicating significant effects. Treatments lacking common capital letters are significantly different in the respective post-hoc multiple comparison (Tukeys’ HSD test), with marginal significance if grey.
Oceans 02 00017 g002
Figure 3. Changes in key physiological parameters of the Amphistegina lobifera host in response to elevated pCO2 (C = 492 ppm, M = 963 ppm, H = 3182 ppm) crossed with temperature (28 °C, 31 °C): (a) growth rate calculated as the daily %-change in total surface area (n = 4), (b) average pore sizes of the terminal chambers of their tests (n ≥ 8), (c) mortality represented by proportion of dead (empty) tests, resulting from age-, stress-, and/or reproduction-induced death, and (d) breakage represented by frequency of broken specimens, probably due to reduced test strength. (a,b) Box plots indicate median and interquartile ranges, with total ranges represented by vertical bars. Two-way ANOVA p-values are given, with bold values indicating significant effects (p ≤ 0.05). Treatments lacking common capital letters are significantly different in the respective post-hoc multiple comparison (Tukeys’ HSD test). (c,d) Dot-and-whisker plots indicate means and standard errors. Logistic model p-values for frequency data are given, with marginal significance indicated by grey.
Oceans 02 00017 g003
Figure 4. Representative images of Amphistegina lobifera after 8-week exposure to elevated pCO2 (control = 492 ppm, a,d; moderate = 963 ppm, b,e; high = 3182 ppm, c,f) crossed with temperature (28 °C, ac; 31 °C, df). Entire specimens shown via light microscopy (upper rows) and low-magnification SE imaging (middle rows), with the terminal chamber shown via high-magnification SE imaging. Scale bars in the full-specimen images represent 500 µm, while bars in high-magnification images represent 50 µm.
Oceans 02 00017 g004
Figure 5. Summary of the proteomic results: (a) proportion of all identified proteins (n = 1103) and differentially abundant proteins (DAPs, n = 173) in Amphistegina lobifera holobionts that were assigned to the foraminiferal host, their photosymbiotic diatoms, or both; (b) proportion of DAPs per treatment of elevated pCO2 (C = 492 ppm, M = 963 ppm, H = 3182 ppm) at 28 °C or 31 °C in the host (outer) and the photosymbionts (inner); (c) hierarchical cluster analyses based on average linkage and heatmap where rows represent DAPs and columns represent the log-transformed average of three replicates per treatments, and the left column indicates if the protein was associated with the host (brown), photosymbionts (green), or both (grey); (d) principal component analysis biplot on correlation of all DAPs, with letters connected by triangles indicating the replicate samples of each treatment combination of different pCO2 at control (blue) or high (red) temperature, and dots indicating the DAPs (colors as in (c)) as loading variables.
Oceans 02 00017 g005
Figure 6. Principal component analyses of total normalized abundance values of the functional categories of (a) photosymbiont- and (b) host-associated DAPs in Amphistegina lobifera exposed to treatments of elevated pCO2 (‘C’ = 492 ppm, ‘M’ = 963 ppm, ‘H’ = 3182 ppm) at 28 °C (blue) or 31 °C (red). Arrows indicate the direction and intensity of functional categories driving differences between the treatments, with triangles connecting the triplicate samples of each treatment (legend as in Figure 5).
Oceans 02 00017 g006
Table 1. Mean physical and chemical conditions ± SD in the different treatments of elevated pCO2 (C = 492 ppm, M = 963 ppm, H = 3182 ppm) crossed with 28 °C and 31 °C. Temperature = T, dissolved organic carbon = DIC, total alkalinity = TA, pH on seawater scale = pHSW, pCO2 of gas in equilibrium with seawater = pCO2, calcite saturation state = ΩC, and aragonite saturation state = ΩA. Additional data on water conditions are provided in Table S1.
TreatmentT (°C)DIC (µM)TA (µM)pHSWpCO2 (ppm)ΩCΩA
C2828.2 ± 0.22562 ± 2882928 ± 2808.21 ± 0.10483 ± 868.5 ± 1.25.5 ± 1.2
C3131.0 ± 0.62375 ± 2832738 ± 2788.11 ± 0.13500 ± 748.1 ± 1.34.8 ± 1.2
M2828.0 ± 0.12686 ± 2852937 ± 2587.95 ± 0.07973 ± 1385.9 ± 2.63.7 ± 1.9
M3130.9 ± 0.22806 ± 2543088 ± 2337.98 ± 0.07953 ± 1316.6 ± 0.54.2 ± 0.6
H2828.0 ± 0.22858 ± 4302908 ± 4567.49 ± 0.112934 ± 8982.3 ± 0.41.4 ± 0.4
H3130.9 ± 0.13231 ± 2813294 ± 3247.50 ± 0.103431 ± 8102.9 ± 0.41.8 ± 0.5
Table 2. Results of permutational multivariate analysis of variance (PERMANOVA) for all proteins, and for only host or only photosymbiont proteins of Amphistegina lobifera exposed to elevated pCO2 (C = 492 ppm, M = 963 ppm, H = 3182 ppm) crossed with temperature (Temp.: 28 °C, 31 °C) for eight weeks. Pairwise comparisons of significant effects were per performed with p-values adjusted for multiple testing. Bold font indicates statistical significance (p ≤ 0.05).
ProteinsDFMSFPr (>F)Post-Hoc Test Summary
Holobiont
pCO220.00031.8180.028H:C 0.480, M:C 0.290, H:M 0.130
Temp.10.00042.3350.01331 °C:28 °C 0.080
pCO2×Temp.10.00031.7190.075
Foraminifera
pCO220.00031.8540.030H:C 0.390 M:C 0.270, H:M 0.170
Temp.10.00042.3580.01831 °C:28 °C 0.079
pCO2×Temp.10.00031.6970.091
Photosymbiont
pCO220.00041.7750.030H:C 0.607, M:C 0.321, H:M 0.091
Temp.10.00052.3240.01131 °C:28 °C 0.089
pCO2×Temp.10.00041.7340.067
Table 3. Regulated proteins of photosymbionts of Amphistegina lobifera in response to elevated pCO2 (‘C’ = 492 ppm, ‘M’ = 963 ppm, ‘H’ = 3182 ppm) at 28 °C or 31 °C, without the C28 treatment (GLM, q ≤ 0.05, Tukeys’ p ≤ 0.05, and log2FC ≥ |1|). Proteins are arranged by their major functions and processes according to GO terms, however, these roles are not exclusive as many proteins can have various functions. Directions and intensities of log2FC are illustrated by color, significant differences in average protein abundance between treatments are denoted in bold. Respective annotated gene ontologies, accession numbers, and remaining DAPs are provided in Table S6.
Protein DescriptionLog2(Fold-Change)
M31/
M28
H31/
H28
H28/
M28
H31/
M31
M31/
C31
H31/
C31
M31/
H28
C31/
M28
H31/
M28
C31/
H28
Light-harvesting and photosynthesis
protein fucoxanthin chlorophyll a/c −2.34−0.270.052.11−2.63−0.51−2.380.29−0.220.24
protein fucoxanthin chlorophyll a/c −1.900.15−0.191.86−2.12−0.25−1.710.21−0.040.40
divinyl chlorophyllidea 8-vinyl-reduct.−2.600.81−0.482.93−2.560.37−2.12−0.040.330.44
thylakoid lumenal 15.0 kDa protein 2−1.03−0.09−0.160.78−0.760.02−0.87−0.28−0.25−0.12
cytochrome b6/f complex subunit IV−3.18−0.17−4.64−1.644.272.631.46−7.45−4.81−2.81
Metabolic and biosynthetic processes
uroporphyrinogen decarboxylase−4.78−2.04−0.751.99−3.61−1.62−4.03−1.16−2.79−0.41
fructose-bisphosphate aldolase−2.03−0.510.111.63−2.28−0.65−2.140.25−0.400.14
demethylmenaquinone methyltransfer.−2.36−0.710.111.75−2.24−0.49−2.46−0.12−0.60−0.22
3-isopropylmalate dehydrogenase−2.94−0.52−0.511.90−1.560.34−2.43−1.38−1.04−0.87
glucose-6-phosphate isomerase−1.140.47−0.091.53−1.080.44−1.05−0.050.390.03
cysteine desulfurase−0.260.540.651.46−0.580.88−0.910.321.19−0.34
taurine catabolism dioxygenase TauD−0.75−0.88−0.51−0.63−1.58−2.21−0.250.82−1.391.33
alanine dehydrogenase 2−1.00−0.430.030.60−0.470.12−1.03−0.52−0.40−0.55
inorganic pyrophosphatase−0.72−0.440.300.58−0.61−0.03−1.02−0.12−0.14−0.41
inorganic pyrophosphatase−0.79−0.63−0.030.130.000.13−0.76−0.79−0.66−0.76
phosphoadenosine-phosphosulphate red.−0.36−1.080.27−0.450.11−0.33−0.63−0.47−0.81−0.75
S-adenosylmethionine synthase 20.65−0.250.20−0.701.030.330.45−0.38−0.05−0.58
geranylgeranyl reductase0.57−0.41−0.13−1.111.04−0.070.70−0.47−0.53−0.34
carbamoyl-phosphate synthase−0.62−0.75−0.41−0.53−0.45−0.98−0.22−0.17−1.150.24
acetyl-coa carboxylase−0.46−1.05−0.11−0.71−0.25−0.96−0.34−0.21−1.17−0.09
acetyl-coa carboxylase−0.20−1.04−0.09−0.93−0.15−1.08−0.11−0.05−1.130.04
ALA dehydratase−0.55−0.95−0.72−1.120.30−0.820.17−0.85−1.67−0.13
agmatinase−1.540.40−1.190.75−0.100.65−0.35−1.44−0.79−0.24
glutamate synthase 2 [NADH]−0.65−1.42−0.97−1.740.87−0.870.32−1.52−2.40−0.55
aspartate--ammonia ligase1.660.160.30−1.201.740.541.36−0.090.45−0.38
Proton transmembrane transport, cell redox homeostasis and cellular detoxification
thioredoxin−1.080.38−0.281.18−1.65−0.47−0.800.560.100.85
L-ascorbate peroxidase−0.17−1.110.45−0.500.16−0.34−0.62−0.32−0.66−0.77
Protein folding, phosphorylation and transport
translocation protein sec62−2.440.03−0.182.28−1.740.54−2.25−0.69−0.16−0.51
T-complex protein 1 subunit eta−0.771.250.752.77−1.531.24−1.520.762.000.01
leucine-rich repeat-containing protein1.321.071.130.88−1.27−0.390.192.592.201.46
ATP-dependent chaperone ClpB1.290.120.34−0.830.840.000.950.460.460.11
luminal-binding protein 50.22−0.56−0.24−1.030.67−0.360.46−0.45−0.81−0.21
Proteolysis and autophagy
Clp protease ATP binding subunit0.37−0.39−0.27−1.040.42−0.620.64−0.05−0.670.23
Translation and related process
40S ribosomal protein0.24−0.72−0.52−1.490.76−0.730.77−0.51−1.240.01
Cytoskeleton and microtubule-based processes
cell division protein FtsZ−2.180.06−0.861.38−1.92−0.54−1.32−0.26−0.800.60
tubulin-specific chaperone d−2.15−0.40−0.341.42−1.78−0.37−1.82−0.37−0.74−0.04
Unknown functions
hypothetical protein−1.540.78−1.740.57−0.64−0.060.21−0.90−0.960.84
Table 4. Regulated proteins of host foraminifera Amphistegina lobifera in response to elevated pCO2 (‘C’ = 492 ppm, ‘M’ = 963 ppm, and ‘H’ = 3182 ppm) at 28 °C or 31 °C, without the C28 treatment (GLM, q ≤ 0.05, Tukeys’ p ≤ 0.05, and log2FC ≥ |1|). Proteins are arranged by their major functions and processes according to GO terms; however, these roles are not exclusive as many proteins can have various functions. Directions and intensities of log2FC are illustrated by color, significant differences in average protein abundance between treatments are denoted in bold. Respective annotated gene ontologies, accession numbers, and remaining DAPs are provided in Table S6.
Protein DescriptionLog2(Fold-Change)
M31/
M28
H31/
H28
H28/
M28
H31/
M31
M31/
C31
H31/
C31
M31/
H28
C31/
M28
H31/
M28
C31/
H28
Signal transduction and regulation
NEDD8-activating enzyme E1 regulat.−2.340.420.353.11−3.080.03−2.690.740.770.39
cullin-associated NEDD8-dissociated 1−1.170.280.091.53−2.20−0.66−1.261.030.370.94
Ras-related protein Rab-21−1.080.55−0.151.48−1.76−0.27−0.930.680.400.83
GTPase HRas−0.691.330.142.15−1.840.31−0.821.161.461.02
Ras-related protein Rab-7a-like−1.370.74−0.831.28−1.34−0.05−0.55−0.04−0.090.79
cytochrome c oxidase assembly (SCO)−1.120.32−0.281.15−0.920.23−0.84−0.200.030.09
guanine nucleotide-binding protein G−1.110.35−0.960.50−0.79−0.29−0.15−0.32−0.610.63
Metabolic and biosynthetic processes
long-chain-fatty-acid--CoA ligase−5.28−0.681.285.88−5.410.47−6.560.130.60−1.15
aldo/keto reductase−2.87−0.39−0.052.43−2.96−0.54−2.820.09−0.440.15
fructose-bisphosphate aldolase 6−1.47−0.190.191.47−1.65−0.18−1.660.180.00−0.01
glutathione S-transferase−1.340.17−0.241.27−1.60−0.33−1.100.26−0.070.50
methylglutaconyl-CoA hydratase−1.12−0.21−0.140.77−1.38−0.61−0.980.26−0.340.40
oligosaccharyltransferase complex−1.330.39−0.121.59−1.010.58−1.20−0.320.27−0.19
putative glyoxalase I−2.13−0.47−0.481.18−1.56−0.38−1.65−0.57−0.95−0.09
UDP-glucose 4-epimerase−1.15−0.590.080.64−0.89−0.25−1.23−0.26−0.51−0.34
asparagine synthetase −0.690.29−0.310.67−1.42−0.75−0.380.73−0.021.05
isocitrate dehydrogenase [NADP]0.08−0.650.72−0.020.390.37−0.64−0.310.06−1.02
cytochrome b-c1 complex subu. Rieske−0.08−1.570.95−0.540.810.27−1.03−0.89−0.62−1.84
cytochrome c oxidase subunit 5b-1−0.17−1.250.43−0.650.57−0.08−0.60−0.74−0.82−1.17
2-oxoglutarate dehydrogenase0.17−1.080.35−0.900.70−0.20−0.18−0.53−0.73−0.88
adenylyl-sulfate kinase0.16−0.75−0.34−1.260.72−0.530.51−0.56−1.09−0.22
NADH dehydrogenase flavoprotein 10.89−0.800.72−0.971.090.120.17−0.20−0.08−0.92
phytanoyl-CoA dioxygenase1.12−0.40−0.10−1.611.37−0.241.22−0.25−0.49−0.15
fatty acyl-CoA synthetase0.97−0.34−0.23−1.551.570.021.20−0.60−0.58−0.37
UDP-glucose 4-epimerase GalE2.33−0.992.50−0.820.62−0.20−0.171.711.51−0.79
Proton transmembrane transport, cell redox homeostasis and cellular detoxification
peroxiredoxin-1−1.280.57−0.731.13−0.400.73−0.56−0.88−0.15−0.15
Protein folding, phosphorylation and transport
phage shock protein A homolog−1.650.64−0.481.82−1.440.37−1.17−0.210.160.27
synaptobrevin domain-containing prot.−0.090.89−0.780.20−0.62−0.420.690.540.121.31
CAMK/CDPK protein kinase−0.07−0.13−1.20−1.270.51−0.761.13−0.58−1.330.62
sorting nexin 11.19−0.490.05−1.630.88−0.751.140.32−0.440.26
chaperone protein1.510.290.24−0.981.460.491.270.040.53−0.19
mitochondrial carrier family−0.24−1.941.53−0.18−0.08−0.25−1.76−0.16−0.42−1.69
Proteolysis and autophagy
oligopeptidase B−2.93−2.720.020.23−1.85−1.62−2.95−1.08−2.70−1.10
ubiquitin carboxyl-terminal hydrolase −0.42−0.410.770.77−0.80−0.02−1.190.380.35−0.39
mitochondrial-processing peptidase0.00−0.810.79−0.020.380.36−0.79−0.39−0.03−1.18
mitochondrial-processing peptidase 0.22−0.920.75−0.400.690.29−0.53−0.47−0.18−1.22
ubiquitin carboxyl-terminal hydrolase 0.66−0.50−0.17−1.320.68−0.650.83−0.02−0.660.15
guanine nucleotide-binding protein 0.50−1.430.27−1.650.97−0.680.23−0.47−1.16−0.74
autophagy-related protein 31.010.32−0.21−0.901.340.441.22−0.330.11−0.12
COP9 signalosome complex subunit 5−0.52−0.53−1.26−1.280.40−0.870.74−0.92−1.800.34
Translation and related process
40S ribosomal protein S20−1.57−1.730.00−0.17−0.69−0.86−1.56−0.88−1.74−0.88
60S ribosomal protein L9-like−1.07−0.950.300.42−0.46−0.04−1.37−0.61−0.65−0.91
60S ribosomal protein L12−0.64−0.470.400.56−0.330.23−1.04−0.30−0.07−0.71
60S acidic ribosomal protein P0-like0.07−1.340.70−0.700.48−0.22−0.64−0.41−0.63−1.12
ribonuclease P protein subunit p25-like−0.28−0.93−0.25−0.900.75−0.15−0.03−1.03−1.18−0.78
ribonucleoside-diphosphate reductase0.59−2.642.08−1.150.76−0.39−1.49−0.17−0.56−2.24
60S ribosomal protein L50.98−1.930.52−2.381.23−1.150.45−0.25−1.40−0.78
guanine nucleotide-binding protein 1.01−1.33−0.13−2.461.78−0.681.13−0.77−1.46−0.65
ATP-dependent RNA helicase ddx62.86−0.740.15−3.441.48−1.962.701.37−0.581.22
Cytoskeleton and microtubule-based processes
tubulin alpha-3 chain−0.02−0.760.72−0.020.280.26−0.74−0.30−0.04−1.02
villin-21.250.41−0.57−1.411.08−0.331.820.17−0.150.74
dynein heavy chain1.500.39−0.28−1.381.660.281.77−0.160.120.12
clathrin light chain-like0.48−1.01−0.52−2.021.36−0.661.01−0.88−1.53−0.35
dynein intermediate chain 3, ciliary4.61−3.844.99−3.464.110.65−0.380.501.15−4.49
Unknown functions
tartrate-resistant acid phosphatase ty. 5−2.28−1.511.191.95−2.80−0.85−3.470.52−0.33−0.66
hypothetical protein−1.080.40−0.111.37−1.53−0.16−0.970.450.290.56
hypothetical protein−1.62−0.57−0.031.02−1.51−0.49−1.59−0.11−0.60−0.08
hypothetical protein RFI_01644, partial−0.320.620.131.07−0.910.16−0.450.590.750.46
hypothetical protein−0.920.56−0.361.12−0.880.24−0.56−0.050.190.31
RING zinc finger-containing protein0.83−0.46−0.14−1.431.19−0.240.97−0.36−0.60−0.22
hypothetical protein RFI_36204, partial−3.22−0.89−2.230.100.160.26−0.99−3.38−3.12−1.15
Publisher’s Note: MDPI stays neutral with regard to jurisdictional claims in published maps and institutional affiliations.

