Article

Quantification of the Influence of Prosthetic Ankle Stiffness on Static Balance Using Lower Limb Prosthetic Simulators

1
Institut de Biomécanique Humaine Georges Charpak, Arts et Métiers Institute of Technology and HESAM University, 75013 Paris, France
2
Institut de Mécanique et d’Ingénierie UMR 5295, Bordeaux INP, Université de Bordeaux, Arts et Métiers Institute of Technology, CNRS, INRA and HESAM University, 33405 Talence, France
*
Author to whom correspondence should be addressed.
Prosthesis 2022, 4(4), 636-647; https://doi.org/10.3390/prosthesis4040051
Submission received: 14 September 2022 / Revised: 28 October 2022 / Accepted: 31 October 2022 / Published: 8 November 2022
(This article belongs to the Special Issue Design, Control, and Biomechanics of Prosthetic Limbs)

Abstract

:
After a transtibial amputation, the prosthetic foot aims at replacing the missing ankle joint. Due to alteration of proprioception and mobility, the static balance of amputees is challenging. The stiffness of most of the usual prosthetic feet cannot adapt according to the situation. Thus, the control of the user’s balance is closely related to the ankle stiffness value. The aim of this study is to evaluate both the impact of the ankle stiffness and the visual system on static balance. In order to avoid bias relative to different levels of residual proprioception among individuals, the study has been carried out on healthy subjects wearing lower limb prosthetic simulators under each foot. This configuration could be considered as a relevant model to isolate the effect of the stiffness. Eleven subjects wearing prosthetic feet with different modules were asked to remain as static as possible both with open eyes (OE) and closed eyes (CE). The center of pressure (COP) displacements and the joint angles range of motion (ROM) were experimentally assessed. The length of the major axis of the COP 95% confidence ellipse was projected on the antero-posterior direction (AP range). Linear regression models of the AP range and joint angles ROM as a function of the situation (OE and CE) and of the normalized ankle stiffness were created. A one-way analysis of variance test was performed on the model of the AP range. Linear regression coefficients and 95% confidence intervals (CI) were calculated between the AP range and the normalized ankle stiffness and between the joint angles ROM and the normalized ankle stiffness both in OE and CE. This study confirmed that static balance decreases when ankle stiffness decreases. The results also showed that a visual system alteration amplifies more significantly the decrease of static balance of people wearing prosthetic feet and has no significant influence on non-amputated subjects. The slope of the linear regression for the AP range according to the normalized ankle stiffness was equal to −9.86 (CI: −16.03, −3.69) with CE and −2.39 (CI: −4.94, 0.17) with OE. Both the normalized ankle stiffness and the visual system had a significant impact on the AP range ( p v a l u e < 0.05 ). The ankle stiffness is an interesting parameter as it has a high impact on the gait and on the static balance of the users and it must be controlled to properly design prosthetic feet.

1. Introduction

According to Ziegler-Graham et al. [1], 1.6 million Americans were living with an amputated limb in 2005, and this number was projected to double by 2050. This study also reported that 65% of these people underwent a lower limb amputation. Lower limb prostheses are a mean for patients to regain functions such as walking, static standing at rest and performing daily life activities [2].
Amputation results in the loss of segments, affects the sensorimotor system [3] and causes a deficit of the overlying muscles [4,5], which affects the subject’s static balance. The standing balance is also affected by other parameters directly related to the patient, such as the level of fatigue, the causes of amputation or the level of amputation [6].
The balance of people with amputation was first studied by quantifying the postural sway of the subjects [7]. Winter et al. [8] defined the balance as a generic term describing the dynamics of body posture to prevent falling and modeled the human balance during quiet standing using an inverted pendulum model. Thus, the static balance is defined as the ability to keep the vertical projection of the center of mass (COM) within the base of support. According to the inverted pendulum model, the center of pressure (COP) is defined as the point of location of the vertical ground reaction force vector [8]. Hof et al. [9] described three mechanisms allowing humans to maintain their balance: the ankle, the hip and the stepping strategies. The ankle strategy allows them to maintain the balance by moving the COP, the hip strategy by counter rotating the segments around the COM, and the stepping strategy by applying an external force.
The Energy Storing And Return (ESAR) prosthetic feet are generally used nowadays, and their deforming blades replace the ankle joint. Winter et al. [10] proposed an inverted pendulum model to quantify the static balance with a torsional spring modeling the ankle joint. The angular stiffness of the spring and therefore of the ankle influences the body sway. The ankle stiffness is defined as the coefficient of the linear regression linking the ankle angle to the ankle moment of dorsiflexion. This model provides equations describing the COM motion, and thus it allows us to define the COM positions ensuring stable equilibrium as a function of the rotational spring angular stiffness. Thus, a critical value of the angular stiffness allowing users’ static balance is stated.
For non-amputee subjects, the value of the ankle stiffness can be varied by modifying the muscular contraction of the flexor/extensor muscles of the ankle joint such as the triceps surae muscles. The stiffness necessary to sway, for example, is higher than the stiffness to walk [11]. Thus, the stiffness of the ankle prosthesis must be a compromise to allow support and balance in static and mobility during walking.
Therefore, the stiffness of the prosthesis is an important parameter in the absence of active control, as it must be a compromise to properly design prosthetic feet. The impact of ankle stiffness on walking has been studied extensively in the literature [12,13,14,15,16,17,18]. Ankle stiffness impacts gait performances as it influences range of motion (ROM), energy storage and release, muscle activity [12,14], drop off effect [13,15], metabolic cost [16] and gait stability [17].
Static postural balance could be measured by asking subjects to stay static [19] while dynamic postural balance could be measured by asking subjects to move their COM along different directions (backward, forward, left and right) as far as possible without losing their balance (i.e., take a step or touch the environment) [20,21,22,23]. The parameters that were the most often studied to quantify the balance are those related to the COP (excursion, velocity, amplitude, etc.) [19] and to the COM (position, margin of stability, etc.) [19,24]. The base of support, the angles and the moments at the ankle and hip joints, the distribution of loads, the muscular activity are also parameters related to the subject which influence the balance; however, they were rarely studied [19,25]. The calculation of COM trajectory by the double integration of COM acceleration according to the Newton’s second law can generate errors and the calculation by a complex inertial model would have been impacted by the lower limb prosthetic simulators. The COP positions are obtained directly by the force plates. For these reasons, in the following study, the COP was used to quantify the static balance.
For people with amputation, parameters related to the prosthesis such as the alignment [26], the radius of curvature [27] and if the prosthesis is active or passive have also an impact on the static balance. The ankle stiffness also has an impact on the static balance, but it still represents a subject deserving further investigations. Nederhand et al. [28] showed that there was a significant positive correlation between the prosthetic ankle stiffness and the balance control. In this study, the subjects wore their usual prosthesis and in the case of the transfemoral amputee subjects, their usual knee. Thus, as the ankle stiffness had not been systematically modified, it is not possible to isolate the influence of stiffness; indeed, parameters intrinsic to the prosthesis such as its shape also had an impact on the balance control.
The ankle stiffness has an influence on balance, and it must be controlled to properly design prostheses. Thus, the aim of this article is to quantify the impact of a systematic variation of ankle stiffness on static balance for asymptomatic subjects wearing prosthetic simulators. The visual alteration was already shown to affect the postural balance for the ESAR prosthetic feet [29]. So, we also propose to investigate if the visual alteration more significantly impacts the correlation between ankle stiffness and static balance than without alteration. The following study has been carried out on healthy subjects wearing lower limb prosthetic simulators under each foot, allowing able-bodied subjects to test the prostheses [30]. The amputation leads to an alteration of the proprioception, and this alteration has an influence on the static balance. The main idea behind this study is to exploit the prosthetic simulators to study the impact of the prosthetic feet on the static balance without proprioception alteration due to the amputation. According to Nederhand et al. [28], the subjects compensated the loss of balance due to the amputation by transferring the control of their balance on the non-amputated leg. Thus, the prosthetic simulators also allow us to symmetrize the prostheses, as the subjects wear the same prosthesis under each foot, and avoid the user compensating for the loss of balance with their non-amputated leg. Thus, it was possible to isolate the impact of prosthetic stiffness on the subject’s balance.

2. Methods

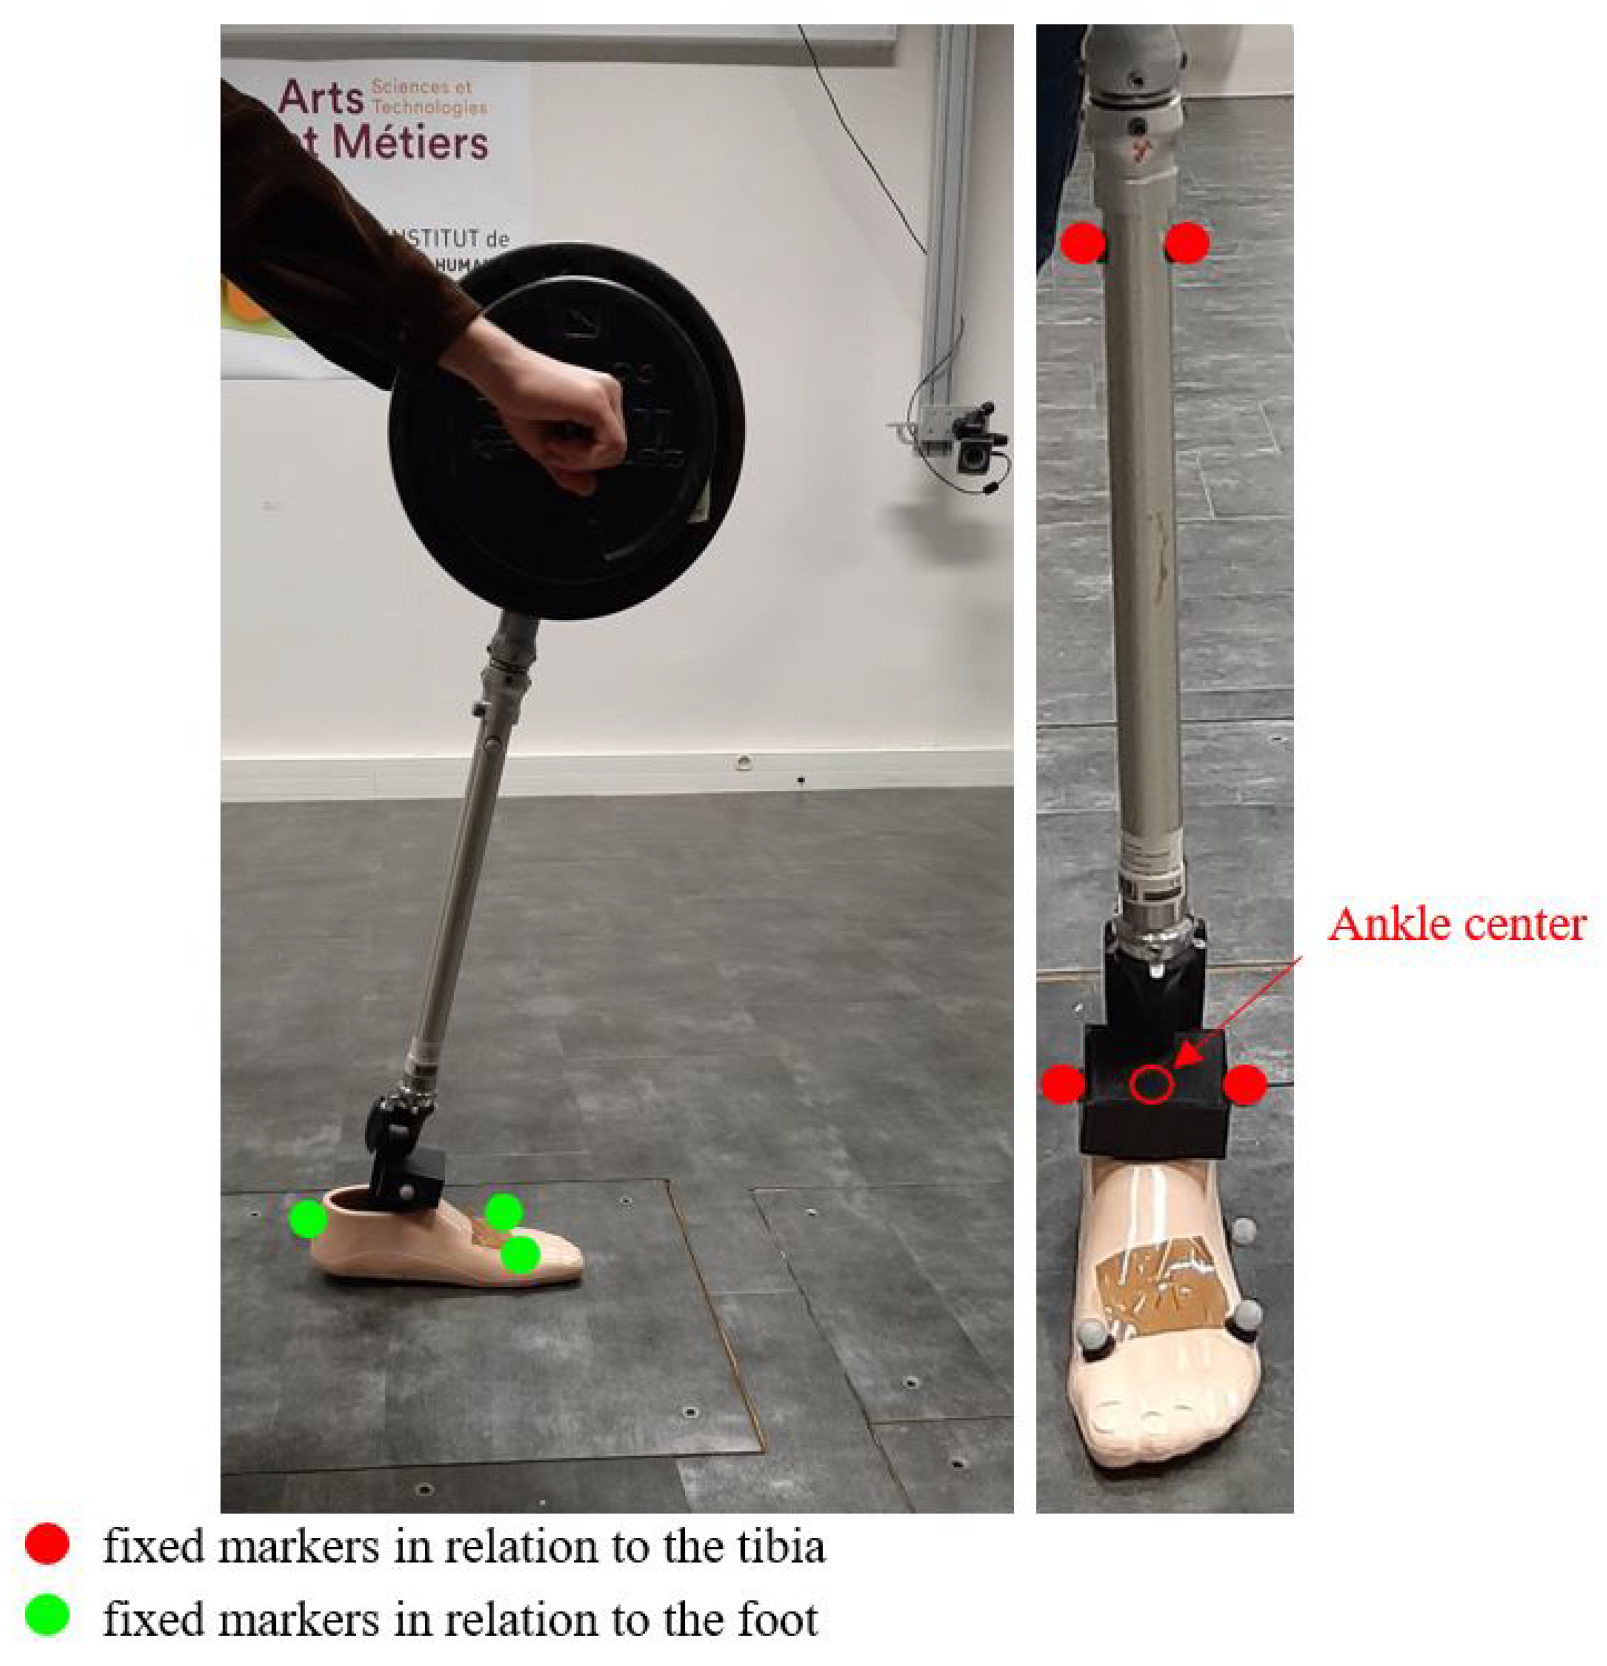
2.1. Stiffness Characterization

The studied prostheses were ESAR prosthetic feet (Dynatrek, Proteor 1A600) with three different modules: M1, M3 and M6. For a subject with a normal activity level, the M1, M3 and M6 prostheses are adapted to subjects with a mass ranging from 45 to 59 kg, 75 to 89 kg and 125 to 150 kg, respectively.
The Dynatrek prostheses were mounted on a pylon surmounted by two weights of 20 kg each (Figure 1). The prosthesis and the pylon were equipped with 8 markers to calculate the foot and tibia frames. An operator performed a minimum of 7 forward and backward movements along the antero-posterior (AP) direction, according to the method proposed by Curtze et al. [31].
Motion capture was made with an opto-electronic system Vicon at 200 Hz and synchronized with the acquisition of ground reaction forces and torques with synchronized AMTI force plates. The ankle moment of dorsiflexion was expressed in the tibia frame at the center of the malleolus (see Figure 1). For each prosthetic foot module and for each forward and backward movement, the ankle stiffness was defined as the coefficient of the linear regression linking the ankle angle to the ankle moment of dorsiflexion [32]. The mean and the standard deviation (sd) of the ankle stiffness were calculated on all forward and backward movements for each prosthetic module.
According to the inverted pendulum model with a torsional spring modeling the ankle joint, Winter et al. [10] defined an angular critical stiffness, which is the minimal stiffness allowing the static balance based on the equation of the COM motion with small angles approximation. This critical stiffness is equal to:
K c r i t = m t o t g h C O M
with m t o t being the total mass of the subject including the prosthetic simulators, g the constant of gravity and h C O M the height of the COM of the subject evaluated by taking into account the height of the prosthetic simulators. The total mass of the subject was assessed thanks to the force plates, and the COM height was assessed with the barycenters of the body segments [33]. For each subject, K c r i t was quantified. For each subject/prosthetic module, the prosthetic ankle stiffness was normalized by the subject’s critical stiffness. For each subject and prosthetic module, the normalized ankle stiffness was plotted as a function of the subject’s total weight.

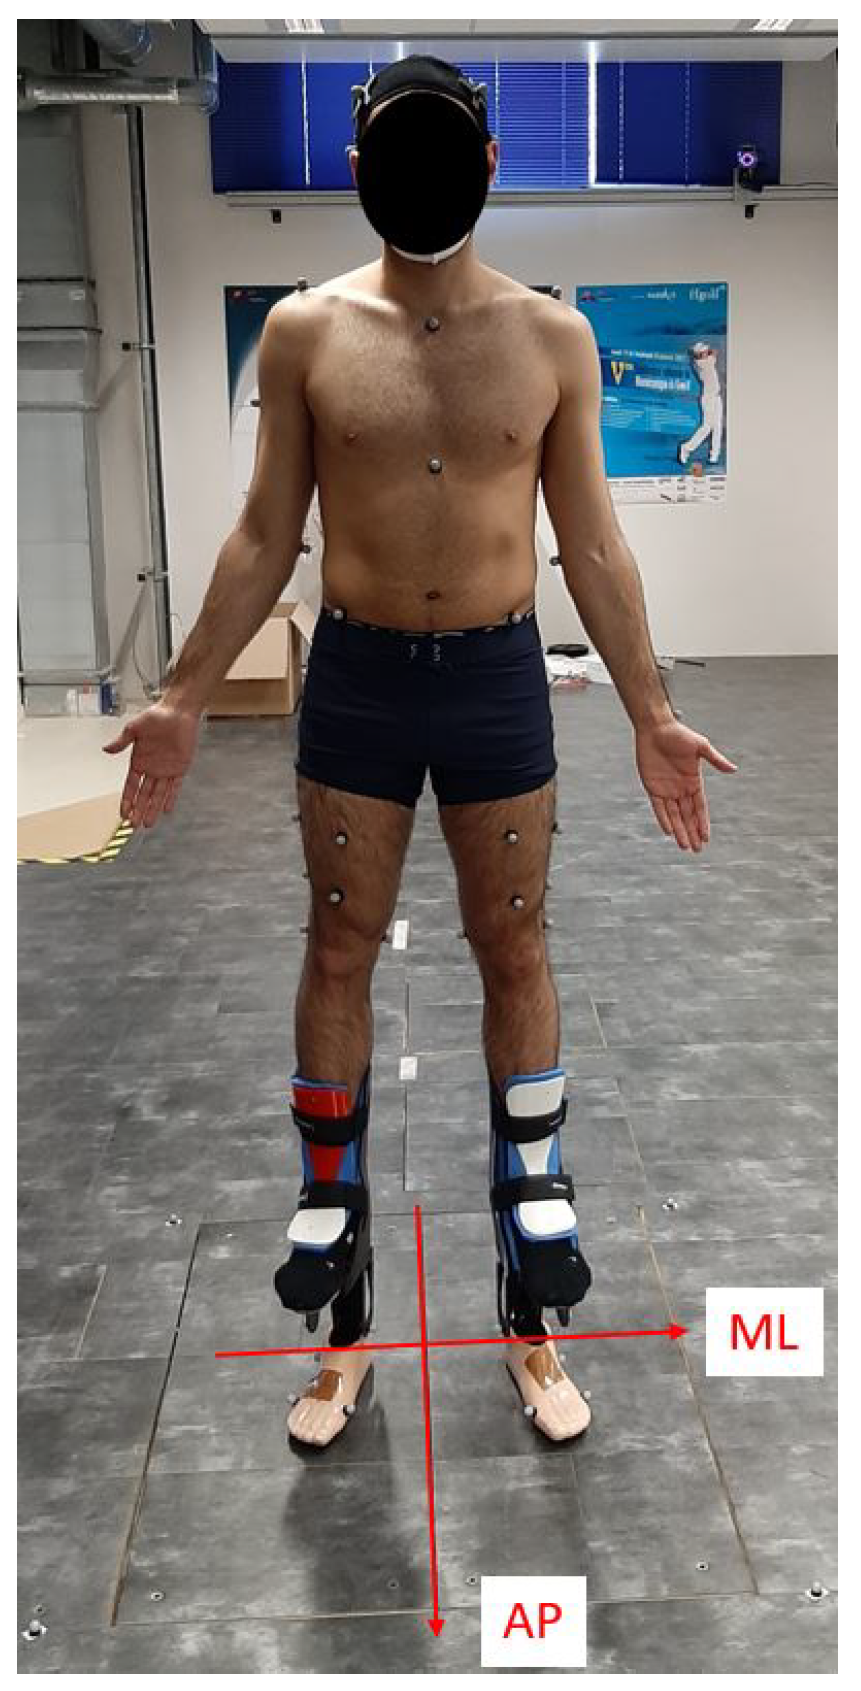
2.2. Subjects and Protocol

Eleven able-bodied subjects were recruited to participate in this study (Table 1). Subjects wore lower-limb prosthetic simulators under each foot, allowing able-bodied subjects to test prostheses (Figure 2).
The whole body was equipped with 58 retroreflective markers placed on specific anatomical landmarks and technical plates [32]. The protocol was approved by the “Comité de Protection des Personnes (CPP)” (2020-A01357-32) and all participants gave their consent. In this experiment, we used two AMTI synchronized force plates. According to the literature [19], in order to quantify the static postural balance, the subjects were asked to remain static for 60s with a foot on each force plate and below the shoulders, the arms along the body and staring straight ahead with the open eyes (OE). After a rest of 60 s, the subject repeated the test with the closed eyes (CE). OE and CE situations represent an alteration of the visual system. These tests were performed by the same subject barefoot (i.e., reference configuration: Ref) and then with the prosthetic feet, using in sequence M6, M3 and M1. The subject rested for about 5 min between each configuration. All subjects performed the test barefoot, and the prostheses tested by the subjects were reported in Table 1.

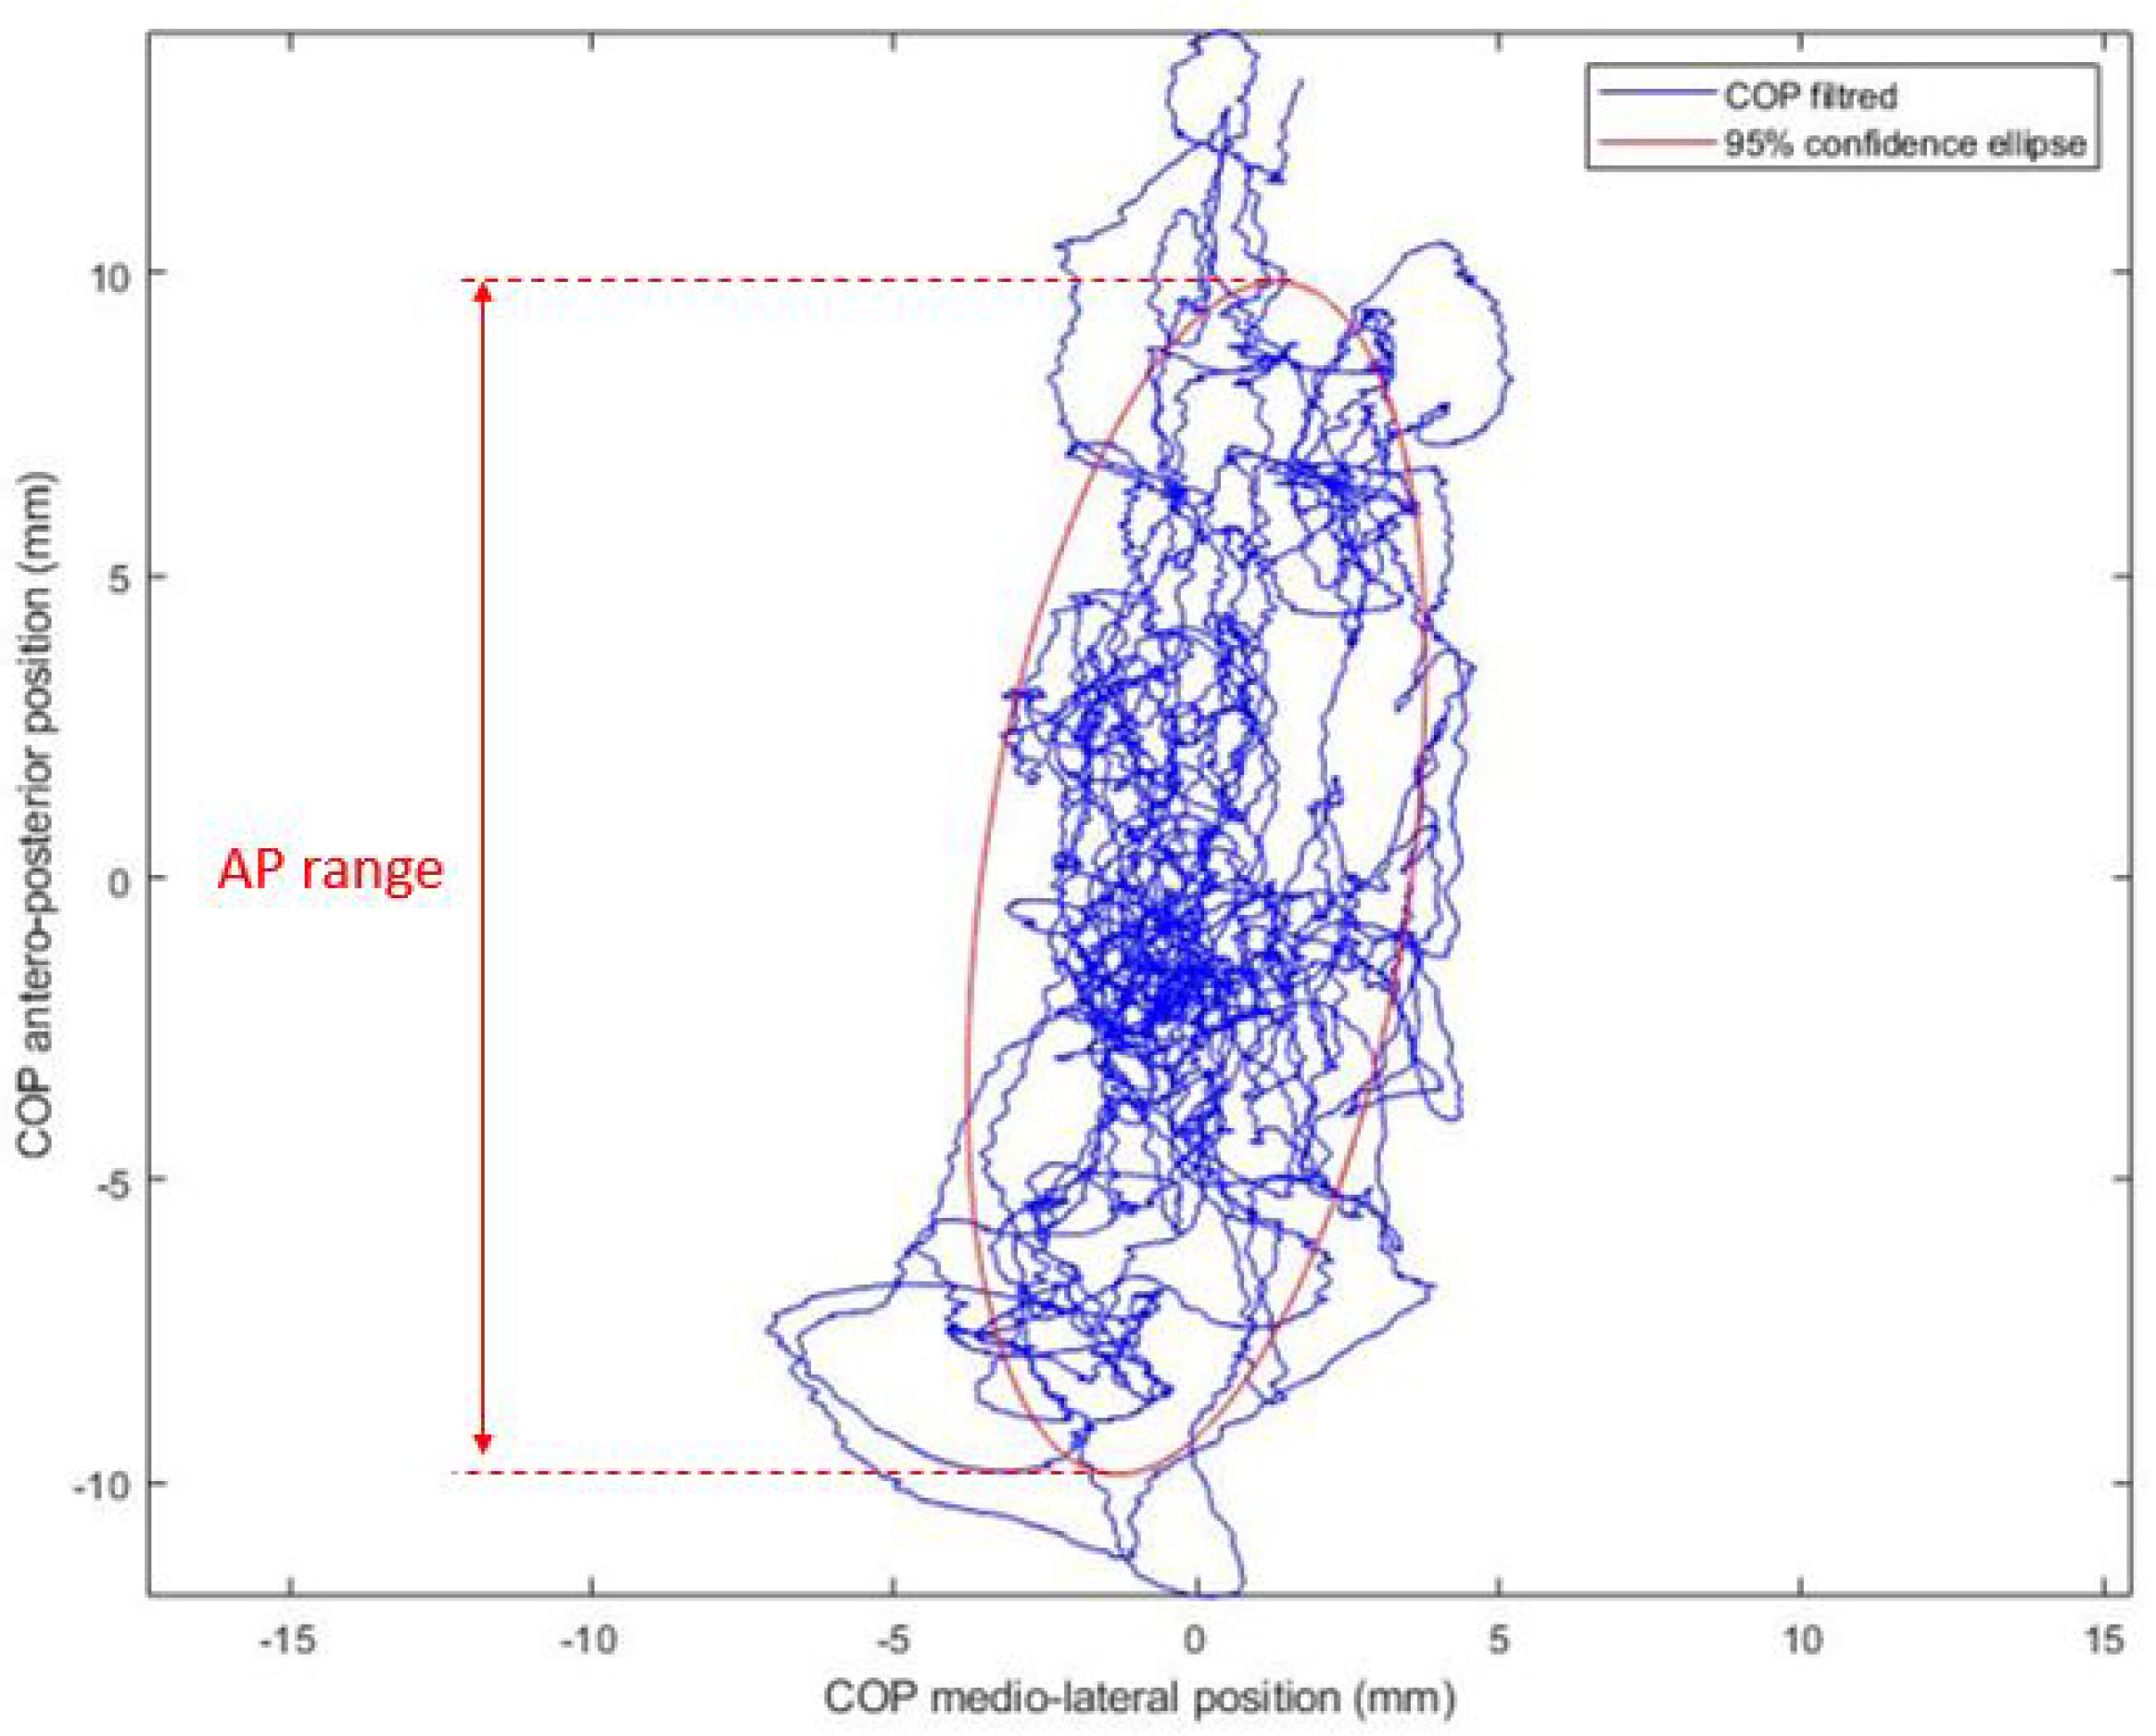
2.3. Data Processing

The instantaneous forces acting on each foot were recorded by the platform over time, and the 2D positions of the COP were assessed under each foot. The instantaneous positions of the COP for each foot were digitally filtered (finite impulse response filter, order 4, cutoff frequency at 10 Hz). The choice of the cutoff frequency corresponded to the known maximum useful bandwidth of the stabilometric signal [34]. The 2D positions of the filtered COP for each foot were expressed in a common foot frame with the medio-lateral (ML) axis defined as the line connecting the malleolus, pointing to the right and the AP axis as the line perpendicular to the ML axis in the transverse plane, pointing anteriorly (Figure 2). The global COP positions were the addition of the COP positions of each foot expressed in the common foot frame.
Even if the sideways balance is a major issue during walking and other dynamic activities [33], in a static position, the body sway is mainly along the AP direction [35] and the COP ML displacement shows few changes when static balance is affected [3,4]. In order to study the static balance, this study focused only on the AP displacement of the COP. The 95% confidence ellipse of the global COP positions was calculated for each subject, configuration and situation following the method proposed by Oliveira et al. [36] (Figure 3). According to the literature, the length of the ellipse major axis projected on the AP direction (AP range) was calculated for each subject, configuration (Ref, M6, M3, M1) and situation (OE, CE) [37]. The mean and the sd of the AP range were calculated for all subjects depending on the configuration and the situation. These values were normalized by the COM height in order to compare the Ref and the configurations with the prosthetic simulators. The ankle, knee and hip angles were assessed in the sagittal plane with positive joint angles corresponding to a flexed position. The mean and the sd of the joint angles ROM were calculated for all subjects depending on the configuration and the situation. For each subject and prosthetic module both in OE and CE, the AP range normalized by the COM height and the joint angles ROM were plotted as a function of the normalized ankle stiffness.
Linear regression models with interactions of the AP range, the ankle, knee and hip angles ROM as a function of the situation (OE and CE) and of the normalized ankle stiffness were developed. A one-way analysis of variance (ANOVA) test was performed on the model of the AP range. The significance level was set a priori at p v a l u e < 0.05 . Linear regression coefficients and 95% confidence intervals (CI) were calculated between the AP range and the normalized ankle stiffness both in OE and CE. In the same way, the linear regression coefficients and CI were calculated between the joint angles ROM and the normalized ankle stiffness both in OE and CE.

3. Results

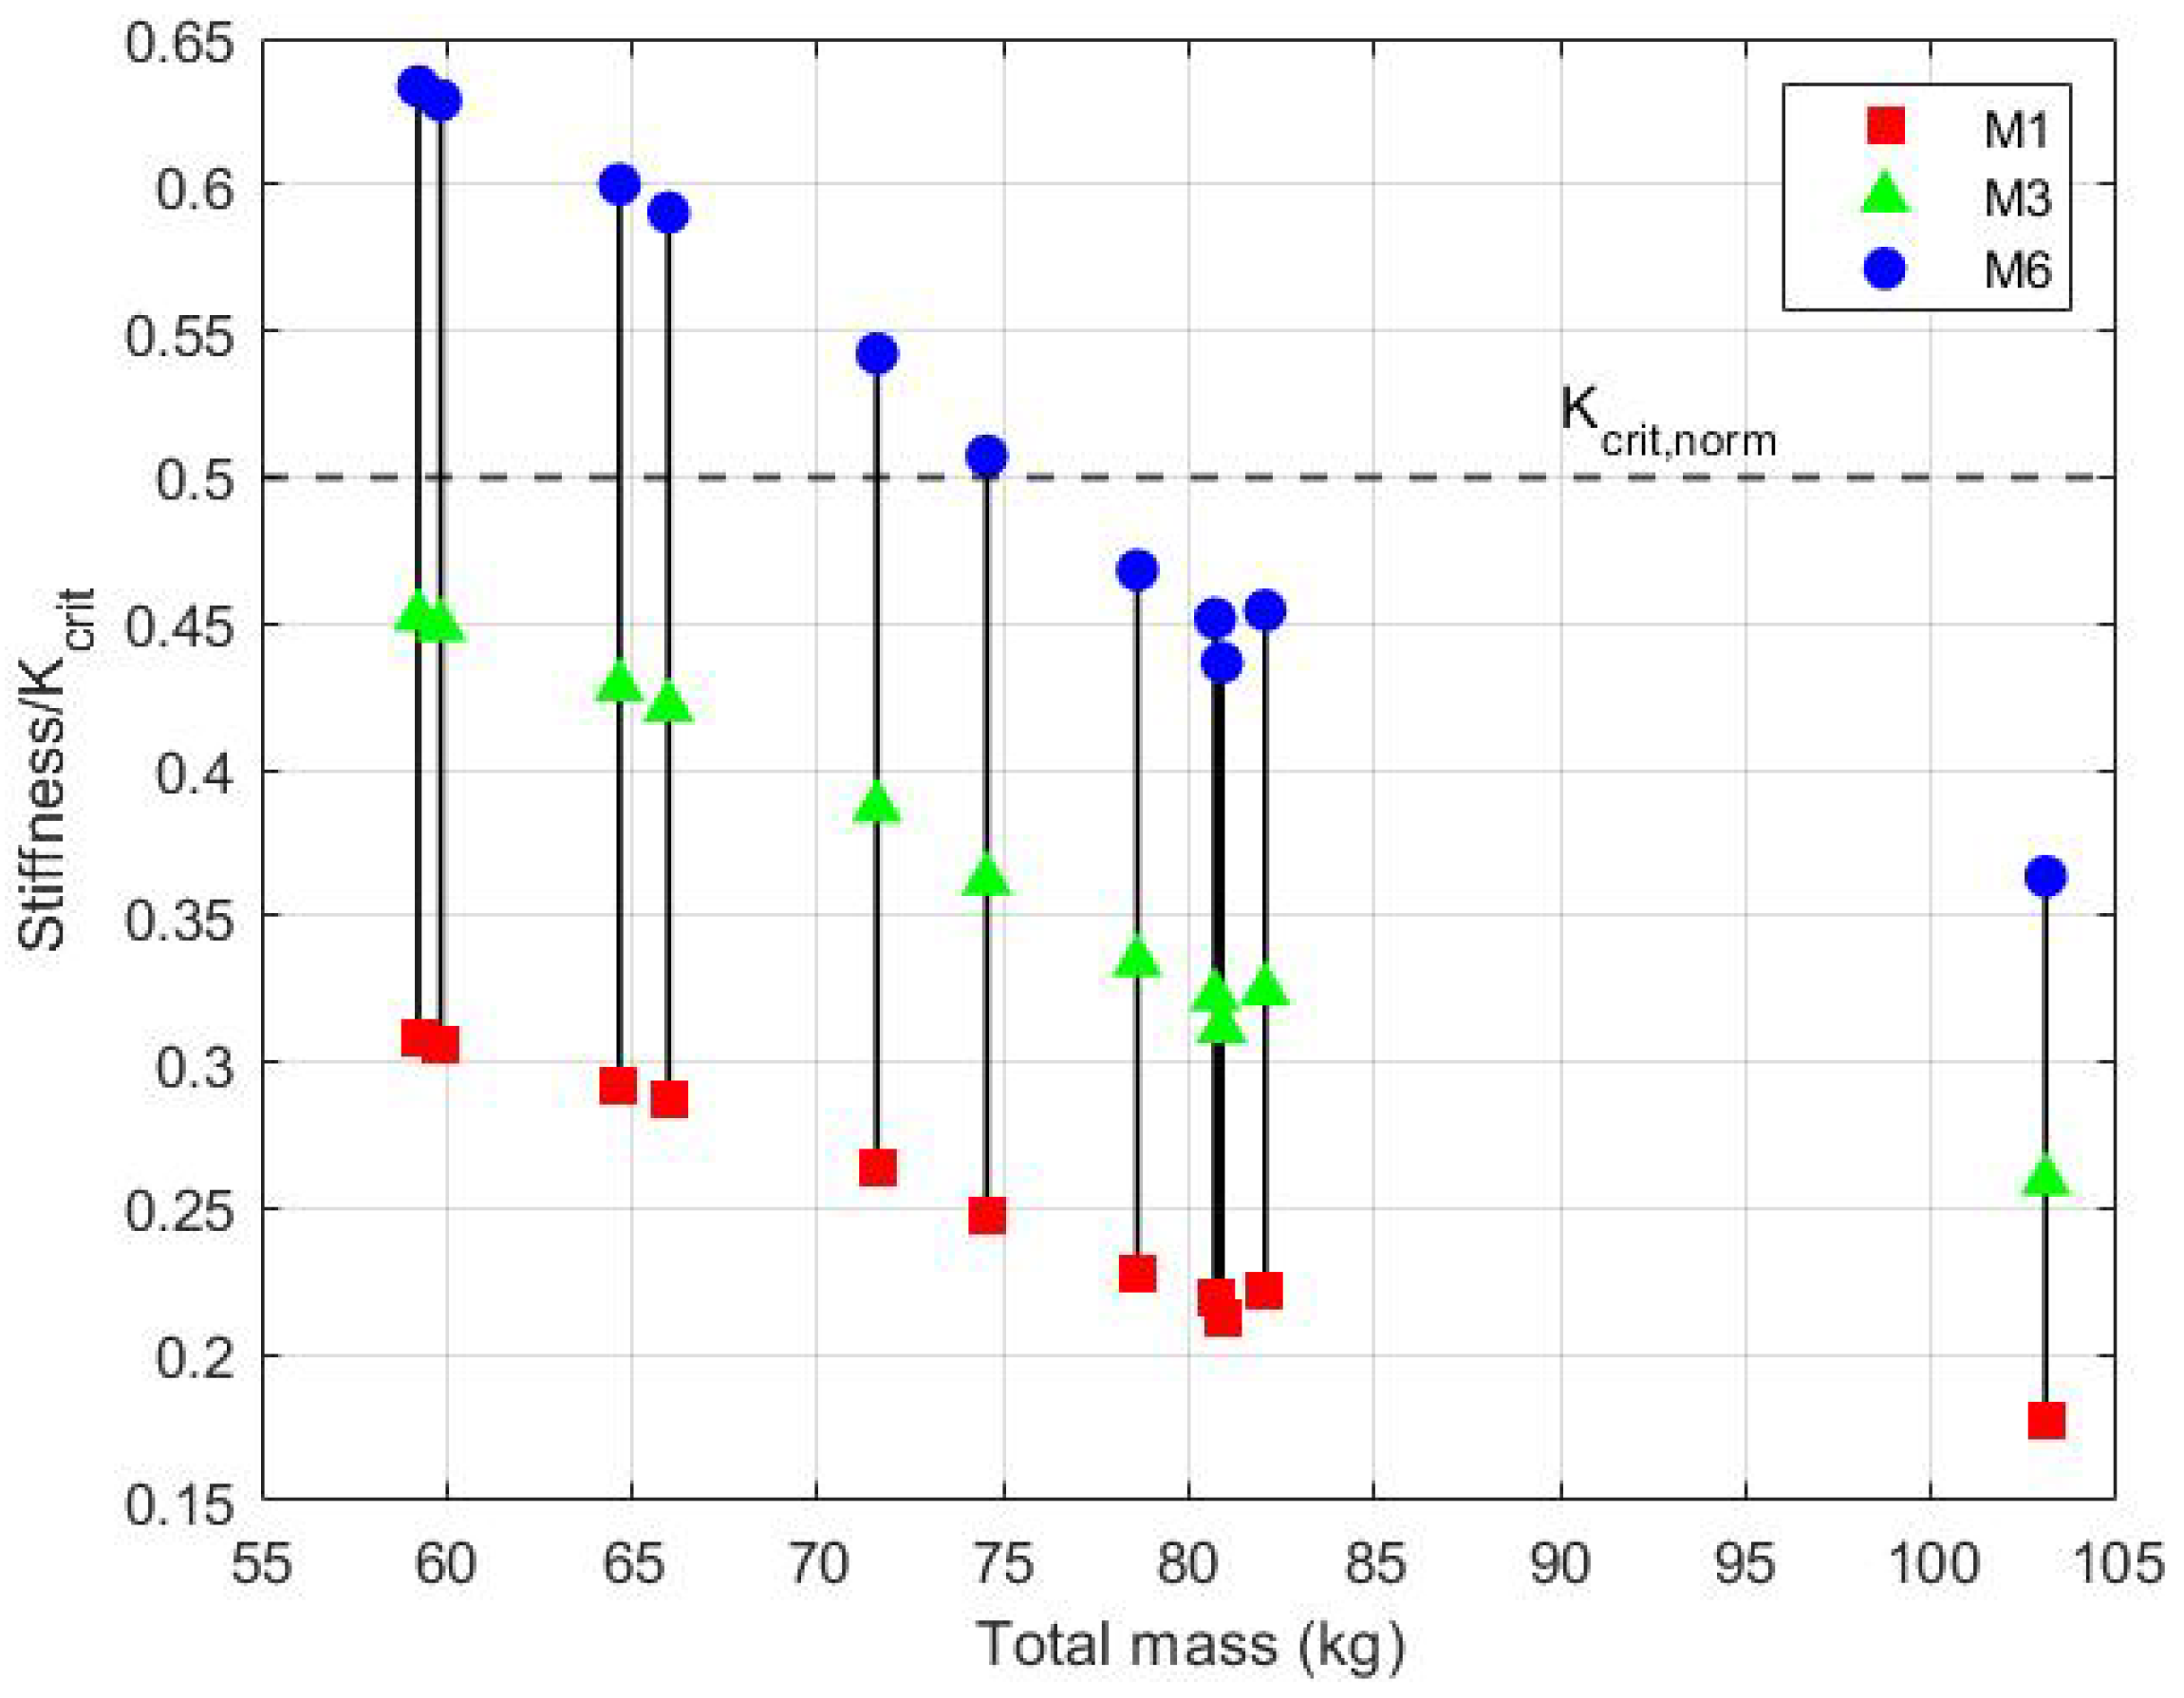
3.1. Ankle Stiffness

The mean and the sd of the ankle stiffness were quantified for all forward and backward movements depending on the prosthetic module and were reported in Table 2. The prosthesis with the lowest module (M1) showed the lowest stiffness, 203.15 (6.23) Nm/rad, while the prosthesis with the highest module (M6) showed the highest stiffness, 417.16 (8.06) Nm/rad.
Each subject is characterized by a different value of K c r i t (Equation (1)) depending on his mass and height (Table 1). Thus, for each subject and for each prosthetic module, the value of the stiffness normalized by K c r i t was different. The value of the mean ankle stiffness normalized by K c r i t were plotted for each subject and prosthetic module against the subject’s total mass (Figure 4). The horizontal boundary was the normalized critical stiffness (minimal stiffness allowing the static balance), this value was supposed to be equal to 1 in static. During the stiffness test (see Section 2.1), the ankle stiffness was quantified for one foot, so the the critical normalized stiffness ( K c r i t , n o r m ) is equal to 0.5.
In this study, all subjects wearing M1 and M3 prosthesis registered a normalized ankle stiffness below K c r i t , n o r m , while the subjects 1 to 6 wearing M6 prosthesis showed a normalized ankle stiffness above K c r i t , n o r m .

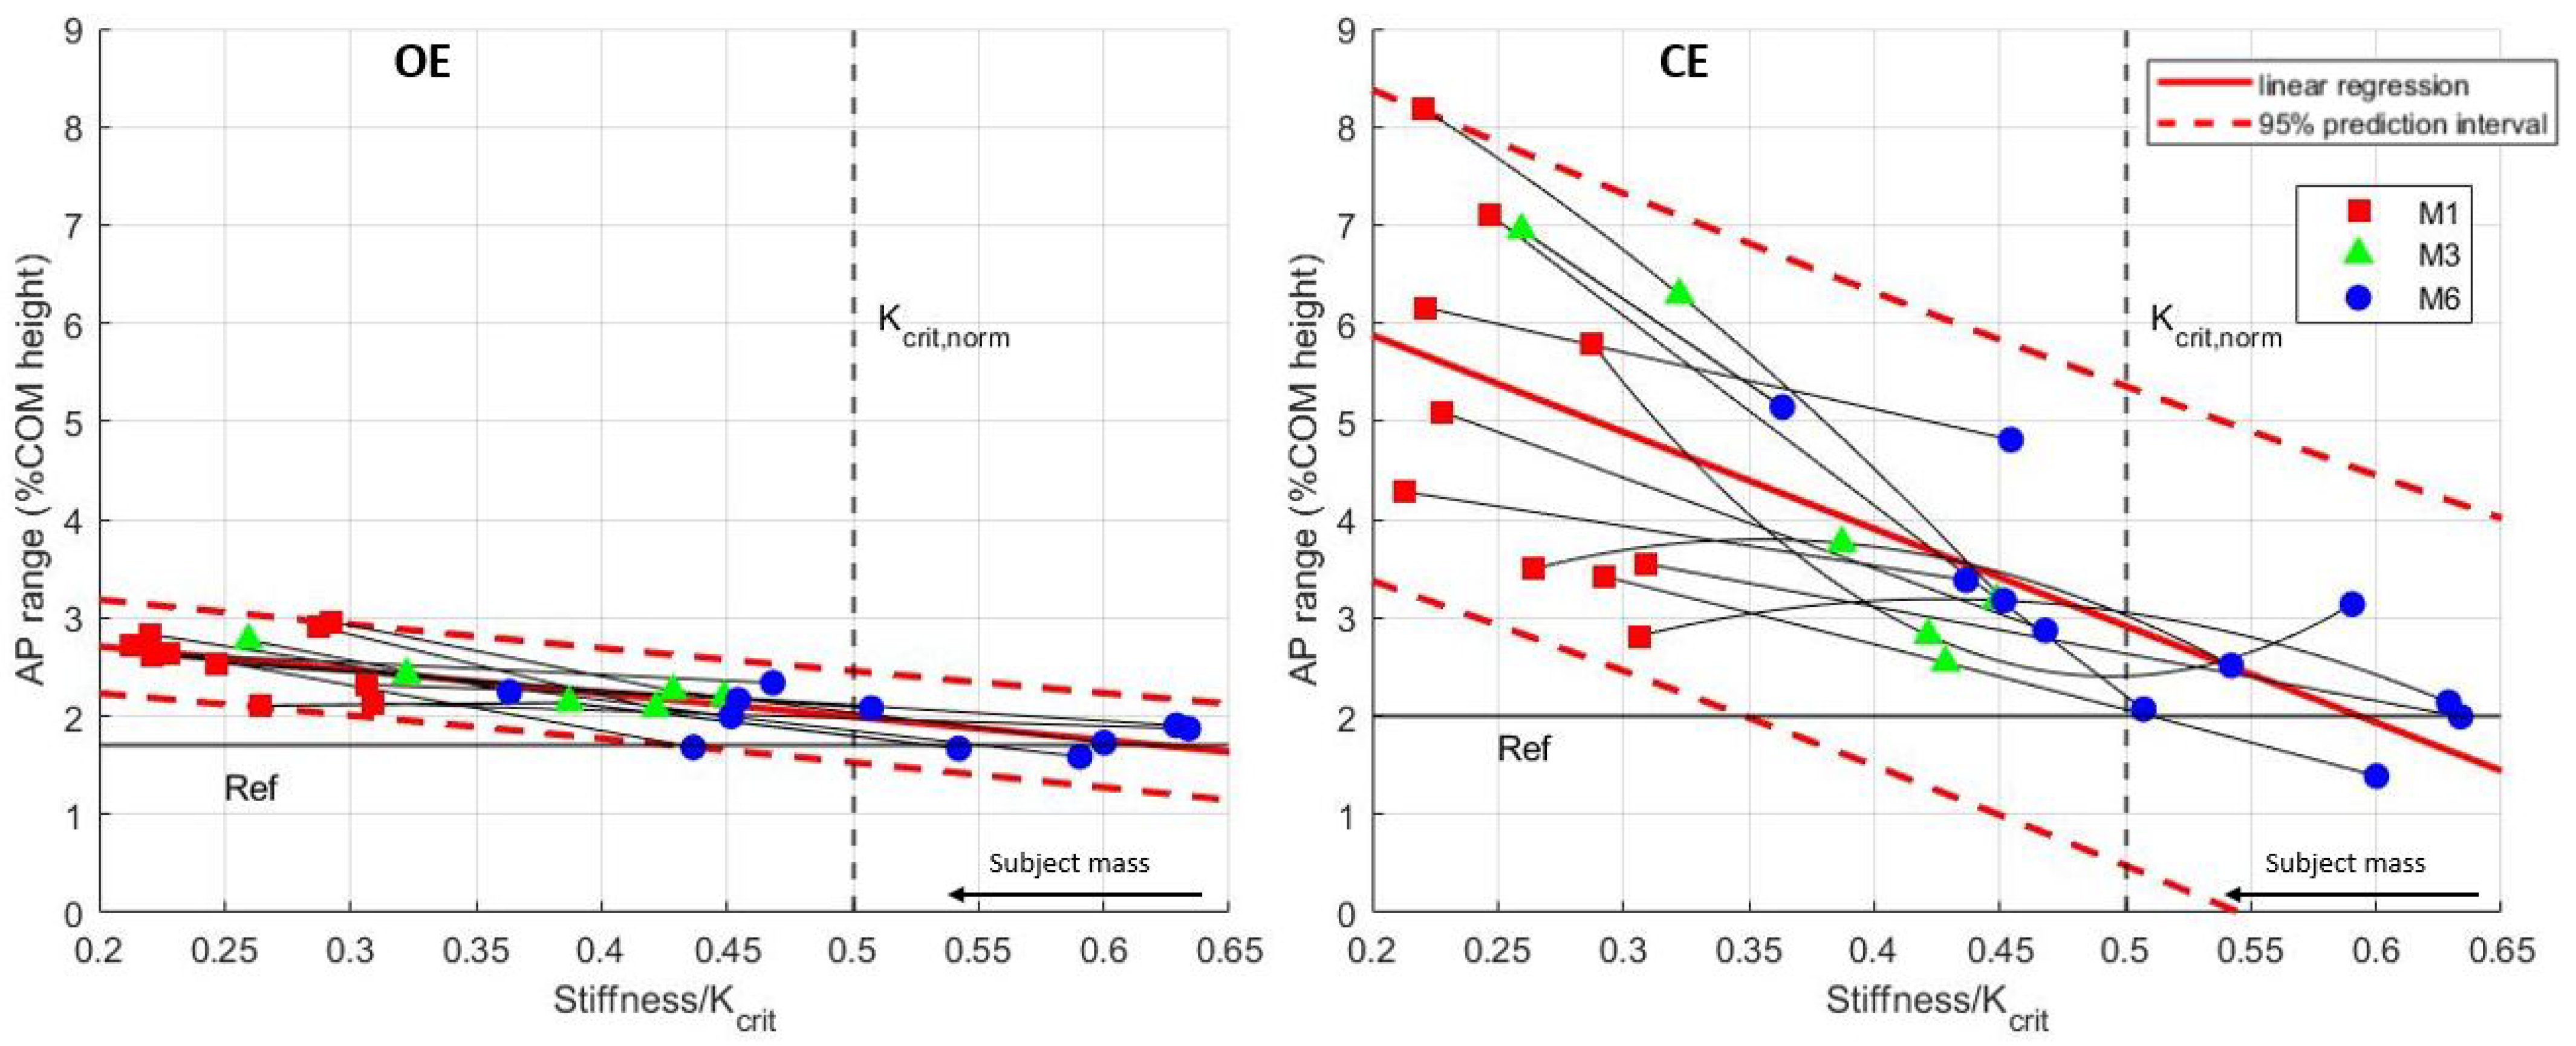
3.2. Static Balance Depending on the Prosthetic Ankle Stiffness
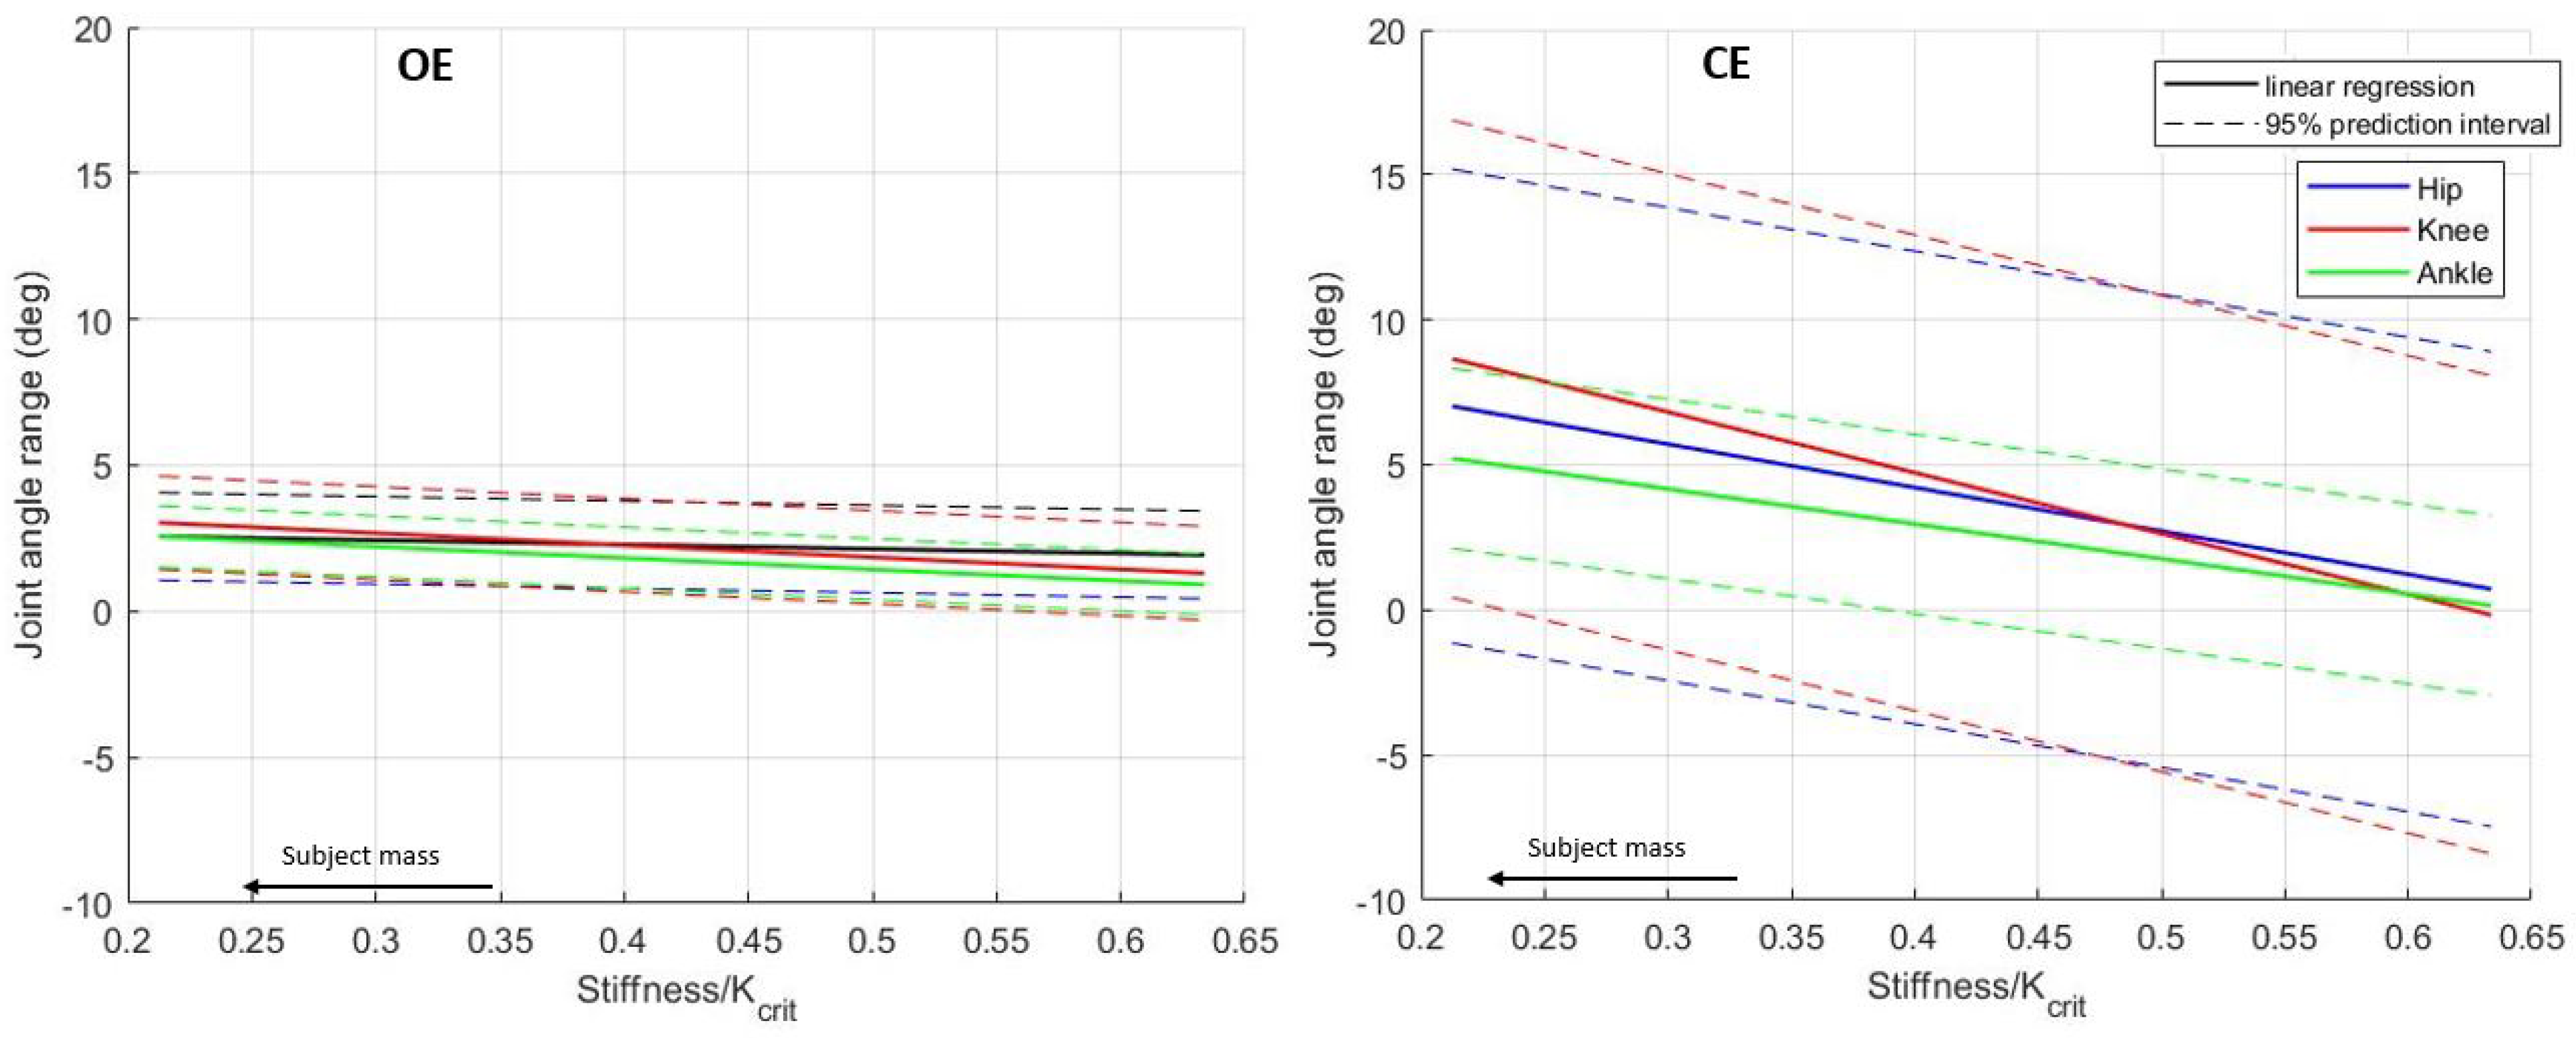
The mean and the sd for all subjects of the AP range normalized by the COM height depending on the configuration and the situation were reported in Table 3. In both OE and CE, the mean AP range was lower for the Ref followed by M6, M3 and then M1. For all configurations, the mean AP range with OE was lower than CE.
The AP range normalized by the COM height was plotted for each subject and configuration against the ankle stiffness normalized by K c r i t for both OE and CE (Figure 5). As in Figure 4, the vertical boundary was the normalized critical stiffness. The horizontal boundary was the mean AP range for the Ref.
For all subjects with OE, when the prosthetic module increased (i.e., the stiffness of the prosthesis increased), the AP range decreased. For all subjects with CE, when the prosthetic module increased, the AP range decreased or was almost equal. For both OE and CE, the AP range decrease was not constant between subjects. The decrease of the AP range depending on the normalized ankle stiffness was greater in subjects with CE rather than with OE. The adimensional slope of the linear regression was equal to −9.86 (CI: −16.03, −3.69) with CE and −2.39 (CI: −4.94, 0.17) with OE.
Both the normalized ankle stiffness and the visual system had a significant impact on the AP range ( p v a l u e < 0.05 , R s q u a r e d = 0.70 ).

3.3. Joint Angles

The mean and the sd for all subjects of the ankle ROM, knee ROM and hip ROM angles were reported in Table 3. In both OE and CE, the joint angles ROM were the lowest for the Ref followed by M6, M3 and then M1. There was no variation between OE and CE for the Ref. Concerning M1, M3 and M6, the joint angles ROM were lower with OE than CE.
The linear regression of the joint angles ROM as a function of the normalized ankle stiffness was plotted for both OE and CE (Figure 6). The decrease of the AP range depending on the normalized ankle stiffness was greater in subjects with CE rather than with OE. With CE, the adimensional slope of the linear regression was equal to −12.04 (CI: −20.25, −3.84) for the ankle, −20.96 (CI: −41.96, 0.04) for the knee and −14.97 (CI: −35.79, 5.85) for the hip. With OE, the adimensional slope of the linear regression was equal to −3.92 (CI: −7.31, −0.52) for the ankle, −4.11 (CI: −12.81, 4.59) for the knee and −1.50 (CI: −10.12, 7.13) for the hip.
In the CE situation, variability between subjects can be high, for example, the knee ROM was equal to 4.5 ± 4.2 (M3) and the hip ROM was equal to 6.4 ± 6.4 (M1).

4. Discussion

In order to adapt to the situation, the value of the ankle stiffness of non-amputee subjects can be varied by modifying the muscular contraction of the flexor/extensor muscles of the ankle joint such as the triceps surae muscles.
Hansen et al. [11] proposed a model to calculate the stiffness for swaying and walking and calculated for an able-bodied subject of 71 kg with a leg length of 1 m , an ankle stiffness equal to 8 Nm / for walking and 25 Nm / for swaying. Winter et al. [10] proposed an inverted pendulum model to quantify the static balance with a torsional spring modeling the ankle joint. A critical value of ankle stiffness allowing the user’s static balance was stated (see Equation (1)). Thus, the stiffness of a foot prosthesis should be a compromise to allow walking and balance during standing. A solution would be a bimodal prosthesis [20] or a prosthesis with adaptive stiffness [38], but for an active prosthesis, the control must be fast and accurate. Moreover, active prostheses are more expensive than passive prostheses.
The impact of ankle stiffness on walking has been studied extensively in the literature [12,13,14,15,16,17,18], but its impact on the static balance has been few studied. In the present work, the stiffness of the prosthetic foot Dynatrek (Proteor 1A600) with different modules was quantified. Able-bodied subjects wearing lower limb prosthetic simulators under each foot [30] were asked to remain as static as possible both with OE and CE. The COP displacements and the joint angles ROM were experimentally assessed. In this study, subjects with different masses and COM heights tested prosthetic feet with different stiffnesses. Thus, the prosthetic stiffness normalized by the subject’s mass and COM height will be closer for some subjects to the optimal stiffness for walking defined by Hansen et al. [11] or for others to the critical stiffness allowing static balance defined by Winter et al. [10].
For all subjects, when the prosthetic module decreased (i.e., the prosthetic stiffness decreased), the AP range increased (Table 3). Consistent with our results, the literature states that when the stiffness of the prosthesis decreased, the static balance of the transfemoral and transtibial amputee subjects decreased [11,28], and thus the COP confidence ellipse increased [39]. Moreover, for the Ref, the average AP range with OE was equal to 15.5 mm (sd: 3.1 mm ), and this value was comparable to the literature [37]. As anticipated by Winter et al. [10], the influence of the normalized prosthetic stiffness on the AP range and thus on the static balance was significant ( p v a l u e < 0.05 ).
According to the literature [40], the visual system had no significant influence on the static balance of healthy subjects. Moreover, the phenomenon of increase in the AP range when the prosthetic stiffness decreased was amplified with CE compared to OE. The adimensional slope of the linear regression was equal to −9.86 (CI: −16.03, −3.69) with CE and −2.39 (CI: −4.94, 0.17) with OE. The visual system had a significant influence on the AP range and thus on the static balance ( p v a l u e < 0.05 ). Sarroca et al. [41] provided comparable results for transtibial amputee subjects and underlined the great importance of the visual system on the static balance.
When the stiffness of the prosthesis increased, the angular ROM of the ankle, knee and hip joints decreased (Figure 6). According to Toumi et al. [42], subjects who underwent an amputation compensate their ankle loss by increasing their body movements, which explained the increase in joint angles ROM. These subjects had to find other balance strategies by increasing their ankle, knee and hip angular amplitude. In the CE situation, the adimensional slope of the linear regression was equal to −12.04 (CI: −20.25, −3.84) for the ankle, −20.96 (CI: −41.96, 0.04) for the knee and −14.97 (CI: −35.79, 5.85) for the hip. In the OE situation, the adimensional slope of the linear regression was equal to −3.92 (CI: −7.31, −0.52) for the ankle, −4.11 (CI: −12.81, 4.59) for the knee and −1.50 (CI: −10.12, 7.13) for the hip. The inverted pendulum model is based on the hypothesis that the knee and hip joints are locked. Thus, the modeling of the subject’s balance using an inverted pendulum was not accurate in the CE situation.
One of the limitations of this study was that the subjects were not amputated, and the use of the prosthetic simulators modified the subject’s static balance and artificially increased the COM height of the subjects. However, it was interesting to use them, as they allowed us to symmetrize the prostheses and they avoided unilateral amputee subjects compensating for the loss of balance by applying more weight to the non-amputated limb [28]. Moreover, as the amputation impacts the subject’s balance, the prosthetic simulators also allowed us to avoid the alteration of balance due to the amputation. The tested prostheses had the same design with different modules. Thus, only the impact of the ankle stiffness on the subjects static balance was studied.

5. Conclusions

To the best of the authors knowledge, this is the first study that quantifies systematically the impact of ankle stiffness on static balance by removing balance losses due to amputation by using lower-limb prosthetic simulators under each foot. This study used the same prosthesis with different modules to exclusively isolate the impact of ankle stiffness on static balance. The impact of a visual system alteration was also studied. The ankle stiffness is an interesting parameter, as it has an impact on the gait and on the static balance of the users. Moreover, it should be controlled to design prosthetic feet. This study confirmed that the static balance increased when the ankle stiffness increased. This study allowed us to quantify this increase by studying the COP displacements and the joint angles ROM. It also showed that a visual system alteration amplifies more significantly the decrease of static balance in subjects wearing prosthetic feet compared to barefoot.
Future work should also consider the impact of other design parameters such as the prosthetic manufacturing technique, the materials and the geometry on the gait and on the static balance. It should also perform the same experiment with amputee patients to investigate the impact of the prosthetic simulators on the results.

Author Contributions

Conceptualization, A.L., X.B. and H.P.; methodology, A.L. and X.B.; software, A.L.; validation, A.L., X.B., A.C. and H.P.; formal analysis, A.L., X.B., A.C. and H.P.; investigation, A.L.; resources, A.L., X.B., A.C. and H.P.; data curation, A.L.; writing—original draft preparation, A.L.; writing—review and editing, A.L., X.B., A.C. and H.P.; supervision, X.B., A.C. and H.P. All authors have read and agreed to the published version of the manuscript.

Funding

“Reseau Santé”, Fondation AM, Ecole Nationale Supérieure d’Arts et Métiers.

Institutional Review Board Statement

The protocol was approved by the “Comité de Protection des Personnes (CPP)” (2020-A01357-32).

Informed Consent Statement

Informed consent was obtained from all subjects involved in the study.

Data Availability Statement

Not applicable.

Conflicts of Interest

The authors declare no conflict of interest.

Abbreviations

The following abbreviations are used in this manuscript:
ANOVAAnalyse Of Variance
APAntero-Posterior
CEClosed Eyes
CIConfidence Intervals
COMCenter Of Mass
COPCenter Of Pressure
ESAREnergy Storage And Release
MLMedio-Lateral
OEOpen Eyes
ROMRange Of Motion
sdstandard deviation

References

  1. Ziegler-Graham, K.; MacKenzie, E.J.; Ephraim, P.L.; Travison, T.G.; Brookmeyer, R. Estimating the Prevalence of Limb Loss in the United States: 2005 to 2050. Arch. Phys. Med. Rehabil. 2008, 89, 422–429. [Google Scholar] [CrossRef] [PubMed]
  2. Kamali, M.; Karimi, M.; Eshraghi, A.; Omar, H. Influential factors in stability of lower-limb amputees. Am. J. Phys. Med. Rehabil. 2013, 92, 1110–1118. [Google Scholar] [CrossRef] [PubMed]
  3. Quai, T.M.; Brauer, S.G.; Nitz, J.C. Somatosensation, circulation and stance balance in elderly dysvascular transtibial amputees. Clin. Rehab. 2005, 19, 668–676. [Google Scholar]
  4. Nadollek, H.; Brauer, S.; Isles, R. Outcomes after trans-tibial amputation: The relationship between quiet stance ability, strength of hip abductor muscles and gait. Physiother. Res. Int. 2002, 7, 203–214. [Google Scholar]
  5. Pedrinelli, A.; Saito, M.; Coelho, R.F.; Fontes, R.B.V.; Guarniero, R. Comparative study of the strength of the flexor and extensor muscles of the knee through isokinetic evaluation in normal subjects and patients subjected to trans-tibial amputation. Prosthet. Orthot. Int. 2002, 26, 195–205. [Google Scholar] [CrossRef] [Green Version]
  6. Butowicz, C.; Yoder, A.; Farrokhi, S.; Mazzone, B.; Hendershot, B. Lower limb joint-specific contributions to standing postural sway in persons with unilateral lower limb loss. Gait Posture 2021, 89, 109–114. [Google Scholar]
  7. Hermodsson, Y.; Ekdahl, C.; Persson, B.; Roxendal, G. Standing balance in trans-tibia1 amputees following vascular disease or trauma: A comparative study with healthy subjects. Prosthet. Orthot. Int. 1994, 18, 150–158. [Google Scholar] [CrossRef] [Green Version]
  8. Winter, D. Human balance and posture control during standing and walking. Gait Posture 1995, 3, 193–214. [Google Scholar]
  9. Hof, A.L. The equations of motion for a standing human reveal three mechanisms for balance. J. Biomech. 2007, 40, 451–457. [Google Scholar] [CrossRef]
  10. Winter, D.A.; Patla, A.E.; Prince, F.; Ishac, M.; Gielo-Perczak, K. Stiffness Control of Balance in Quiet Standing. J. Neurophysiol. 1998, 80, 1211–1221. [Google Scholar] [CrossRef] [Green Version]
  11. Hansen, A.H.; Wang, C.C. Effective rocker shapes used by able-bodied persons for walking and fore-aft swaying: Implications for design of ankle–foot prostheses. Gait Posture 2010, 32, 181–184. [Google Scholar] [PubMed] [Green Version]
  12. Fey, N.; Klute, G.; Neptune, R. The influence of energy storage and return foot stiffness on walking mechanics and muscle activity in below-knee amputees. Clin. Biomech. 2011, 26, 1025–1032. [Google Scholar] [CrossRef] [PubMed]
  13. Hansen, A.; Meier, M.; Sessoms, P.; Childress, D. The effects of prosthetic foot roll-over shape arc length on the gait of trans-tibial prosthesis users. Prosthet. Orthot. Int. 2006, 30, 286–299. [Google Scholar] [CrossRef]
  14. Kerkum, Y.; Philippart, W.; Houdijk, H. The effects of footplate stiffness on push-off power when walking with posterior leaf spring ankle-foot orthoses. Clin. Biomech. 2021, 88, 105422. [Google Scholar] [CrossRef]
  15. Klodd, E.; Hansen, A.; Fatone, S.; Edwards, M. Effects of prosthetic foot forefoot flexibility on gait of unilateral transtibial prosthesis users. J. Rehabil. Res. Dev. 2010, 47, 899. [Google Scholar]
  16. Major, M.; Twiste, M.; Kenney, L.; Howard, D. The effects of prosthetic ankle stiffness on ankle and knee kinematics, prosthetic limb loading, and net metabolic cost of trans-tibial amputee gait. Clin. Biomech. 2014, 29, 98–104. [Google Scholar] [CrossRef] [PubMed]
  17. Major, M.; Twiste, M.; Kenney, L.; Howard, D. The effects of prosthetic ankle stiffness on stability of gait in people with transtibial amputation. J. Rehabil. Res. Dev. 2016, 53, 839–852. [Google Scholar] [CrossRef]
  18. Shepherd, M.; Azocar, A.; Major, M.; Rouse, E. Amputee perception of prosthetic ankle stiffness during locomotion. J. Neuroeng. Rehabil. 2018, 15, 99. [Google Scholar]
  19. Ku, P.X.; Abu Osman, N.A.; Wan Abas, W.A.B. Balance control in lower extremity amputees during quiet standing: A systematic review. Gait Posture 2014, 39, 672–682. [Google Scholar]
  20. Koehler-McNicholas, S.R.; SavvasSlater, B.C.; Koester, K.; Nickel, E.A.; Ferguson, J.E.; Hansen, A.H. Bimodal ankle-foot prosthesis for enhanced standing stability. PLoS ONE 2018, 13, e0204512. [Google Scholar] [CrossRef] [Green Version]
  21. Kolarova, B.; Janura, M.; Svoboda, Z.; Elfmark, M. Limits of stability in persons with transtibial amputation with respect to prosthetic alignment alterations. Arch. Phys. Med. Rehabil. 2013, 94, 2234–2240. [Google Scholar] [CrossRef] [PubMed]
  22. Molina-Rueda, F.; Molero-Sánchez, A.; Carratalá-Tejada, M.; Cuesta-Gómez, A.; Miangolarra-Page, J.; Alguacil-Diego, I. Limits of stability in patients with vascular (due to diabetes) and nonvascular unilateral transtibial amputation: A cross-sectional study. Int. J. Rehabil. Res. 2017, 40, 227–231. [Google Scholar]
  23. Pickerill, M.; Harter, R. Validity and reliability of limits-of-stability testing: A comparison of 2 postural stability evaluation devices. J. Athl. Train. 2011, 46, 600–606. [Google Scholar] [CrossRef] [Green Version]
  24. Inkol, K.A.; Vallis, L.A. Modelling the dynamic margins of stability for use in evaluations of balance following a support-surface perturbation. J. Biomech. 2019, 95, 109302. [Google Scholar] [CrossRef] [PubMed]
  25. Chiari, L.; Rocchi, L.; Cappello, A. Stabilometric parameters are affected by anthropometry and foot placement. Clin. Biomech. 2002, 17, 666–677. [Google Scholar] [CrossRef]
  26. Shepherd, M.; Simon, A.; Zisk, J.; Hargrove, L. Patient-preferred prosthetic ankle-foot alignment for ramps and level-ground walking. Trans. Neural Syst. Rehabil. Eng. 2021, 29, 52–59. [Google Scholar]
  27. Hansen, A.; Childress, D. Investigations of roll-over shape: Implications for design, alignment, and evaluation of ankle-foot prostheses and orthoses. Disabil. Rehabil. 2010, 32, 2201–2209. [Google Scholar] [CrossRef]
  28. Nederhand, M.J.; Van Asseldonk, E.H.; van der Kooij, H.; Rietman, H.S. Dynamic Balance Control (DBC) in lower leg amputee subjects; contribution of the regulatory activity of the prosthesis side. Clin. Biomech. 2012, 27, 40–45. [Google Scholar] [CrossRef]
  29. Arifin, N.; Abu Osman, N.A.; Ali, S.; Wan Abas, W.A. The effects of prosthetic foot type and visual alteration on postural steadiness in below-knee amputees. Biomed. Eng. Online 2014, 13, 23. [Google Scholar] [CrossRef]
  30. Groothuis, A.; Houdijk, H. The effect of prosthetic alignment on prosthetic and total leg stiffness while running with simulated running-specific prostheses. Front. Sports Act. Living 2019, 1, 16. [Google Scholar] [CrossRef] [Green Version]
  31. Curtze, C.; Hof, A.; van Keeken, H.; Halbertsma, J.; Postema, K.; Otten, B. Comparative roll-over analysis of prosthetic feet. J. Biomech. 2009, 42, 1746–1753. [Google Scholar] [CrossRef]
  32. Pillet, H.; Drevelle, X.; Bonnet, X.; Villa, C.; Martinet, N.; Sauret, C.; Bascou, J.; Loiret, I.; Djian, F.; Rapin, N.; et al. Apsic: Training and fitting amputees during situations of daily living. Intermed.-Range Ballist. Missile 2014, 35, 60–65. [Google Scholar] [CrossRef]
  33. Pillet, H.; Bonnet, X.; Lavaste, F.; Skalli, W. Evaluation of force plate-less estimation of the trajectory of the centre of pressure during gait. Gait Posture 2010, 31, 147–152. [Google Scholar] [PubMed]
  34. Dichgans, J.; Mauritz, K.H.; Allum, J.H.; Brandt, T. Postural sway in normals and atactic patients: Analysis of the stabilising and destabilizing effects of vision. Agressologie 1976, 17, 15–24. [Google Scholar] [PubMed]
  35. Popovic, R.; Pappas, I.P.I.; Nakazawa, K.; Keller, T.; Morari, M.; Dietz, V. Stability criterion for controlling standing in able-bodied subjects. J. Biomech. 2000, 10, 710–716. [Google Scholar] [CrossRef]
  36. Oliveira, L.F.; Simpson, D.M.; Nadal, J. Calculation of area of stabilometric signals using principal component analysis. Physiol. Meas. 1996, 17, 305–312. [Google Scholar] [CrossRef] [PubMed]
  37. Clavel, L.; Attali, V.; Jacq, O.; Nierat, M.; Similowski, T.; Rouch, P.; Sandoz, B. Breathing through a spirometer perturbs balance. Comput. Methods Biomech. Biomed. Eng. 2017, 20, S41–S42. [Google Scholar] [CrossRef] [Green Version]
  38. Thomas-Pohl, M.; Villa, C.; Davot, J.; Bonnet, X.; Facione, J.; Lapeyre, E.; Bascou, J.; Pillet, H. Microprocessor prosthetic ankles: Comparative biomechanical evaluation of people with transtibial traumatic amputation during standing on level ground and slope. Disabil. Rehabil. Assist. Technol. 2019, 16, 17–26. [Google Scholar]
  39. Santos, B.R.; Delisle, A.; Larivière, C.; Plamondon, A.; Imbeau, D. Reliability of centre of pressure summary measures of postural steadiness in healthy young adults. Gait Posture 2008, 27, 408–415. [Google Scholar] [CrossRef]
  40. Albertsen, I.; Ghédira, M.; Gracies, J.; Hutin, E. Postural stability in young healthy subjects – impact of reduced base of support, visual deprivation, dual tasking. J. Electromyogr. Kinesiol. 2017, 33, 27–33. [Google Scholar]
  41. Sarroca, N.; Luesma, M.; Valero, J.; Del Caso, M.; Alonso, C.; Calleja, J.; Lorenzo, T.; Bayod, J.; Lahoz, M. Influence of insole material density in the stability of patients with prosthetic unilateral transtibial amputation. Sci. Rep. 2022, 12, 7854. [Google Scholar] [CrossRef] [PubMed]
  42. Toumi, A.; Simoneau-Buessinger, E.; Bassement, J.; Barbier, F.; Gillet, C.; Allard, P.; Leteneur, S. Standing posture and balance modalities in unilateral transfemoral and transtibial amputees. J. Bodyw. Mov. Ther. 2021, 27, 634–639. [Google Scholar] [PubMed]
Figure 1. Stiffness test and marker set.
Prosthesis 04 00051 g001
Figure 2. Subject wearing the prosthetic simulators with prosthetic feet + feet frame.
Prosthesis 04 00051 g002
Figure 3. The 95% confidence ellipse of the global COP for the subject 9 in the Ref configuration with OE.
Prosthesis 04 00051 g003
Figure 4. Ankle stiffness normalized by the critical stiffness K c r i t = m t o t g h C O M against the total mass of the subject (subject mass + prosthetic simulator mass).
Prosthesis 04 00051 g004
Figure 5. AP range normalized by the COM height against the foot stiffness normalized by the critical stiffness K c r i t = m t o t g h C O M in the OE (left) and CE (right) situation.
Prosthesis 04 00051 g005
Figure 6. Linear regression of the joint angles ROM as a function of the normalized ankle stiffness in the OE (left) and CE (right) situation.
Prosthesis 04 00051 g006
Table 1. Subjects’ general characteristics.
SubjectAgeSexMassCOM HeightTested Prostheses
[kg][mm]M1M3M6
122F 55.0 902.1
225F 55.3 901.7
325F 60.6 854.3
428M 61.5 850.7
525M 67.5 868.4
624M 70.2 891.2
724M 74.1 930.1
824M 76.4 987.4
940M 77.7 970.4
1030M 77.7 910.2
1124M 98.6 906.0
Table 2. Mean and sd of the ankle stiffness for each prosthetic module.
Stiffness (Nm/rad)
M1M3M6
n cycles *7710
mean 203.15 297.82 417.16
sd 6.23 7.52 8.06
(*) number of forward and backward movements.
Table 3. Mean (sd) of the COP AP range normalized by the COM height (AP range) and the joint angles ROM for each configuration and situation.
ConfigurationRef.M6M3M1
SituationOECEOECEOECEOECE
AP range 1.7 ( 0.3 ) 2.0 ( 0.5 ) 1.9 ( 0.3 ) 3.0 ( 1.2 ) 2.3 ( 0.3 ) 4.3 ( 1.9 ) 2.6 ( 0.3 ) 5.0 ( 1.8 )
(% COM height)
Ankle angle ROM 1.1 ( 0.3 ) 1.1 ( 0.3 ) 1.3 ( 0.5 ) 1.7 ( 0.8 ) 2.2 ( 0.7 ) 3.1 ( 1.8 ) 2.3 ( 0.7 ) 4.6 ( 2.6 )
(deg)
Knee angle ROM 1.4 ( 0.7 ) 1.2 ( 0.8 ) 1.9 ( 0.9 ) 2.5 ( 1.1 ) 2.3 ( 0.9 ) 4.5 ( 4.2 ) 2.8 ( 1.3 ) 7.8 ( 1.1 )
(deg)
Hip angle ROM 1.7 ( 1.1 ) 1.5 ( 1.0 ) 2.0 ( 1.0 ) 2.8 ( 1.8 ) 2.4 ( 0.7 ) 3.9 ( 2.8 ) 2.6 ( 0.8 ) 6.4 ( 6.4 )
(deg)
OE: Open Eyes, CE: Closed Eyes, ROM: Range Of Motion.
Publisher’s Note: MDPI stays neutral with regard to jurisdictional claims in published maps and institutional affiliations.

