1. Introduction
The clinical success of dental implants has been linked to both the quantity and the density of the surrounding bone [
1].
Computed tomography (CT) is an established method for obtaining bone images before performing dental implant insertion surgery. CT scans provide an accurate three-dimensional assessment of anatomical structures as well as a direct measurement of bone density, which is expressed in Hounsfield units (HU), a value that offers crucial information about the bone [
1].
Bone density evaluation using CT is based on two fundamental principles. First, the radiological density of the tissue is measured by calculating the attenuation coefficient of the
x-ray beam. CT thereby generates a more detailed two-dimensional image of an object based on its three-dimensional reality, which represents the second fundamental principle [
2].
To assess the radiological density using CT, measurements are expressed using the Hounsfield scale, which is a quantitative scale and provides an exact density value for each tissue type. On the Hounsfield scale, the air has a value of −1000 (black on the grayscale), while bone presents values from +700, for spongy bone, to +3000, for dense bone (cochlea). This is an important aspect of imagistic examination for the purpose of bone density assessment. Similarly, the difference between soft tissue values and the air is large, thus allowing a clear analysis of maxillary sinuses and other anatomical structures [
3]. Therefore, the Hounsfield scale represents the tissue’s relative density on a calibrated grayscale, one based on values for air, water, and bone density. The results of a study by Nackaerts indicated a strong linear relationship between the gray scales in CBCT and HU in CT [
4].
The primary stability of the dental implant is dictated by the bone quantity and bone quality at the implant insertion site, as well as the surgical placement technique and geometry of the implant [
5]. The bone quality is determined by several factors that contribute to bone resistance. However, as an objective and quantifiable measure of bone quality analysis, most clinicians use bone density as expressed on the Hounsfield scale. Poor primary stability and higher failure rates are more common among implants placed in low-density bones [
6]. Therefore, a good preoperative assessment of bone density can guide the clinician’s decision regarding the implant type, the drilling procedure for the implant cavity, and the surgical technique to be used [
7].
When implants are surgically inserted, they rely on their macrostructure combined with the surgical protocol to provide primary stability, which is the initial level of mechanical stability in the bone. As the bone heals, the process of osseointegration produces secondary stability, which is responsible for the long-term success of the implant. During the bone remodeling process after implant placement, primary stability decreases while secondary stability increases from new bone formation [
8].
The second factor is the implant’s thread design. Implants with very short threads, and those with threads spaced closely together, tend to have poorer primary stability than do implants with wider and more aggressive cutting threads. Consequently, in cases with reduced bone density, primary implant stability can be improved by using implants with more aggressive threads [
9].
The drilling technique is another major aspect to be considered when a quickly established primary stability of the implant is sought. Increased stability may be achieved with various degrees of under-preparation of the osteotomy. In general, the combination of increased implant diameters with reductions in osteotomy dimensions results in proportionally increased insertion torque levels during implant placement [
10,
11].
The osseo-densification drilling technique is based on the concept of a non-subtractive multi-stepped drilling process using burs that allow bone preservation and autografting compaction along the osteotomy wall [
12]. The densifying bur presents a cutting chisel and tapered shank, allowing it to progressively increase the diameter as it is moved deeper into the osteotomy site, thereby controlling the expansion process. Also, drilling can be operated in both counterclockwise and clockwise rotation directions at high drilling speeds. The counterclockwise drilling direction is more efficient for the densification process and is utilized in low-density bone, while the clockwise drilling direction is suitable for higher-density bone [
13].
Cone beam computed tomography (CBCT) technology has had a significant impact on oral implantology and is currently the most used tool for assessing bone quantity and quality during dental implant planning.
The accuracy of CBCT in determining bone density has been evaluated in multiple studies [
14,
15,
16]. In this context, Parsa et al. compared CBCT with both traditional and microcomputed CT, and the results indicated a strong correlation between CT and CBCT, thus confirming that these methods have similar accuracy for bone density assessment [
17]. Artifacts caused by metallic implants degrade the image quality and decrease the diagnostic value of the examination. In the reconstructed CBCT image, the presence of metallic inserts causes severe metal artifacts that reduce the diagnostic performance; metal artifact reduction can be accomplished using deep learning methods [
18]. Peri-implant artifacts were observed in all bone types when CBCT was used to assess the effect of exposure parameters on metal artifacts of dental implants placed in various bone densities, therefore, a smaller FOV can be used to reduce metal artifacts [
19].
Lekholm and Zarb suggested a bone classification system based on macrostructure, one in which the morphology and distribution of the cortical and trabecular bone determined the bone quality [
20,
21].
Bone mineral density quantified as CT values (HU) was originally categorized by Misch into five ranges: D1 bone for a HU value greater than 1250, D2 bone for values between 850 and 1250 HU next to the implant-bone interface, D3 bone for values from 350 to 850 Hu at the implant site, D4 bone from 150 to 350 HU at the site, and D5 bone for less than 150 HU [
22]. Based on Misch’s classification, Trisi and Rao proved that the histomorphometry of the trabecular bone volume strongly correlates with bone resistance measurements in D1 and D4 bones. However, there was a high degree of variation in terms of the D2 and D3 bones [
23].
Since preoperative bone density values guide the clinician in planning the intervention and in choosing the right dental implants and surgical protocols, there is important clinical value in the investigation of preoperative bone densities before dental placement.
A recent study regarding bone density assessment, in Hounsfield Units, of dental implant sites with both CBCT and medical CT showed that bone density values were generally higher for CBCT, even though the correlations between the CBCT and CT values were high [
1]. Using CBCT, it was determined that the anterior mandible had the highest mean bone density, and that the posterior maxilla had the lowest mean bone density [
24]. Another study, using dual energy X-ray absorptiometry, revealed that the maxillary anterior and premolar regions had the lowest bone mineral density and the mandibular anterior region had the highest [
25].
Therefore, this study aimed to assess preoperative bone densities in the anterior and posterior maxillary region, as well as in the anterior and posterior mandibular regions of forty implant patients.
The study investigated the null hypothesis that bone density of the alveolar crest of maxillary central incisors did not differ significantly from that of mandibular central incisors. A similar null hypothesis has been formulated and tested concerning the bone density of the alveolar crest of maxillary first molars compared to the alveolar crest of mandibular first molars.
2. Results
Forty CBCT scans, belonging to forty partly edentulous patients (both female and male patients, with ages ranging between 18 and 55 years), were analyzed. The number of patients and corresponding edentulous areas are shown in
Table 1.
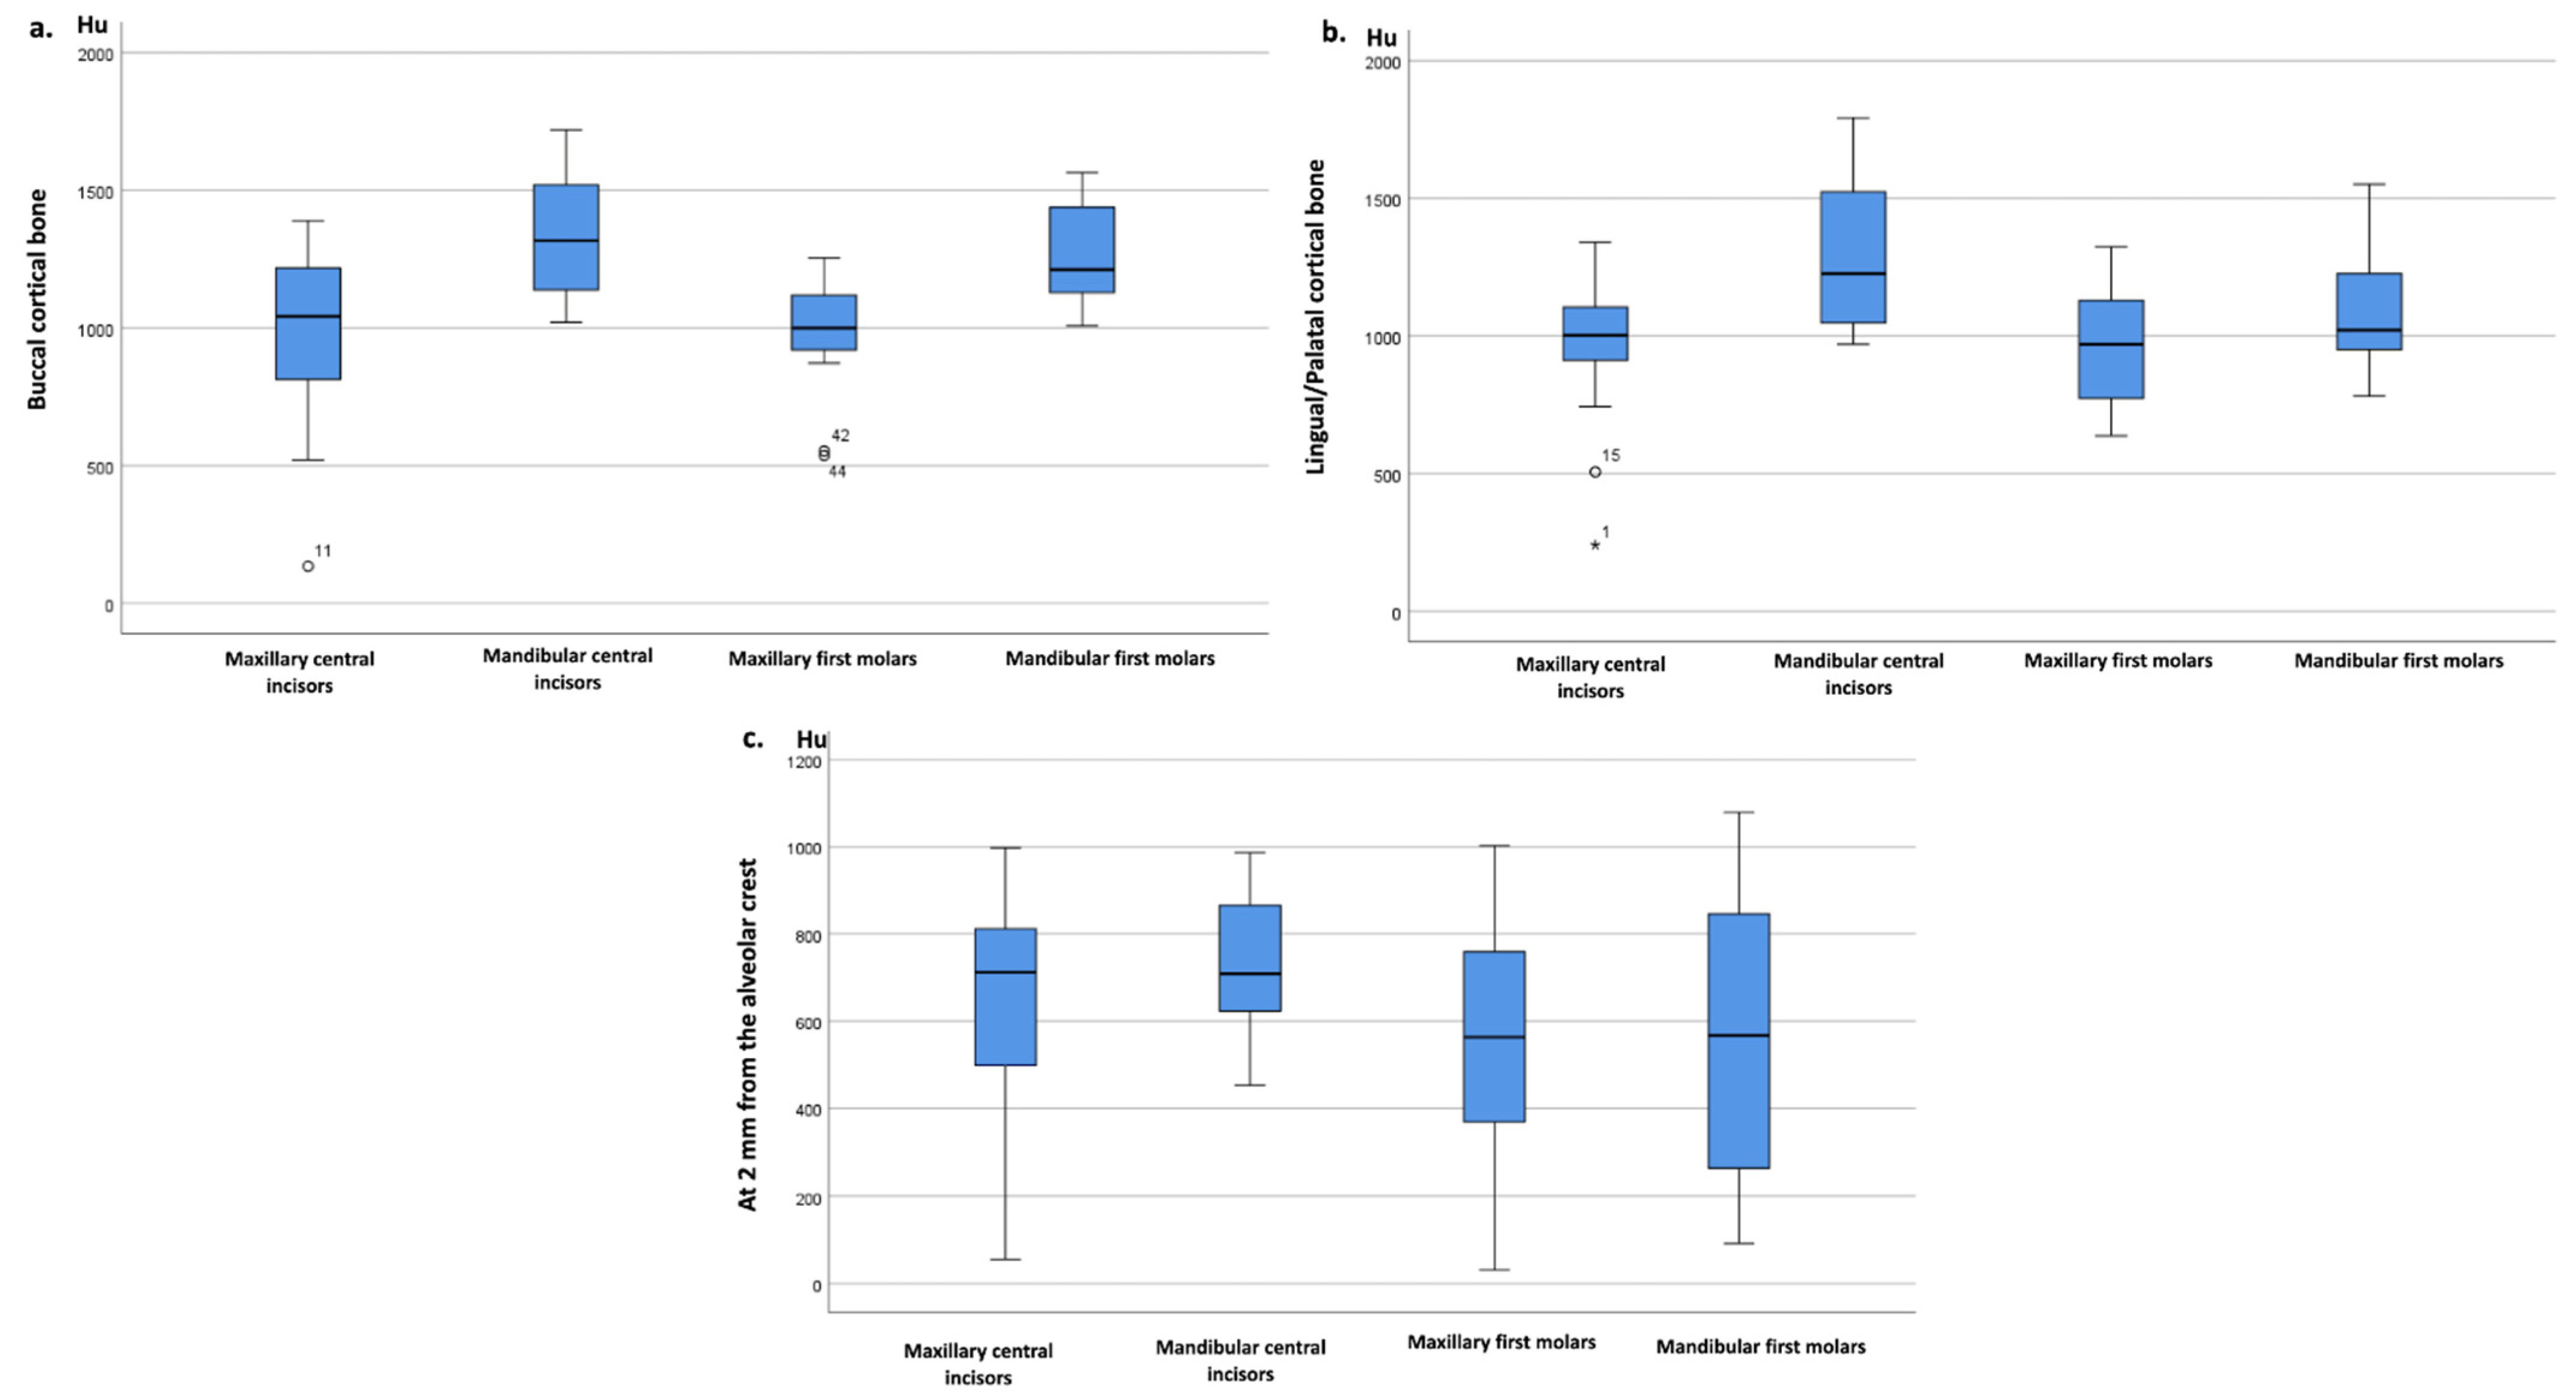
The HU values were assessed at the external buccal and palatal/lingual internal cortical bone level and a depth of 2 mm from the alveolar crest, in the trabecular bone, for each of the four locations. The mean HU value at the buccal and palatal/lingual cortical bone was higher in the mandible central incisors compared to the maxillary central incisors and at the mandible first molars compared to the maxillary first molars. At 2 mm from the alveolar crest, the mean HU value was higher in mandibular central incisors compared to maxillary central incisors, as well as in mandibular first molars compared to maxillary first molars. The HU values of the buccal and palatal or lingual cortical bone and those measured at 2 mm in the maxillary versus mandibular central incisors area, as well as in the maxillary versus mandibular first molar area, are shown in
Table 2, composed of 240 measurements in total.
Higher HU were observed at the sites of mandibular central incisors compared to the sites of maxillary central incisors. The HU values in the mandibular first molars region were higher than those of the maxillary first molars. The mandibular central incisors presented the highest HU values among all analyzed areas and structures (
Figure 1).
In both maxillary and mandibular alveolar crests, HU were slightly higher for incisors compared to molars, but no significant differences could be proven, except for the lingual cortical bone of mandibular central incisors vs. mandibular first molars (p = 0.013; Mann Whitney test). Buccal vs. lingual or palatal cortical HU values did not differ significantly.
3. Discussion
The bone represents a very active tissue that is constantly changing. Bone density differs depending on the jaw topographic area. The bone with the highest density is usually found in the anterior mandible, while the least dense bone is located in the posterior maxillary. Bone density is essential in choosing the type of implant, and it decreases with age. Investigating the bone density of prospective dental implant sites is crucial both for choosing the implant type and for choosing the drilling procedure best suited to ensure implant stability and osseointegration [
24].
The aim of this study was achieved by testing the hypotheses of there being no significant differences between the bone densities in the alveolar crest areas of maxillary and mandibular central incisors, as well as between those corresponding to maxillary and mandibular first molars.
As discussed above, in a retrospective study of CT images, Krikos and Misch established correlations between bone density categories and HU, with D1 having the highest value, at >1250 HU, followed by D2, with values ranging from 850 to 1250 HU, and D3, from 350 to 850 HU; D4 and D5 had the lowest bone density values, at 150 to 350 HU and <150 HU, respectively. Additionally, it was observed that D1 bone was predominantly present in the anterior mandible, followed by D2 and D3 bone quality in the anterior maxillary and posterior mandible. D4 bone quality was primarily observed in the posterior maxillary [
26].
In the current study, bone density was significantly lower at the maxillary level compared to the mandibular level. Moreover, it was observed that D2 bone was present both in the maxillary and in the mandibular central incisors area as well as the mandibular first molars area; contrastingly, in the alveolar crest of maxillary first molars, the D3 bone was present. These results suggest that bone density should be assessed on a case-by-case basis, for each patient, and for each anatomic position (
Table 2). The mandibular crest of central incisors presented the highest values of bone density among all analyzed structures. For all analyzed areas, a tendency toward normal distributions of bone density has been observed; however, some of those distributions exhibit moderate skewness and a few outliers, as can be observed in
Figure 2.
Sogo et al.’s study, which was conducted using a group of 30 patients, assessed bone density in the posterior maxillary areas according to sex, and obtained bone density values between 120 and 1500 HU. The results of the study showed that 495 HU (95% CI; 442–547 HU) represented the average bone density value, which was significantly higher in males’ posterior maxillary areas as compared to those of females (
p = 0.038) [
27].
In the current study, the bone density values for the posterior maxillary areas ranged between 31 and 1564 HU, and the average bone density values for all three structures of interest were similar.
A variation in bone density values among different studies is noteworthy. This can be explained by various factors, such as sample size, measuring technique, or inclusion criteria. Furthermore, it has been suggested that females present lower bone density values at certain ages, as compared to males [
28].
The in vivo study by Attili et al., which was conducted using a group of 12 edentulous subjects (6 males and 6 females) seeking implant-supported prosthesis, aimed to assess the bone density of the lingual cortical region of the mandible for the edentulous spaces corresponding to the incisors, canines, premolars, and molars. After obtaining the bone density values for the above-mentioned areas, the authors applied the Mann-Whitney test to analyze the data. They found that the bone density of the cortical bone presented higher values for the incisors than for the molars. Regarding the trabecular bone, bone density values were also higher for the incisor region than for the molar region. Additionally, a correlation was found between the bone density of the buccal cortical bone for all analyzed areas, both in male and female subjects [
29].
In the current study, statistically significant differences were found between the bone density values of the alveolar crest between maxillary and mandibular central incisors in both the palatal, lingual, and buccal cortical bone (
p = 0.001); however, no significant differences were found for the area at a depth of 2 mm from the alveolar crest (
p = 0.029). Regarding the maxillary and mandibular first molars, the results showed statistically significant differences only between those first molars and their buccal cortical bone (
p = 0.001); there were no significant differences with the palatal or lingual cortical bones, or with the area at a depth of 2 mm from the alveolar crest between maxillary and mandibular first molars (
Table 2).
The bone density of the cortical bone found in the current study presented higher values for the mandibular incisors and molars, as compared to the maxillary bones. Regarding the trabecular bone, bone density values were higher for incisors, but not significantly different (except for the palatal lingual cortical bone), compared to molars.
These variations in bone density between different regions could be due, on one hand, to the difference in functions fulfilled by the two jaws, and, on the other hand, to the different muscle insertion sites, which differ from region to region.
For an implant therapy to be successful, the most important aspect is proper treatment planning, which is made possible through dental imaging. It should be noted that to best determine the steps to be followed in dental implant insertion, each patient’s particularities, medical history, treatment regimen, and associated pathologies, such as osteoporosis or former chemo/radiotherapy treatment, should be considered. Nonetheless, CT or CBCT analysis of the bone tissue remains crucial in choosing the type of implant and drilling procedure, both from the perspective of bone height and width, and that of bone density assessment.
The in vitro study by Sugiura et al. compared the primary stability of cylindrical implants in different types of bone densities with that of tapered implants. The results of that study indicated that the use of tapered implants was advantageous for improving the primary stability in patients with a low-density trabecular bone when the crestal cortical bone was well-represented. Clinically, the effectiveness of tapered implants compared to cylindrical implants can be observed when implants are inserted in the posterior maxillary [
30].
In the current study, the cortical bone presented higher bone density values than the trabecular bone. This confirms that tapered implants may constitute a superior choice, as they provide increased (higher) lateral compression and stiffness. This type of implant allows for better primary stability and a higher success rate of implant integration [
26].
The limitations of this study include its retrospective nature, its limited sample size, and the heterogeneity of the included patients. Because of the limited amount of clinical information that could be retrieved from medical records, only basic inclusion/exclusion criteria could be applied to the records; hence the dataset under analysis included a population of mostly heterogeneous patients.
Further studies regarding the choice of implant types according to the bone density estimated by CBCT and the success rate of their integration could guide clinicians in choosing optimal treatment solutions.
4. Materials and Methods
The present retrospective study analyzed (according to the STROBE checklist) a total of forty CBCT scans that met the study inclusion criteria and were performed between October 2020 and April 2021, belonging to forty partly edentulous patients (both female and male patients, with the chronological age ranging between 18 and 55 years). From the forty patients, a total of eighty measurements were taken, composed of twenty for each of the following areas: maxillary central incisors, mandibular central incisors, maxillary first molars, and mandibular first molars. HU values at the buccal cortical bone, palatal cortical bone, and 2 mm from the alveolar crest were evaluated for each of the four locations, equaling 240 measures in total. All patients were appropriately informed through the anamnesis questionnaire and signed an agreement authorizing their inclusion in this study. Due to the observational nature of our study, ethical approval was not necessary.
Some of the patients included in the study had edentulous spaces only in the anterior region or only in the posterior region, and another part of them presented edentulous spaces in both regions.
The inclusion criteria were comprised of patients with limited frontal edentulous spaces in the central incisor area and lateral edentulous spaces in the 6-year molar area, in both the maxillary and the mandibular arch.
The exclusion criteria were comprised of patients with extended edentulous spaces, completely edentulous patients (in both maxillary and mandibular arches), patients with a history of radiotherapy in the maxillofacial area, patients with dental prosthesis devices containing metal alloys close to the edentulous spaces to eliminate possible bone density measurement errors produced by these artifacts, or patients with bone abnormalities at the jaw level.
All patients had undergone CBCT examination, with the CBCT scans being analyzed using Blue Sky Plan 4 software. (Blue Sky Plan V4.9.4 64bit, 800 Liberty Drive Libertyville, IL, USA) Exposure parameters were 70 kV and 8 mA for 12 s. The HU were automatically calculated by the software with its built-in density measuring tool, using Blue Sky Plan 4 software. The spatial coordination tool (x, y) was used to select the area of interest. The y-coordinate, which varies vertically, was kept constant, while the x-coordinate, which varies horizontally, was tangentially positioned at the level of the edentulous space included in the study (
Figure 2).
In the vertical plane, the distance from the alveolar crest to the area at a depth of 2 mm in the trabecular bone was also measured.
HU values were measured twice for each edentulous space on each image (the values obtained were identical), and the resulting mean measurement was computed and recorded in a database. The collected data were grouped by tooth position, as presented in
Table 3.
Hemiarches 1 and 2 were grouped under the names of maxillary central incisors and maxillary first molars for the anterior and posterior areas, respectively. Hemiarches 3 and 4 were also united under the names of mandibular central incisors and mandibular first molars for the anterior and posterior areas, respectively.
Statistical analysis was performed using IBM SPSS Statistics 20 (Armonk, NY, USA). Quantitative variables were described as mean, standard deviation (SD), median, interquartile range (IQR), and minimum and maximum values. The normality of data distributions was evaluated using Q-Q plots and the Shapiro-Wilk test. Relevant data representations were performed and reported using box plots. The Mann-Whitney test for independent samples was used to test the study hypotheses. The measurements were retrieved from different patients; therefore, we performed unpaired statistical tests. The significance level for the investigated hypotheses was set at α = 0.05.
5. Conclusions
Using dedicated software for bone density assessment of prospective dental implant sites helps clinicians in choosing the best type of implant and an optimal drilling procedure.
The bone density distribution determined in this study concurred with bone density characteristics found in the published literature. The highest bone density value was found in the anterior mandibular area, followed by the anterior maxillary area. Conversely, the lowest bone density values were found in the posterior mandible region, followed by the posterior maxillary region.
The mandibular central incisor area exhibited higher bone density values compared to the maxillary central incisor area in all the three analyzed structures. Likewise, the mandibular first molar area displayed higher bone density compared to that of the maxillary first molars.
An objective assessment and a site-specific examination of bone density before implant placement may offer clinicians valuable information for the selection of implant size and drilling protocol.
The small number of studies performed so far on this topic and the moderate sample size included in the present study suggest the need for additional research on larger patient samples.
Author Contributions
Conceptualization, L.M., M.B. and C.D.; methodology, S.B., H.C., A.M. and C.D.; software, H.C.; validation, L.M., G.B., M.B., S.B., H.C., A.M., O.A. and C.D.; formal analysis, G.B. and M.B.; investigation, S.B., M.B. and H.C.; resources, L.M. and A.M.; data curation, S.B., O.A. and C.D.; writing—original draft preparation, L.M., A.M., O.A. and S.B.; writing—review and editing, L.M., A.M., O.A., H.C. and C.D.; visualization, L.M., G.B., M.B., S.B., H.C., A.M., O.A. and C.D.; supervision, G.B. and M.B.; project administration, G.B. All authors contributed equally to this paper. All authors have read and agreed to the published version of the manuscript.
Funding
This research received no external funding.
Institutional Review Board Statement
Not applicable.
Informed Consent Statement
Informed consent was obtained from all subjects involved in the study.
Data Availability Statement
The data presented in this study are available from the corresponding author upon reasonable request.
Conflicts of Interest
The authors declare no conflict of interest.
References
- Aranyarachkul, P.; Caruso, J.; Gantes, B.; Schulz, E.; Riggs, M.; Dus, I.; Yamada, J.M.; Crigger, M. Bone Density Assessments of Dental Implant Sites: 2. Quantitative Cone-Beam Computerized Tomography. Int. J. Oral Maxillofac. Implants 2005, 20, 416–424. [Google Scholar] [PubMed]
- Romans, L. Computed Tomography for Technologists: A Comprehensive Text, 2nd ed.; Lippincott Williams & Wilkins: Philadelphia, PA, USA, 2018; ISBN 978-1-4963-7585-8. [Google Scholar]
- Glide-Hurst, C.; Chen, D.; Zhong, H.; Chetty, I.J. Changes Realized from Extended Bit-Depth and Metal Artifact Reduction in CT: Extended Bit-Depth and Metal Artifact Reduction in CT. Med. Phys. 2013, 40, 061711. [Google Scholar] [CrossRef] [PubMed]
- Nackaerts, O.; Maes, F.; Yan, H.; Couto Souza, P.; Pauwels, R.; Jacobs, R. Analysis of Intensity Variability in Multislice and Cone Beam Computed Tomography: Intensity Variability in MSCT and CBCT. Clin. Oral Implants Res. 2011, 22, 873–879. [Google Scholar] [CrossRef] [PubMed]
- Liu, J.; Chen, H.-Y.; DoDo, H.; Yousef, H.; Firestone, A.R.; Chaudhry, J.; Johnston, W.M.; Lee, D.J.; Emam, H.A.; Kim, D.-G. Efficacy of Cone-Beam Computed Tomography in Evaluating Bone Quality for Optimum Implant Treatment Planning. Implant Dent. 2017, 26, 405–411. [Google Scholar] [CrossRef] [PubMed]
- Javed, F.; Ahmed, H.B.; Crespi, R.; Romanos, G.E. Role of Primary Stability for Successful Osseointegration of Dental Implants: Factors of Influence and Evaluation. Interv. Med. Appl. Sci. 2013, 5, 162–167. [Google Scholar] [CrossRef] [PubMed]
- Rios, H.F.; Borgnakke, W.S.; Benavides, E. The Use of Cone-Beam Computed Tomography in Management of Patients Requiring Dental Implants: An American Academy of Periodontology Best Evidence Review. J. Periodontol. 2017, 88, 946–959. [Google Scholar] [CrossRef] [Green Version]
- Misch, C. Misch’s Contemporary Implant Dentistry, 4th ed.; Elsevier Inc.: New York, NY, USA, 2021. [Google Scholar]
- Lee, S.-Y.; Kim, S.-J.; An, H.-W.; Kim, H.-S.; Ha, D.-G.; Ryo, K.-H.; Park, K.-B. The Effect of the Thread Depth on the Mechanical Properties of the Dental Implant. J. Adv. Prosthodont. 2015, 7, 115. [Google Scholar] [CrossRef] [Green Version]
- Stavropoulos, A.; Cochran, D.; Obrecht, M.; Pippenger, B.E.; Dard, M. Effect of Osteotomy Preparation on Osseointegration of Immediately Loaded, Tapered Dental Implants. Adv. Dent. Res. 2016, 28, 34–41. [Google Scholar] [CrossRef] [PubMed]
- Trisi, P.; Berardini, M.; Falco, A.; Podaliri Vulpiani, M. New Osseodensification Implant Site Preparation Method to Increase Bone Density in Low-Density Bone: In Vivo Evaluation in Sheep. Implant Dent. 2016, 25, 24–31. [Google Scholar] [CrossRef] [Green Version]
- Huwais, S.; Meyer, E. A Novel Osseous Densification Approach in Implant Osteotomy Preparation to Increase Biomechanical Primary Stability, Bone Mineral Density, and Bone-to-Implant Contact. Int. J. Oral Maxillofac. Implants 2017, 32, 27–36. [Google Scholar] [CrossRef]
- Lahens, B.; Neiva, R.; Tovar, N.; Alifarag, A.M.; Jimbo, R.; Bonfante, E.A.; Bowers, M.M.; Cuppini, M.; Freitas, H.; Witek, L.; et al. Biomechanical and Histologic Basis of Osseodensification Drilling for Endosteal Implant Placement in Low Density Bone. An Experimental Study in Sheep. J. Mech. Behav. Biomed. Mater. 2016, 63, 56–65. [Google Scholar] [CrossRef]
- Radi, I.A.-W.; Ibrahim, W.; Iskandar, S.M.S.; AbdelNabi, N. Prognosis of Dental Implants in Patients with Low Bone Density: A Systematic Review and Meta-Analysis. J. Prosthet. Dent. 2018, 120, 668–677. [Google Scholar] [CrossRef] [PubMed]
- Pauwels, R. Cone Beam CT for Dental and Maxillofacial Imaging: Dose Matters. Radiat. Prot. Dosimetry 2015, 165, 156–161. [Google Scholar] [CrossRef] [PubMed] [Green Version]
- Felicori, S.M.; da Gama, R.D.S.; Queiroz, C.S.; Salgado, D.M.R.D.A.; Zambrana, J.R.M.; Giovani, É.M.; Costa, C. Assessment of Maxillary Bone Density by the Tomodensitometric Scale in Cone-Beam Computed Tomography (CBCT). J. Health Sci. Inst. 2015, 33, 319–322. [Google Scholar]
- Parsa, A.; Ibrahim, N.; Hassan, B.; Motroni, A.; van der Stelt, P.; Wismeijer, D. Influence of Cone Beam CT Scanning Parameters on Grey Value Measurements at an Implant Site. Dentomaxillofacial Radiol. 2013, 42, 79884780. [Google Scholar] [CrossRef] [PubMed]
- Park, H.S.; Seo, J.K.; Hyun, C.M.; Lee, S.M.; Jeon, K. A Fidelity-embedded Learning for Metal Artifact Reduction in Dental CBCT. Med. Phys. 2022. [Google Scholar] [CrossRef] [PubMed]
- Shokri, A.; Jamalpour, M.R.; Khavid, A.; Mohseni, Z.; Sadeghi, M. Effect of Exposure Parameters of Cone Beam Computed Tomography on Metal Artifact Reduction around the Dental Implants in Various Bone Densities. BMC Med. Imaging 2019, 19, 34. [Google Scholar] [CrossRef]
- Lekholm, U.; Zarb, G.; Brånemark, P.; Alberktsson, T. Tissue Integrated Prostheses: Osseointegration in Clinical Dentistry; Quintessence: Chicago, IL, USA, 1985; Volume III. [Google Scholar]
- Lindh, C.; Petersson, A.; Rohlin, M. Assessment of the Trabecular Pattern before Endosseous Implant Treatment. Oral Surg. Oral Med. Oral Pathol. Oral Radiol. Endodontology 1996, 82, 335–343. [Google Scholar] [CrossRef]
- Myra, A.; Yasir, I.; Farheen, Q.; Muhammad, S.; Zubair, A.; Khurram, A. Assessment of Jaw Bone Density in Terms of Hounsfield Units Using Cone Beam Computed Tomography for Dental Implant Treatment Planning. Pak. Armed Forces Med. J. 2021, 71, 221–227. [Google Scholar]
- Trisi, P.; Rao, W. Bone Classification: Clinical-Histomorphometric Comparison. Clin. Oral Implants Res. 1999, 10, 1–7. [Google Scholar] [CrossRef]
- Hao, Y.; Zhao, W.; Wang, Y.; Yu, J.; Zou, D. Assessments of Jaw Bone Density at Implant Sites Using 3D Cone-Beam Computed Tomography. Eur. Rev. Med. Pharmacol. Sci. 2014, 18, 1398–1403. [Google Scholar] [PubMed]
- Gulsahi, A.; Paksoy, C.; Ozden, S.; Kucuk, N.; Cebeci, A.; Genc, Y. Assessment of Bone Mineral Density in the Jaws and Its Relationship to Radiomorphometric Indices. Dentomaxillofacial Radiol. 2010, 39, 284–289. [Google Scholar] [CrossRef] [Green Version]
- Misch, C. Dental Implant Prosthetics, 2nd ed.; Elsevier Inc.: New York, NY, USA, 2015. [Google Scholar]
- Sogo, M.; Ikebe, K.; Yang, T.-C.; Wada, M.; Maeda, Y. Assessment of Bone Density in the Posterior Maxilla Based on Hounsfield Units to Enhance the Initial Stability of Implants. Clin. Implant Dent. Relat. Res. 2012, 14 (Suppl. 1), e183–e187. [Google Scholar] [CrossRef]
- Kajale, N.; Khadilkar, A.; Shah, N.; Padidela, R.; Mughal, Z.; Chiplonkar, S.; Ekbote, V.; Khadilkar, V. Impact of Adolescent Pregnancy on Bone Density in Underprivileged Pre-Menopausal Indian Women. J. Clin. Densitom. 2022, 25, 178–188. [Google Scholar] [CrossRef]
- Attili, S.; Surapaneni, H.; Kasina, S.P.; Kumar, V.H.C.; Balusu, S.; Barla, S.C. To Evaluate the Bone Mineral Density in Mandible of Edentulous Patients Using Computed Tomography: An In Vivo Study. J. Int. Oral Health 2015, 7, 22–26. [Google Scholar] [PubMed]
- Sugiura, T.; Yamamoto, K.; Horita, S.; Murakami, K.; Kirita, T. Evaluation of Primary Stability of Cylindrical and Tapered Implants in Different Bone Types by Measuring Implant Displacement: An In Vitro Study. Contemp. Clin. Dent. 2019, 10, 471–476. [Google Scholar] [CrossRef] [PubMed]
| Publisher’s Note: MDPI stays neutral with regard to jurisdictional claims in published maps and institutional affiliations. |
© 2022 by the authors. Licensee MDPI, Basel, Switzerland. This article is an open access article distributed under the terms and conditions of the Creative Commons Attribution (CC BY) license (https://creativecommons.org/licenses/by/4.0/).


 ,
, 

