
Driving with a Haptic Guidance System in Degraded Visibility Conditions: Behavioral Analysis and Identification of a Two-Point Steering Control Model

Abstract
:1. Introduction
2. Experiment
2.1. Participants
2.2. Independent Variables
- without fog, without haptic guidance (−F, −A);
- without fog, with haptic guidance (−F, +A);
- with fog, without haptic guidance (+F, −A);
- with fog, with haptic guidance (+F, +A).

2.3. Haptic Guidance System

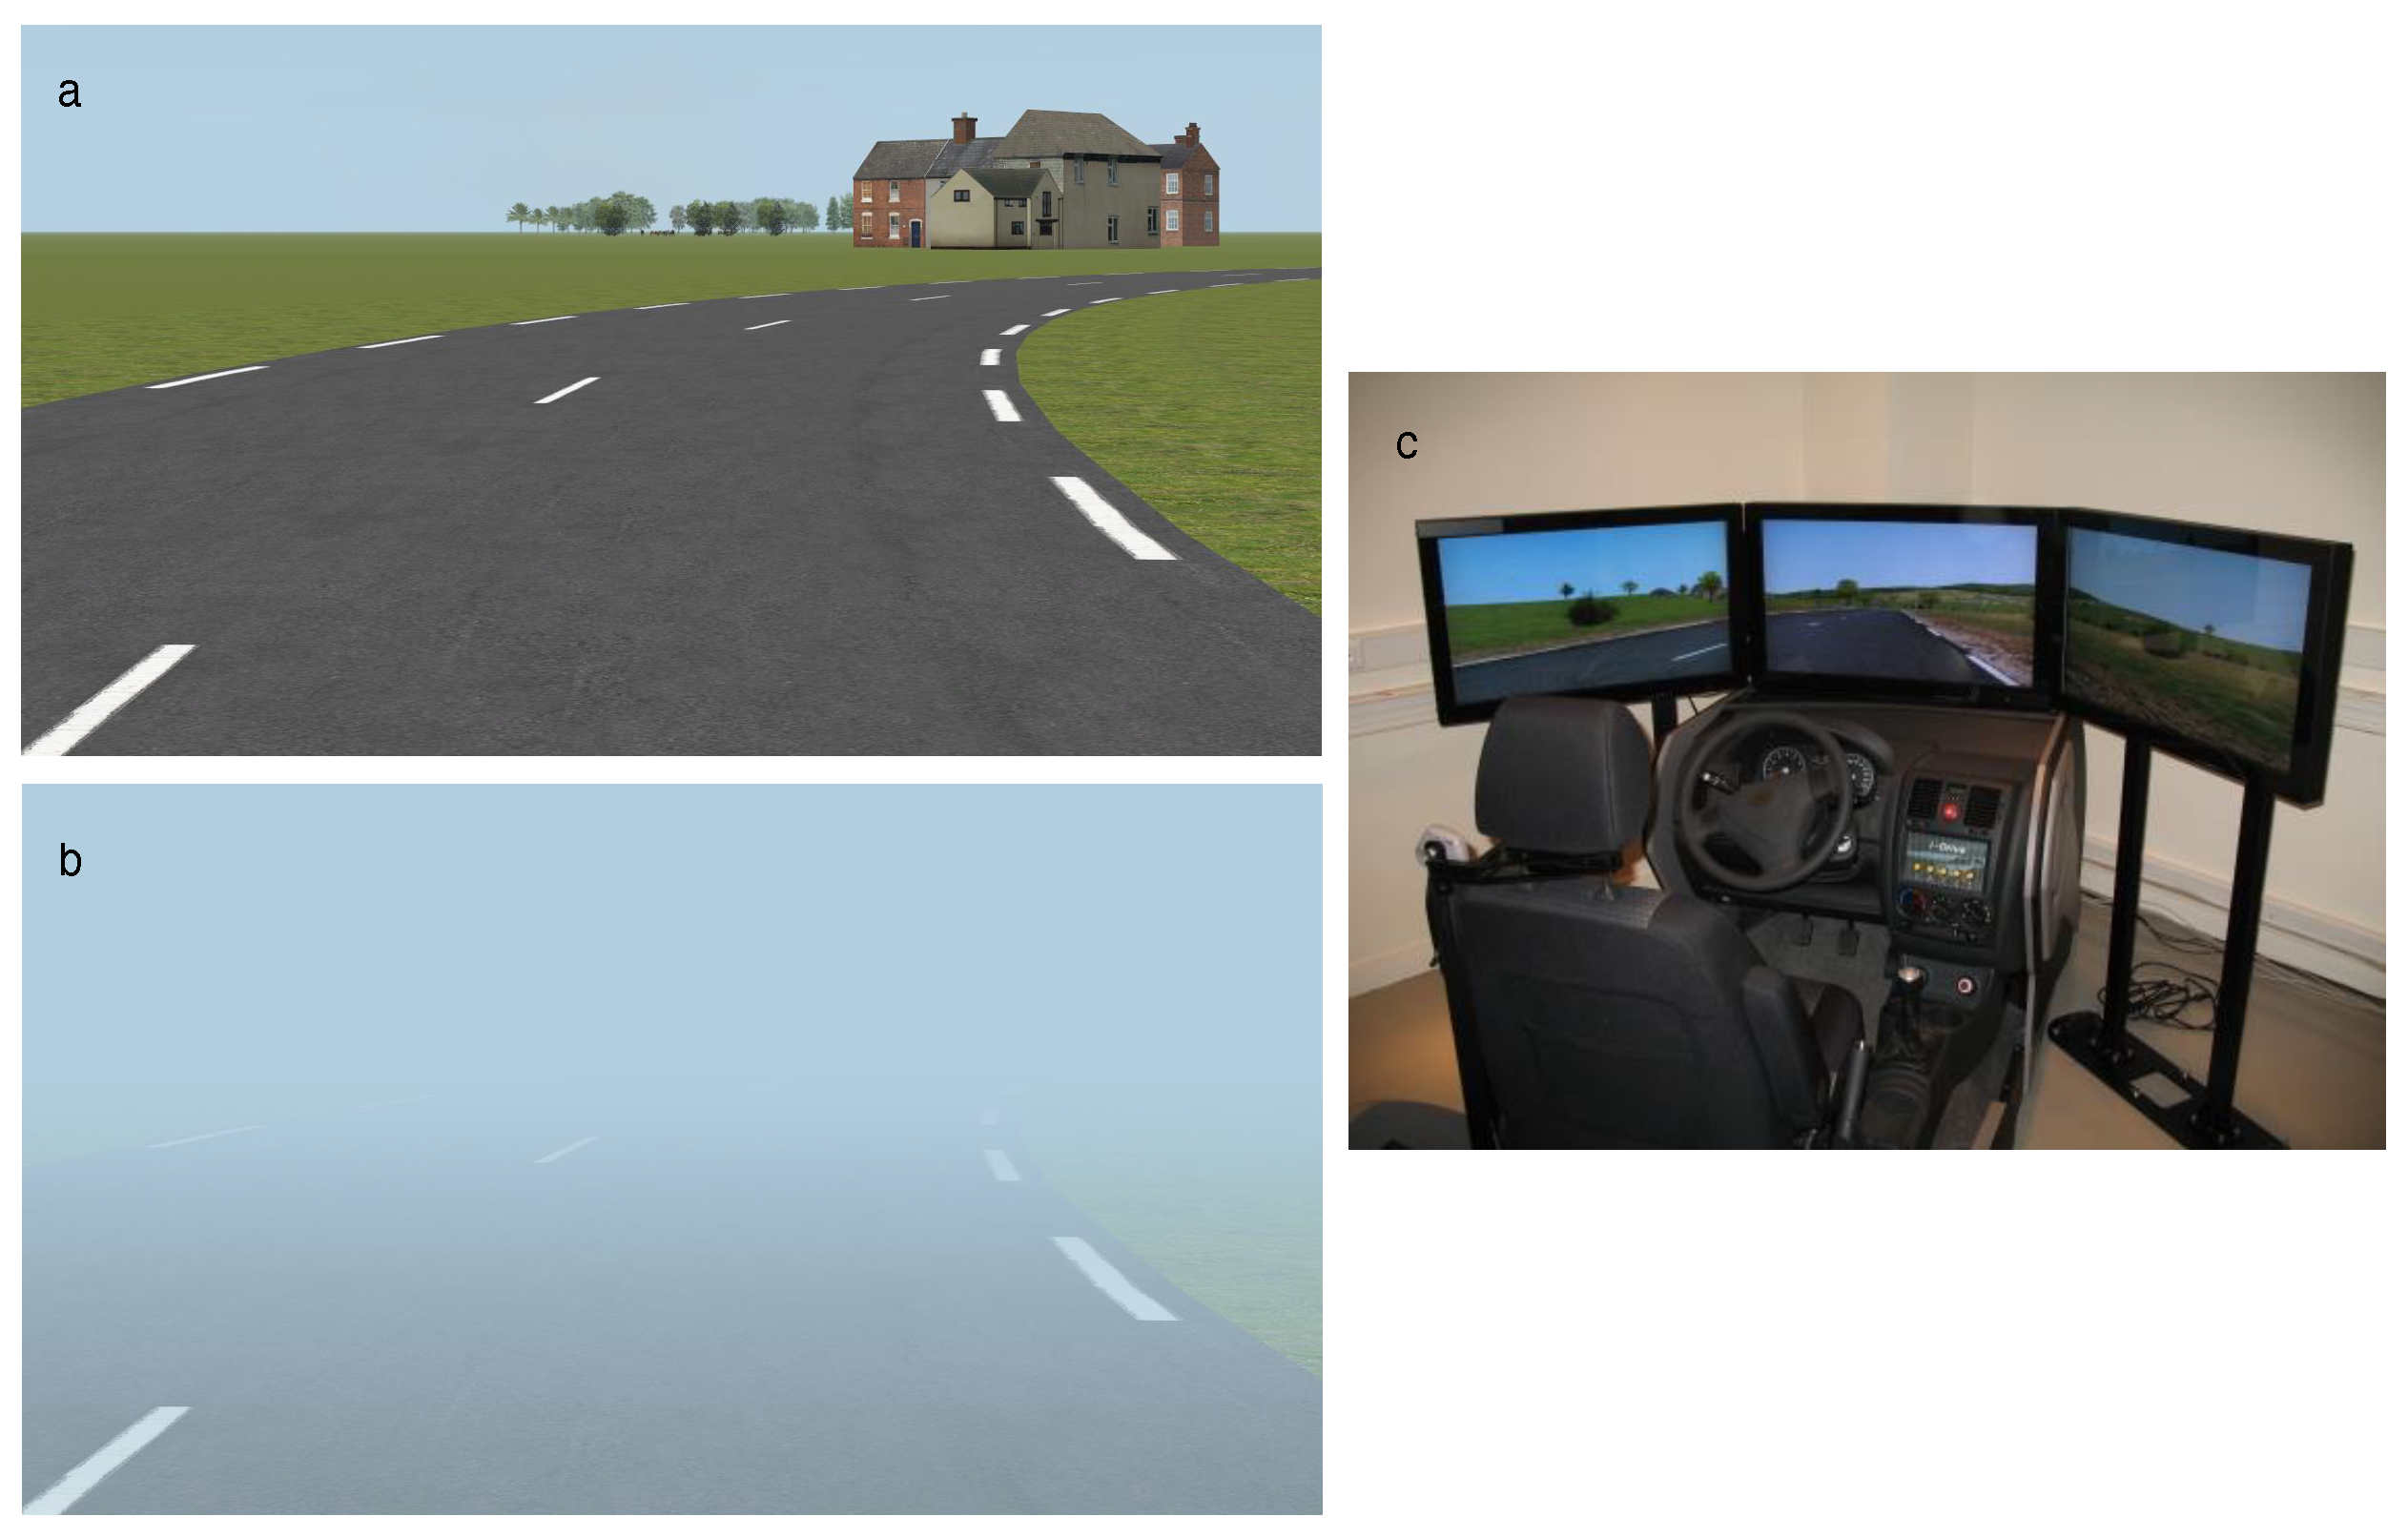
2.4. Apparatus
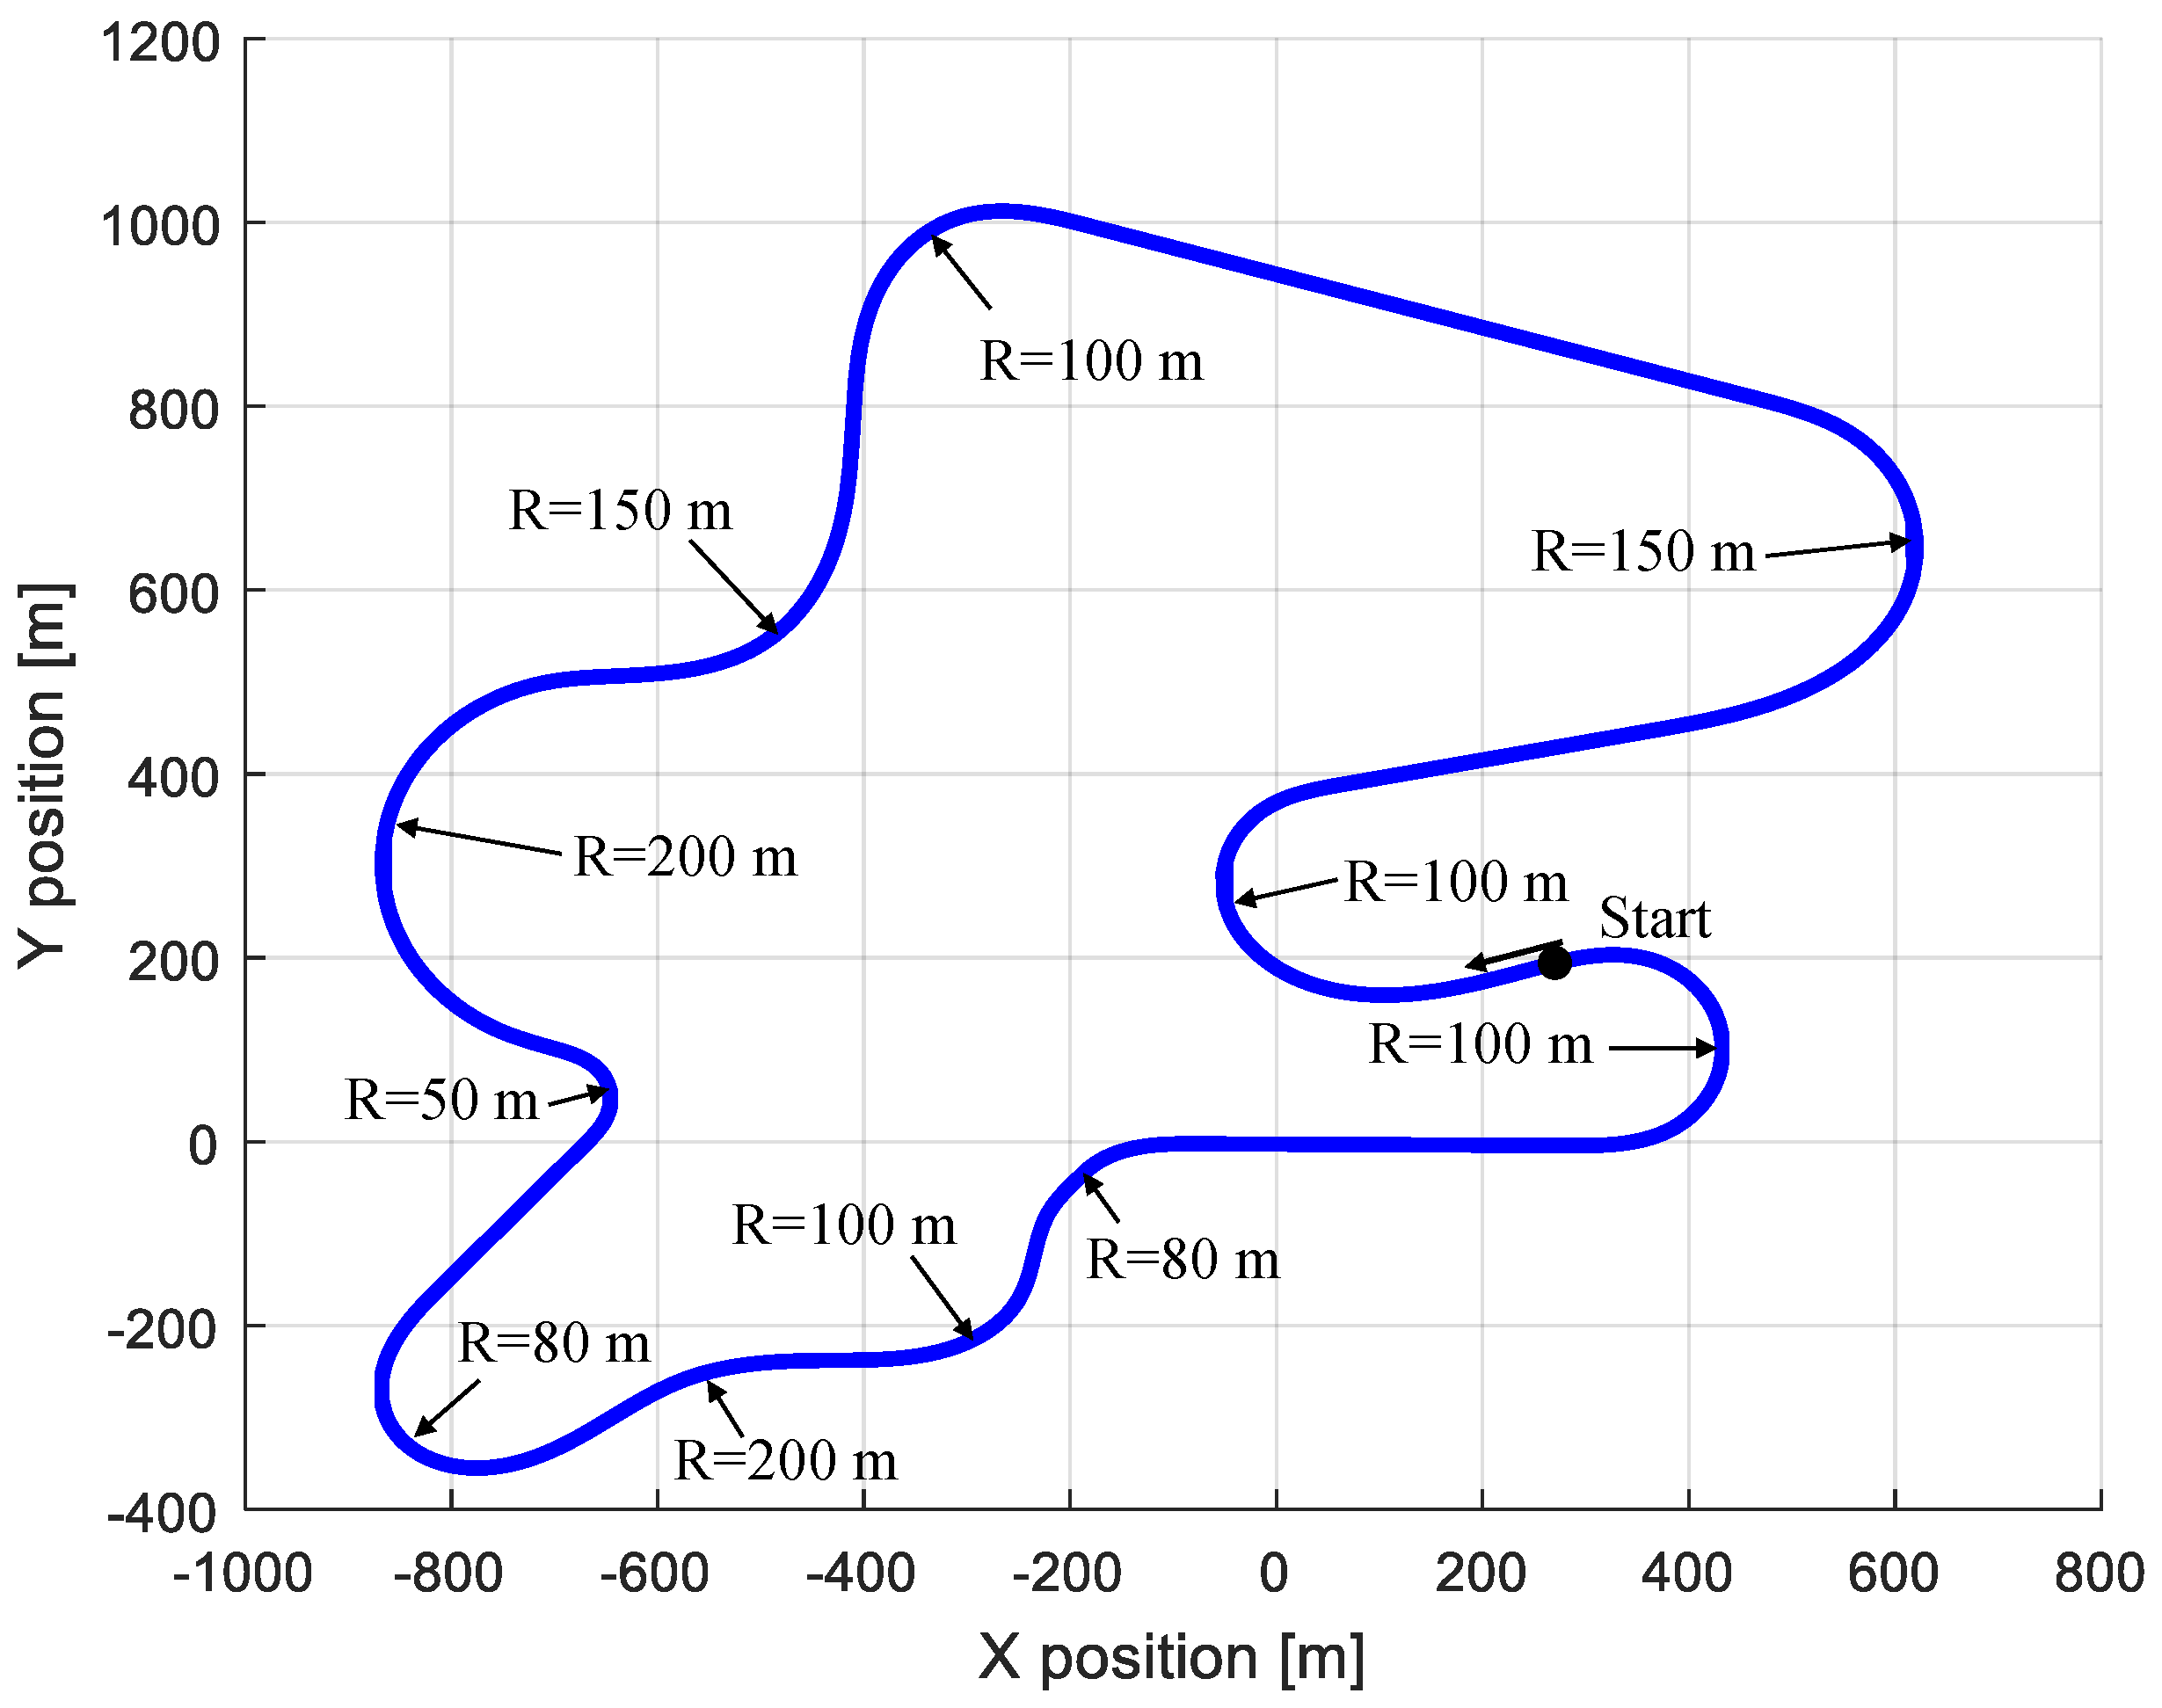
2.5. Scenarios
3. Data Analysis Methods
3.1. Driving Metrics
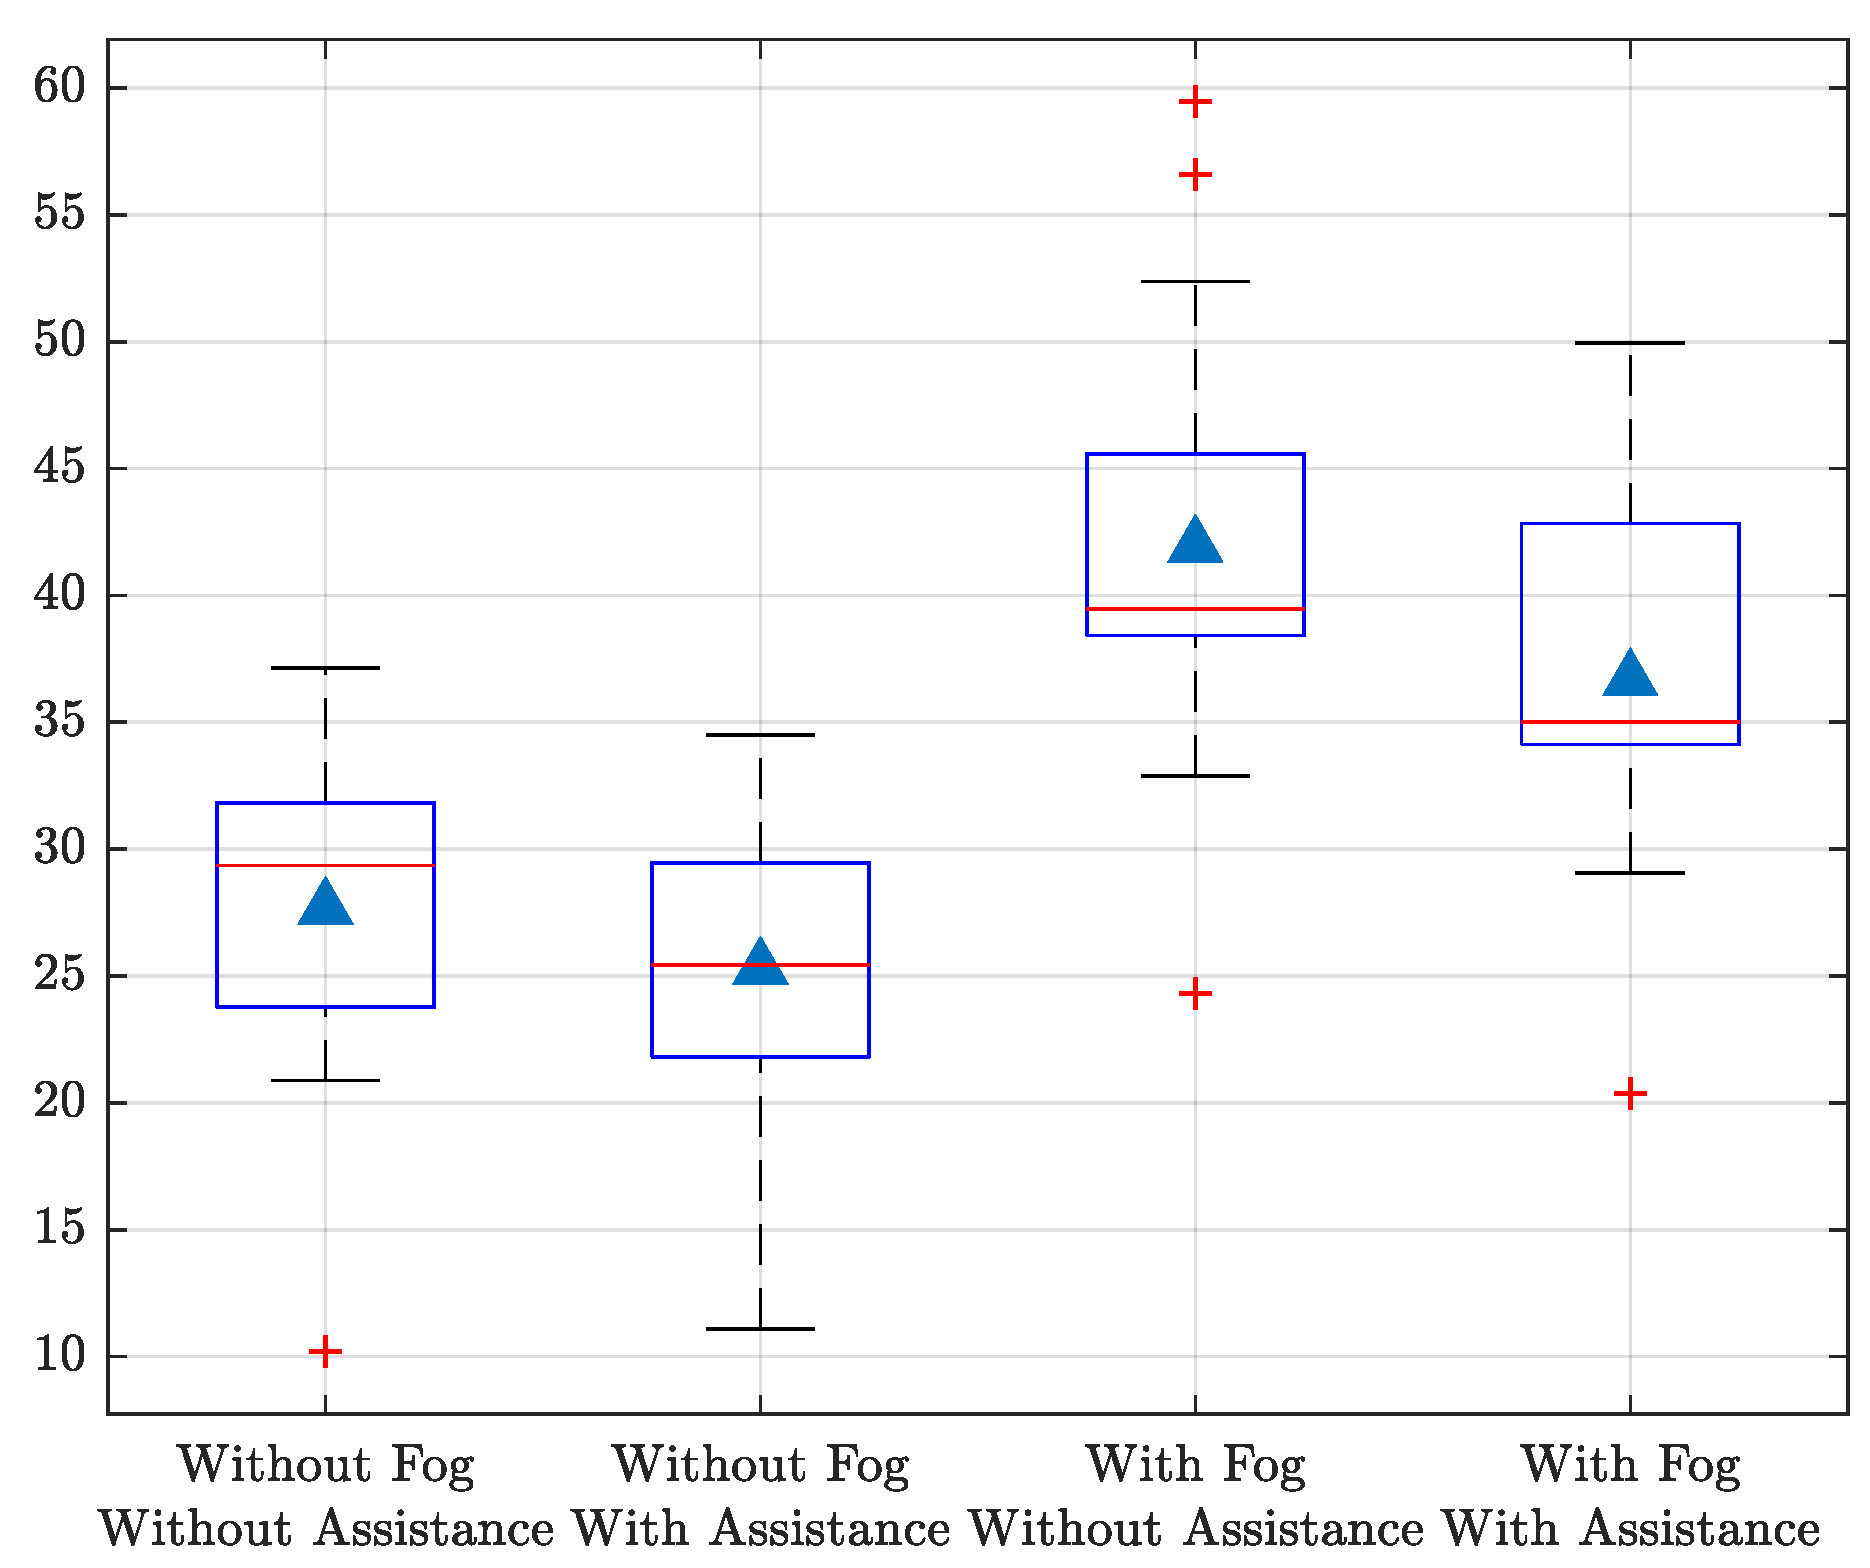
3.1.1. Steering Performance
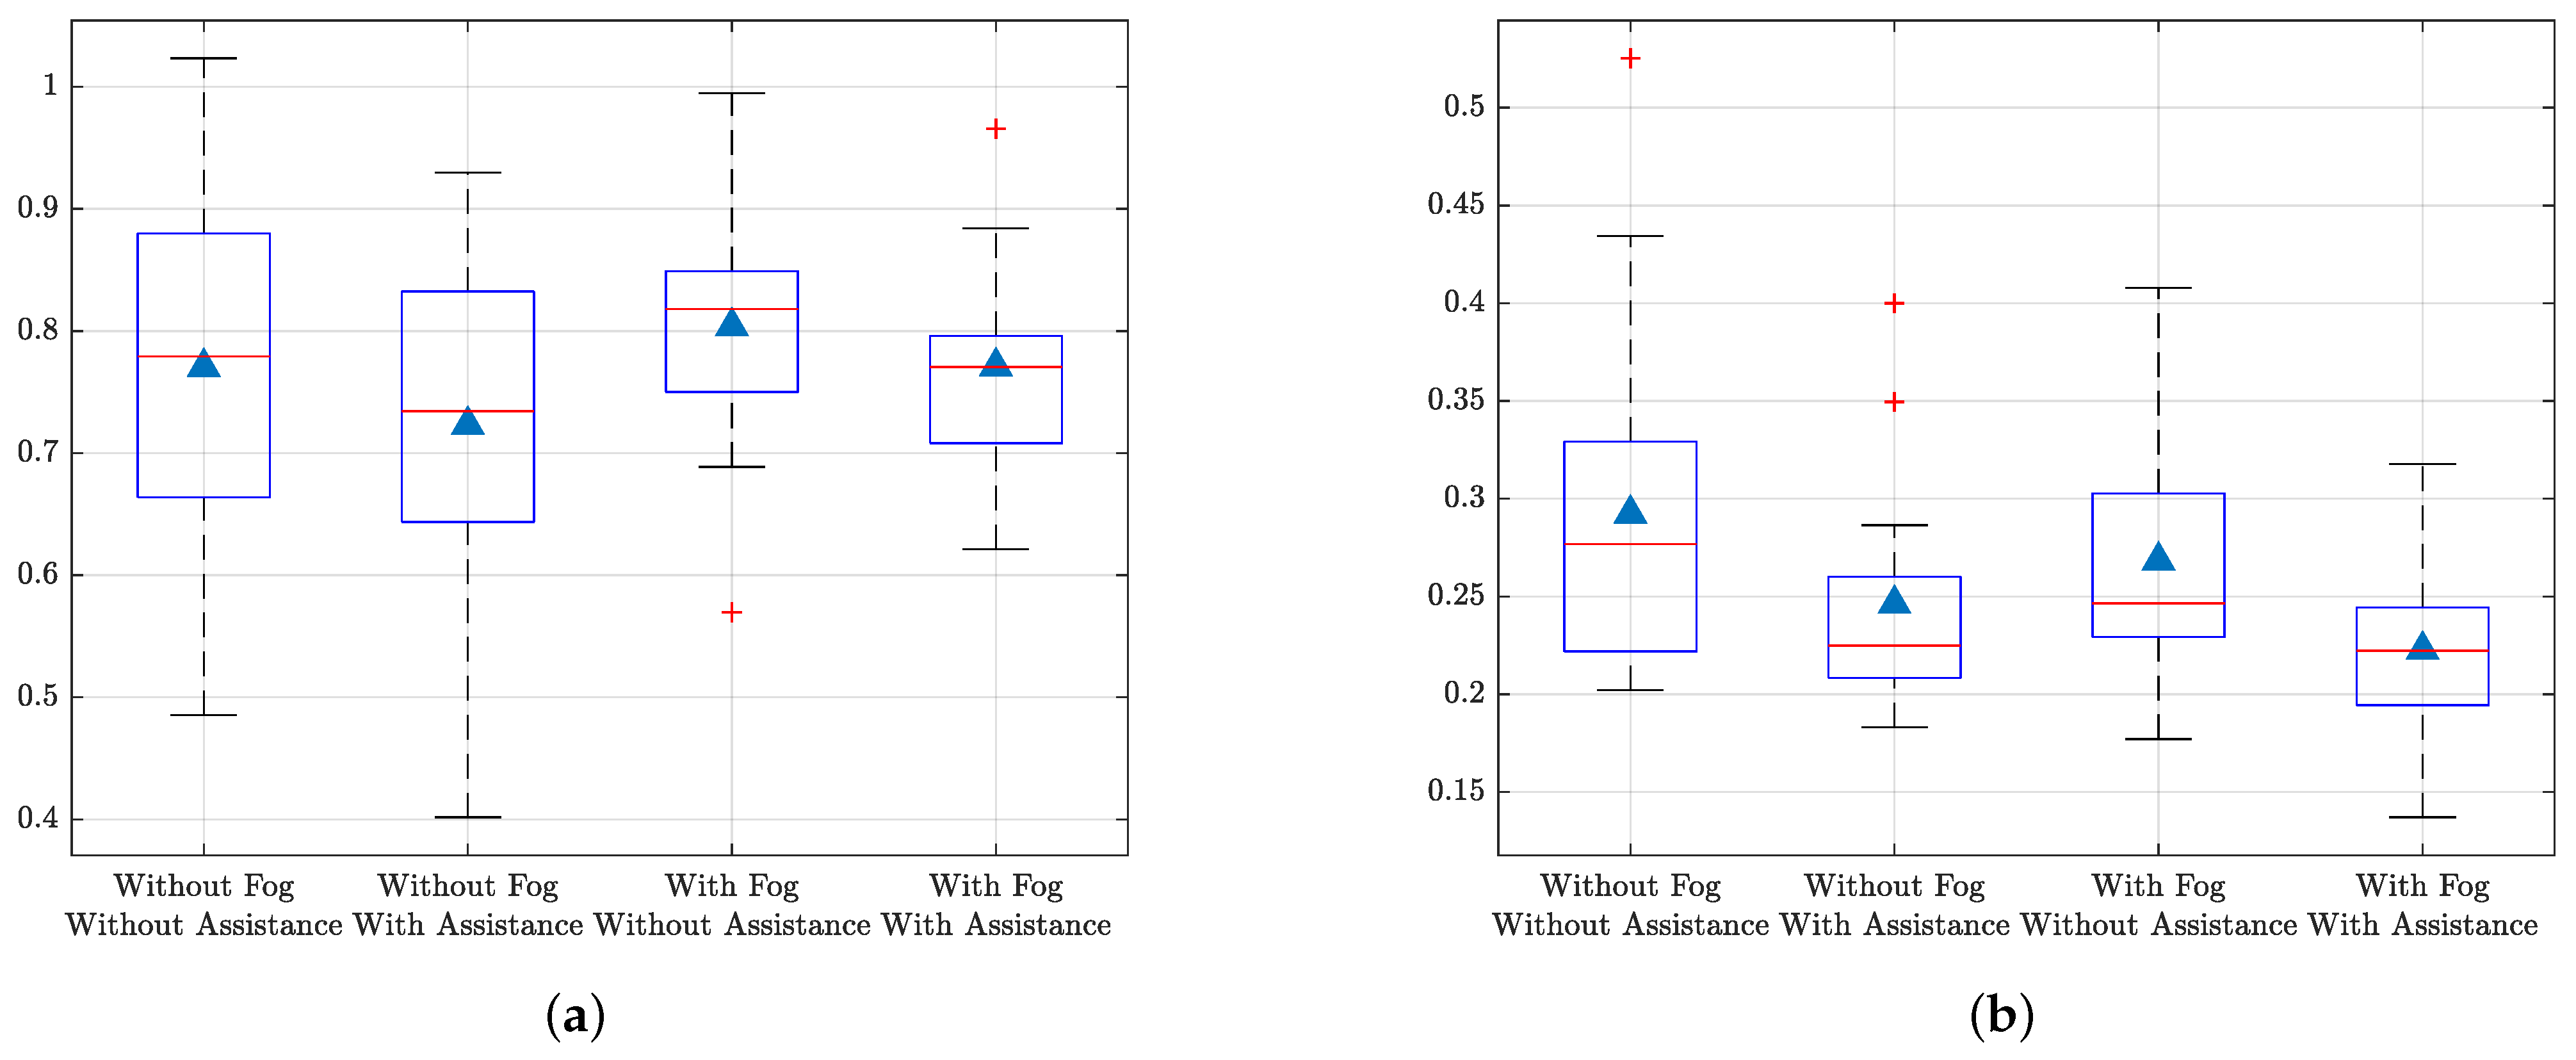
3.1.2. Lane-Keeping Performance
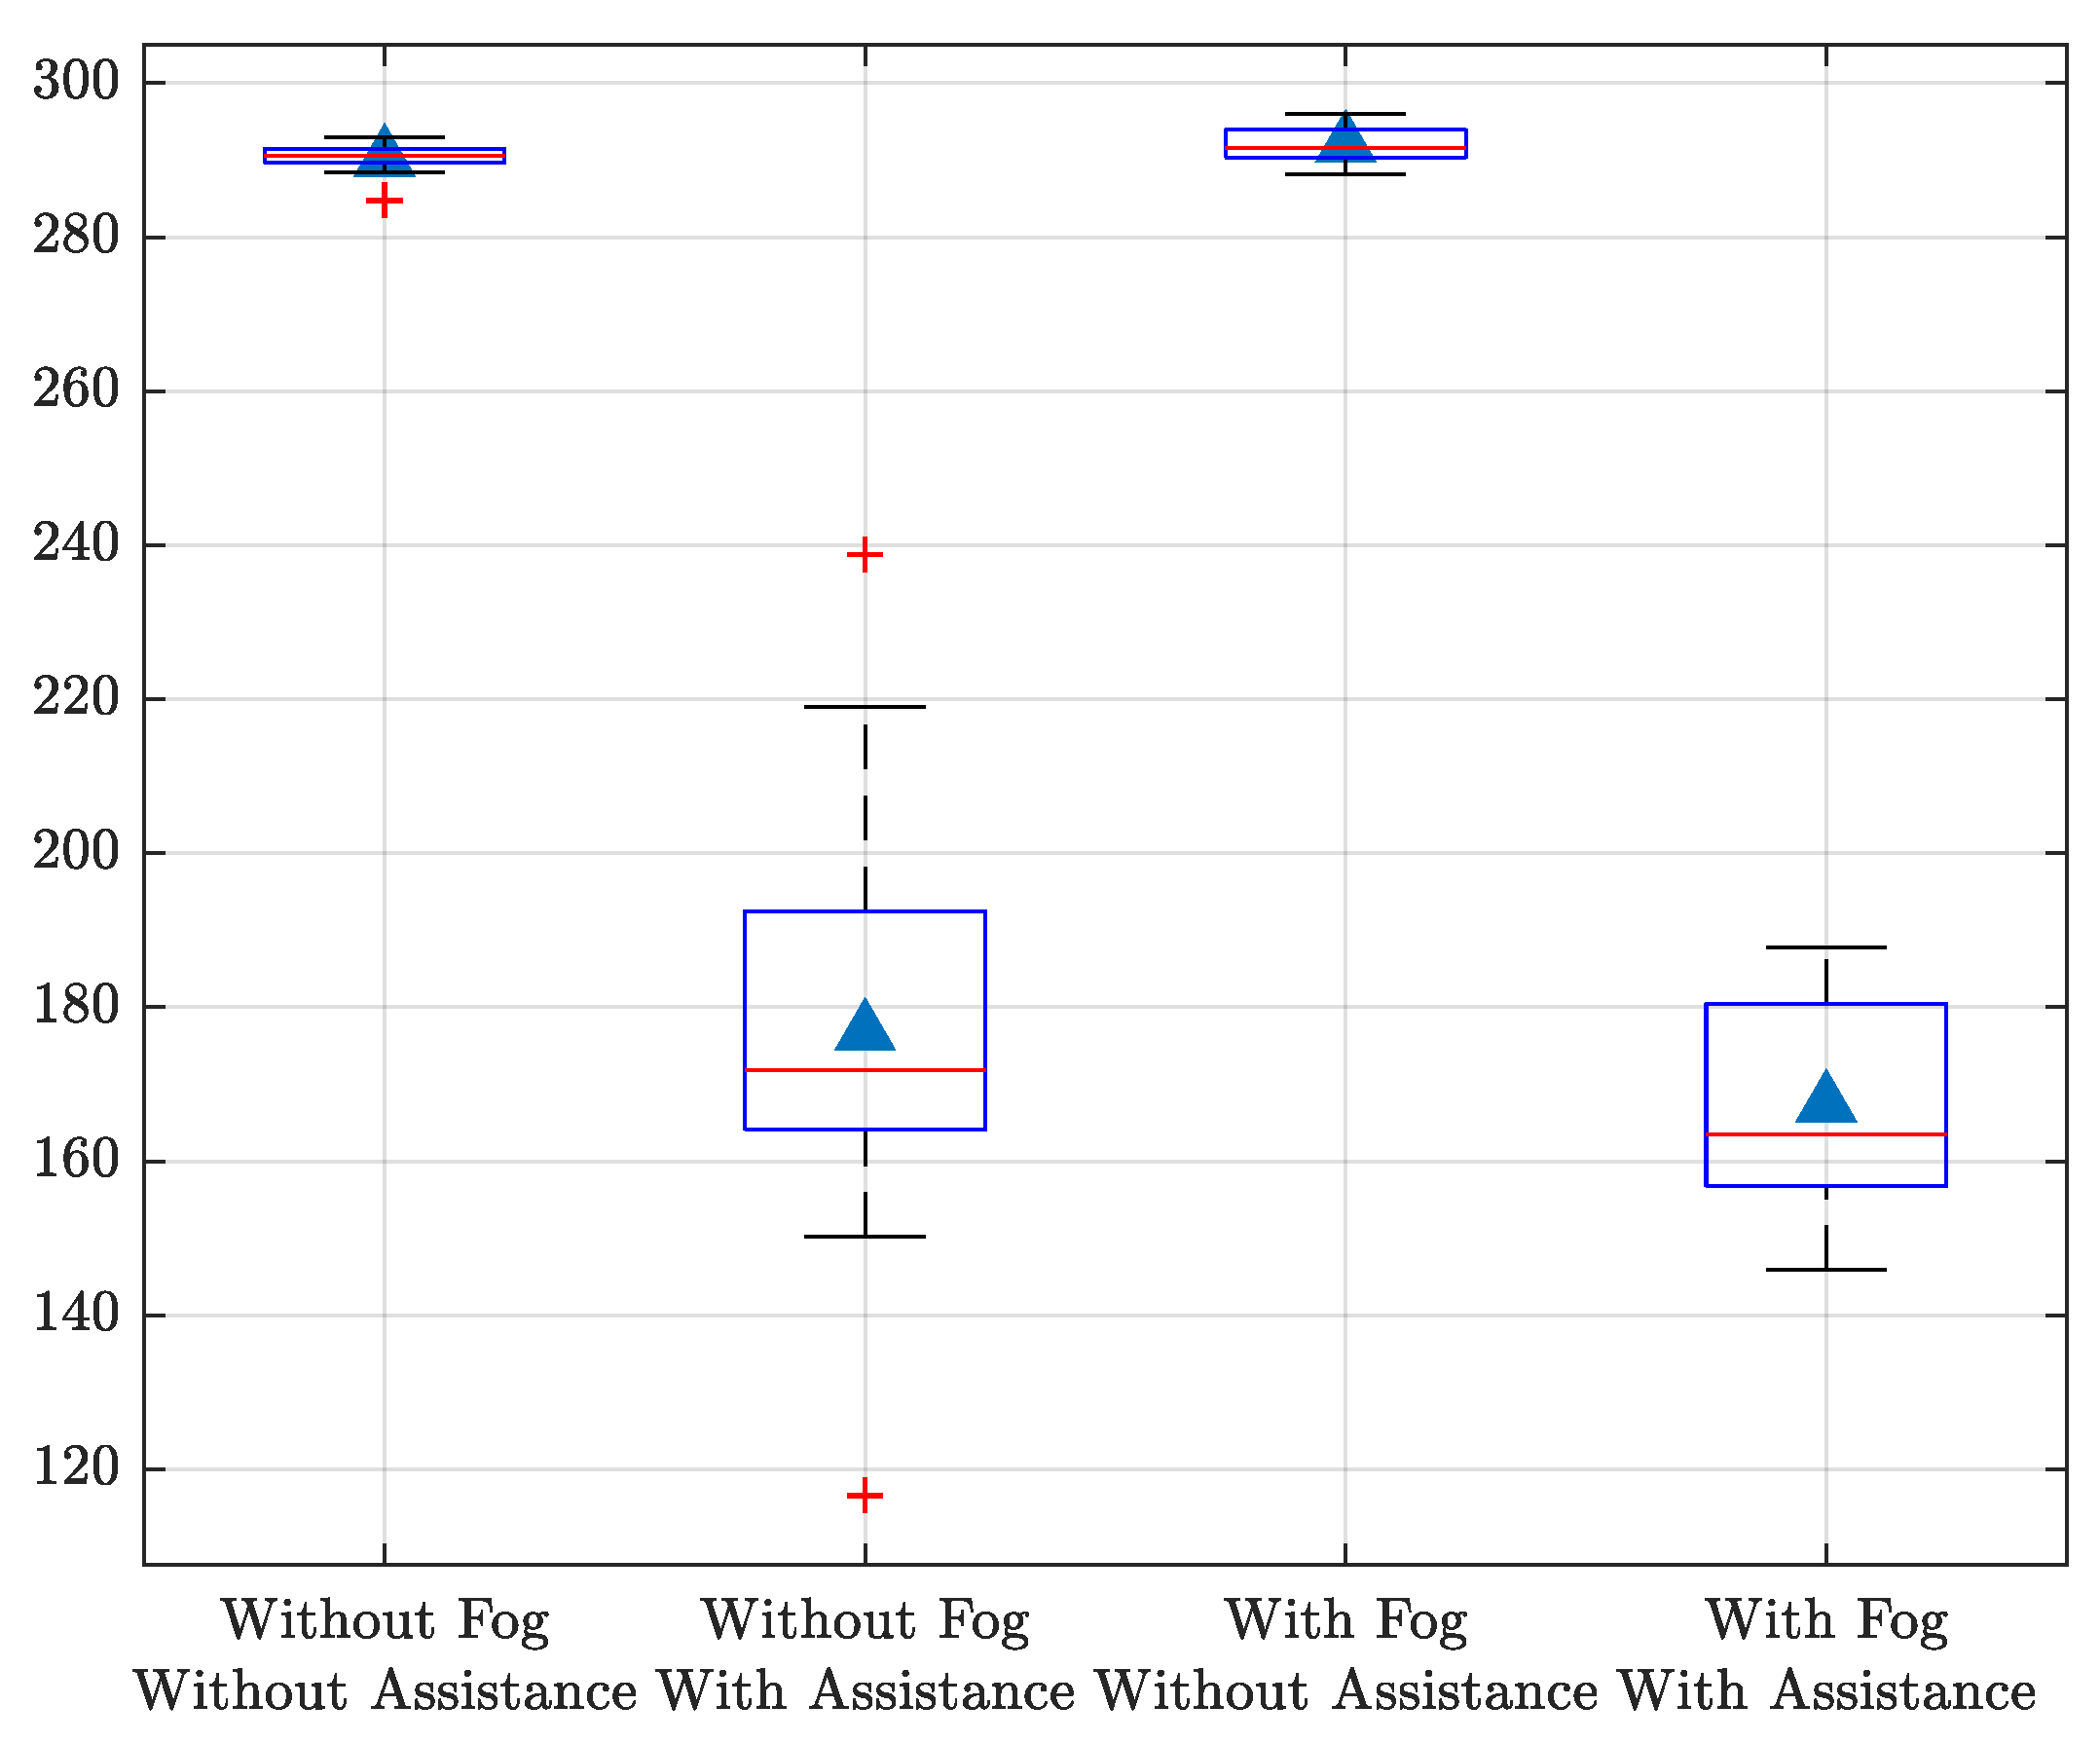
3.1.3. Driver Control Effort
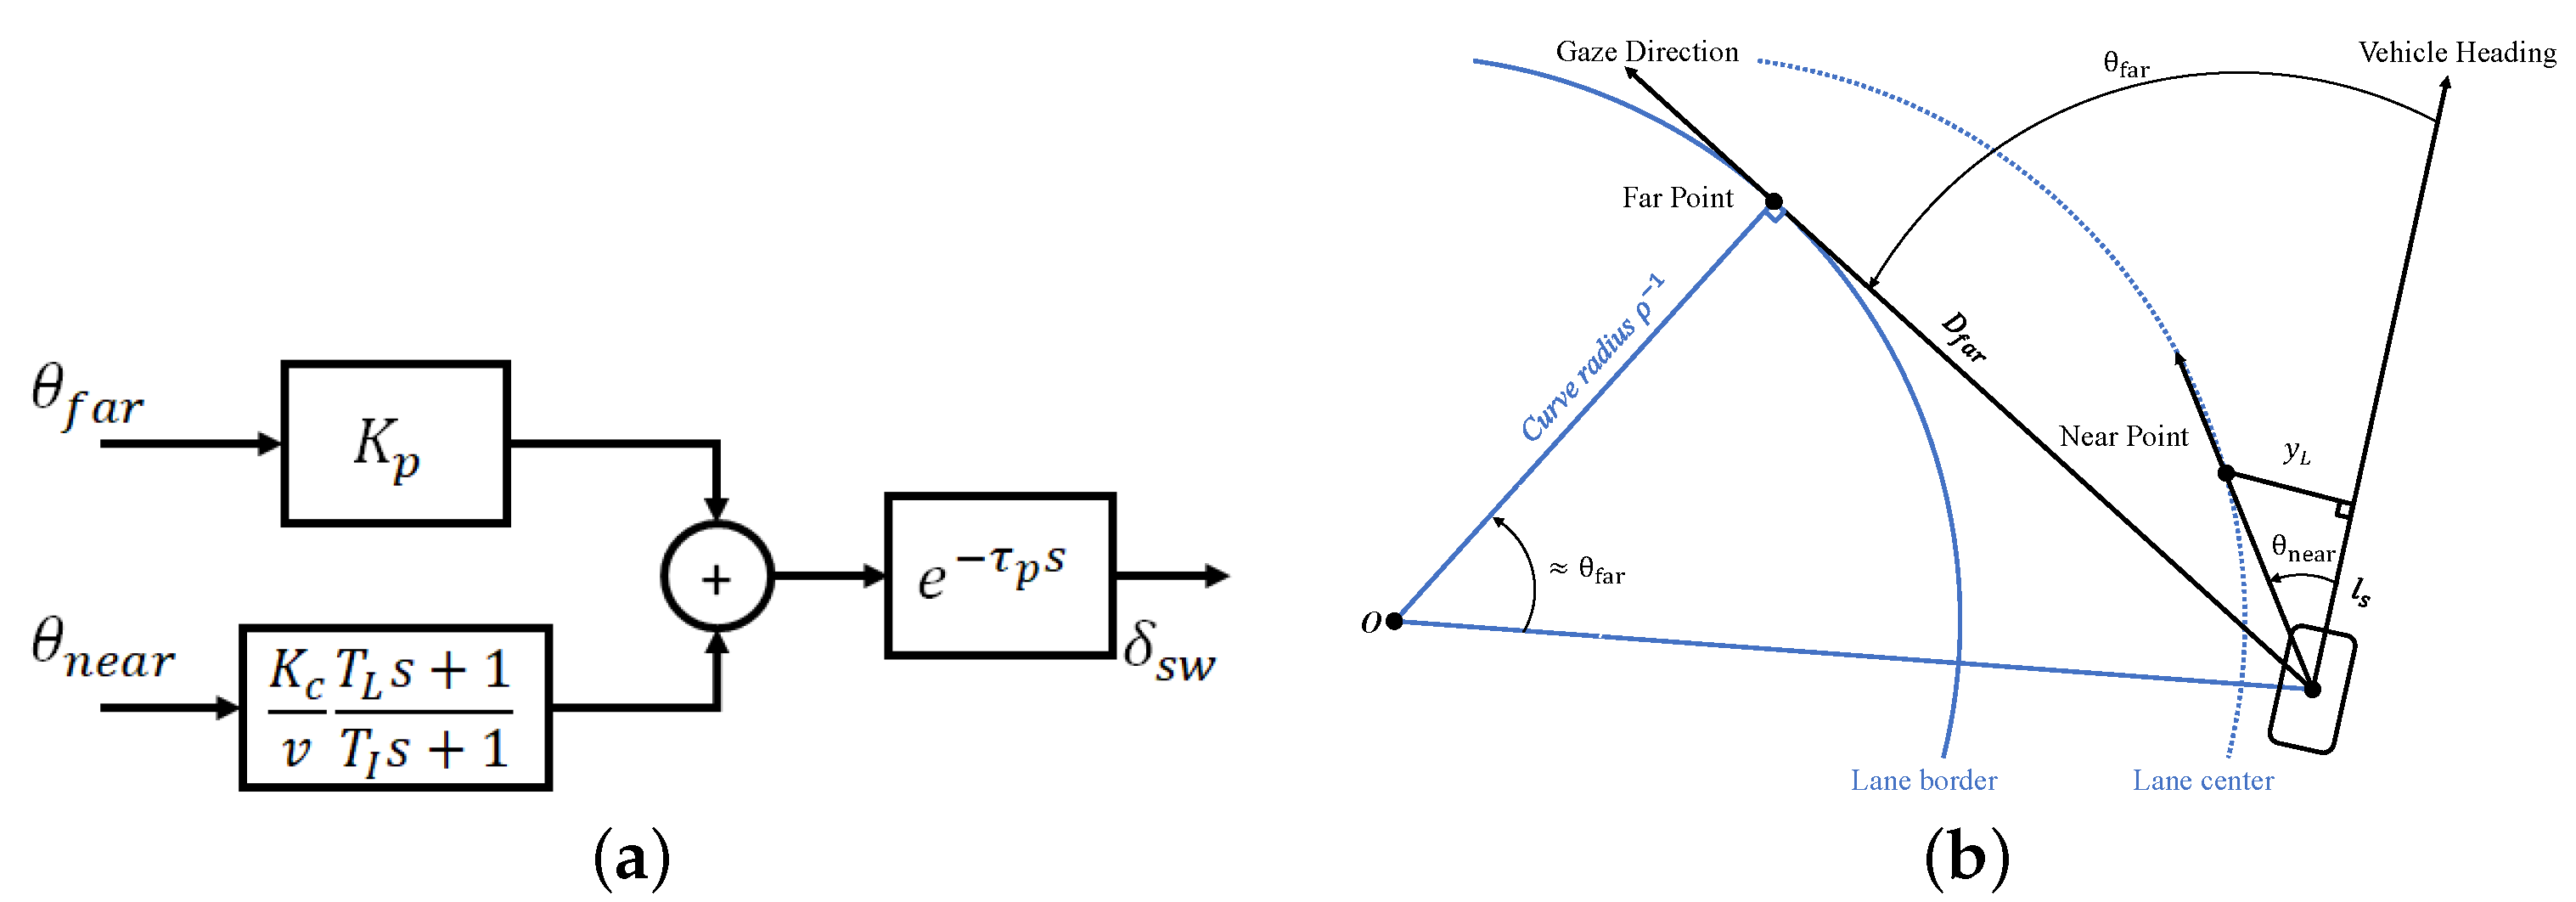
3.2. Model Identification
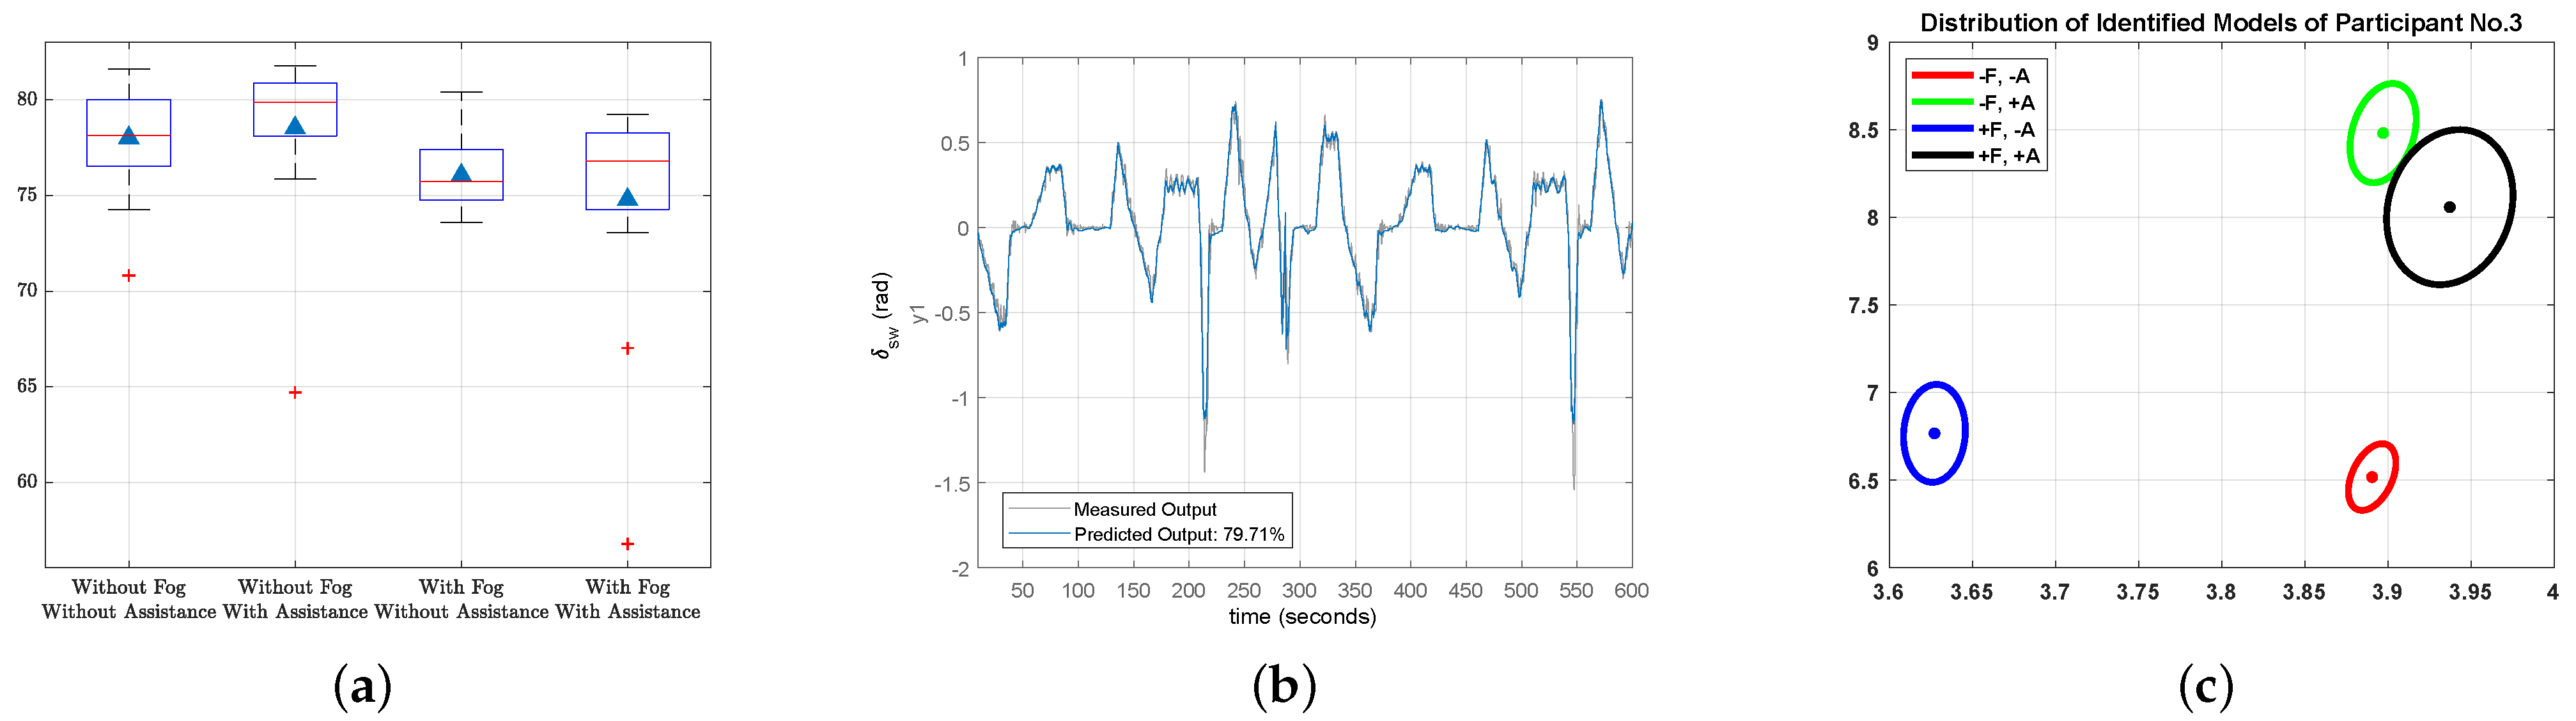
3.3. Validation of Identified Model
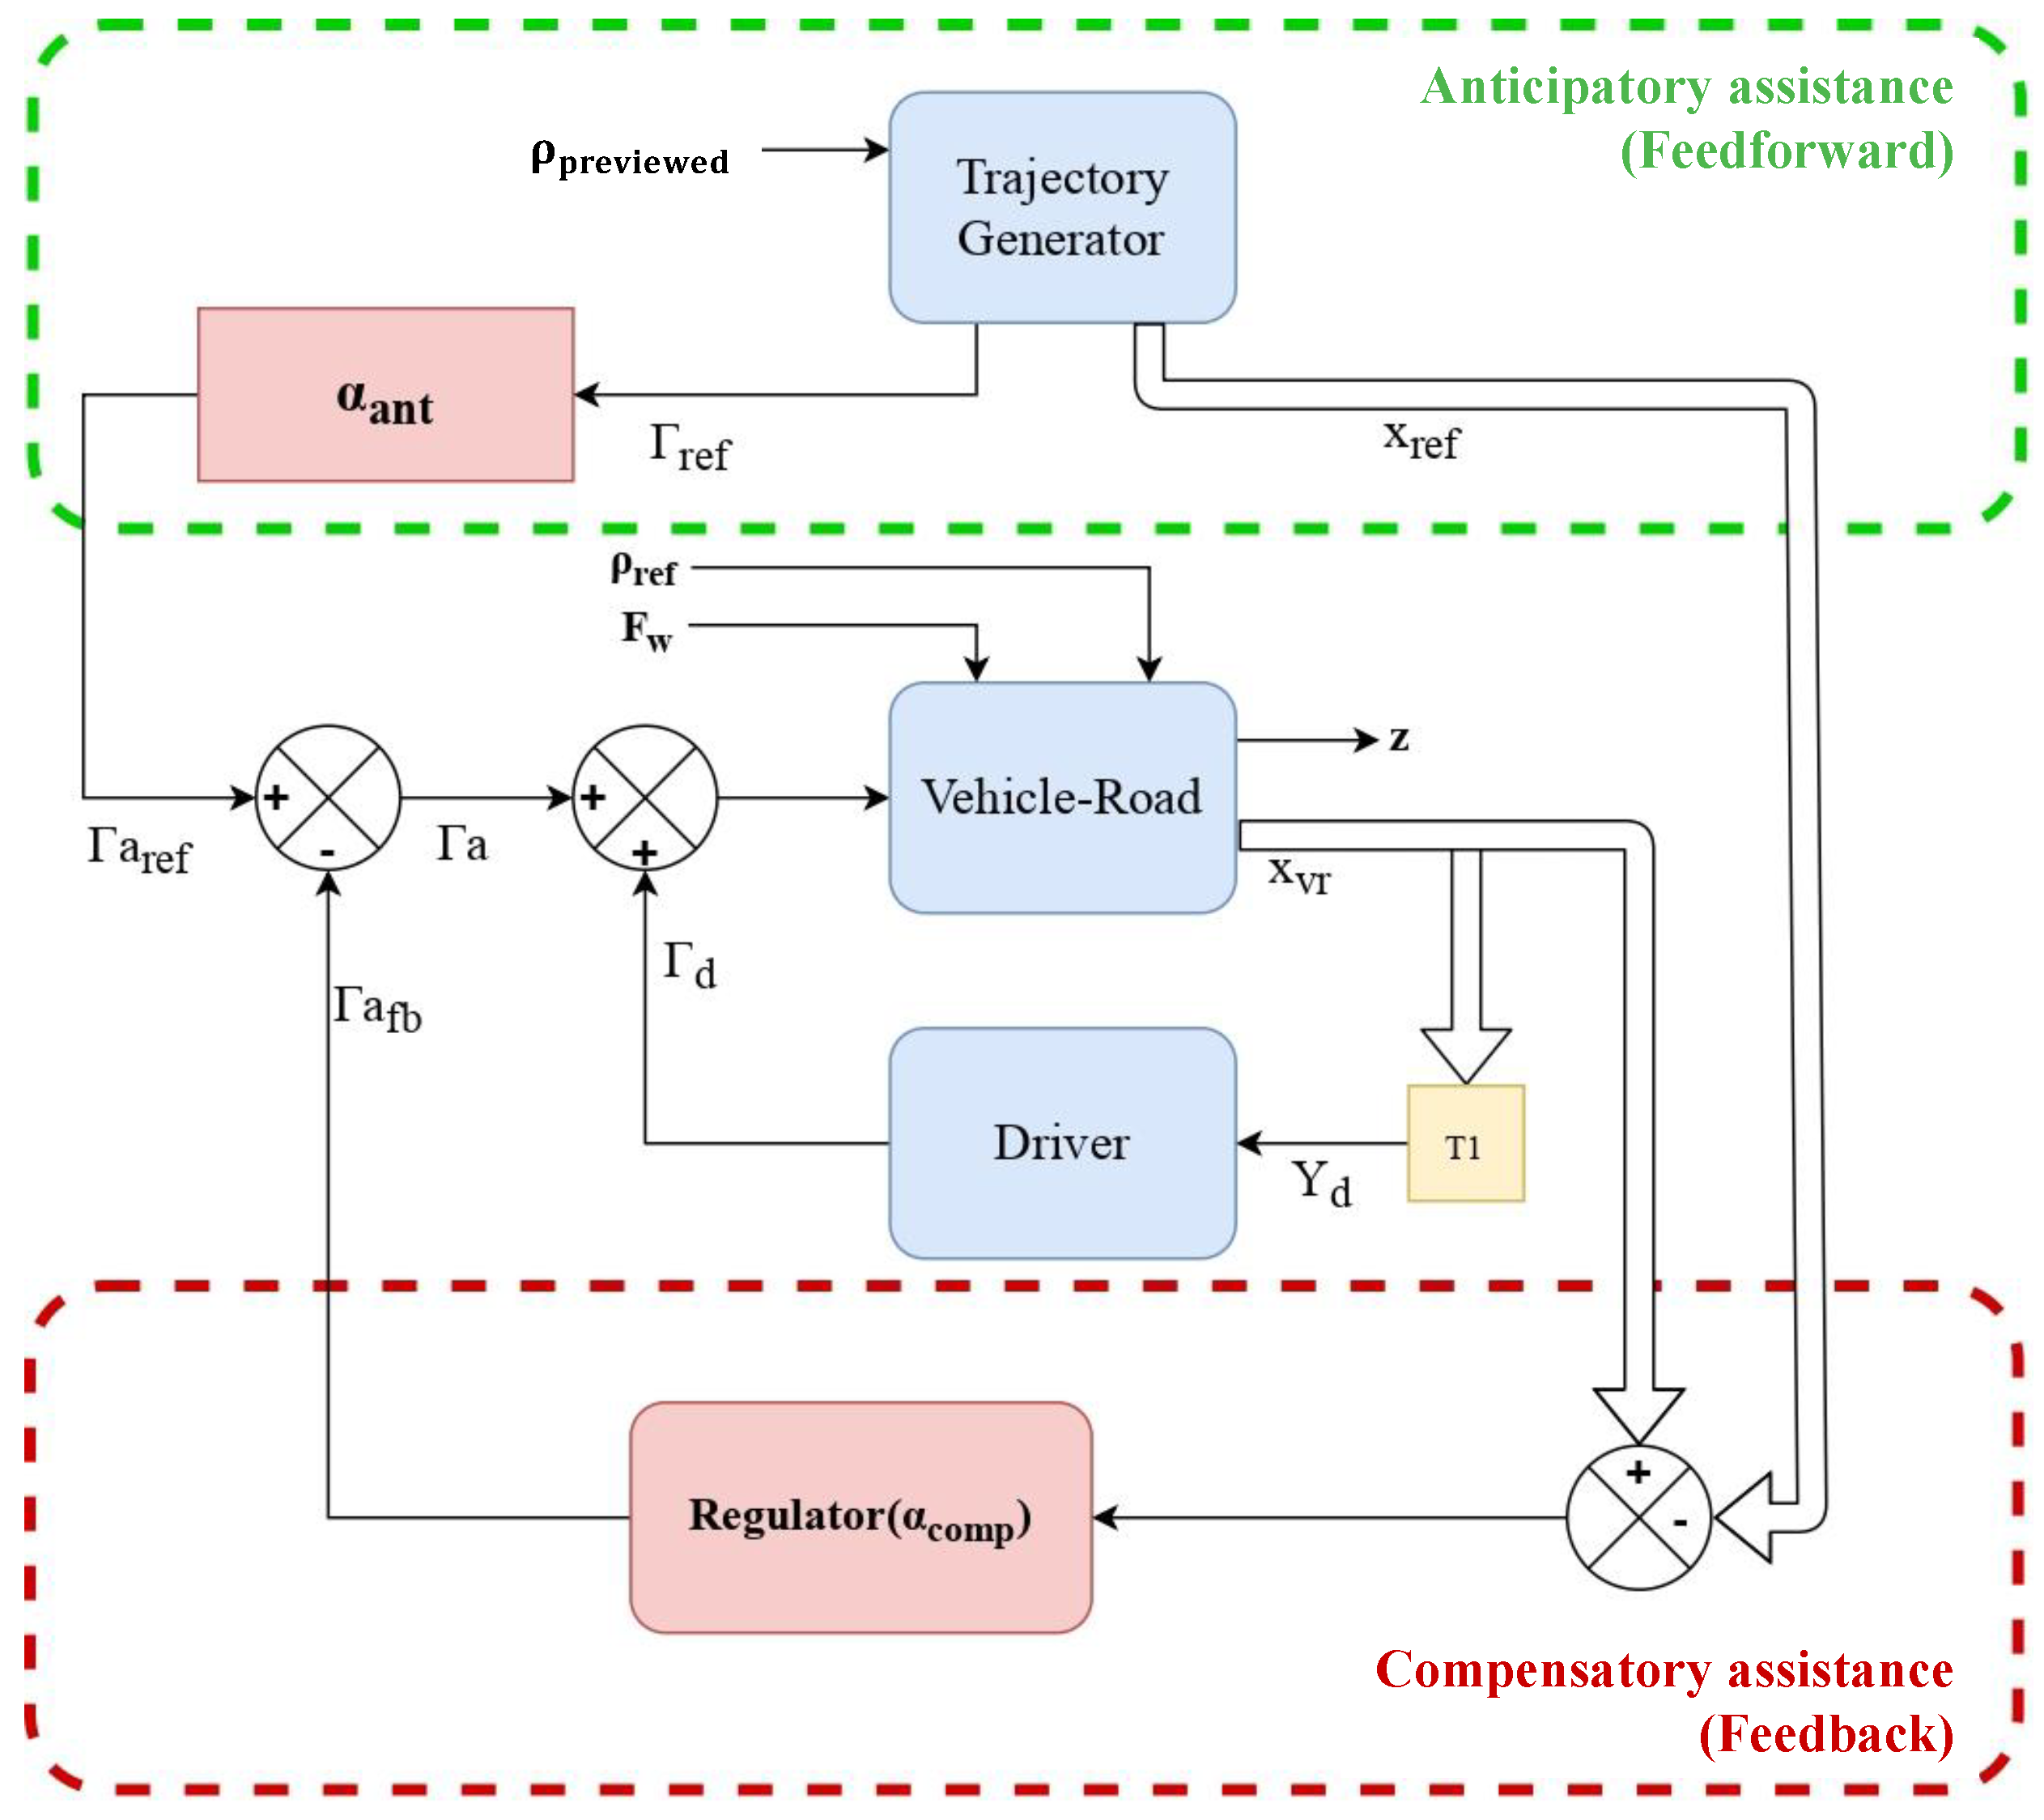
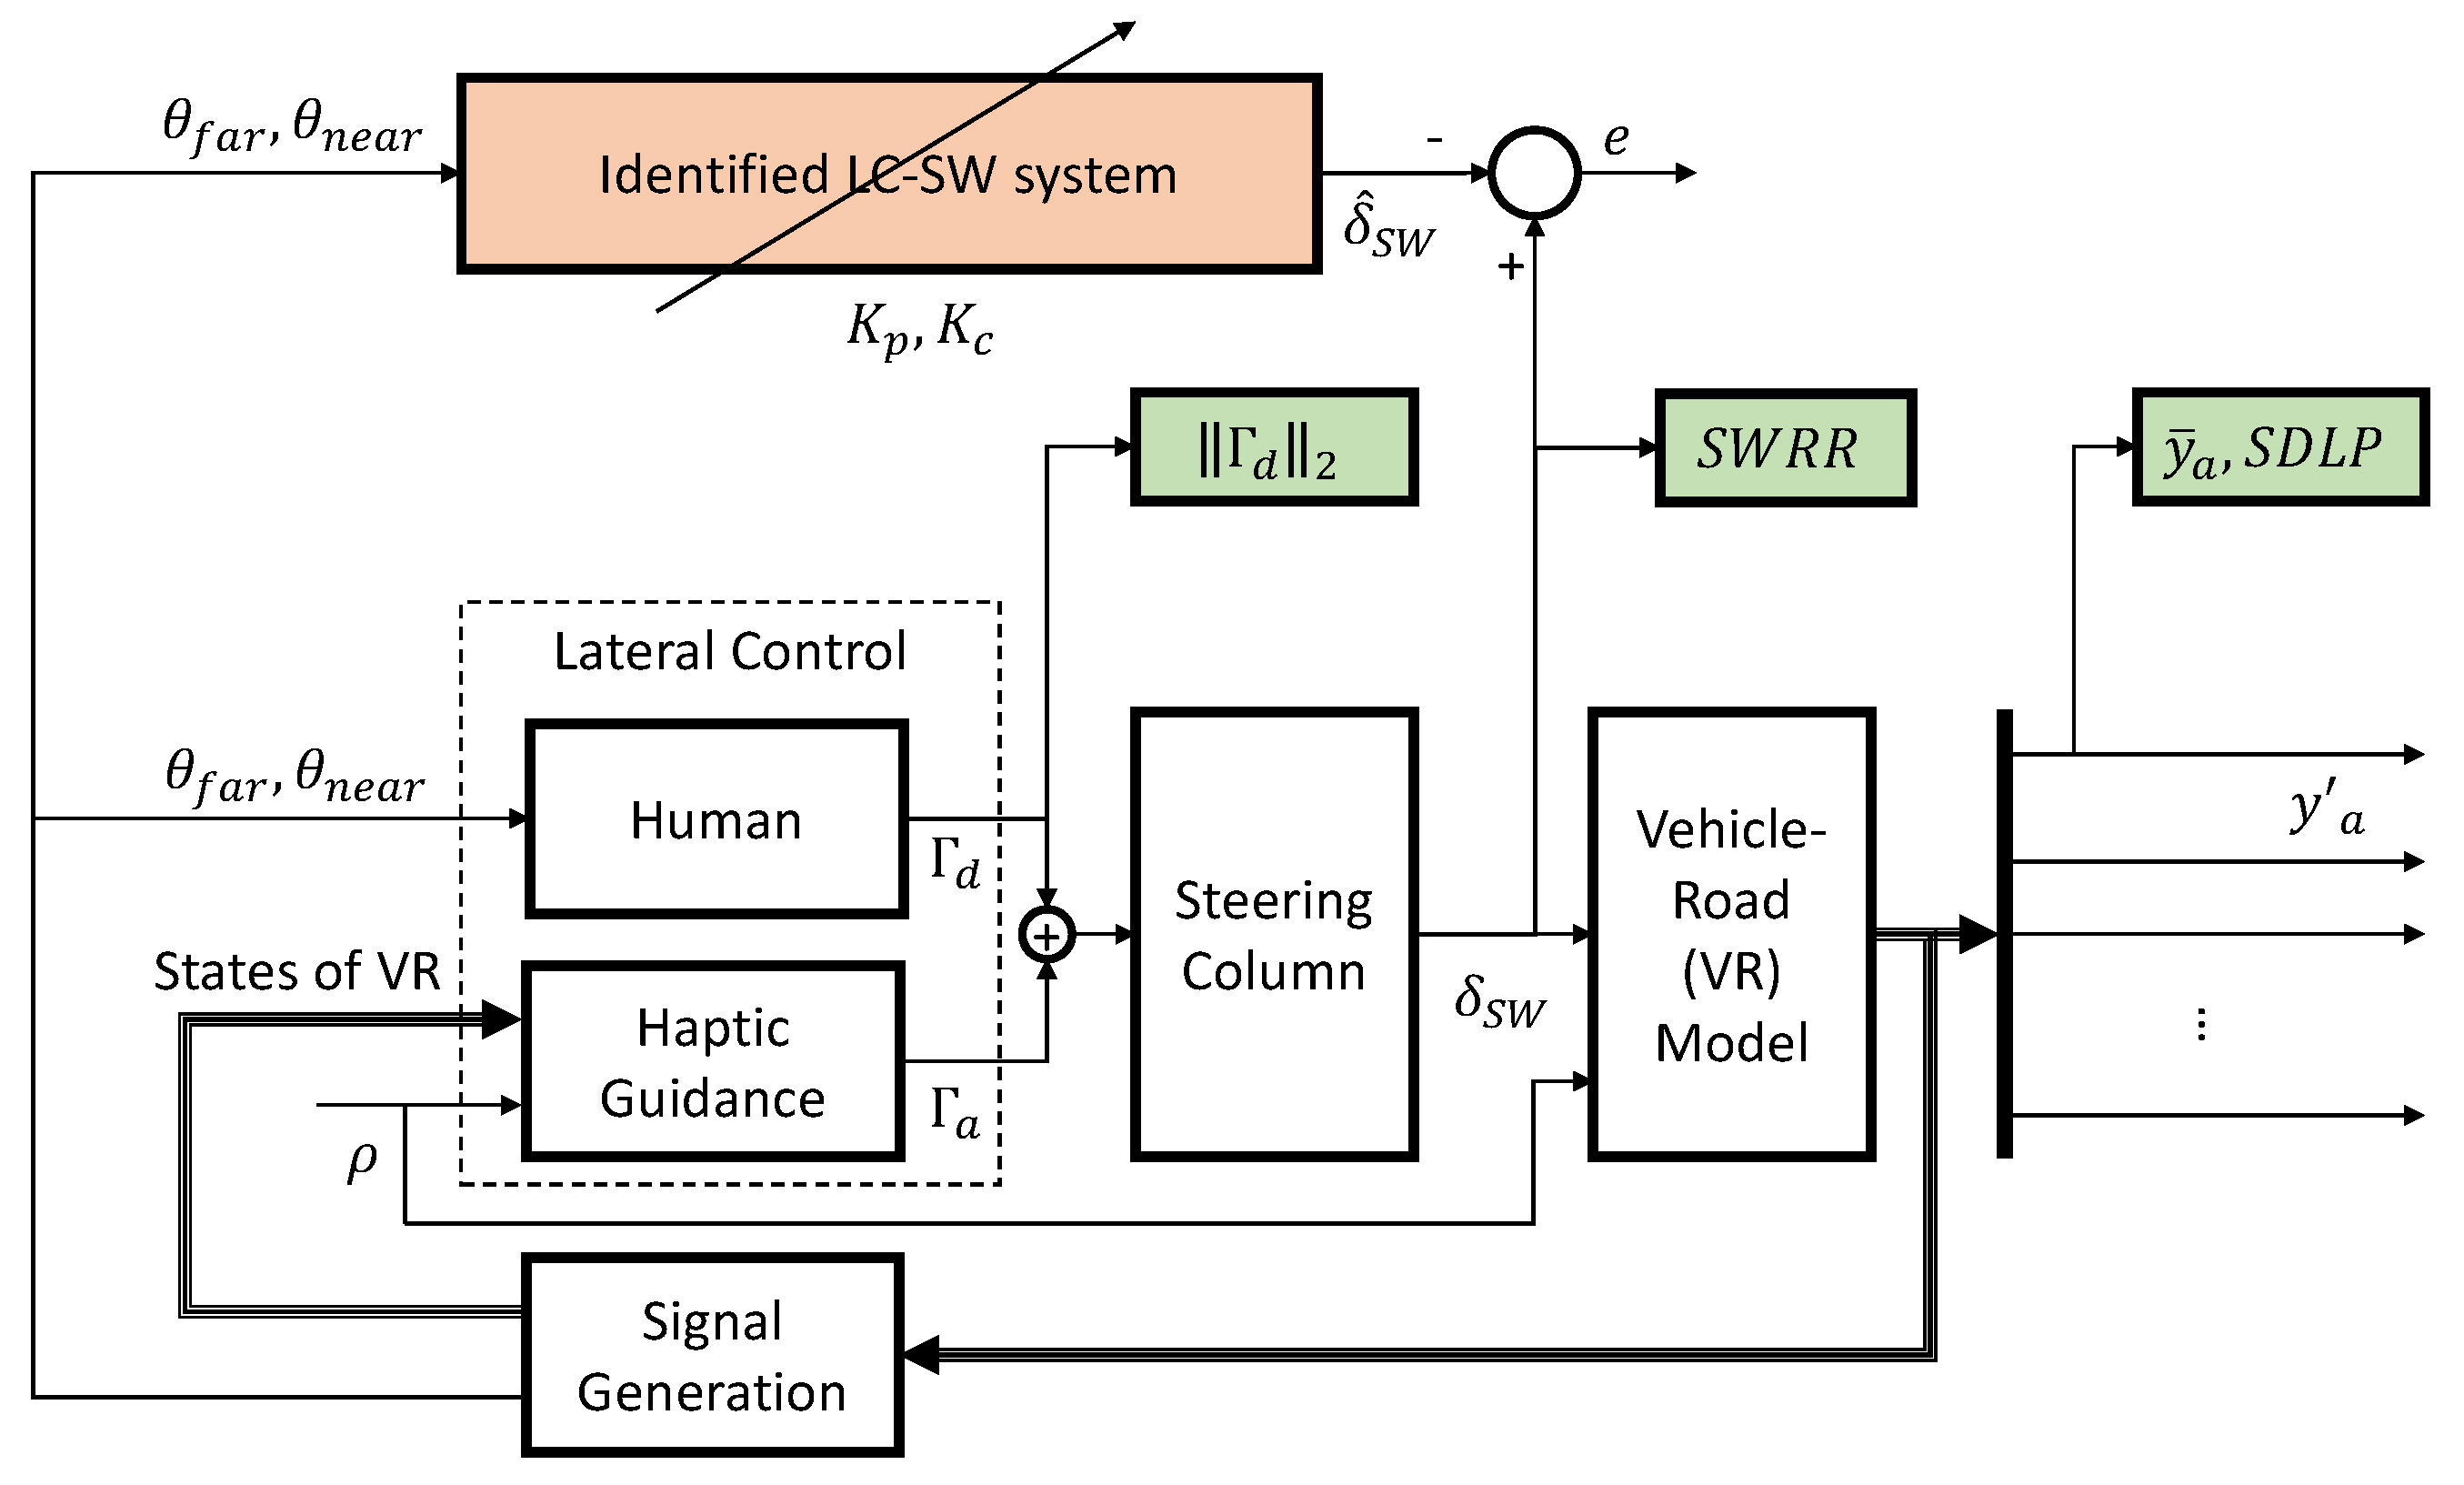
3.4. Summary Diagram
4. Results
4.1. Steering Performance
4.2. Lane-Keeping Performance
4.3. Driver Control Effort
4.4. Identified Model Validation
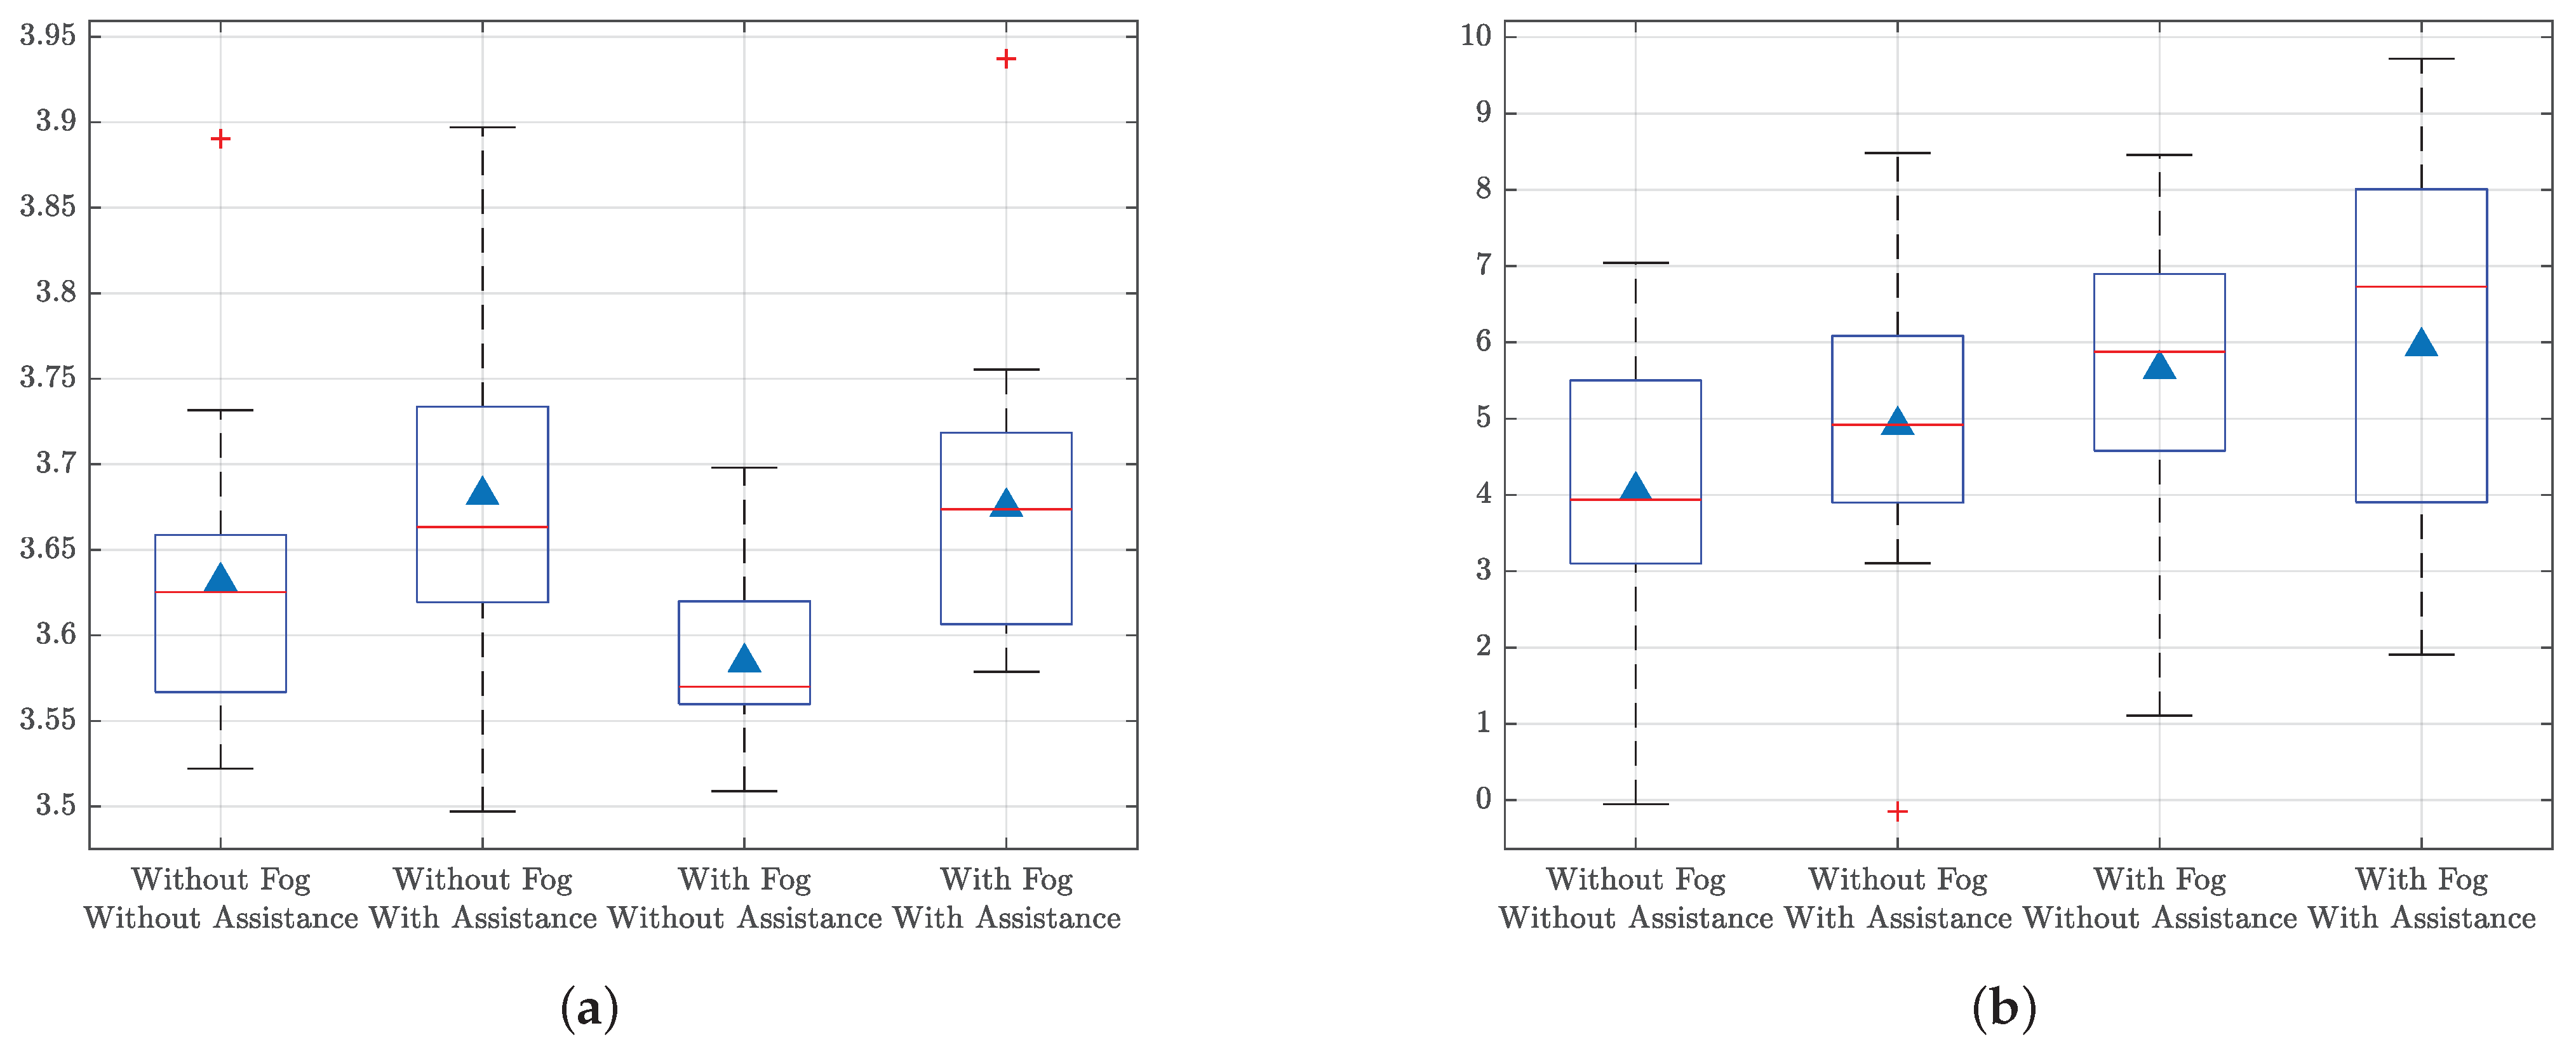
4.5. Anticipatory and Compensatory Gain
5. Discussion
5.1. Effect of Fog
5.2. Effect of Haptic Guidance
5.3. Synthesis
6. Conclusions
Author Contributions
Funding
Informed Consent Statement
Data Availability Statement
Conflicts of Interest
References
- Steele, M.; Gillespie, R.B. Shared Control between Human and Machine: Using a Haptic Steering Wheel to Aid in Land Vehicle Guidance. Proc. Hum. Factors Ergon. Soc. Annu. Meet. 2001, 45, 1671–1675. [Google Scholar] [CrossRef] [Green Version]
- Abbink, D.A.; Mulder, M. Exploring the dimensions of haptic feedback support in manual control. J. Comput. Inf. Sci. Eng. 2009, 9, 1–9. [Google Scholar] [CrossRef]
- Abbink, D.A.; Mulder, M.; Boer, E.R. Haptic shared control: Smoothly shifting control authority? Cogn. Technol. Work. 2012, 14, 19–28. [Google Scholar] [CrossRef] [Green Version]
- Abbink, D.A.; Carlson, T.; Mulder, M.; De Winter, J.C.; Aminravan, F.; Gibo, T.L.; Boer, E.R. A topology of shared control systems-finding common ground in diversity. IEEE Trans.-Hum.-Mach. Syst. 2018, 48, 509–525. [Google Scholar] [CrossRef] [Green Version]
- Griffiths, P.; Gillespie, R.B. Shared control between human and machine: Haptic display of automation during manual control of vehicle heading. In Proceedings of the 12th International Symposium on Haptic Interfaces for Virtual Environment and Teleoperator Systems, Chicago, IL, USA, 27–28 March 2004; pp. 358–366. [Google Scholar] [CrossRef]
- Griffiths, P.G.; Gillespie, R.B. Sharing Control Between Humans and Automation Using Haptic Interface: Primary and Secondary Task Performance Benefits. Hum. Factors 2005, 47, 574–590. [Google Scholar] [CrossRef] [Green Version]
- Mulder, M.; Abbink, D.A.; Boer, E.R. The effect of haptic guidance on curve negotiation behavior of young, experienced drivers. In Proceedings of the IEEE International Conference on Systems, Man and Cybernetics, Singapore, 12–15 October 2008; pp. 804–809. [Google Scholar] [CrossRef]
- Marchal-Crespo, L.; McHughen, S.; Cramer, S.C.; Reinkensmeyer, D.J. The effect of haptic guidance, aging, and initial skill level on motor learning of a steering task. Exp. Brain Res. 2010, 201, 209–220. [Google Scholar] [CrossRef] [PubMed] [Green Version]
- Mulder, M.; Abbink, D.A.; Boer, E.R. Sharing control with haptics: Seamless driver support from manual to automatic control. Hum. Factors 2012, 54, 786–798. [Google Scholar] [CrossRef]
- Wang, Z.; Zheng, R.; Kaizuka, T.; Shimono, K.; Nakano, K. The effect of a haptic guidance steering system on fatigue-related driver behavior. IEEE Trans.-Hum.-Mach. Syst. 2017, 47, 741–748. [Google Scholar] [CrossRef]
- Petermeijer, S.M.; Abbink, D.A.; Mulder, M.; De Winter, J.C. The Effect of Haptic Support Systems on Driver Performance: A Literature Survey. IEEE Trans. Haptics 2015, 8, 467–479. [Google Scholar] [CrossRef]
- Petermeijer, S.M.; Abbink, D.A.; De Winter, J.C. Should drivers be operating within an automation-free bandwidth? Evaluating haptic steering support systems with different levels of authority. Hum. Factors 2015, 57, 5–20. [Google Scholar] [CrossRef]
- Wang, Z.; Kaizuka, T.; Nakano, K. Effect of Haptic Guidance Steering on Lane Following Performance by Taking Account of Driver Reliance on the Assistance System. In Proceedings of the 2018 IEEE International Conference on Systems, Man, and Cybernetics, Miyazaki, Japan, 7–10 October 2018. [Google Scholar] [CrossRef]
- Sivak, M. The Information That Drivers Use: Is it Indeed 90% Visual? Perception 1996, 25, 1081–1089. [Google Scholar] [CrossRef] [PubMed]
- De Nijs, S.Y.; Mulder, M.; Abbink, D.A. The value of haptic feedback in lane keeping. In Proceedings of the IEEE International Conference on Systems, Man and Cybernetics, San Diego, CA, USA, 5–8 October 2014; pp. 3599–3604. [Google Scholar] [CrossRef]
- Mars, F.; Deroo, M.; Hoc, J.M. Analysis of human-machine cooperation when driving with different degrees of haptic shared control. IEEE Trans. Haptics 2014, 7, 324–333. [Google Scholar] [CrossRef]
- Ameyoe, A.; Mars, F.; Chevrel, P.; Le Carpentier, E.; Illy, H. Estimation of driver distraction using the prediction error of a cybernetic driver model. In Proceedings of the Driving Simulation Conference Europe, Tubingen, Germany, 16–18 September 2015; pp. 13–18. [Google Scholar]
- Mars, F.; Chevrel, P. Modelling human control of steering for the design of advanced driver assistance systems. Annu. Rev. Control. 2017, 44, 292–302. [Google Scholar] [CrossRef]
- Marcano, M.; Diaz, S.; Perez, J.; Irigoyen, E. A Review of Shared Control for Automated Vehicles: Theory and Applications. IEEE Trans.-Hum.-Mach. Syst. 2020, 50, 475–491. [Google Scholar] [CrossRef]
- Saleh, L.; Chevrel, P.; Claveau, F.; Lafay, J.F.; Mars, F. Shared steering control between a driver and an automation: Stability in the presence of driver behavior uncertainty. IEEE Trans. Intell. Transp. Syst. 2013, 14, 974–983. [Google Scholar] [CrossRef]
- Flad, M.; Frohlich, L.; Hohmann, S. Cooperative shared control driver assistance systems based on motion primitives and differential games. IEEE Trans.-Hum.-Mach. Syst. 2017, 47, 711–722. [Google Scholar] [CrossRef]
- Nguyen, A.T.; Sentouh, C.; Popieul, J.C. Sensor Reduction for Driver-Automation Shared Steering Control via an Adaptive Authority Allocation Strategy. IEEE/ASME Trans. Mechatronics 2018, 23, 5–16. [Google Scholar] [CrossRef]
- Benloucif, M.A.; Sentouh, C.; Floris, J.; Simon, P.; Popieul, J.C. Online adaptation of the Level of Haptic Authority in a lane keeping system considering the driver’s state. Transp. Res. Part Traffic Psychol. Behav. 2019, 61, 107–119. [Google Scholar] [CrossRef]
- Sentouh, C.; Nguyen, A.; Benloucif, M.A.; Popieul, J. Driver-Automation Cooperation Oriented Approach for Shared Control of Lane Keeping Assist Systems. IEEE Trans. Control. Syst. Technol. 2019, 27, 1962–1978. [Google Scholar] [CrossRef]
- Ji, X.; Yang, K.; Na, X.; Lv, C.; Liu, Y. Shared Steering Torque Control for Lane Change Assistance: A Stochastic Game-Theoretic Approach. IEEE Trans. Ind. Electron. 2019, 66, 3093–3105. [Google Scholar] [CrossRef]
- Pano, B.; Chevrel, P.; Claveau, F. Anticipatory and compensatory e-assistance for haptic shared control of the steering wheel. In Proceedings of the 2019 18th European Control Conference (ECC), Naples, Italy, 25–28 June 2019; pp. 724–731. [Google Scholar] [CrossRef]
- Pano, B.; Claveau, F.; Chevrel, P.; Sentouh, C.; Mars, F. Systematic H2/H∞ haptic shared control synthesis for cars, parameterized by sharing level. In Proceedings of the 2020 IEEE International Conference on Systems, Man, and Cybernetics (SMC), Toronto, ON, Canada, 11–14 October 2020; pp. 4416–4423. [Google Scholar] [CrossRef]
- Zhao, Y.; Chevrel, P.; Claveau, F.; Mars, F. Towards a Driver Model to Clarify Cooperation between Drivers and Haptic Guidance Systems. In Proceedings of the 2020 IEEE International Conference on Systems, Man, and Cybernetics (SMC), Toronto, ON, Canada, 11–14 October 2020; pp. 1731–1737. [Google Scholar] [CrossRef]
- Zhao, Y.; Pano, B.; Chevrel, P.; Claveau, F.; Mars, F. Driver Model Validation through Interaction with Varying Levels of Haptic Guidance. In Proceedings of the 2020 IEEE International Conference on Systems, Man, and Cybernetics (SMC), Toronto, ON, Canada, 11–14 October 2020; pp. 2284–2290. [Google Scholar] [CrossRef]
- Pano, B.; Chevrel, P.; Claveau, F.; Sentouh, C.; Mars, F. Obstacle avoidance in highly automated cars: Can progressive haptic shared control make it smoother? IEEE Trans.-Hum.-Mach. Syst. 2022, 52, 547–556. [Google Scholar] [CrossRef]
- Salvucci, D.D.; Gray, R. A two-point visual control model of steering. Perception 2004, 33, 1233–1248. [Google Scholar] [CrossRef] [PubMed]
- Donges, E. A Two-Level Model of Driver Steering Behavior. Hum. Factors J. Hum. Factors Ergon. Soc. 1978, 20, 691–707. [Google Scholar] [CrossRef]
- Land, M.; Horwood, J. Which parts of the road guide steering? Nature 1995, 377, 339–340. [Google Scholar] [CrossRef] [PubMed]
- Steen, J.; Damveld, H.J.; Happee, R.; Van Paassen, M.M.; Mulder, M. A review of visual driver models for system identification purposes. In Proceedings of the IEEE International Conference on Systems, Man and Cybernetics, Anchorage, AL, USA, 9–12 October 2011; pp. 2093–2100. [Google Scholar] [CrossRef]
- Frissen, I.; Mars, F. The Effect of Visual Degradation on Anticipatory and Compensatory Steering Control. Q. J. Exp. Psychol. 2014, 67, 499–507. [Google Scholar] [CrossRef] [PubMed]
- Markkula, G.; Engström, J. A Steering Wheel Reversal Rate Metric for Assessing Effects of Visual and Cognitive Secondary Task Load. In Proceedings of the 13th ITS World Congress, London, UK, 8–12 October 2006. [Google Scholar]
- Nilsson, L.; Merat, N.; Jamson, H.; Mouta, S.; Carvalhais, J.; Santos, J.; Anttila, V.; Sandberg, H.; Luoma, J.; de Waard, D.; et al. HASTE Deliverable 2: HMI and Safety-Related Driver Performance; European Commission: Brussels, Belgium, 2004. [Google Scholar]
- Mars, F.; Saleh, L.; Chevrel, P.; Claveau, F.; Lafay, J.F. Modeling the visual and motor control of steering with an eye to shared-control automation. Proc. Hum. Factors Ergon. Soc. 2011, 55, 1422–1426. [Google Scholar] [CrossRef]
- Saleh, L.; Chevrel, P.; Mars, F.; Lafay, J.F.; Claveau, F. Human-like cybernetic driver model for lane keeping. In Proceedings of the 18th IFAC World Congress, Milan, Italy, 29 August–3 September 2011; pp. 4368–4373. [Google Scholar]
- Ljung, L. System Identification: Theory for the User, 2nd ed.; Prentice Hall Information and System Sciences Series; Prentice Hall PTR: Hoboken, NJ, USA, 1999. [Google Scholar]


| Parameter | Description | Nominal Values |
|---|---|---|
| Visual Anticipation Gain | - | |
| Visual Compensation Gain | - | |
| Compensation Time Constants | 1, 3 | |
| Processing Delay | 0.04 | |
| v | Vehicle Longitudinal Speed | - |
| Participant | ||||||
|---|---|---|---|---|---|---|
| 1 | 0.67 | 2.13 | 4.14 | 1.05 | 3.06 | 1.27 |
| 2 | 0.24 | 2.72 | 0.56 | 3.31 | 1.16 | 1.52 |
| 3 | 1.49 | −0.11 | 0.91 | 1.17 | −0.3 | 0.61 |
| 4 | −0.06 | 0.74 | 2.66 | 0.55 | 2.46 | 1.62 |
| 5 | 2.86 | 4.62 | 4.01 | 1.46 | 0.85 | 0.14 |
| 6 | 0.72 | 1.02 | 1.6 | −0.12 | 0.41 | 0.17 |
| 7 | 0.52 | −0.14 | 0.75 | 0.76 | −0.24 | 0.99 |
| 8 | 0.75 | 2.21 | 0.93 | 1.15 | −0.11 | 0.46 |
| 9 | 0.37 | 1.51 | 3.44 | 0.72 | 2.64 | 1.6 |
| 10 | 0.28 | 2.18 | 1.63 | 2.9 | 2.35 | −0.1 |
| 11 | 0.52 | 0.08 | 0.92 | 0.88 | 1.71 | 0.36 |
| 12 | 1.56 | 2.2 | 0.49 | 0.28 | 0.67 | 1.31 |
| 13 | −0.21 | −0.27 | 0.73 | −0.01 | 0.99 | 0.59 |
| 14 | 1.77 | −0.02 | 0.7 | 1.41 | 2.73 | 0.94 |
| 15 | 0.43 | 0.2 | 2.95 | −0.02 | 2.29 | 2.37 |
Publisher’s Note: MDPI stays neutral with regard to jurisdictional claims in published maps and institutional affiliations. |
© 2022 by the authors. Licensee MDPI, Basel, Switzerland. This article is an open access article distributed under the terms and conditions of the Creative Commons Attribution (CC BY) license (https://creativecommons.org/licenses/by/4.0/).
Share and Cite
Zhao, Y.; Chevrel, P.; Claveau, F.; Mars, F. Driving with a Haptic Guidance System in Degraded Visibility Conditions: Behavioral Analysis and Identification of a Two-Point Steering Control Model. Vehicles 2022, 4, 1413-1429. https://doi.org/10.3390/vehicles4040074
Zhao Y, Chevrel P, Claveau F, Mars F. Driving with a Haptic Guidance System in Degraded Visibility Conditions: Behavioral Analysis and Identification of a Two-Point Steering Control Model. Vehicles. 2022; 4(4):1413-1429. https://doi.org/10.3390/vehicles4040074
Chicago/Turabian StyleZhao, Yishen, Philippe Chevrel, Fabien Claveau, and Franck Mars. 2022. "Driving with a Haptic Guidance System in Degraded Visibility Conditions: Behavioral Analysis and Identification of a Two-Point Steering Control Model" Vehicles 4, no. 4: 1413-1429. https://doi.org/10.3390/vehicles4040074