
Detecting the Flame Front Evolution in Spark-Ignition Engine under Lean Condition Using the Mask R-CNN Approach


Abstract
:1. Introduction
2. Experimental Setup
2.1. Optical Access Engine
2.2. Imaging System
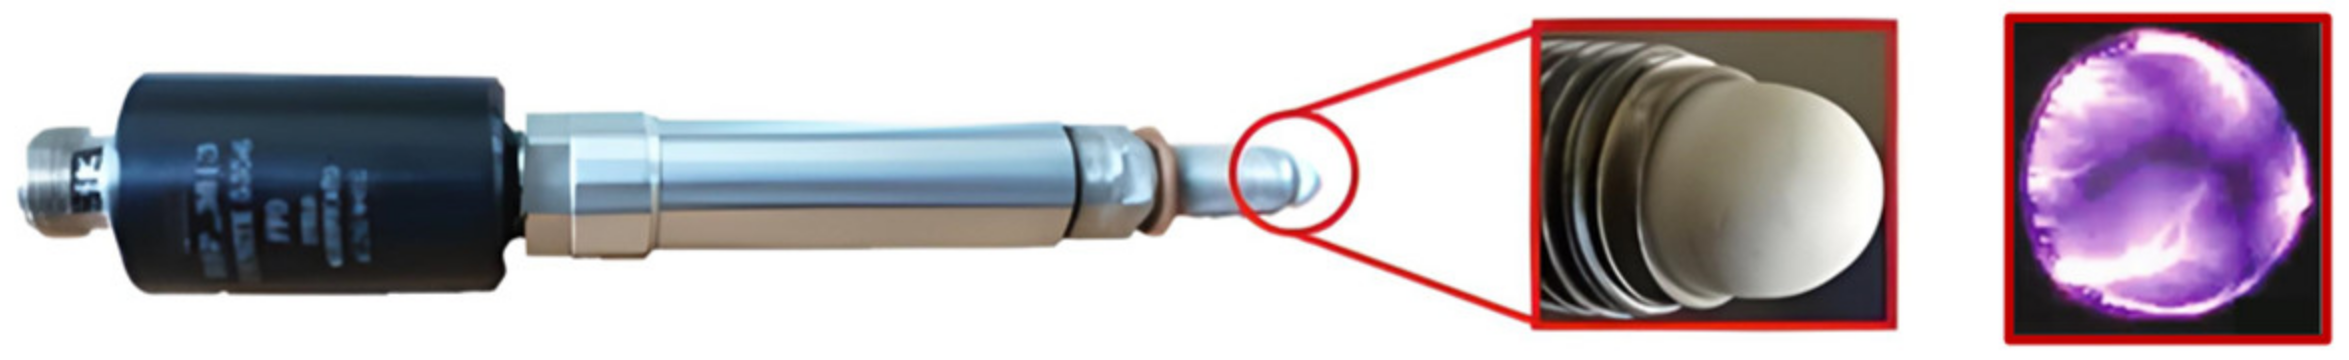
2.3. Igniter
3. Test Campaign
4. Methods
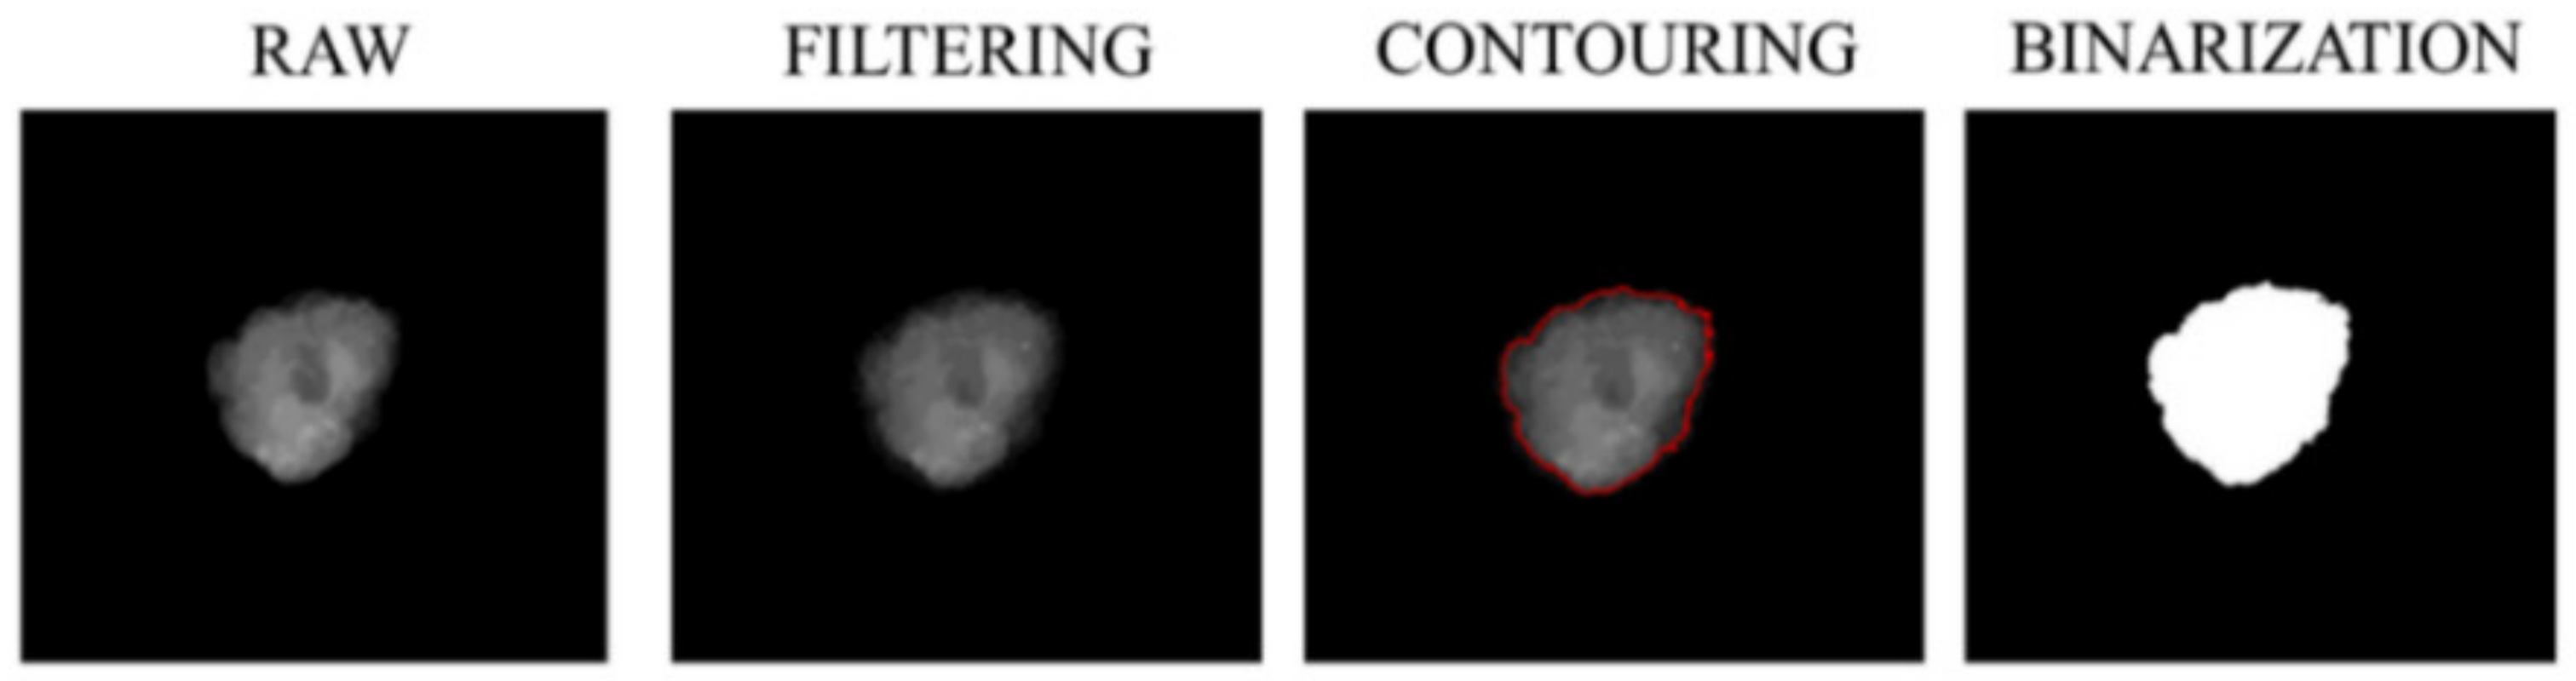
4.1. Base Reference
4.2. Mask R-CNN
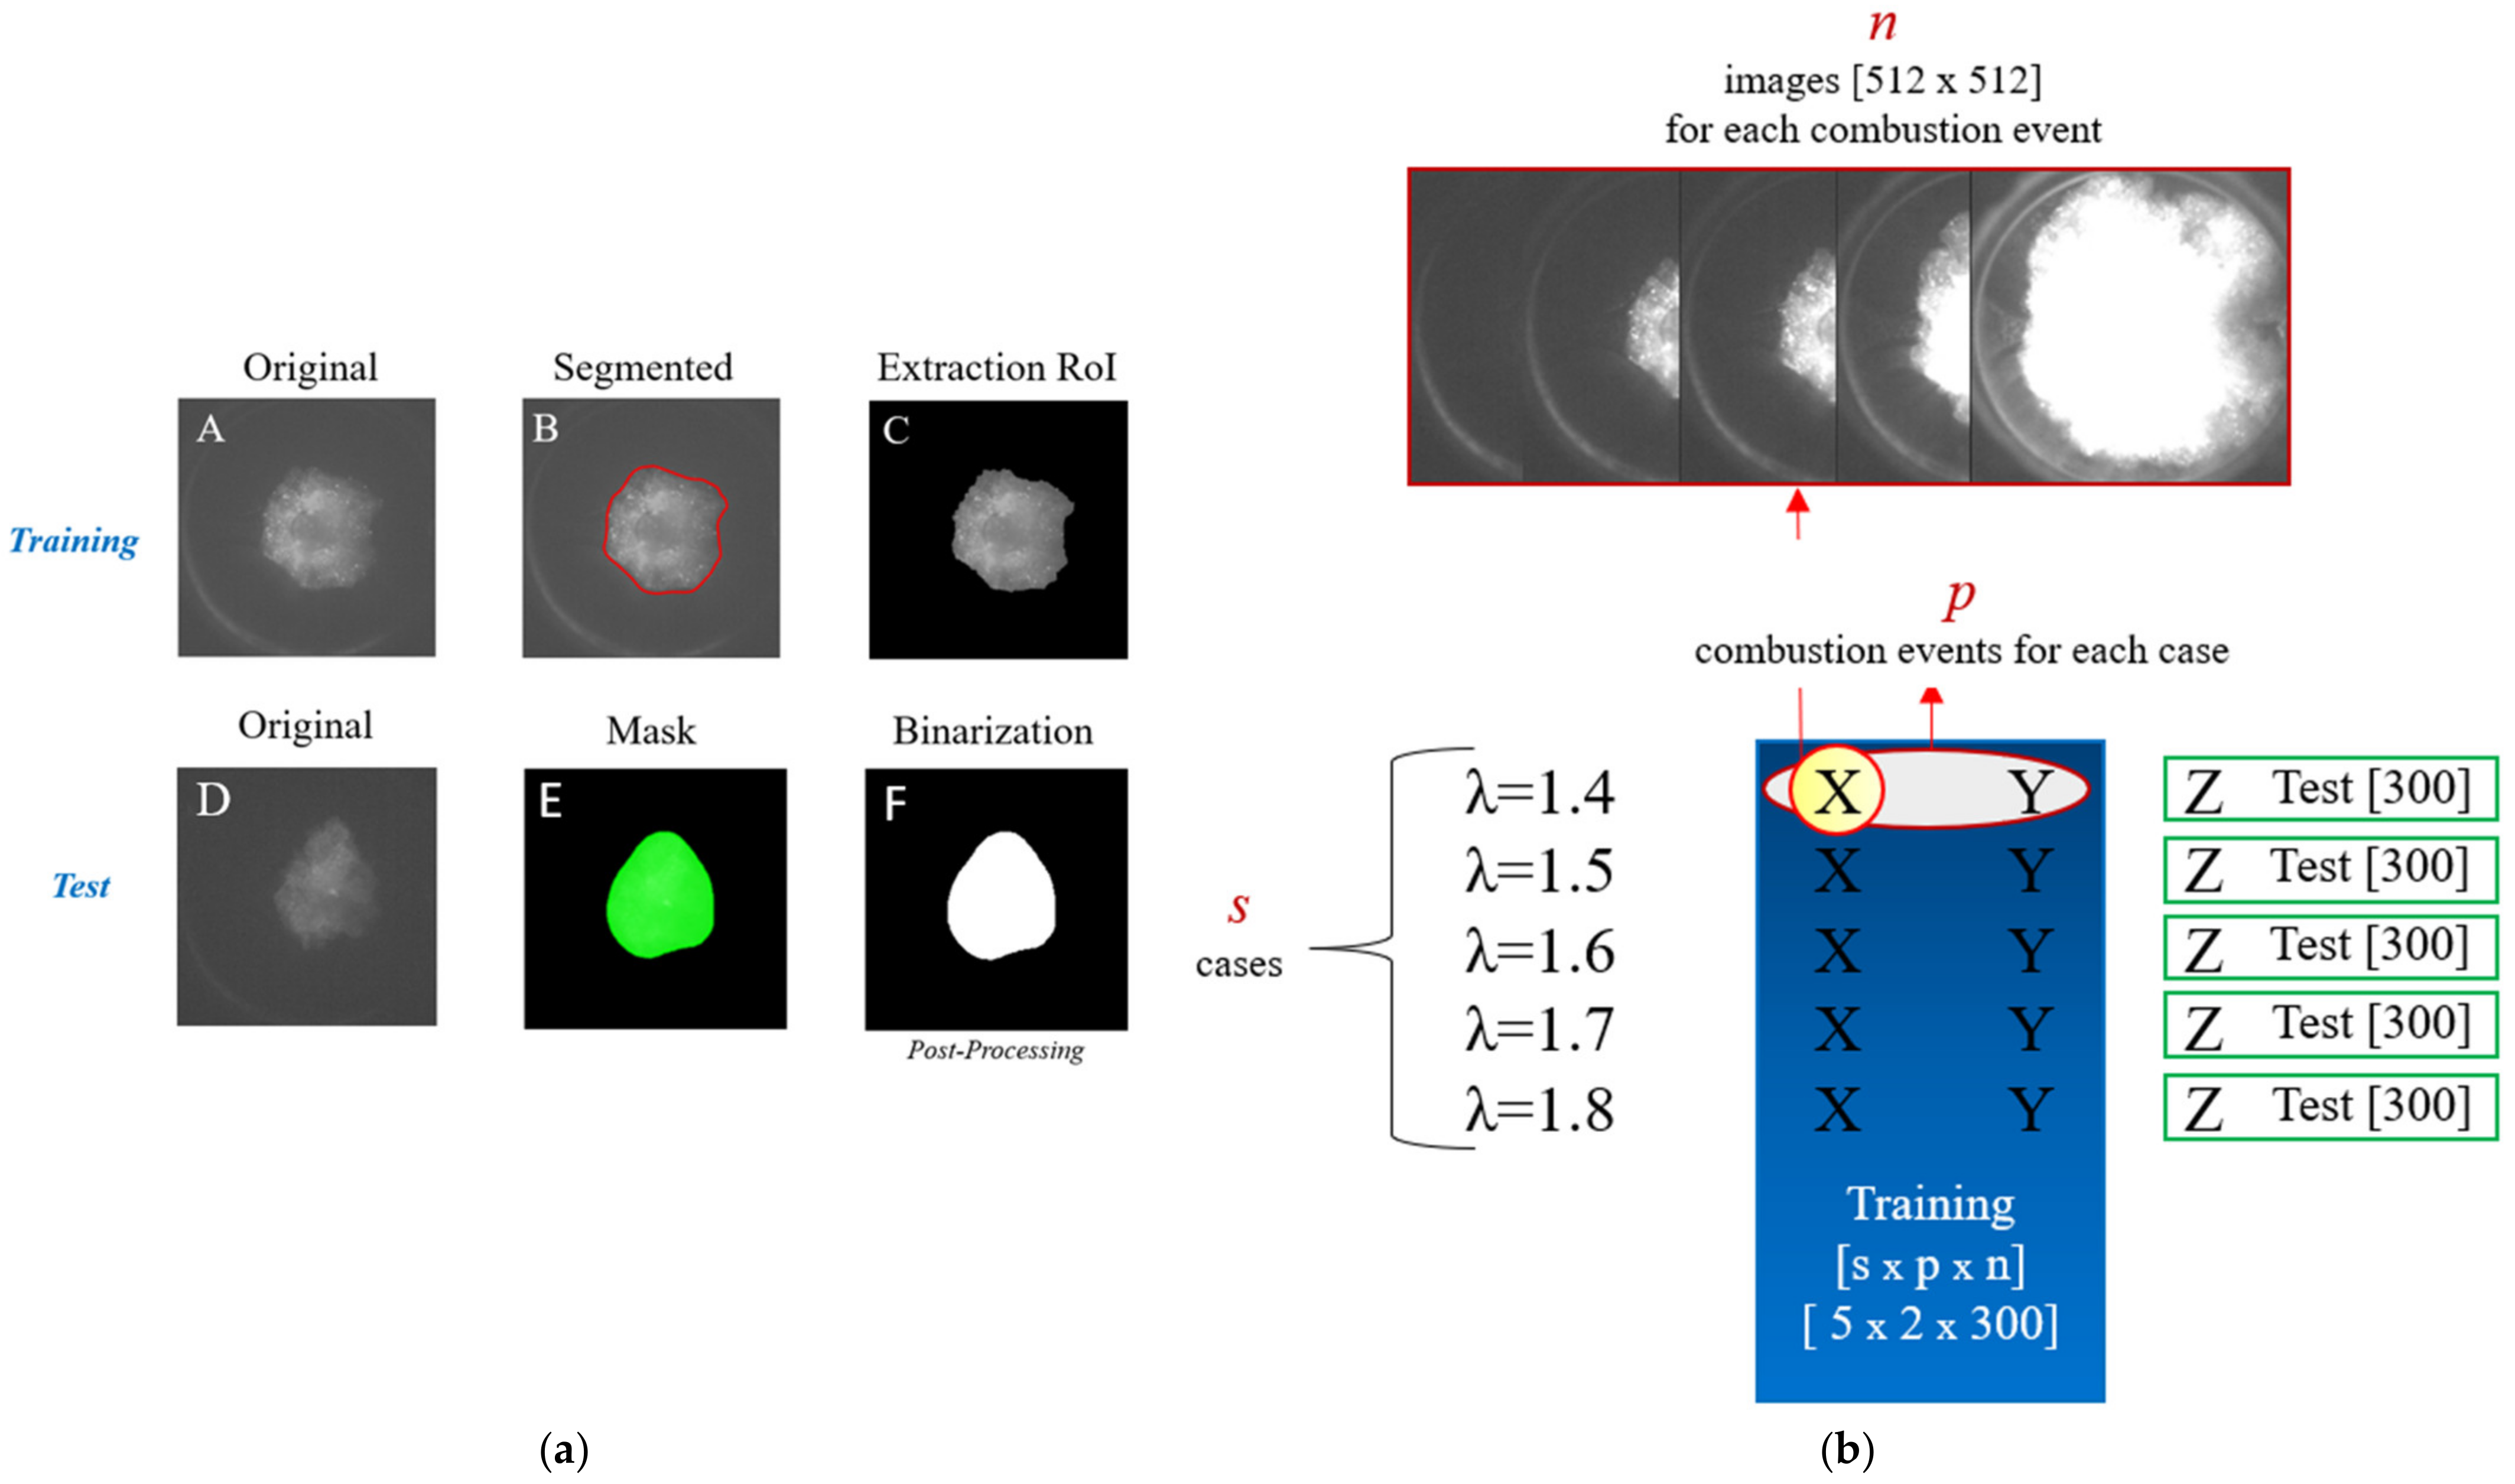
- For each analyzed case (s items), n images of p combustion events (i.e., events X and Y of Figure 5b) are extracted from the high-speed camera and used as a dataset for training the three layers of the network head. In other words, the neural architecture is trained with s p n = 5 2 250 number of items.
- Each item (Figure 5a(A)), i.e., each image portraying the flame front, is segmented (Figure 5a(B)) by the user via human perception on MakeSense.AI (https://www.makesense.ai/) and then labeled.
- The output of each item is then imported into Google Colaboratory (https://colab.research.google.com/) to train the neural architecture. GPU Tesla K80 with CUDA 11.2 is used.
- The fifth epoch of 10 is selected, and its weight is exported, showing the best performance in terms of loss and val_loss [64].
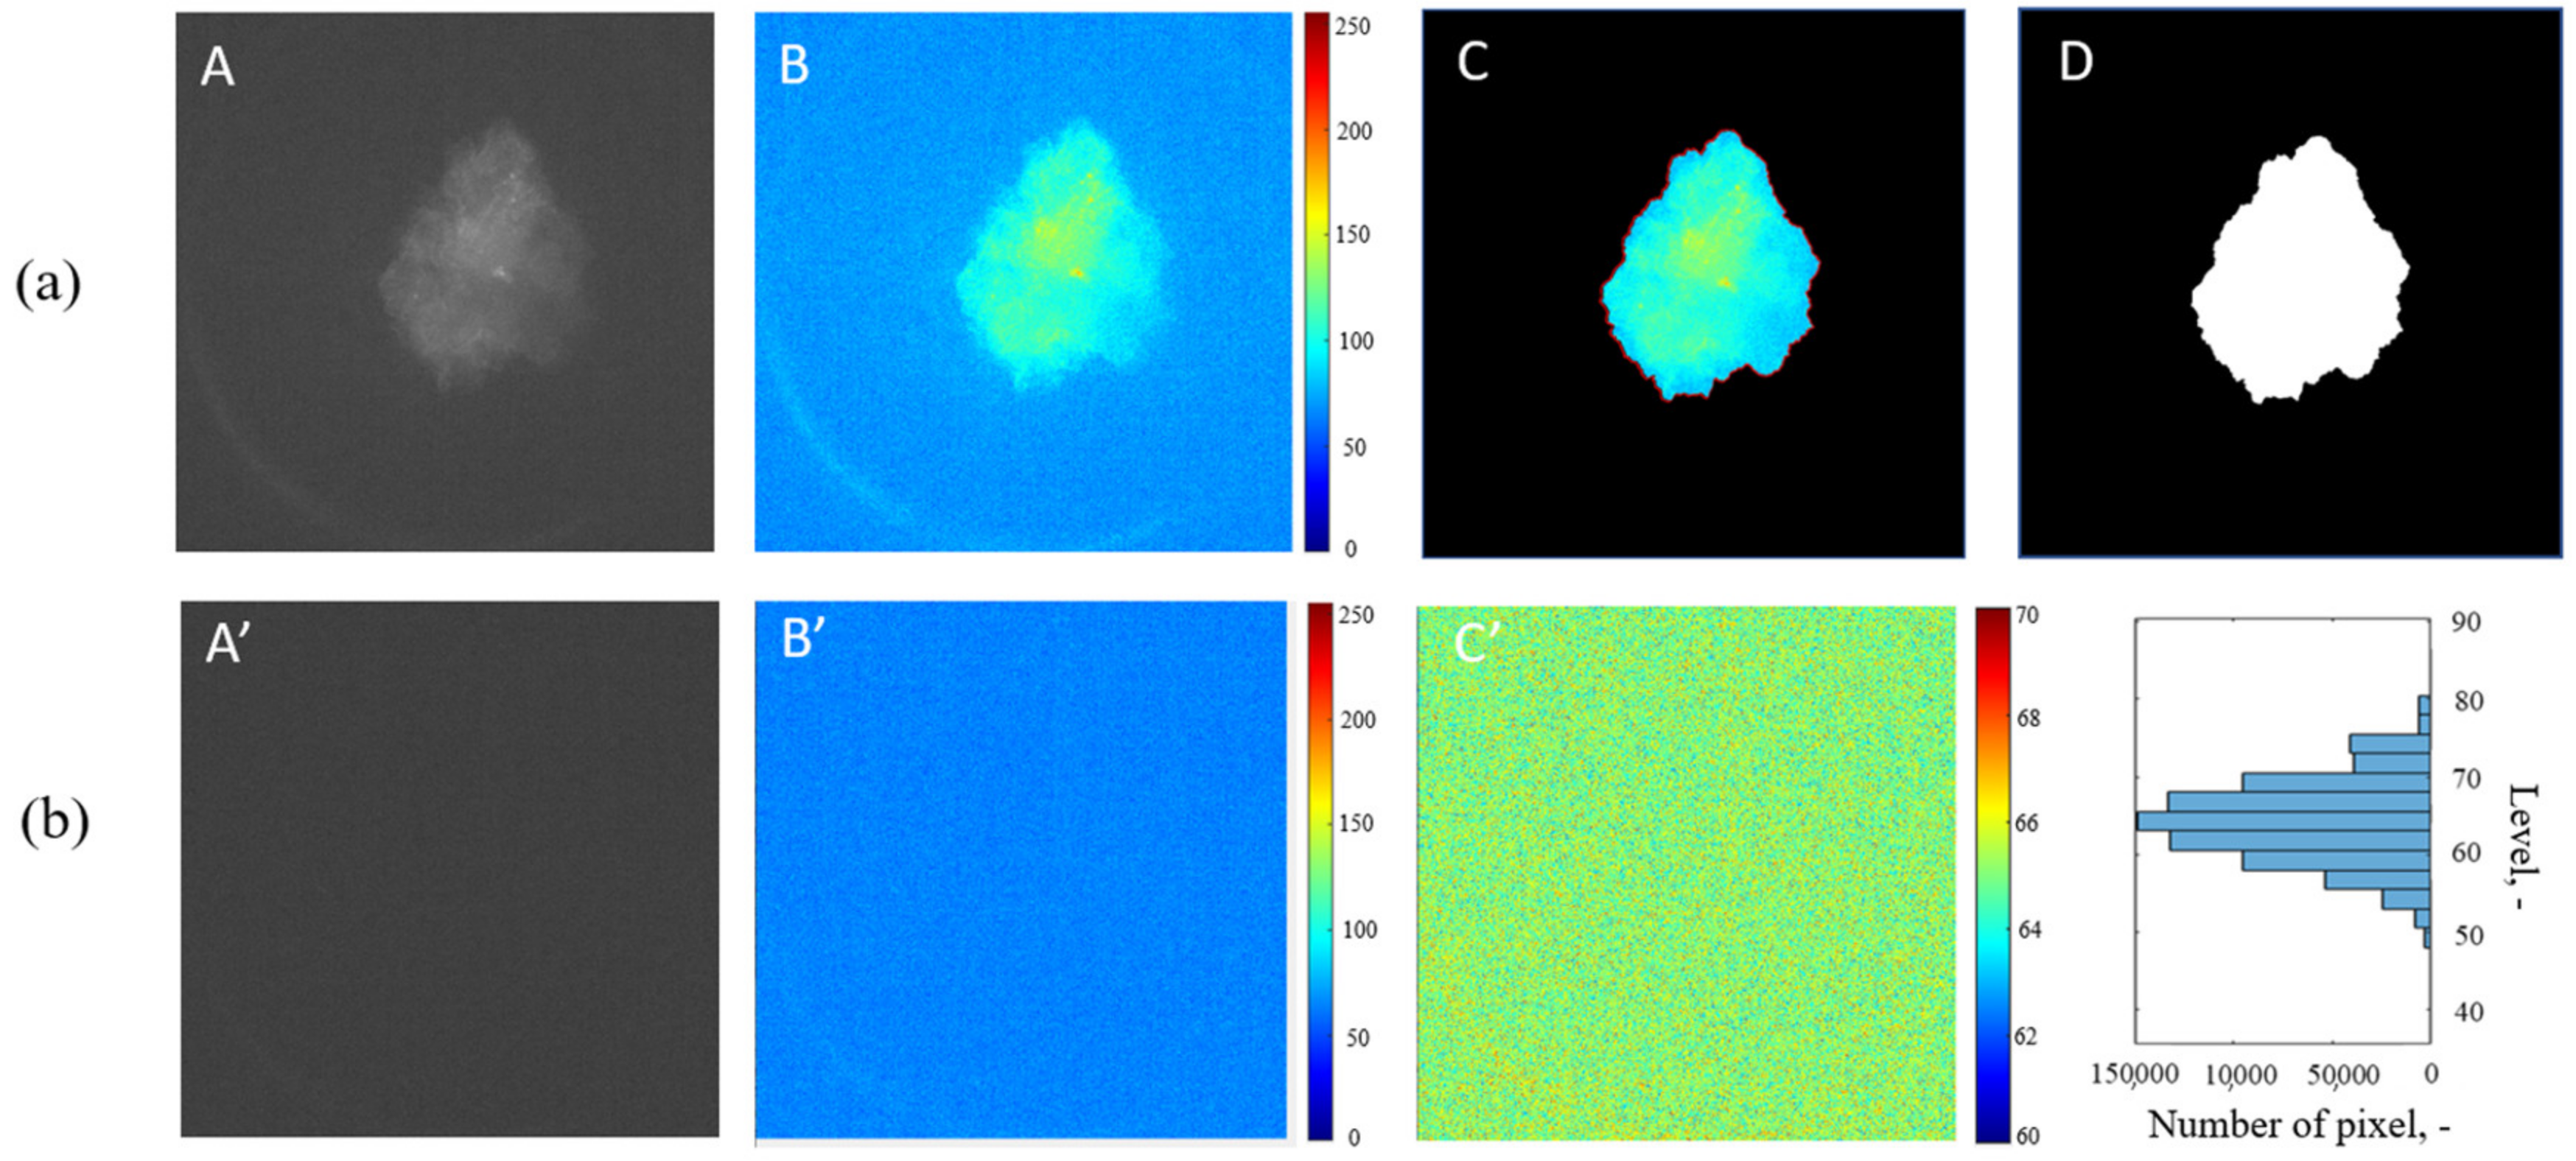
5. Results
6. Conclusions
Author Contributions
Funding
Data Availability Statement
Conflicts of Interest
Nomenclature
| %ERR | Percentage Errors. |
| ACIS | Advanced Corona Ignition System. |
| AI | Artificial Intelligence. |
| aEoD | After End of Discharge. |
| BDI | Barrier Discharge Igniter. |
| BR | Base Reference method. |
| CAD | Crank Angle Degree. |
| CoVIMEP | Covariance of IMEP. |
| CSI | Corona Streamer-Type igniter. |
| DI | Direct Injection. |
| ECU | Engine Control Unit. |
| EGR | Exhaust Gas Recirculation. |
| FPN | Feature Pyramid Network. |
| IMEP | Indicated Mean Effective Pressure. |
| IT | Ignition Timing. |
| MBT | Maximum Brake Torque. |
| MFB | Mass Fraction Burned. |
| MON | Motor Octane Number. |
| PFI | Port Fuel Injection. |
| R-CNN | Region-based Convolutional Neural Network. |
| Req | Equivalent flame radius. |
| RF | Radio Frequency. |
| Roi | Region of Interest. |
| RON | Research Octane Number. |
| RPN | Region Proposal Network. |
| SI | Spark Ignition. |
| TDC | Top Dead Center. |
| ton | Activation time of the igniter. |
| FN | False Negative. |
| FP | False Positive. |
| ICE | Internal Combustion Engine. |
| TN | True Negative. |
| TP | True Positive. |
| Vd | Driving Voltage of the igniter. |
Appendix A

References
- Jeon, J. Spatiotemporal flame propagations, combustion and solid particle emissions from lean and stoichiometric gasoline direct injection engine operation. Energy 2020, 210, 118652. [Google Scholar] [CrossRef]
- Distaso, E.; Amirante, R.; Cassone, E.; De Palma, P.; Sementa, P.; Tamburrano, P.; Vaglieco, B. Analysis of the combustion process in a lean-burning turbulent jet ignition engine fueled with methane. Energy Convers. Manag. 2020, 223, 113257. [Google Scholar] [CrossRef]
- Nakata, K.; Nogawa, S.; Takahashi, D.; Yoshihara, Y.; Kumagai, A.; Suzuki, T. Engine Technologies for Achieving 45% Thermal Efficiency of S.I. Engine. SAE Int. J. Engines 2015, 9, 179–192. [Google Scholar] [CrossRef]
- Johnson, T. Vehicular Emissions in Review. SAE Int. J. Engines 2014, 7, 1207–1227. [Google Scholar] [CrossRef]
- Gao, J.; Tian, G.; Sorniotti, A.; Karci, A.E.; di Palo, R. Review of thermal management of catalytic converters to decrease engine emissions during cold start and warm up. Appl. Therm. Eng. 2019, 147, 177–187. [Google Scholar] [CrossRef]
- Alshammari, M.; Alshammari, F.; Pesyridis, A. Electric Boosting and Energy Recovery Systems for Engine Downsizing. Energies 2019, 12, 4636. [Google Scholar] [CrossRef]
- Merola, S.S.; Marchitto, L.; Tornatore, C.; Valentino, G.; Irimescu, A. UV-visible Optical Characterization of the Early Combustion Stage in a DISI Engine Fuelled with Butanol-Gasoline Blend. SAE Int. J. Engines 2013, 6, 2638. [Google Scholar] [CrossRef]
- Jeon, J.; Bock, N.; Northrop, W.F. In-cylinder Flame Luminosity Measured from a Stratified Lean Gasoline Direct Injection Engine. Results Eng. 2019, 1, 100005. [Google Scholar] [CrossRef]
- Battistoni, M.; Zembi, J.; Casadei, D.; Ricci, F.; Martinelli, R.; Grimaldi, C.; Milani, E. Burner Development for Light-Off Speed-Up of Aftertreatment Systems in Gasoline SI Engines (No. 2022-37-0033); SAE Technical Paper; SAE International: Warrendale, PA, USA, 2022. [Google Scholar]
- Singleton, D.; Pendleton, S.J.; Gundersen, M.A. The Role of Non-Thermal Transient Plasma for Enhanced Flame Ignition in C 2 H 4 -Air. J. Phys. D Appl. Phys. 2011, 44, 022001. [Google Scholar] [CrossRef]
- Padala, S.; Le, M.K.; Nishiyama, A.; Ikeda, Y. Ignition of Propane-Air Mixtures by Miniaturized Resonating Microwave Flat-Panel Plasma Igniter; SAE Technical Paper 2017-24-0150; SAE International: Warrendale, PA, USA, 2017. [Google Scholar] [CrossRef]
- Scarcelli, R.; Biswas, S.; Ekoto, I.; Breden, D.; Karpatne, A. Numerical Simulation of a Nano-Pulsed High-Voltage Discharge and Impact on Low-Temperature Plasma Igni- Tion Processes for Automotive Applications. In Proceedings of the Ignition Systems for Gasoline Engines: 4th International Conference, Berlin, Germany, 6–7 December 2018; pp. 329–339. [Google Scholar] [CrossRef]
- Nishiyama, A.; Ikeda, Y. Improvement of Lean Limit and Fuel Consumption Using Microwave Plasma Ignition Technology; SAE Technical Paper 2012-01-1139; SAE International: Warrendale, PA, USA, 2012. [Google Scholar] [CrossRef]
- Cruccolini, V.; Discepoli, G.; Cimarello, A.; Battistoni, M.; Mariani, F.; Grimaldi, C.N.; Dal Re, M. Lean combustion analysis using a corona discharge igniter in an optical engine fueled with methane and a hydrogen-methane blend. Fuel 2020, 259, 116290. [Google Scholar] [CrossRef]
- Wyczalek, F.A.; Frank, D.L.; Nueman, J.G. Plasma Jet Ignition of Lean Mixtures; SAE Technical Paper 750349; SAE International: Warrendale, PA, USA, 1975. [Google Scholar] [CrossRef]
- Idicheria, C.A.; Najt, P.M. Potential of Advanced Corona Ignition System (ACIS) for Future Engine Applications. In International Conference on Ignition Systems for Gasoline Engines; Springer International Publishing: Cham, Switzerland, 2017; pp. 315–331. [Google Scholar] [CrossRef]
- Marko, F.; König, G.; Schöffler, T.; Bohne, S.; Dinkelacker, F. Comparative Optical and Thermodynamic Investigations of High Frequency Corona- and Spark-Ignition on a CV Natural Gas Research Engine Operated with Charge Dilution by Exhaust Gas Recirculation. In International Conference on Ignition Systems for Gasoline Engines; Springer International Publishing: Cham, Switzerland, 2017; pp. 293–314. [Google Scholar] [CrossRef]
- Ricci, F.; Petrucci, L.; Cruccolini, V.; Discepoli, G.; Grimaldi, C.N.; Papi, S. Investigation of the Lean Stable Limit of a Barrier Discharge Igniter and of a Streamer-Type Corona Igniter at Different Engine Loads in a Single-Cylinder Research Engine. Proceedings 2020, 58, 11. [Google Scholar] [CrossRef]
- Cruccolini, V.; Discepoli, G.; Ricci, F.; Petrucci, L.; Grimaldi, C.; Papi, S.; Dal Re, M. Comparative Analysis between a Barrier Discharge Igniter and a Streamer-Type Radio-Frequency Corona Igniter in an Optically Accessible Engine in Lean Operating Conditions; SAE Technical Paper; SAE International: Warrendale, PA, USA, 2020. [Google Scholar] [CrossRef]
- Ricci, F.; Zembi, J.; Battistoni, M.; Grimaldi, C.; Discepoli, G.; Petrucci, L. Experimental and Numerical Investigations of the Early Flame Development Produced by a Corona Igniter; SAE Technical Paper; SAE International: Warrendale, PA, USA, 2019. [Google Scholar] [CrossRef]
- Ricci, F.; Martinelli, R.; Petrucci, L.; Discepoli, G.; Nazareno, C.; Papi, S. Streamers Variability Investigation of a Radio- Frequency Corona Discharge in an Optical Access Engine at Different Speeds and Loads. E3S Web Conf. 2021, 312, 07021. [Google Scholar] [CrossRef]
- Petrucci, L.; Ricci, F.; Mariani, F.; Discepoli, G. A Development of a New Image Analysis Technique for Detecting the Flame Front Evolution in Spark Ignition Engine under Lean Condition. Vehicles 2022, 4, 145–166. [Google Scholar] [CrossRef]
- Petrucci, L.; Ricci, F.; Mariani, F.; Cruccolini, V.; Violi, M. Engine Knock Evaluation Using a Machine Learning Approach; SAE Technical Paper; SAE International: Warrendale, PA, USA, 2020. [Google Scholar] [CrossRef]
- Petrucci, L.; Ricci, F.; Mariani, F.; Grimaldi, C.N.; Discepoli, G.; Violi, M.; Matteazzi, N. Performance analysis of artificial neural networks for control in internal combustion engines. AIP Conf. Proc. 2019, 2191, 020129. [Google Scholar] [CrossRef]
- Goyal, M.; Knackstedt, T.; Yan, S.; Hassanpour, S. Artificial intelligence-based image classification methods for diagnosis of skin cancer: Challenges and opportunities. Comput. Biol. Med. 2020, 127, 104065. [Google Scholar] [CrossRef]
- Affonso, C.; Sassi, R.J.; Marques Barreiros, R. Biological image classification using rough-fuzzy artificial neural network. Expert Syst. Appl. 2015, 42, 9482–9488. [Google Scholar] [CrossRef]
- Kwan, M.F.Y.; Cheung, K.C.; Gibson, I.R. Automatic boundary extraction and rectification of bony tissue in CT images using artificial intelligence techniques. Med. Imaging Image Process. 2000, 3979, 96–905. [Google Scholar]
- Sara, A.; Usman Tariq, M. Handwriting recognition using artificial intelligence neural network and image processing. Int. J. Adv. Comput. Sci. Appl. 2020, 11, 7. [Google Scholar]
- Park, K.; Chae, M.; Cho, J.H. Image Pre-Processing Method of Machine Learning for Edge Detection with Image Signal Processor Enhancement. Micromachines 2021, 12, 73. [Google Scholar] [CrossRef]
- Znamenskaya, I.A.; Doroshchenko, I.A. Edge detection and machine learning for automatic flow structures detection and tracking on schlieren and shadowgraph images. J. Flow Vis. Image Process. 2021, 28, 1–26. [Google Scholar] [CrossRef]
- Nazish, T.; Hamzah, R.A.; Ng, T.F.; Wang, S.L.; Ibrahim, H. Quality assessment methods to evaluate the performance of edge detection algorithms for digital image: A systematic literature review. IEEE Access 2021, 9, 87763–87776. [Google Scholar]
- Xu, X.; Zhang, X.; Zhang, T.; Shi, J.; Wei, S.; Li, J. On-Board Ship Detection in SAR Images Based on L-YOLO. In Proceedings of the 2022 IEEE Radar Conference (RadarConf22), New York, NY, USA, 21–25 March 2022. [Google Scholar]
- Chang, Y.-L.; Anagaw, A.; Chang, L.; Wang, Y.C.; Hsiao, C.-Y.; Lee, W.-H. Ship Detection Based on YOLOv2 for SAR Imagery. Remote Sens. 2019, 11, 786. [Google Scholar] [CrossRef]
- Liu, W.D.; Anguelov, D.; Erhan, C.; Szegedy, S.E.; Fu, R.C.; Berg, A.C. SSD: Single shot multibox detector. In Proceedings of the 14th European Conference on Computer Vision (ECCV), Amsterdam, The Netherlands, 17 October 2016; pp. 21–37. [Google Scholar]
- Xu, Y.; Li, D.; Xie, Q.; Wu, Q.; Wang, J. Automatic defect detection and segmentation of tunnel surface using modified Mask R-CNN. Measurement 2021, 178, 109316. [Google Scholar] [CrossRef]
- Suh, S.; Park, Y.; Ko, K.; Yang, S.; Ahn, J.; Shin, J.-K.; Kim, S. Weighted Mask R-CNN for Improving Adjacent Boundary Segmentation. J. Sens. 2021, 2021, 1–8. [Google Scholar] [CrossRef]
- He, K.; Gkioxari, G.; Dollár, P.; Girshick, R.B. Mask R-CNN, CoRR,vol. abs/1703.06870, 2017. In Proceedings of the IEEE International Conference on Computer Vision, Venice, Italy, 22 October 2017. [Google Scholar]
- Ren, S.; He, K.; Girshick, R.; Sun, J. Faster R-CNN: Towards real-time object detection with region proposal networks. IEEE Trans. Pattern Anal. Mach. Intell. 2017, 39, 1137–1149. [Google Scholar] [CrossRef] [PubMed]
- Nie, X.; Duan, M.; Ding, H.; Hu, B.; Wong, E.K. Attention Mask R-CNN for Ship Detection and Segmentation From Remote Sensing Images. IEEE Access 2020, 8, 9325–9334. [Google Scholar] [CrossRef]
- Liu, S.; Qi, L.; Qin, H.; Shi, J.; Jia, J. Path Aggregation Network for Instance Segmentation. In Proceedings of the 2018, IEEE/CVF Conference on Computer Vision and Pattern Recognition (CVPR), Salt Lake City, UT, USA, 18–23 June 2018; pp. 8759–8768. [Google Scholar]
- Yang, X.; Fu, K.; Sun, H.; Yang, J.; Guo, Z.; Yan, M.; Zhang, T.; Xian, S. R2CNN++: Multi-dimensional attention based rotation invariant detector with robust anchor strategy. arXiv 2018, arXiv:1811.071262.7. [Google Scholar]
- Oskar, A.V.; Akram, S.U.; Kannala, J. Mask-RCNN and U-net ensembled for nuclei segmentation. In Proceedings of the 16th International Symposium on Biomedical Imaging (ISBI 2019), Venice, Italy, 8–11 April 2019. [Google Scholar]
- Leger, A.; Le Goic, G.; Fofi, D.; Kornalewski, R. R-CNN based automated visual inspection system for engine parts quality assessment. In Proceedings of the 15th International Conference on Quality Control by Artificial Vision, SPIE, Mulhouse, France, 15–17 May 2021; Volume 11794. [Google Scholar]
- Martinelli, R.; Ricci, F.; Zembi, J.; Battistoni, M.; Grimaldi, C.; Papi, S. Lean Combustion Analysis of a Plasma-Assisted Ignition System in a Single Cylinder Engine Fueled with E85; SAE Technical Paper 2022-24-0034; SAE International: Warrendale, PA, USA, 2022. [Google Scholar]
- Canepa, E.; Nilberto, A. Experimental flame front characterisation in a lean premix burner operating with syngas simplified model fuel. Energies 2019, 12, 2377. [Google Scholar] [CrossRef]
- Melo, M.J.; Sousa, J.M.M.; Costa, M.; Levy, Y. Flow and combustion characteristics of a low-NOx combustor model for gas turbines. J. Propuls. Power 2011, 27, 1212–1217. [Google Scholar] [CrossRef]
- Ricci, F.; Discepoli, G.; Cruccolini, V.; Petrucci, L.; Papi, S.; Di Giuseppe, A.; Grimaldi, C. Energy characterization of an innovative non-equilibrium plasma ignition system based on the dielectric barrier discharge via pressure-rise calorimetry. Energy Convers. Manag. 2021, 244, 114458. [Google Scholar] [CrossRef]
- Zembi, J.; Ricci, F.; Grimaldi, C.; Battistoni, M. Numerical Simulation of the Early Flame Development Produced by a Barrier Discharge Igniter in an Optical Access Engine. In Proceedings of the 15th International Conference on Engines & Vehicles, Capri, Italy, 12–16 September 2021; pp. 1–12. [Google Scholar] [CrossRef]
- Ricci, F.; Cruccolini, V.; Discepoli, G.; Petrucci, L.; Grimaldi, C.; Papi, S. Luminosity and Thermal Energy Measurement and Comparison of a Dielectric Barrier Discharge in an Optical Pressure-Based Calorimeter at Engine Relevant Conditions. SAE Tech. Pap. Ser. 2021, 1, 1–11. [Google Scholar] [CrossRef]
- Starikovskaia, S.M. Assisted ignition and combustion. J. Phys. D Appl. Phys. 2006, 39, R265. [Google Scholar] [CrossRef]
- Starikovskii, A. Plasma supported combustion. Proc. Combust. Inst. 2005, 30, 2405–2417. [Google Scholar] [CrossRef]
- Idicheria, C.A.; Yun, H.; Najt, P.M. An Advanced Ignition System for High Efficiency Engines. In Proceedings of the Ignition Systems for Gasoline Engines: 4th International Conference, Berlin, Germany, 6–7 December 2018; pp. 40–54. [Google Scholar]
- Discepoli, G.; Cruccolini, V.; Ricci, F.; Di Giuseppe, A.; Papi, S.; Grimaldi, C. Experimental characterisation of the thermal energy released by a Radio-Frequency Corona Igniter in nitrogen and air. Appl. Energy 2020, 263, 114617. [Google Scholar] [CrossRef] [Green Version]
- Cruccolini, V.; Grimaldi, C.N.; Discepoli, G.; Ricci, F.; Petrucci, L.; Papi, S. An Optical Method to Characterize Streamer Variability and Streamer-to-Flame Transition for Radio-Frequency Corona Discharges. Appl. Sci. 2020, 10, 2275. [Google Scholar] [CrossRef]
- Cruccolini, V.; Discepoli, G.; Ricci, F.; Grimaldi, C.N.; Di Giuseppe, A. Optical and Energetic Investigation of an Advanced Corona Ignition System in a Pressure-Based Calorimeter. E3S Web Conf. 2020, 197, 06019. [Google Scholar] [CrossRef]
- Shawal, S.; Goschutz, M.; Schild, M.; Kaiser, S.; Neurohr, M.; Pfeil, J.; Koch, T. High-speed imaging of early flame growth in spark-ignited engines using different imaging systems via endoscopic and full optical access. SAE Int. J. Engines 2016, 9, 704–718. [Google Scholar] [CrossRef]
- Kaiming, H.; Gkioxari, G.; Dollar, P.; Girshick, R. Mask r-cnn. In Proceedings of the IEEE International Conference on Computer Vision, Venice, Italy, 22–29 October 2017. [Google Scholar]
- Girshick, R. Fast R-CNN. In Proceedings of the IEEE International Conference on Computer Vision, Santiago, Chile, 7–13 December 2015. [Google Scholar]
- Huang, J.; Rathod, V.; Sun, C.; Zhu, M.; Korattikara, A.; Fathi, A.; Fischer, I.; Wojna, Z.; Song, Y.; Guadarrama, S.; et al. Speed/accuracy trade-offs for modern convolutional object detectors. In Proceedings of the Computer Vision and Pattern Recognition 2017, Honolulu, HI, USA, 21–26 July 2017. [Google Scholar]
- Long, J.; Shelhamer, E.; Darrell, T. Fully convolutional networks for semantic segmentation. In Proceedings of the Computer Vision and Pattern Recognition 2015, Boston, MA, USA, 7–12 June 2015. [Google Scholar]
- Ghosal, P.; Nandanwar, L.; Kanchan, S.; Bhadra, A.; Chakraborty, J.; Nandi, D. Brain tumor classification using ResNet-101 based squeeze and excitation deep neural network. In Proceedings of the Second International Conference on Advanced Computational and Communication Paradigms (ICACCP), Gangtok, India, 25–28 February 2019. [Google Scholar]
- Tsung-Yi, L.; Dollar, P.; Girshick, R.; He, K.; Hariharan, B.; Belongie, S. Feature pyramid networks for object detection. In Proceedings of the IEEE Conference on Computer Vision and Pattern Recognition, Honolulu, HI, USA, 21–26 July 2017. [Google Scholar]
- He, K.; Zhang, X.; Ren, S.; Sun, J. Deep residual learning for image recognition. In Proceedings of the Computer Vision and Pattern Recognition 2016, Las Vegas, NV, USA, 26 June–1 July 2016. [Google Scholar]
- Safa, M.; Ejbali, R.; Zaied, M. Denoising autoencoder with dropout based network anomaly detection. In Proceedings of the International Conference on Sustainable Environment and Agriculture 2019, Honolulu, HI, USA, 18–20 October 2019. [Google Scholar]
- Islam, M.Z.; Islam, M.M.; Asraf, A. A combined deep CNN-LSTM network for the detection of novel coronavirus (COVID-19) using X-ray images. Inform. Med. Unlocked 2020, 20, 100412. [Google Scholar] [CrossRef]


| Feature | Value and Unit |
|---|---|
| Displaced volume | 500 cc |
| Stroke | 88 mm |
| Bore | 85 mm |
| Connecting Rod | 139 mm |
| Compression ratio | 8.8:1 |
| Number of Valves | 4 |
| Exhaust Valve Open | 13 CAD bBDC |
| Exhaust Valve Close | 25 CAD aTDC |
| Inlet Valve Open | 20 CAD bTDC |
| Intake Valve Close | 24 CAD aBDC |
| Feature | Value | Unit |
| Image resolution | 512 512 | pixel |
| Sampling rate | 25 | kHz |
| Exposure time | 49 | µs |
| Bit depth | 12 | Bit |
| Spatial resolution | 124 | µm/pixel |
| Temporal resolution (@1000rpm) | 0.24 | CAD/frame |
| λ | IT, CAD aTDC | IMEP, bar | CoVIMEP, % |
|---|---|---|---|
| 1.4 | 26 | 3.19 | 1.21 |
| 1.5 | 32 | 2.95 | 1.21 |
| 1.6 | 38 | 2.93 | 1.14 |
| 1.7 | 44 | 2.70 | 1.71 |
| 1.8 | 56 | 2.52 | 3.52 |
Publisher’s Note: MDPI stays neutral with regard to jurisdictional claims in published maps and institutional affiliations. |
© 2022 by the authors. Licensee MDPI, Basel, Switzerland. This article is an open access article distributed under the terms and conditions of the Creative Commons Attribution (CC BY) license (https://creativecommons.org/licenses/by/4.0/).
Share and Cite
Petrucci, L.; Ricci, F.; Martinelli, R.; Mariani, F. Detecting the Flame Front Evolution in Spark-Ignition Engine under Lean Condition Using the Mask R-CNN Approach. Vehicles 2022, 4, 978-995. https://doi.org/10.3390/vehicles4040053
Petrucci L, Ricci F, Martinelli R, Mariani F. Detecting the Flame Front Evolution in Spark-Ignition Engine under Lean Condition Using the Mask R-CNN Approach. Vehicles. 2022; 4(4):978-995. https://doi.org/10.3390/vehicles4040053
Chicago/Turabian StylePetrucci, Luca, Federico Ricci, Roberto Martinelli, and Francesco Mariani. 2022. "Detecting the Flame Front Evolution in Spark-Ignition Engine under Lean Condition Using the Mask R-CNN Approach" Vehicles 4, no. 4: 978-995. https://doi.org/10.3390/vehicles4040053