Article

Influence of Charging Losses on Energy Consumption and CO2 Emissions of Battery-Electric Vehicles

1
Department of Electrical Engineering, Ravensburg-Weingarten University (RWU), 88250 Weingarten, Germany
2
Department of Mechanical Engineering, Ravensburg-Weingarten University (RWU), 88250 Weingarten, Germany
3
School of Engineering and Computer Science, Bern University of Applied Sciences, 2500 Biel-Bienne, Switzerland
*
Author to whom correspondence should be addressed.
Vehicles 2021, 3(4), 736-748; https://doi.org/10.3390/vehicles3040043
Submission received: 11 October 2021 / Revised: 27 October 2021 / Accepted: 28 October 2021 / Published: 4 November 2021

Abstract

:
Due to increasing sales figures, the energy consumption of battery-electric vehicles is moving further into focus. In addition to efficient driving, it is also important that the energy losses during AC charging are as low as possible for a sustainable operation. In many situations it is not possible or necessary to charge the vehicle with the maximum charging power e.g., in apartment buildings. The influence of the charging mode (number of phases used, in-cable-control-box or used wallbox, charging current) on the charging efficiency is often unknown. In this work, the energy consumption of two electric vehicles in the Worldwide Harmonized Light-Duty Vehicles Test Cycle is presented. In-house developed measurement technology and vehicle CAN data are used. A detailed breakdown of charging losses, drivetrain efficiency, and overall energy consumption for one of the vehicles is provided. Finally, the results are discussed with reference to avoidable CO 2 emissions. The charging losses of the tested vehicles range from 12.79 to 20.42%. Maximum charging power with three phases and 16 A charging current delivers the best efficiencies. Single-phase charging was considered down to 10 A, where the losses are greatest. The drivetrain efficiency while driving is 63.88% on average for the WLTC, 77.12% in the “extra high” section and 23.12% in the “low” section. The resulting energy consumption for both vehicles is higher than the OEM data given (21.6 to 44.9%). Possible origins for the surplus on energy consumption are detailed. Over 100,000 km, unfavorable charging results in additional CO 2 emissions of 1.24 t. The emissions for an assumed annual mileage of 20,000 km are three times larger than for a class A+ refrigerator. A classification of charging modes and chargers thus appears to make sense. In the following work, efficiency improvements in the charger as well as DC charging will be proposed.

1. Introduction

Battery-electric vehicle (BEV) sales have climbed due to continued high pressure on OEMs (Original Equipment Manufacturer) from legislators over severe penalties for excessive CO 2 fleet emissions. Further incentives have been created in many countries by subsidizing the purchase of BEVs. If it can be ensured that BEVs are charged with renewable energies, these vehicles can contribute to CO 2 reduction in the transport sector. Recent calculations using dynamic modeling show that BEVs will deliver CO 2 savings in 2029 after less than 20,000 km compared to hybrid internal combustion engine-powered vehicles. Necessary mileage varies depending on the country’s electricity mix—but a clear trend toward low mileage is emerging [1].
The use of renewable energies for charging BEVs is therefore very important. In private households, the charging power may be linked to the photovoltaic (PV) system and to the energy consumption of other consumers in the household (e.g., heating).
Calculations on CO 2 savings are usually made with the provided consumption data of the OEMs from the Worldwide Harmonized Light-Duty Vehicles Test Procedure (WLTP) [2]. Automobile associations as well as professional journals repeatedly report increased energy consumption of electric vehicles compared to this manufacturer data [3,4].
One reason is that the WLTP’s test cycle (WLTC—Worldwide Harmonized Light-Duty Vehicles Test Cycle) was not created to reflect different individual speed and load profiles. It was created for a worldwide similar vehicle homologation process. Thus, only four speed sections are provided. Manufacturers publish the average combined energy consumption from the total WLTC normally.
If the individual driving profile differs from the combined WLTC, the real-driving energy consumption can deviate from the WLTC results.
In addition, ambient temperature, cell aging and the general temperature of relevant powertrain components (e.g., electric motor, battery, transmission oil) as well as charging losses play a significant role in the resulting energy efficiency [5].
Since energy consumption correlates directly with the CO 2 emissions generated, it is important to determine the charging losses in order to reduce losses in the long term. In the WLTC, these charging losses are taken into account. The procedure defines that charging should be performed with the maximum alternate current (AC) charging power possible. The actual type of charger to be used in the charging process is not specified. It is also possible to use the emergency charger of the vehicle [2].
In European private households normally a Type2 plug is used to charge a BEV with maximal 11 kW. This is because charging facilities define a load up to and including 12 kW are subject to notification and must be reported to the network operator [6]. In many households, charging will nevertheless take place at a lower power. This can result from limitations of the grid operator, the building infrastructure or from the use of electricity from PV systems.
In conclusion, the driving profile as well as the charging losses can play a decisive role for the evaluation of CO 2 -emissions of BEV as well as for the design of a PV-system for charging purpose. Today, the combined WLTC provides indications for both, but only selectively. The BEVs influence of different charging powers or different driving profiles is not provided.
In [7] it is shown that one-way losses in the battery of an EV can be between 1.15 and 7.87% depending on the state of charge (SOC) and the charging current. The power electronic losses in the charger of the vehicle vary between 0.88 and 16.53% also in dependency of current and SOC. In general, losses decrease with increasing current.
Studies on the energy consumption of BEVs and the charging losses that occur are known from the sources [3,4,7]. The sources [3,4] name a real additional consumption of BEVs compared to the manufacturer’s specifications. The consumption was determined in own and practical driving cycles. This already results in higher consumption values. Furthermore, the charging losses are mentioned as increasing consumption. A breakdown of the charging losses is presented without going into the details of the charging process, e.g., the set amperage or the number of phases used. Ref. [7] breaks down the influence of the charging losses more precisely according to the amperage. The focus of this study is on the integration of electric vehicles into the power grid. The variance of the amperage exceeds the common range in private households significantly.
This study extends the previous findings and shows the influence of charging losses for private households in the typical setting range between 10 and 16 A current intensity as well as for charging with the use of one to three phases.
In this publication the investigations on two vehicles are discussed. The same effort could have been invested into fewer WLTC measurements of more vehicles and less parameter variation. The approach chosen here concentrates on the principle representation of occurring phenomena. A measurement method with which many measurements could be efficiently and focused carried out in the future can be developed based on the results of this study.
A Kia e-Niro and a VW e-up! is tested on a dynamometer passing several WLTCs. The efficiency of the drivetrain and in the following of the charging process is measured with a developed measuring box. To clarify the phenomena, the data are illustrated for the combined WLTC as well as for the single WLTC sections.
The main aim of the paper is to evaluate the AC charging losses depending on used phases and the charging current. This comprises data that gives insights in the real-driving efficiency of BEVs. Finally, the impact of the charging losses on CO 2 -emissions is discussed.

2. Materials and Methods

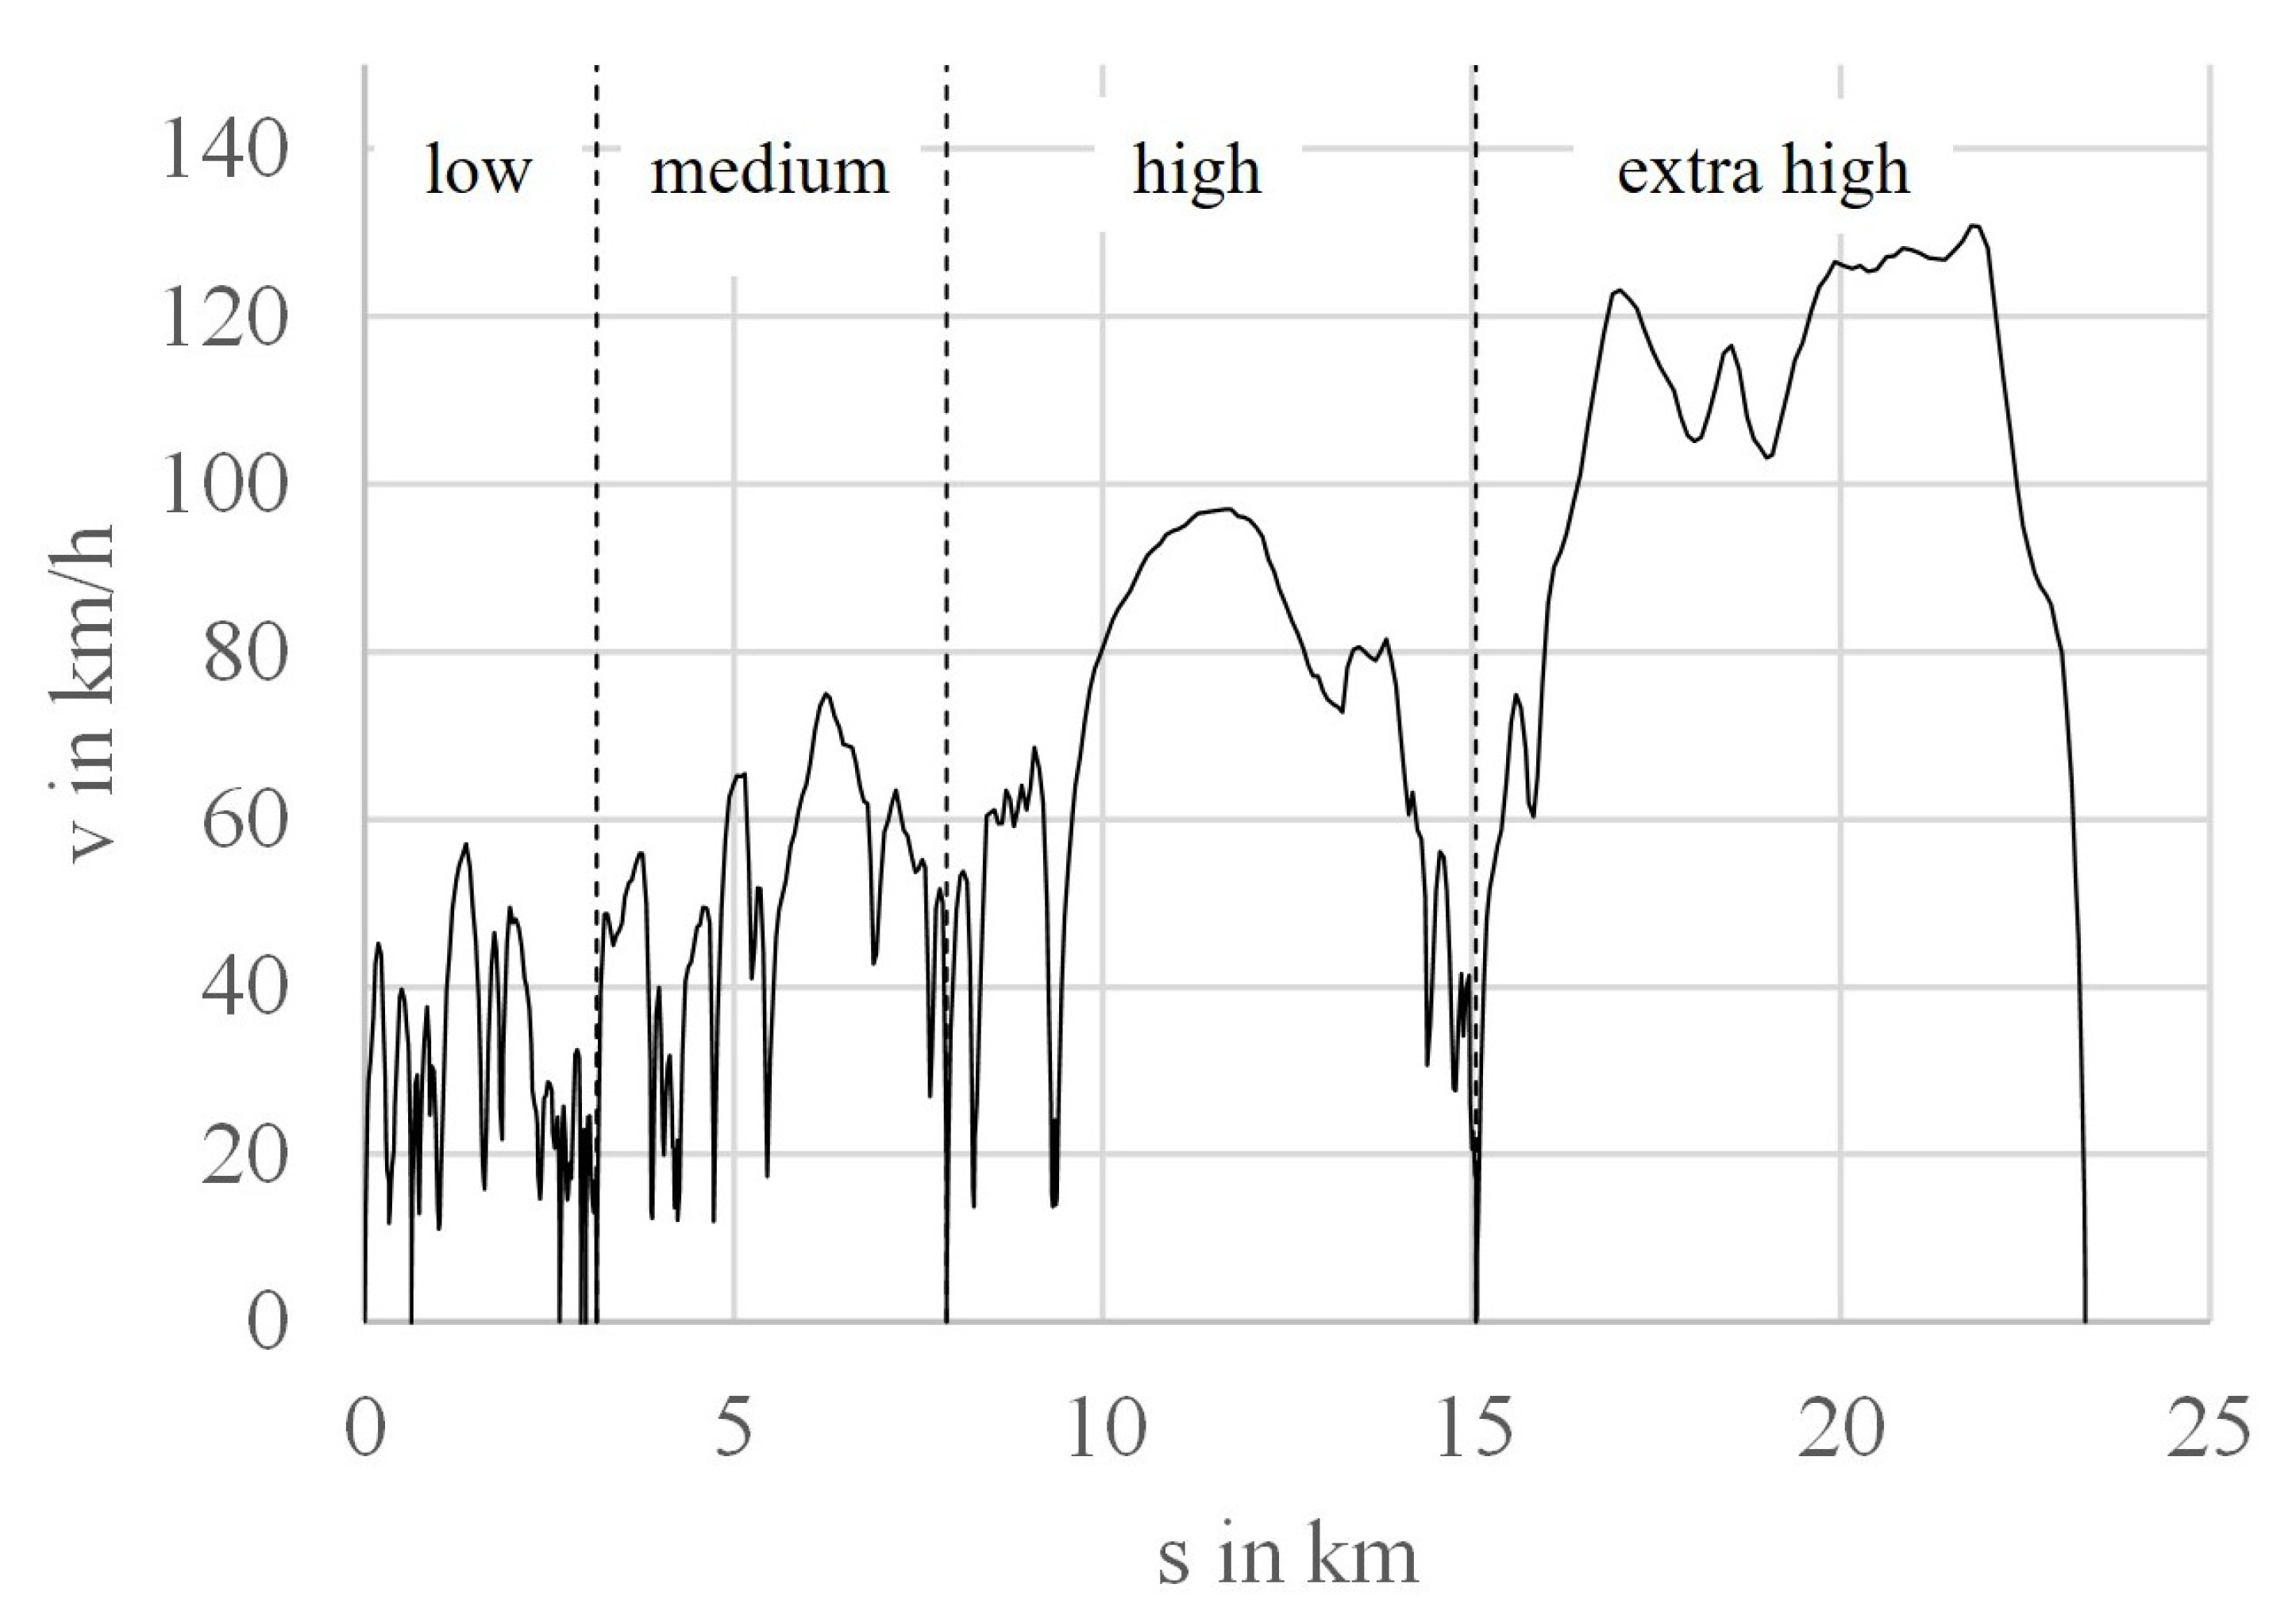
Figure 1 shows the WLTC. This test cycle is used in this paper to determine the energy consumption as well as the charging losses of electric vehicles. Figure 1 shows the speed of the vehicle in the different WLTC sections “low”, “medium”, “high” and “extra high” as a function of the distance driven. The advantage of a representation via the distance driven is that this representation goes hand in hand with the usual consumption parameters in BEVs. The energy consumption of BEVs is usually given in Wh/km or in kWh/100 km. Both parameters refer to a distance driven.
Table 1 shows details of the WLTC. It shows (absolute and relative) how far the vehicle travels in the individual sections of the cycle. In none of the sections the vehicle travels further than 10 km. The relative distance driven in the “low” and “medium” sections is 33.7%, which is about as heavily weighted as the “high” and “extra high“ sections. A comparison of the time shares shows that most time is spent in the “low” section. The “medium” and “high” sections account about a quarter of the time each, while the “extra high” section only accounts for just under 18% of the time. In addition, the average speed in the single sections is presented.
The following section describes in detail the measuring on the chassis dynamometer and the determination of charge and drivetrain efficiency.

2.1. Dynamometer WLTC Measuring

The presented WLTC measurements are carried out on a dynamometer at the Berner university of applied sciences. It is a self-developed prism roller dynamometer for vehicle developments, emission and certification testing [
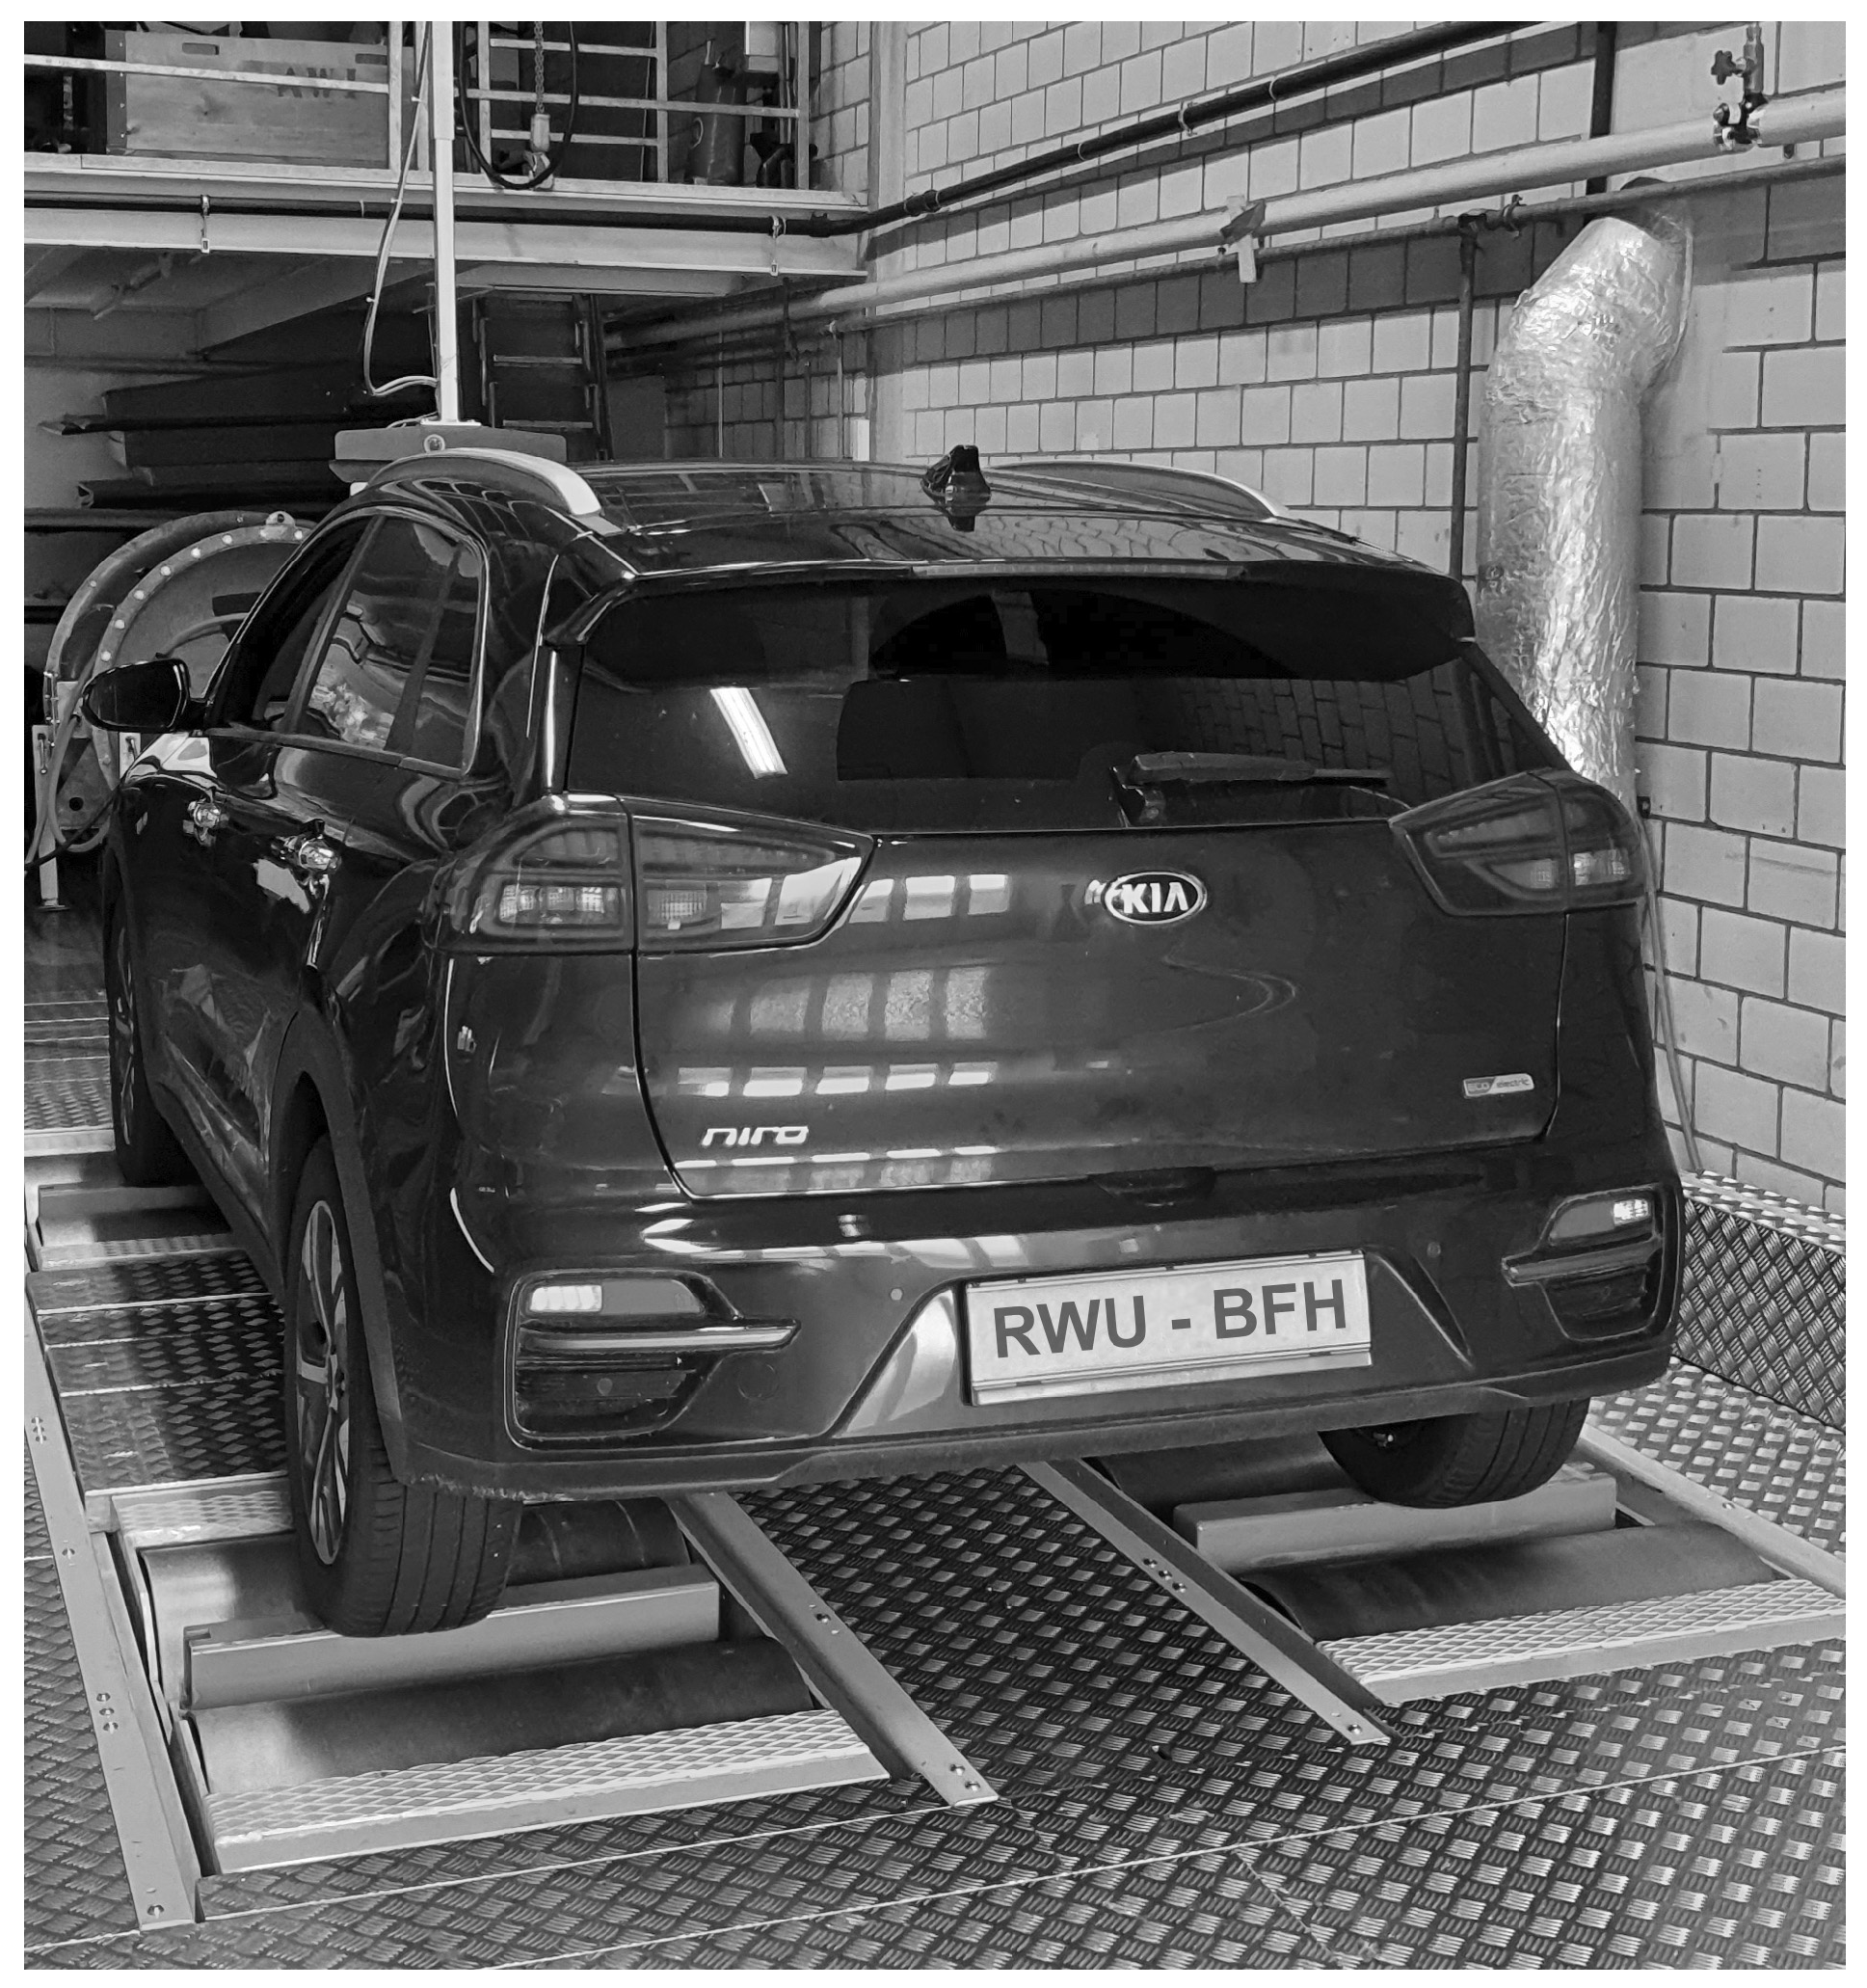
8]. Two vehicles are tested, a VW e-Up! (MY 2019) and a Kia e-Niro (MY 2020). Figure 2 shows the Kia vehicle on the used chassis dynamometer.
The measured energy consumption E W L T C in the cycle measurements includes the charging losses as specified by the WLTP and is equal to the charged energy E C per 100 km. Both parameters are determined by measuring the recharged energy after completing the WLTC using appropriate power measurement technology.
To determine the vehicle drivetrain efficiency in the WLTC the power signal of the dynamometer electric brakes P δ is used. By integrating this signal, it is then possible to determine the amount of energy introduced or expended into the role of the dynamometer for the WLTC E δ .
E δ = P δ d t
These data are also used to compare the measured WLTC cycles to ensure that the overall energy put into the dynamometer rolls is comparable. Table 2 shows the results of four WLTC tests with the Kia. These cycle data are used to evaluate the driving and charging efficiency. It can be shown that the resulting E δ is comparable and varies by maximal 0.5%.

2.2. Charging Losses

Table 3 shows the relevant OEM provided vehicle data for the study in hands. The maximum charging power of the Kia is higher than for the VW because it can use all three phases. Therefore, the Kia is used to test the sensitivity of the charging mode (number of phases and charging current) efficiency.
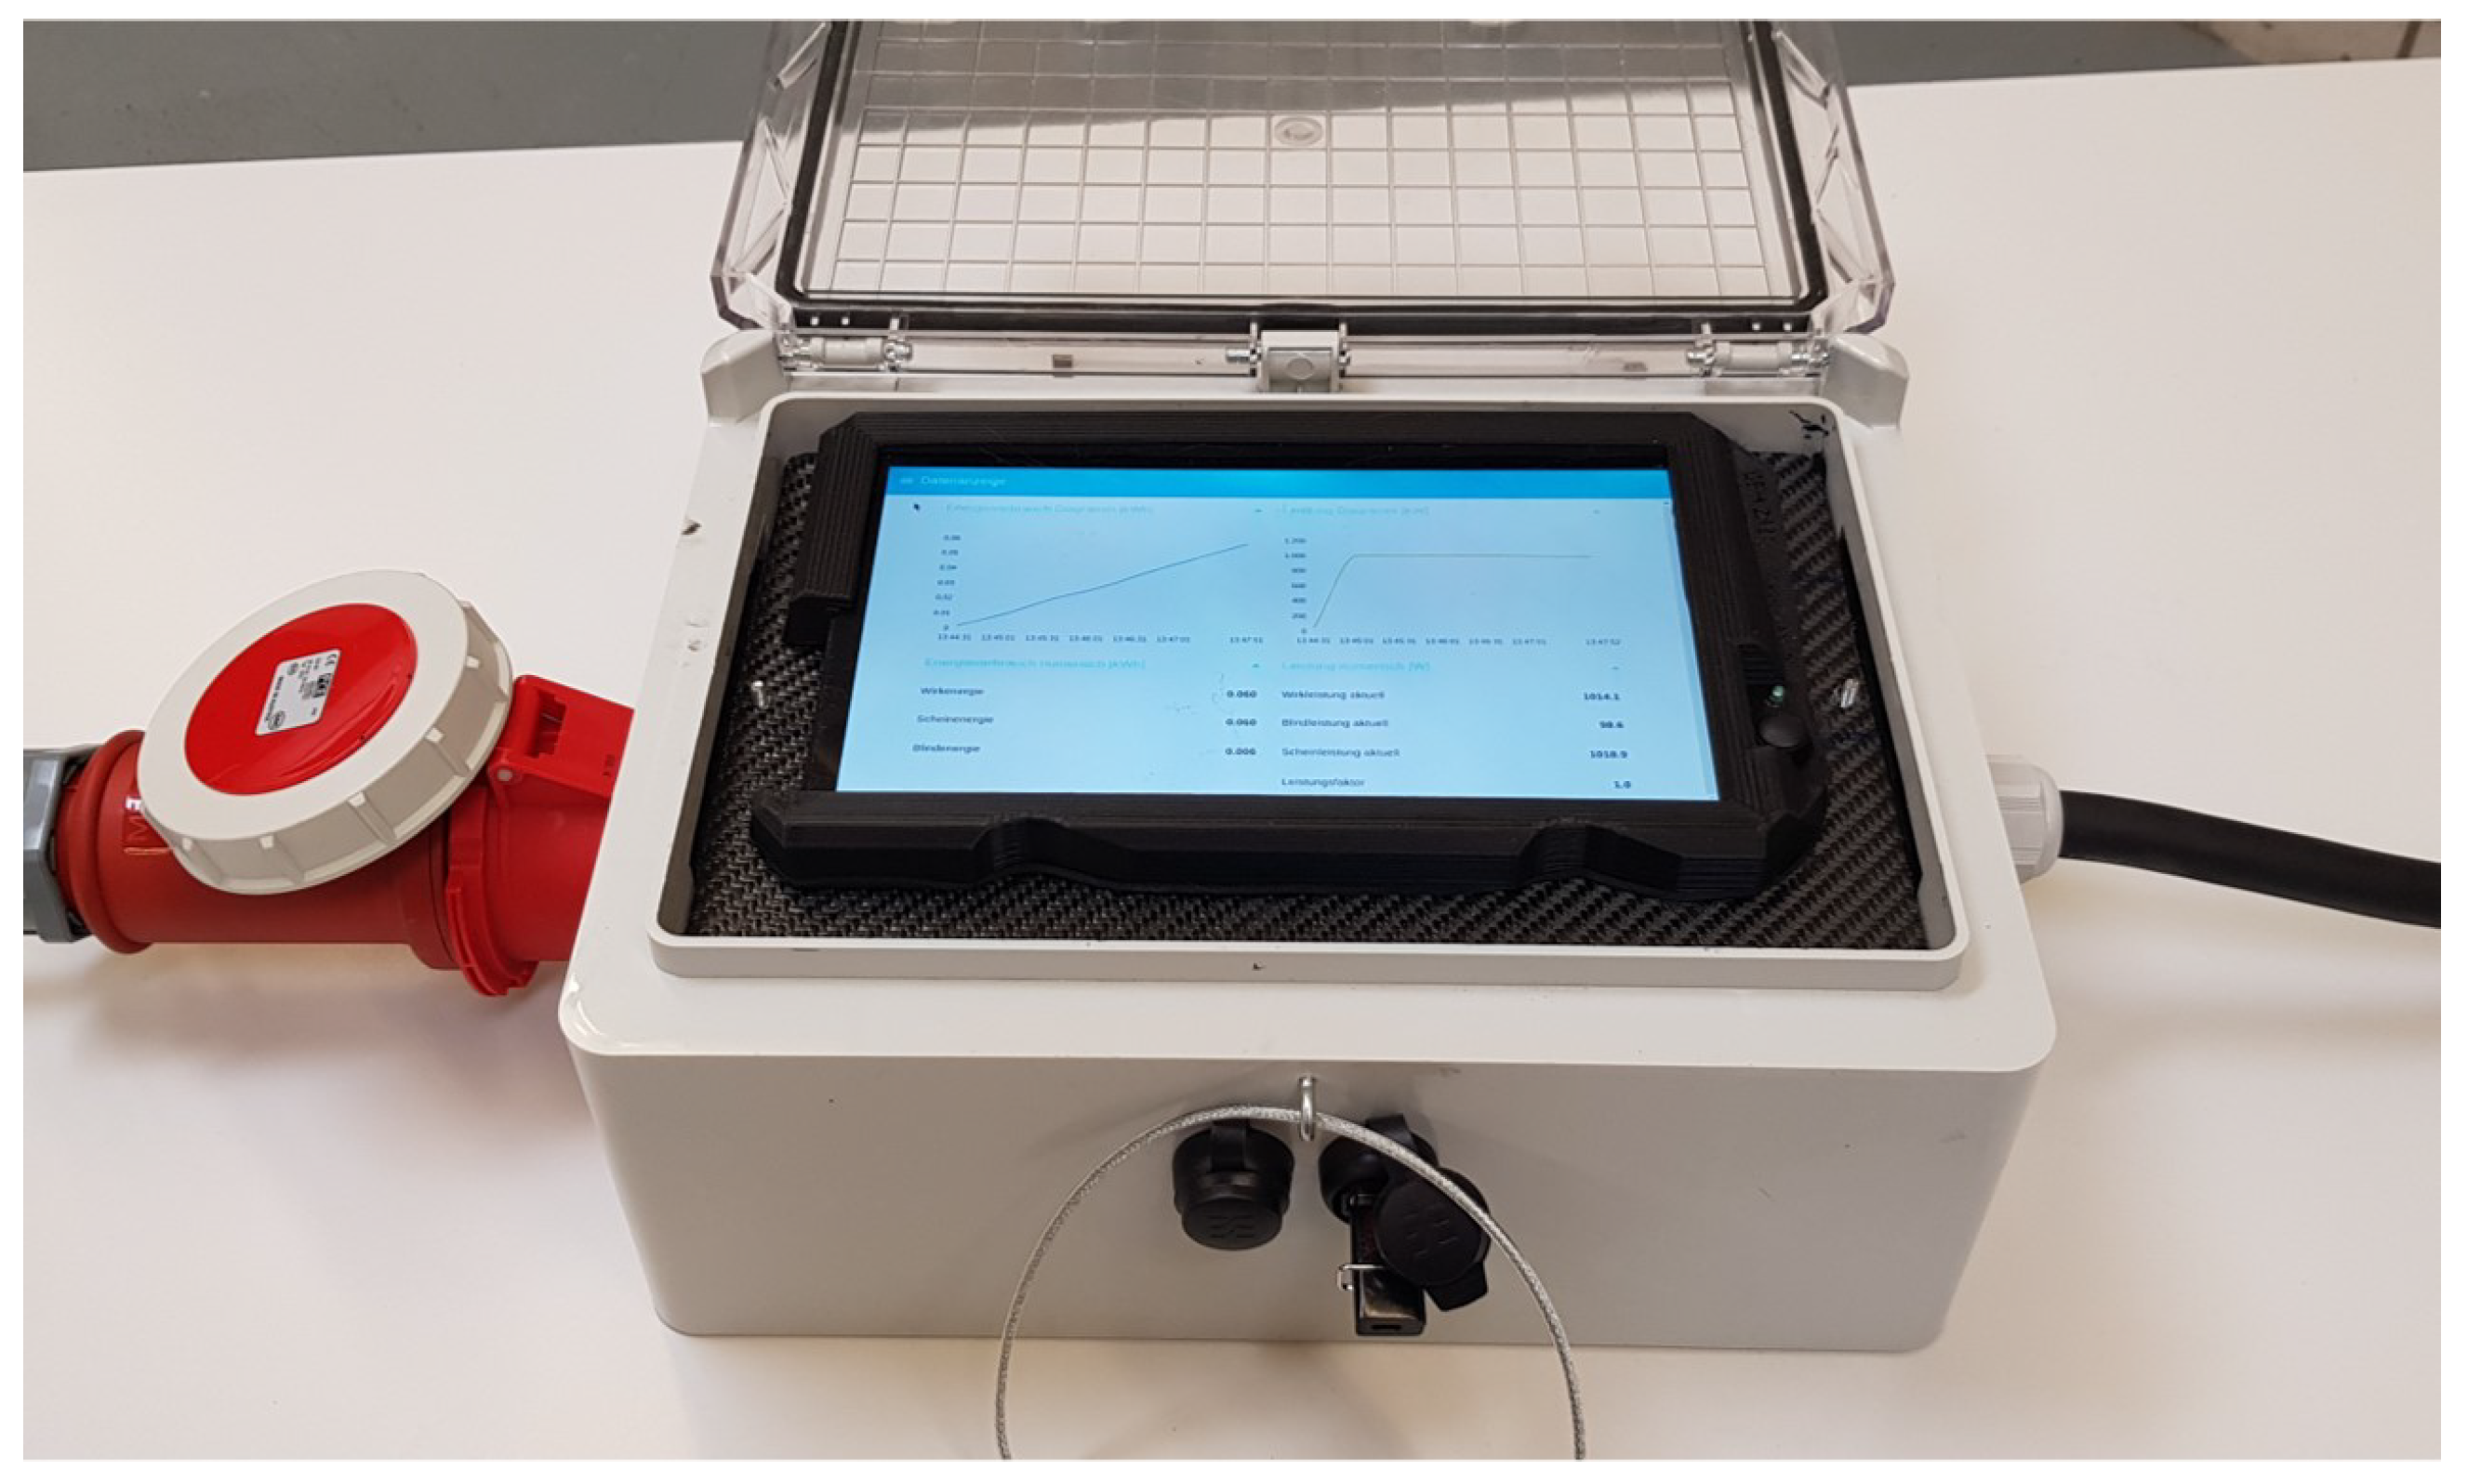
The charged energy is measured by a Sinus 85 S0 [9] from the active power and is stored as time dependent data with the help of an Arduino nano and a Raspberry Pi. A self-developed energy measuring box is used for this, see Figure 3.
The results of the developed measuring box are aligned with a pq-measuring box as well as with a LMG671 professional power measurement device for selected measurements to ensure the data quality. More details are given in [10].
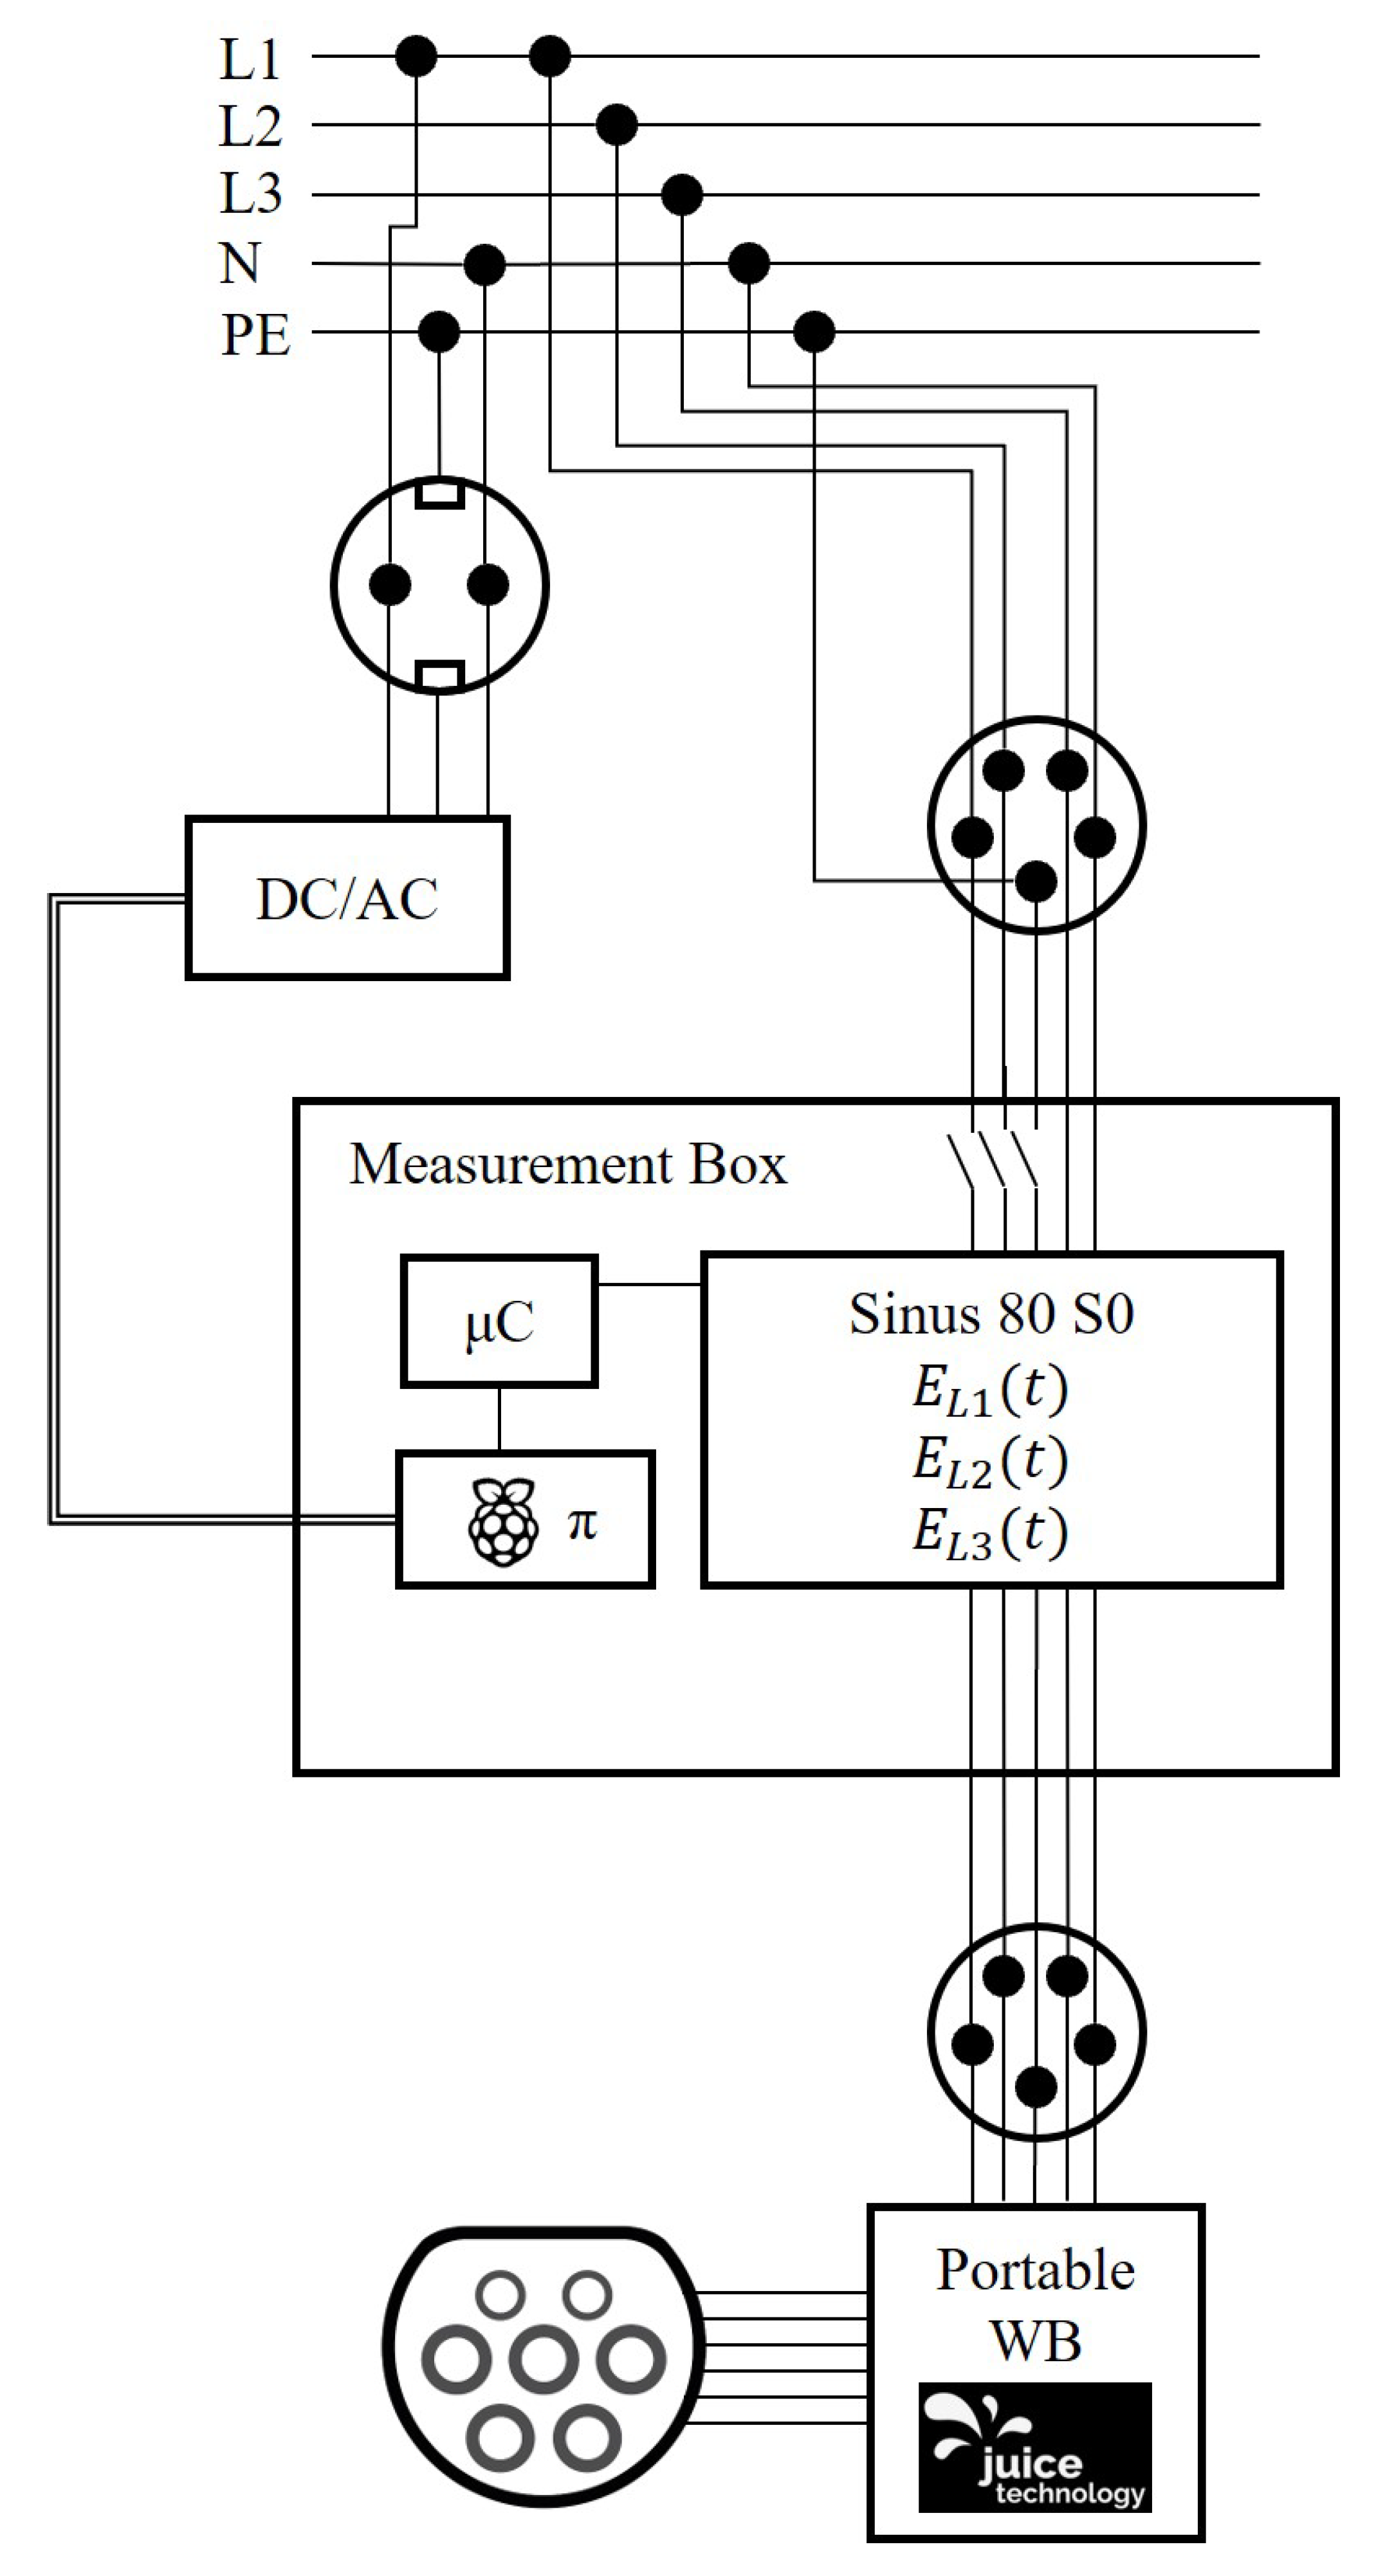
Figure 4 provides an overview of the measurement system used to determine the charged energy. The power lines of the developed measuring box are connected to the mains with a CEE32 plug. The used Raspberry Pi is in addition connected over an AC/DC converter to the mains to ensure that the control and data recording itself does not affect the measurement results. The vehicles are charged with a juice booster portable wallbox (WB) that can vary the charging current from 6 A to 32 A [11]. The WB is also connected to the measuring box using a CEE32 plug.
The box illustrates the sum charged active energy of all phases E C and the live charging power P C on a display. Besides the active energy, information about the reactive energy is given in the same way.
To determine the charging and the drivetrain efficiency in the WLTC in addition CAN data of the vehicles is used. Both vehicles support a battery voltage U B and a battery current I B signal which is used to calculate the battery power flow P B .
P B = U B · I B
Integration can then be used to calculate the energy in- and outputs E B for the battery system, analogue to Equation (1).
The charging efficiency is calculated using the battery energy E B as well as the charged energy E C .
η C = E B E C
The charging losses can be determined with the help of the charging efficiency η C and the charged energy E C .
P L C = E C · ( 1 η C )
The efficiency of the entire vehicle drive in the individual sections of the WLTC and the combined cycle are calculated analogously to Equation (3). The denominator of this equation then does not comprise the recharged energy E C but the roller energy E δ (compare Equation (1)) balanced by the roller dynamometer.
η D = E B E δ
The vehicle drive losses can be calculated analogously to (4) using η D and E δ .
To evaluate the following results, it is important to know the accuracies of the measuring instruments used. For the following results, electrical and mechanical powers and energies are calculated. These data are based on the measurement of currents, voltages, velocities as well as forces. The lowest accuracy is achieved by the indirect current measurement (current clamps) with which the developed measuring box was calibrated, the accuracy to the measured value results in ±1–2% depending on the current strength as well as the occurring frequency. The voltage measurement provides an accuracy of at least ±0.7%. The accuracy of the force measurement in the chassis dynamometer is ±0.1% on the measured value as well as ±0.1 km/h accuracy in the speed determination. Further uncertainties in the measurements made lie in the complex measurement system. Examples are the condition of the tires or the temperature influence on components such as the battery system. It is not possible to break down the resulting measurement uncertainty of all these influencing factors.

3. Results

The main goals of the WLTC measurements taken are at first to compare the results with the official vehicle data given for both vehicles, see Table 3. Further for the Kia e-Niro a detailed insight in the energy consumption and drive efficiency is given in the separate sections of the WLTC. The charging losses are presented in detail and in dependency of the number of used phases and different charging currents. Finally, the impact on CO 2 emissions of unfavorable charging behavior compared to ideal charging behavior is presented.

3.1. WLTC Energy Consumption

Table 4 shows the energy consumption of both vehicles in the WLTC with the maximal charging power of 11 kW for the Kia and 7.3 kW for the VW. The energy consumption for the Kia is 19.34 kWh/100 km and for the VW it is 18.4 kWh/100 km. The needed battery energy E B is 3.93 kWh for the Kia and 3.58 kWh for the VW. Using the net capacities from Table 3 a range of 379.4 km and 208.3 km results for the Kia and the VW. The energy consumption without charging losses results in 16.9 kWh/100 km for the Kia and 15.36 kWh/100 km for the VW e-up!.
It is noticeable that these values are higher to those from the OEM specification. Table 5 shows that the Kia has 21.6% additional energy consumption. The VW consumes 44.9% more than presented in the specification.
Possible reasons for this additional energy consumption are:
  • The test vehicles are not new vehicles. Mileage at the time of testing is ≈30,000 km for the Kia and ≈5000 km for the VW.
  • The vehicles are not preconditioned to a target temperature. Both vehicles are tested at room temperature between 21 and 23 °C.
  • The vehicles setting is not modified further. For example, the tire pressure was not increased above the factory specifications.
  • A different charging technology is used for OEM data which is not known (e.g., a different vehicle charger).
  • Different resistance factors for rolling resistance and air drag are used for to determine the OEM data.
It is especially important to understand where these deviations occur in the WLTC measurement. Therefore, the consumption in the WTLC for the Kia is divided into the individual sections and analyzed in detail. Table 6 shows the consumption of the Kia e-Niro with charging losses in the individual segments of the WLTC. In particular, the consumption increases disproportionately and strongly in the section with high speed (“extra high”). In this case, the parameterized resistance values, especially for the aerodynamic drag likely differ to the parameters used in the WLTC measurements to determine the vehicle specification data. The resistance parameters for this study are determined according to UNECE-R83 annex 4a table A4a/3 a result in f 0 = 8.2 N and f 2 = 0.0557 N ( k m / h ) 2 , see [12].
Table 6 presents a slight increase in energy consumption for the “low” section in comparison to the “medium” section. An explanation for this is provided by the calculated drivetrain efficiency in the individual sections using the braking energy of the chassis dynamometer E δ and the consumed energy in the battery system E B , see Equation (5). Table 7 shows the sectioned and total WLTC drivetrain efficiency in% for the Kia e-Niro. The lowest efficiency of 23.12% occurs in the “low” section. The highest efficiency can be found in the “xtra high” section with 77.12%.

3.2. Charging Losses

As described in Section 2.2, the charging losses are recorded over time using a developed measuring box. For this purpose, the total recharged energy is determined with the aid of the time record. The time record enables the charging performance to be checked. Depending on the battery condition (e.g., cell temperatures, cell voltages), this power curve can vary. It is, therefore, important to check this curve to ensure that the results are comparable.
In all charging operations, the battery is charged to 100% before starting a WLTC measurement. After the completion of the drive cycle, the battery is then charged again to 100%. An example data set is shown in Figure 5. The figure shows the charged energy over time after completing a WLTC with the Kia. The portable WB is set to 10 A and all three phases are used for charging here. The absolute energy charged is 4.52 kWh for this charging measurement. The constant slope of the curve shows that the charging power was almost constant at 6.9 kW during the charging process.
Table 8 shows the influence of the used phases as well as the charging current on the charging efficiency. The lowest efficiency is achieved with a low current of 10 A and single-phase charging. This results in a mean efficiency for the charging of 79.58%. The best value is achieved by charging with all three phases at a maximum charging current of 16 A. Here, the charging process achieves an efficiency of 87.21%. The maximum difference between these points is therefore 7.63%. The influence of the current intensity in three-phase charging is minimal, so that, for example, users of a PV-system can adjust the current intensity to solar radiation without noticeable influence on the charging efficiency. However, it should be noted that the minimum charging current for electric vehicles is 6 A, which means that the power of the PV-system should be at least 4.1 kW.
Table 9 combines the mean efficiency from Table 8 with the measured battery consumption in the WLTC sections, using Equation (3). The data reveals that the energy consumption increases significantly, if the vehicle is charged with only 1 phase. In general, it can be shown that also average vehicle speeds > 80 km/h increase energy consumption for this vehicle noticeable. There is an optimum in the energy consumption in the “medium” section. This is in line with the publications about this vehicle which report ranges of more than 500 km in city traffic [13]. Without charging losses, the Kia e-Niro consumes 11.69 kWh/100 km in this section which results in a theoretical range of 547.48 km.
Table 10 shows the energy consumption per 100 km E W L T C depending on the average vehicle speed in the single WLTC sections v ˜ , see Equation (6). These data find the optimum of range and time to destination.
e C = E C v ˜
The created data combines the charged energy with the average speed in the WLTC sections. These data show clearly that low speeds < 20 km/h do cause higher energy and time consumption. This is because the drivetrain normally provides lower efficiencies at low speeds (electric machine and gearbox), also compare Table 9 section “low” and “medium”. A minimum could be found in the “high” section charging with 3 phases. Like many BEVs, the Kia shows its strengths on overland routes. Here, the efficiency of the powertrain is high, the cruising speed is in the medium to high range, and the air drag is still manageable.

3.3. Impact on CO 2 -Emissions

Table 11 shows the CO 2 -emissions due to charging the vehicle with the three charging modes presented. For the creation of the data, it was assumed that charging always takes place with the same charging mode over 100,000 km. According to the Federal Environment Agency, the conversion of 1 kWh of electricity in 2018 in Germany generates an average of 0.471 kg CO 2 [14]. The selected charging modes are intended to represent different scenarios. The 16 A charging with three phases simulates an existing installed WB with the possibility to always charge with the maximum current. Considering the determined efficiencies, this represents the ideal case. From this ideal case, Table 11 shows the resulting absolute and additional emissions depending on the charging mode. The charging mode with 10 A and three phases is also intended to represent a user case with an installed WB, but with slightly reduced charging power. This use case could apply to larger residential complexes or apartment buildings. The effects of reducing the charging current by 6 A are negligible. This is also relevant for PV-charging with varying charging current in this range.

4. Discussion and Outlook

The measurements of the WLTC average energy consumption in this study with the resistance coefficients determined from UNECE-R83 table A4a/3 lead to a significant additional consumption of 21.6% for the Kia e-Niro and 44.9% for the VW e-up!. This is mainly based on a large energy consumption in the “extra high” section of the WLTC. The measured additional consumption is thus on the same level than previously published data, e.g., [3,7]. In addition to larger resistance coefficients other settings such as tire pressure, thermal conditioning of the vehicle or the used charging mode play a role in the WLTC energy consumption measurement as well. Those parameters could not be evaluated in this study. Additionally, both vehicles are used production vehicles which may cause deviations in comparison to the specified data. The WLTC cycle does not represent individual load and velocity profiles. However, the breakdown of consumption into the WLTC sections allows the showing of a trend in drivetrain efficiency and energy consumption for different average speeds. The Kia e-Niro vehicle studied in detail shows significant increasing energy consumption at speeds > 80 km/h. End customers who drive the vehicle largely on highways will thus observe a reduced range, compared to the range in the factory specifications when travelling with high speeds.
A new testing approach is needed to predict the actual vehicle energy consumption for individual speed and load profiles. A possible implementation could be a cycle with varying speed sections, so that these can be arbitrarily weighted to a total energy consumption. This would make it possible to make inferences on the real energy consumption under laboratory conditions (e.g., dry, room temperature, summer tires). Further studies on this are planned.
The average drivetrain efficiency in the WLTC is 63.88% for the Kia e-Niro. Especially at low speeds the efficiency drops significantly below 30%. In the high-speed range efficiency is at a higher level of more than 75%. These results are consistent with the expected efficiency characteristics of an electric drivetrain comprising a permanently excited synchronous machine and a single-speed mechanical transmission.
Furthermore, the results of the AC charging efficiency measurements show that charging with reduced charging current of 10 A instead of 16 A has little negative impact on the charging efficiency, provided that all phases of the charger are used. The charging efficiency is in the range of 83 to 88% for the tested vehicles. Single-phase charging on a vehicle with a three-phase charger (Kia e-Niro) results in a significant efficiency reduction of 7.63% compared with the best point measured with 16 A and the maximal number of phases used.
Over a mileage of 100,000 km, single-phase charging results in additional CO 2 emissions of 1.24 t. This is roughly equivalent to the CO 2 emissions of a round-trip flight from Friedrichshafen to the Canary Islands (≈7000 km). At an electricity price of 30 cents/kWh, this results in additional costs of around EUR 800 compared to best efficiency charging. The additional costs exceed the acquisition costs of a simple WB for three-phase charging up to 16 A. The electrical installation is not included in this consideration.
These considerations in this paper open up the question of what efficiency potential lies in the vehicle charger itself? To what extent the peak efficiency can be improved by a new design or using more efficient components or control strategies?
Another question is whether the charger or the charging modes should be put into efficiency classes in order to increase transparency for the end customer and sharpen sensitivity to the energy consumption of electric vehicles. A comparison with a common consumer in the household sector shows this need. An average refrigerator in energy efficiency class A+ consumes around 330 kWh of electrical energy per year. In comparison, a refrigerator with efficiency class C requires about 90 kWh more. With an annual mileage of 20,000 km (100,000 km in 5 years), the Kia e-Niro requires at best 3.868 kWh of energy per year in the combined WLTC. With single-phase charging, this vehicle requires 295 kWh more energy per year. This results in a savings potential that is about three times greater than in the refrigerator calculation example. Today refrigerators are already classified into energy efficiency levels.
From this point of view, a classification under energy efficiency aspects of vehicle chargers or charging modes could make sense in order to promote improvements and innovations in this area. An exciting comparison could also be provided by measuring the efficiency of a DC-WB with moderate charging power. Interesting would also be investigations concerning the discharge of batteries for instance during prolonged parking.
Before pursuing these suggestions further, it is necessary to measure additional vehicles to corroborate the measurement data in this initial study. The research group is already planning further measurements of e-vehicles.

Author Contributions

Conceptualization and methodology, B.R., A.K. (Anja Konzept), A.K. (André Kaufmann), R.S. and D.E.; development measurement technology, A.K. (André Kaufmann) and D.E.; measurements, B.R., A.K. (Anja Konzept) and A.K. (André Kaufmann); measurement result evaluation, B.R., A.K. (Anja Konzept) and A.K. (André Kaufmann); writing—original draft preparation, B.R. and A.K. Anja Konzept); writing—review and editing, A.K. (André Kaufmann), R.S. and D.E. All authors have read and agreed to the published version of the manuscript.

Funding

This research received no external funding.

Institutional Review Board Statement

Not applicable.

Informed Consent Statement

Not applicable.

Data Availability Statement

Exclude this statement.

Conflicts of Interest

The authors declare no conflict of interest.

Abbreviations

The following abbreviations are used in this manuscript:
ACAlternating Current
BEVBattery-electric vehicle
DCDirect current
MYModel Year
OEMOriginal equipment manufacturer
PVPhotovoltaic
SOCState of charge
WBWallbox
WLTPWorldwide harmonized Light vehicles Test Procedure
WLTCWorldwide harmonized Light vehicles Test Cycle

References

  1. Bisenius, A.; Groß, J.; Hackmann, M.; Schenk, J.; Stanek, R. The CO2 footprint in the lifecycle of passenger cars. A comparison of hybrid, plug-in and electric vehicles with a detailed consideration of battery production and the country specific energy mix. In Proceedings of the 42th Internationale Wiener Motorensymposium, Virtual (Online). Wien, Austria, 29–30 April 2021. [Google Scholar]
  2. United Nations. Worldwide harmonized Light vehicles Test Procedure. In ECE/TRANS/180/Add.15; Addendum 15; United Nations: New York, NY, USA, 2014. [Google Scholar]
  3. Stromverbrauch Elektroautos: Aktuelle Modelle im ADAC Test. Available online: https://www.adac.de/rund-ums-fahrzeug/tests/elektromobilitaet/stromverbrauch-elektroautos-adac-test/ (accessed on 28 July 2021).
  4. ADAC Weist auf Teils Erhebliche Ladeverluste Hin. Available online: https://www.electrive.net/2020/07/23/ladeverluste-laut-adac-oft-hoeher-als-angegeben/ (accessed on 28 July 2021).
  5. Hayes, J.; Goodarzi, G. Electric Powertrain, 1st ed.; John Wiley & Sons Ltd.: New York, NY, USA, 2018; pp. 412–440. [Google Scholar]
  6. Ladeeinrichtung Anmelden. Available online: https://www.netze-bw.de/netzanschluss/ladeeinrichtung-anmelden (accessed on 28 July 2021).
  7. Apostolaki-Oisifidou, E.; Codani, P.; Kempton, W. Measurement of power loss during electric vehicle charging and discharging. Energy 2017, 127, 730–742. [Google Scholar] [CrossRef]
  8. Reick, B.; Kaufmann, A.; Engelmann, D. Test Procedure Proposal for EV Power Measurement on Dynamometers. In Proceedings of the International Conference on Vehicles and Engines, Capri, Italy, 13–15 September 2021. [Google Scholar]
  9. Ladeeinrichtung Anmelden. Available online: https://www.puo-gbr-shop.de/online-shop/digitale-energiezaehler/drehstromzaehler-sinus/850/elektronischer-drehstromzaehler-mit-mid-3x230/400v-5-85-a-mit-lcd-display (accessed on 28 August 2021).
  10. Bannholzer, F.; Engelmann, D. Entwicklung einer Messbox für die Aufzeichnung von Energieverbrauch und Ladeleistung während des Ladevorgangs eines E-Fahrzeuges. Bachelor’s Thesis, Berner Fachhochschule, Biel, Switzerland, 2021. [Google Scholar]
  11. Ladeeinrichtung Anmelden. Available online: https://www.juice-world.com/juice-technology (accessed on 15 September 2021).
  12. United Nations. Einheitliche Bedingungen für die Genehmigung der Fahrzeuge hinsichtlich der Emission von Schadstoffen aus dem Motor entsprechend den Kraftstofferfordernissen des Motors. In UN ECE R38; Appendix 4a; United Nations: New York, NY, USA, 2015. [Google Scholar]
  13. Test: Kia e-Niro mit 64-kWh-Batterie. Available online: https://www.heise.de/autos/artikel/Test-Kia-e-Niro-mit-64-kWh-Batterie-4456326.html?seite=all (accessed on 28 September 2021).
  14. Strom-und Wärmeversorgung in Zahlen. Available online: https://www.umweltbundesamt.de/themen/klima-energie/energieversorgung/strom-waermeversorgung-in-zahlen (accessed on 28 September 2021).
Figure 1. WLTC speed profile v as a function of the distance driven s (VW e-Up! data).
Vehicles 03 00043 g001
Figure 2. Kia e-Niro on the chassis dynamometer at Berner university of applied sciences.
Vehicles 03 00043 g002
Figure 3. Developed measuring box [10].
Vehicles 03 00043 g003
Figure 4. General overview measuring system.
Vehicles 03 00043 g004
Figure 5. Accessed charged energy data after completing a WLTC.
Vehicles 03 00043 g005
Table 1. Travelled distance, average speed and time period in the WLTC sections.
WLTC SectionDistance in kmDistance Share in %Time in sTime Share in %Average Speed in km/h
low3.09513.358932.718.9
medium4.75620.443324.139.5
high7.15830.845525.256.6
extra high8.25435.532317.992
total23.262100180010046.5
Table 2. E δ comparison of the measured WLTCs with the Kia.
WLTC Number E δ in kWhDifference in %
12.5200
22.5240.17
32.511−0.33
42.517−0.11
Table 3. Relevant vehicle data.
ParameterKia e-NiroVW e-Up
Battery net energy in kWh6432
Maximal AC charge power in kW11 (3 phases)7.3 (2 phases)
E W L T C energy consumption in kWh/100 km15.912.7
WLTC range in km455260
Table 4. WLTP energy consumption with maximal charge power.
ParameterKia e-NiroVW e-Up
Charge current in A1616
Used phases32
Charging Efficiency in %87.2183.75
determined according to Section 3.2
E W L T C in kWh/100 km19.3418.4
E B in kWh3.933.58
WLTC range in km379.4208.3
Table 5. Additional energy consumption compared to the factory specification.
ParameterKia e-NiroVW e-Up
Additional consumption compared
to factory specification in %21.644.9
Table 6. Sectioned WLTP energy consumption data for the Kia e-Niro (charged with three phases and 16 A).
ParameterLowMediumHighExtra High
E W L T C in kWh/100 km13.5413.4116.4127.55
Table 7. Sectioned and total WLTP drivetrain efficiency in% for the Kia e-Niro.
ParameterTotalLowMediumHighExtra High
η D in %63.8823.1243.5663.9377.12
Table 8. Charging efficiency in% of the Kia e-Niro.
Parameter10 A16 A
1 phase79.5880.32
3 phases86.9887.21
Table 9. WLTP energy consumption in kWh/100 km sectioned in dependence of different charging modes for the Kia e-Niro.
Charging Mode P C in kWLowMediumHighExtra High
16 A, 3 phases1113.5413.4116.4127.55
10 A, 3 phases6.913.5813.4416.4627.63
10 A, 1 phase2.314.8414.6917.9930.19
Table 10. WLTP energy consumption in k W · h 2 100 · k m 2 sectioned in dependence of different charging modes for the Kia e-Niro.
Charging Mode P C in kWLowMediumHighExtra High
16 A, 3 phases110.720.340.290.3
10 A, 3 phases6.90.720.340.290.3
10 A, 1 phase2.30.790.370.320.33
Table 11. Absolute and additional CO 2 -emissions in t/100,000 km sectioned in dependence of different charging modes for the Kia e-Niro referred to the optimal mode with 16 A and 3 phases.
Charging ModeLowMediumHighExtra High
16 A, 3 phases6.386.317.7312.98
10 A, 3 phases+0.02+0.02+0.02+0.03
10 A, 1 phase+0.6+0.61+0.74+1.24
Publisher’s Note: MDPI stays neutral with regard to jurisdictional claims in published maps and institutional affiliations.

