1. Introduction
Driving simulators are important tools in automotive development. They are sufficient for investigations on drivers’ behavior under controlled conditions [
1]. Thus, studies can be conducted in a reproducible and safe environment. Driving simulators can roughly be divided into static driving simulators, dynamic driving simulators without a translational motion system and dynamic driving simulators with a translational motion system. While it is not possible to simulate acceleration acting on the driver in a static driving simulator, dynamic driving simulators use their motion system with several degrees of freedom to apply acceleration forces on the driver [
2] (pp. 8–13).
Dynamic driving simulators have one thing in common: the actuators must be controlled in such a way that the test subject perceives a desired vestibular acceleration. For this purpose, so-called motion cueing algorithms (MCA) are used to calculate the control signals from the reference acceleration [
3] (p. 5). In powertrain development, it is of particular interest to precisely reproduce the reference acceleration curve in the driving simulator in order to validly investigate the dynamic effects induced, e.g., by gear shifting or driving-off processes.
In this paper, a motion cueing algorithm is developed which aims to reproduce the reference acceleration as far as possible via tilt coordination. Additionally, the tilt coordination compensates false motion cues resulting from the washout and thus allows a higher washout speed. A similar MCA was presented by Betz at the Driving Simulation Conference 2012 and referred to as the “ideal” MCA [
4,
5] (p. 51). It showed good results in the simulation but still used a low-pass filter, which is difficult to be parametrized. In addition, Betz stated that a high workspace demand is needed. In addition, a subjective evaluation of this ideal MCA has not been conducted yet. In contrast, the MCA proposed in this paper uses a rate limit in combination with a PID gain, which can be parametrized in an optimization environment using human-oriented threshold values. Based on selected qualitative metrics, this new MCA was compared with the classical washout algorithm and the compensation MCA (see
Section 2.1). Furthermore, the subjective evaluation of the proposed MCA was examined. It is of particular interest if the test subjects recognize the high washout rate or if the washout can be completely compensated by tilt coordination.
This study was carried out in the longitudinal dynamic driving simulator “Driveception” at IMS. The Driveception was developed at IMS in order to investigate longitudinal driving maneuvers such as gear shifting and driving-off processes. The translational workspace has a total length of 10 m, and the driver’s cabin can be tilted by a maximum of 25 degrees [
6] (pp. 56–78). For practical use, only tilts up to 20 degrees are used. Further technical specifications can be found in
Table 1.
Since the Driveception was designed to investigate only longitudinal driving maneuvers, maneuvers with lateral dynamics cannot be represented by the motion system. Hence, this study focused on longitudinal motion cueing. Lateral dynamics motion cueing was not considered.
2. Methods
In this section, three state-of-the-art motion cueing algorithms are described. Then, a new motion cueing algorithm is developed. All MCAs are characterized in terms of their functions and limitations.
2.1. State of the Art
2.1.1. Classical Washout Algorithm
A frequently used MCA is the classical washout algorithm [
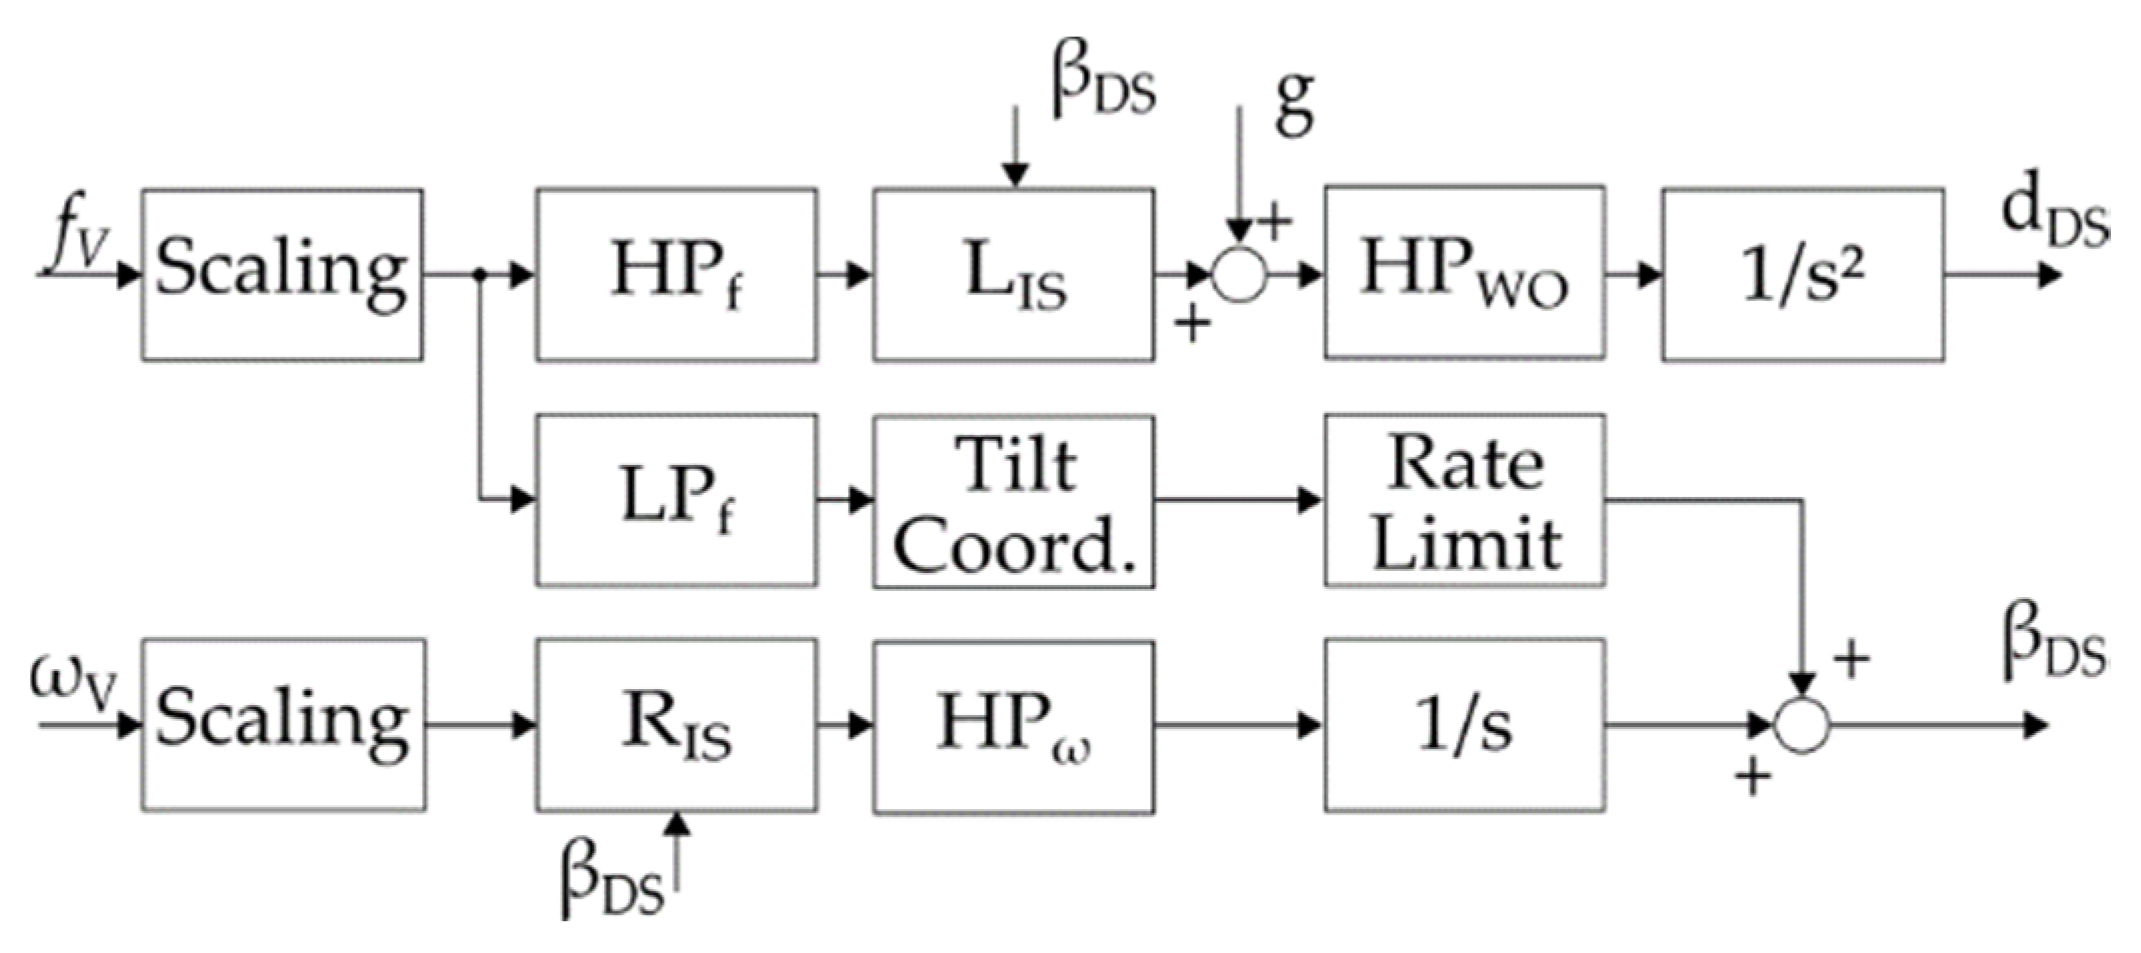
7], from here on referred to as the CWA. Its structure can be seen in
Figure 1. First, the reference acceleration is scaled, i.e., the input acceleration is reduced. This is necessary, since common driving simulators have only a limited workspace. On the basis of literature research and his own investigations, Fischer showed that a scaling factor of 0.5 is a widely used and acceptable value [
3] (pp. 57–58). After scaling, the reference acceleration is divided into a high-frequency component and a low-frequency component by two filters, HP
f and LP
f, respectively [
3] (p. 29). The low-frequency component is represented by tilting the cabin (tilt coordination). Due to the human perception threshold, the rotation rate has to be limited to values between 3°/s [
8] and 6°/s [
9]. The high-frequency component is represented by the translational motion system. Therefore, a second-order high-pass filter, HP
wo, applied to the high frequency path, pulls the simulator back to its neutral position (so-called washout). This allows new acceleration cues without violating workspace limits.
The CWA has some disadvantages. The parametrization of the filters can be difficult, since the filters’ cut-off frequency has no meaning with regard to the human perception threshold [
6] (p. 27). In addition, the washout sometimes produces false motion cues [
3] (p. 65). This results in a mismatch between the visually perceived movement and the vestibular perceived movement and can lead to simulator sickness with symptoms such as nausea, indisposition and headaches [
10] (p. 332).
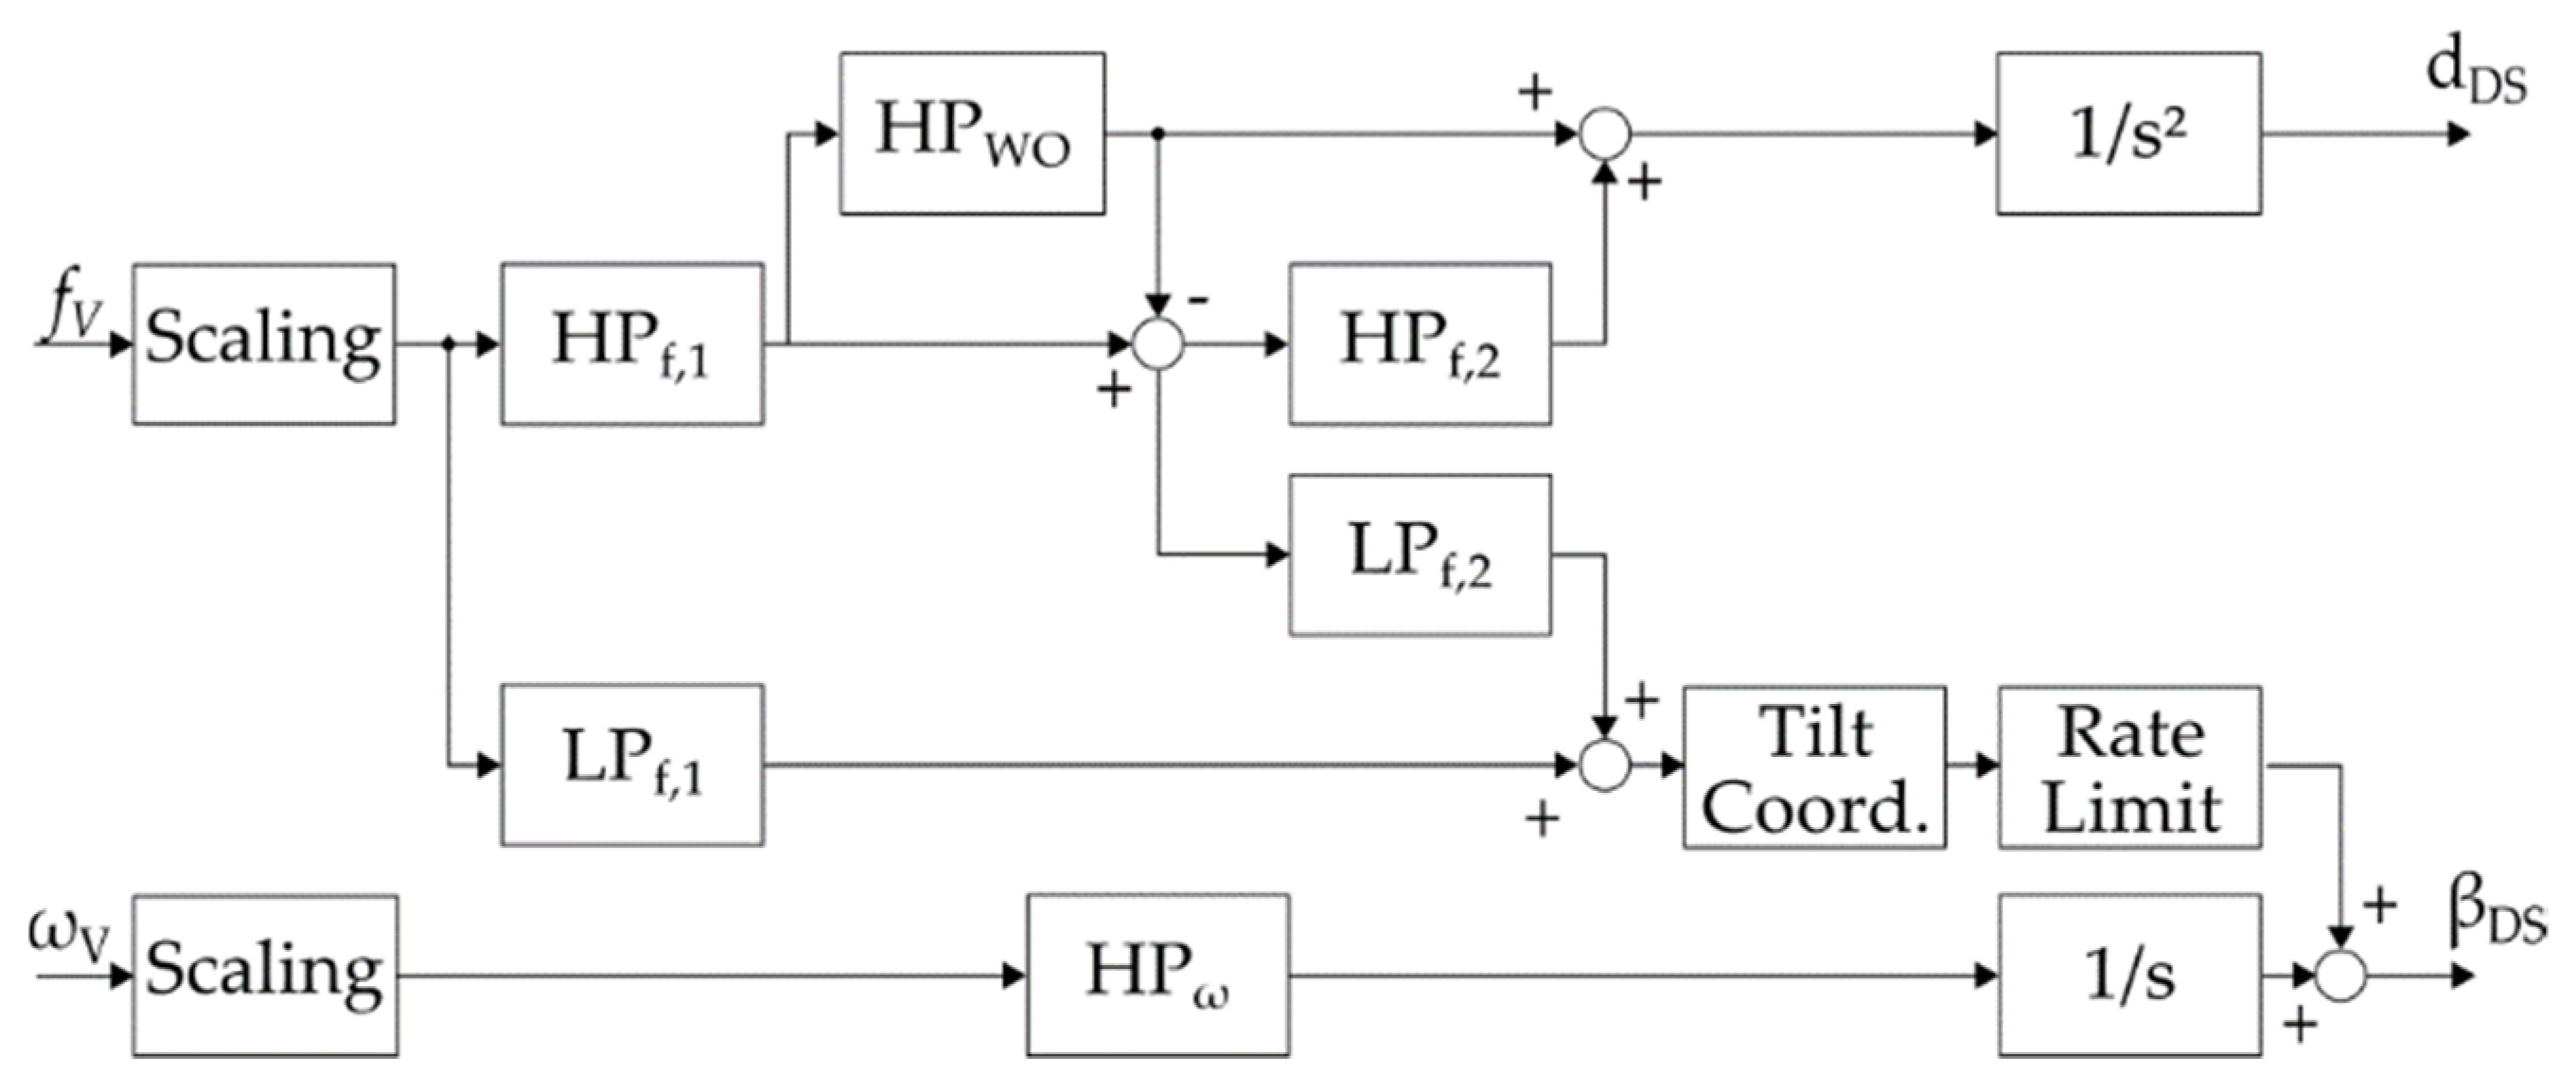
2.1.2. Compensation Motion Cueing Algorithm
The aim of the compensation algorithm is to compensate false cues resulting from the washout. For this purpose, the acceleration component that is lost due to the washout is added to the rotary path and, together with the low-frequency component, transferred to the tilt coordination (see
Figure 2). A disadvantage is the high rotational acceleration, meaning that the acceleration has to be scaled more [
11] (p. 55). According to [
3] (p. 33), an error in the translational acceleration occurs at high tilt angles due to the lack of a coordinate transformation.
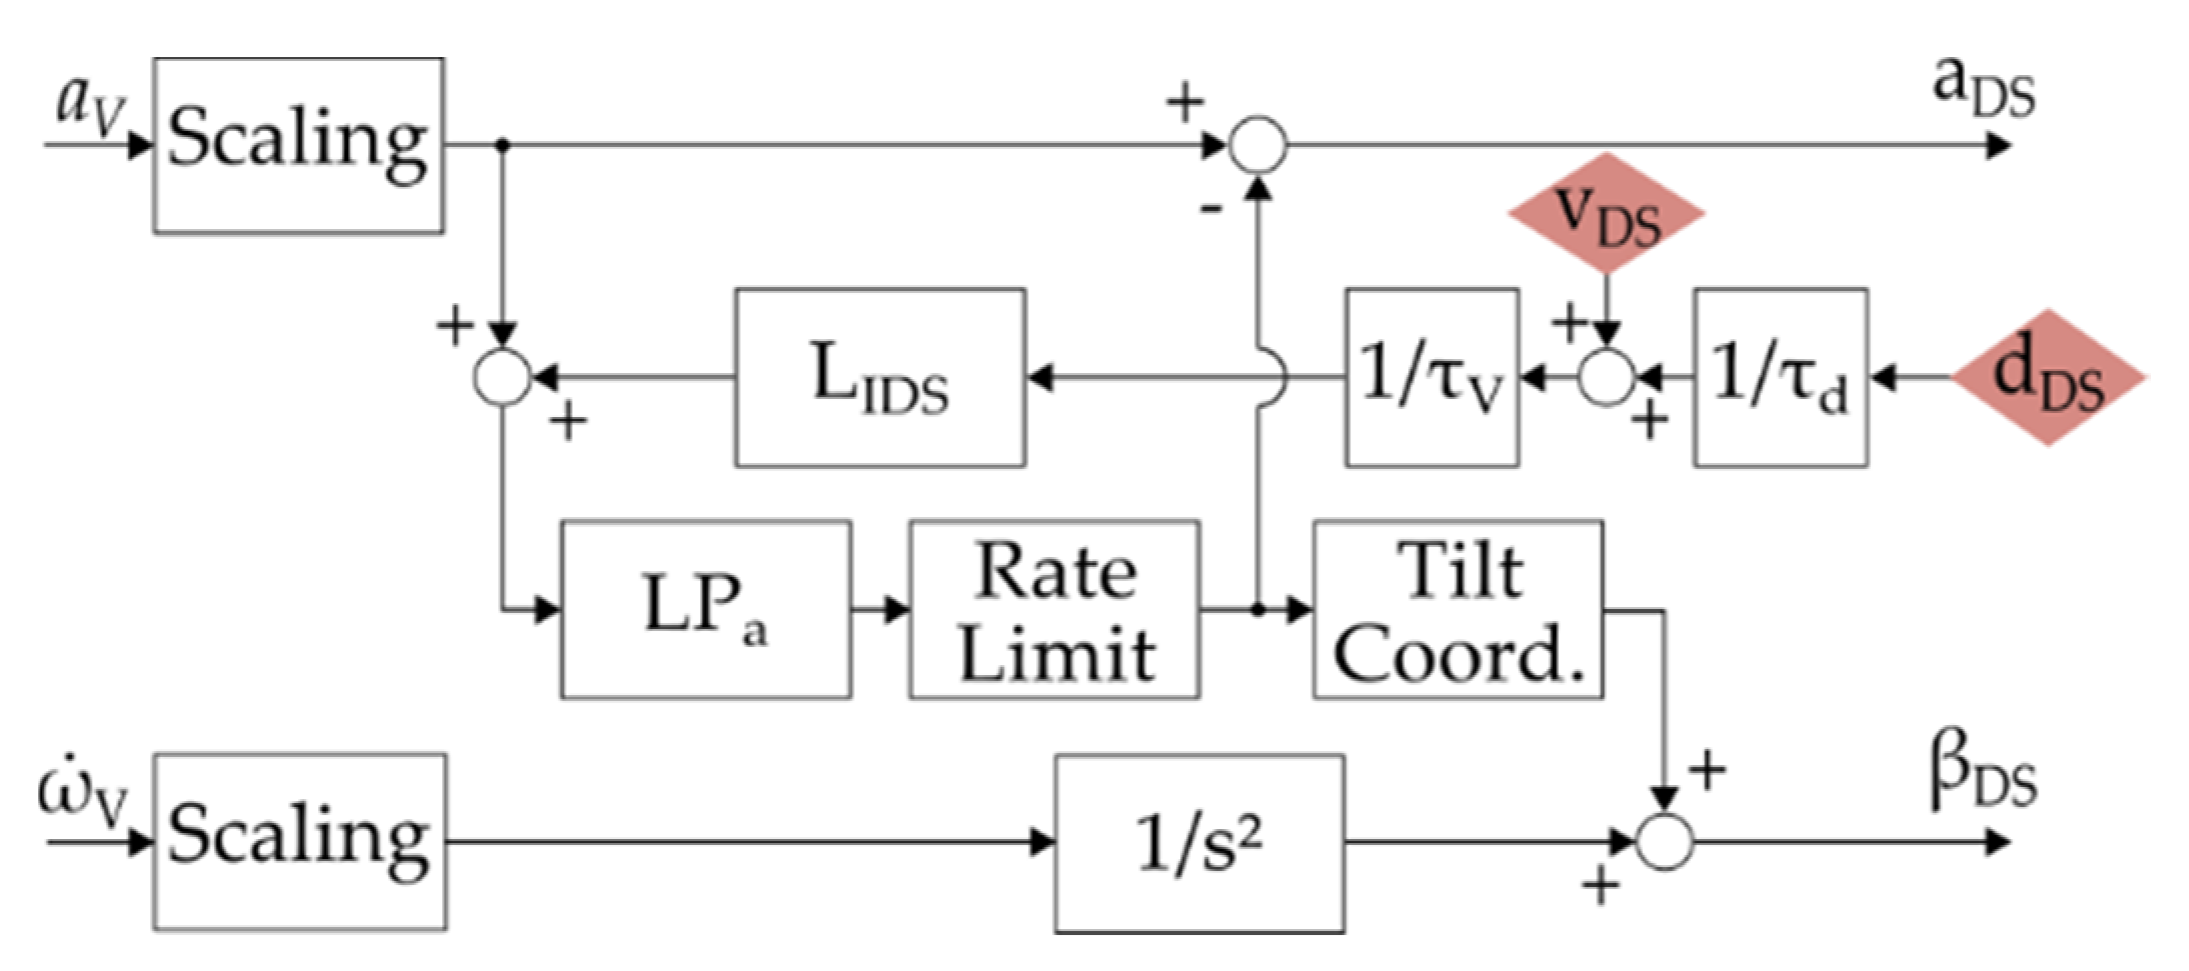
2.1.3. Ideal Motion Cueing Algorithm
The ideal motion cueing algorithm (from here on referred to as the IMCA) was introduced by Betz in 2012 [
4]. Its structure can be seen in
Figure 3. (Instead of the specific forces f
V, the vehicle accelerations a
V are used. These can easily be transformed into each other using the gravitational acceleration [
3] (p. 10).) This MCA tries to map as much of the acceleration as possible to be represented via the tilt coordination. For this purpose, the washout is not realized via the translational path, but with feedback of the translational displacement and speed. The feedback is multiplied by factors
and
, converted back into the inertial system and added to the reference acceleration signal. Further information on this MCA can be found in [
4,
5].
Betz stated that the higher accuracy of this MCA comes with a higher workspace demand [
5] (p. 51). Thus, in certain circumstances, a lower scaling factor has to be chosen. As stated above, another difficulty comes with the parametrization of the low-pass filters’ cut-off frequency and the feedback gains.
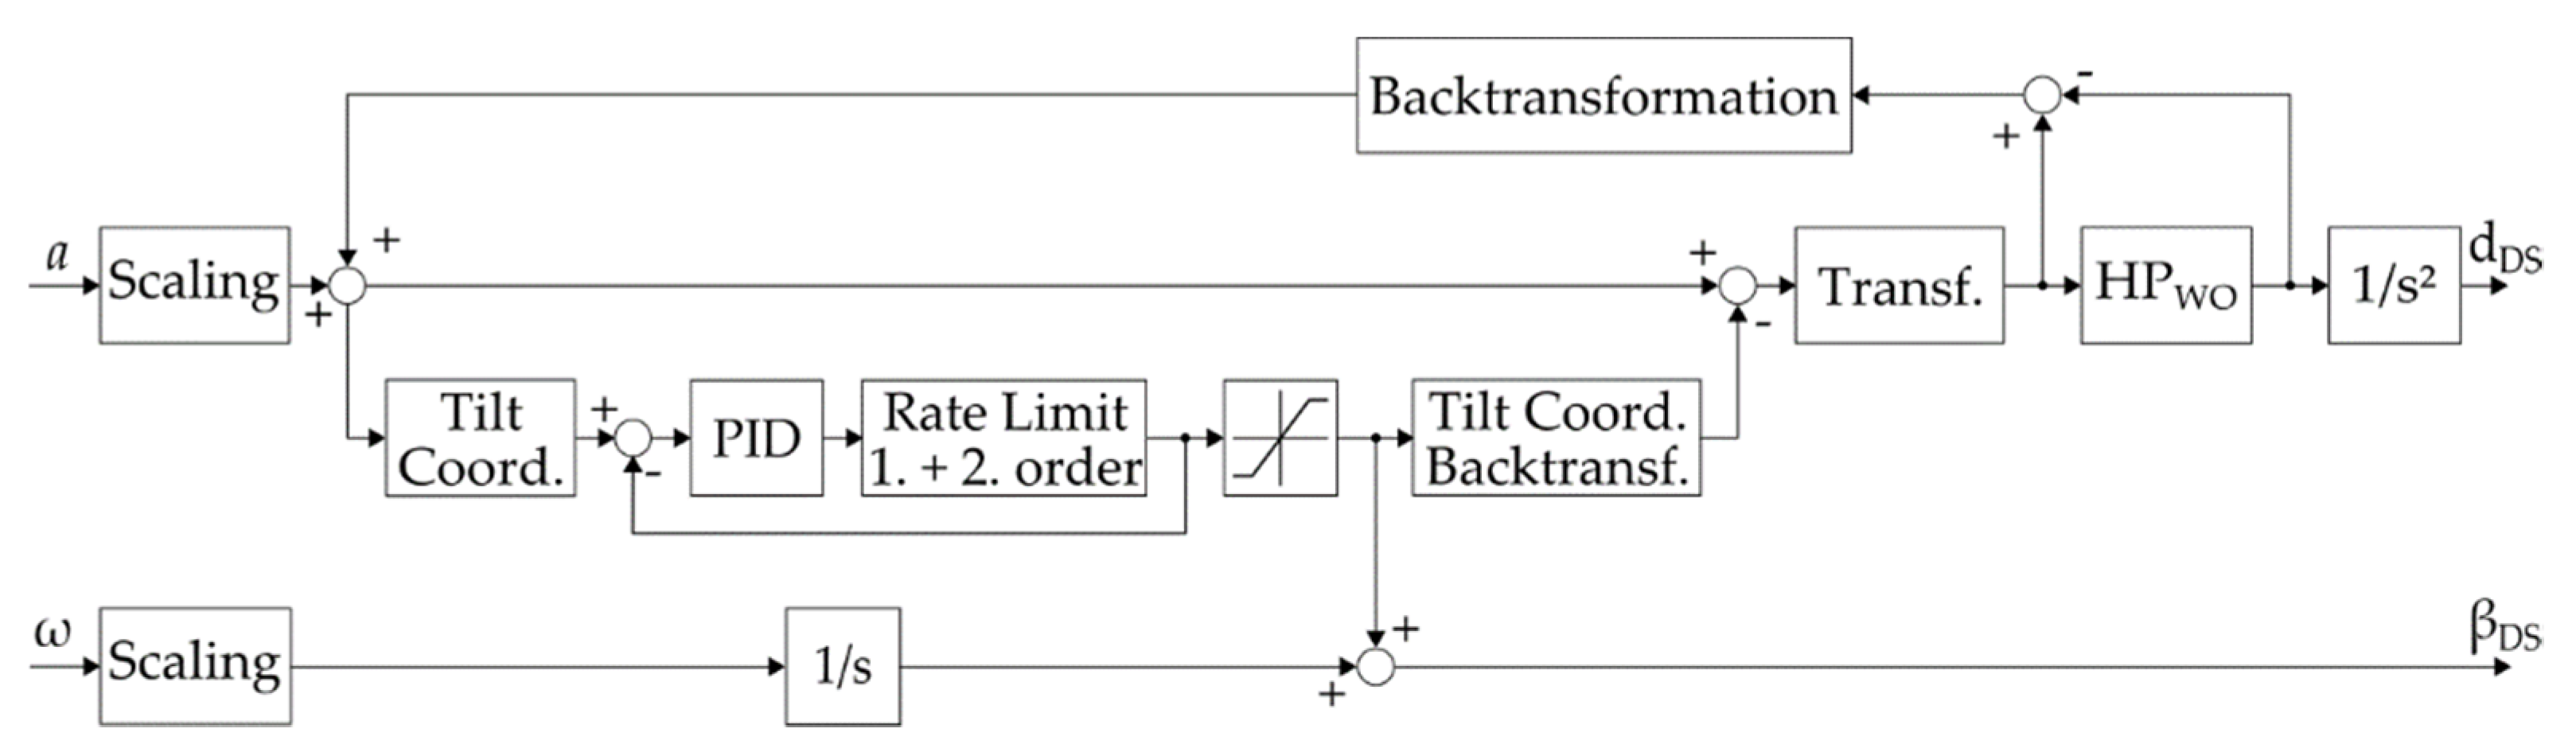
2.2. Ideal Motion Cueing Algorithm
To overcome these difficulties, the IMCA was modified in the following way and will be referred to as the “threshold-based motion cueing algorithm” (TBMCA): Instead of a low-pass filter and a rotation rate limit, a rotation rate limit and a rotation acceleration limit (rate limit 1. + 2. order) are used (see
Figure 4). The rotation rate limit can now be parameterized based solely on the human perception threshold. Since the 2nd-order rotation rate limit does not return to the input signal, a feedback is realized by means of a PID gain. This PID element can be designed iteratively or parameterized using optimization methods.
Washout is realized via a 2nd-order high-pass filter,
, as in the CWA:
As stated by [
11], the transfer function of Equation (1) can be interpreted as a single-mass oscillator. The natural frequency of the washout filter
can be calculated according to [
3] (p. 64) by
with the acceleration perception threshold
and the workspace limit
.
For the TBMCA, a higher value can be chosen for the natural frequency, as the washout is compensated by tilt coordination. A too high value, however, leads to higher tilt rotation and therefore increases the risk of exceeding the maximum tilt rotation rate limit. For our studies, a value of twelve times the natural frequency according to Equation (2) seemed a good compromise between washout speed and compliance with the workspace limits. The PID gain is parametrized iteratively.
3. Performance
The CWA, CMCA and TBMCA were analyzed in a simulation environment in terms of their workspace demand and accuracy by means of two driving maneuvers. These are as follows:
3.1. Maximum Scaling Factor
For both cases, we analyzed the needed workspace demand to perform these maneuvers in our driving simulator. Therefore, we investigated which maximum scaling factor can be chosen without violating the workspace limitations. For reasons of comparability, a scaling factor is considered valid if the maximum absolute difference between the reference acceleration and the MCA output is smaller than 0.15 m/s
2. This was found to be the differential threshold for linear acceleration identified in a field study by [
13] (as cited in [
14] (p. 330)).
The results in
Table 2 show that the valid scaling factors for the CWA drop very fast, since the high inaccuracies violate the requirement related to the maximum absolute difference between the reference acceleration and the MCA output. The CMCA and TBMCA reach nearly the same results. This confirms that the CMCA and the TBMCA are suitable for accurately reproducing the reference acceleration at relatively high scaling factor values.
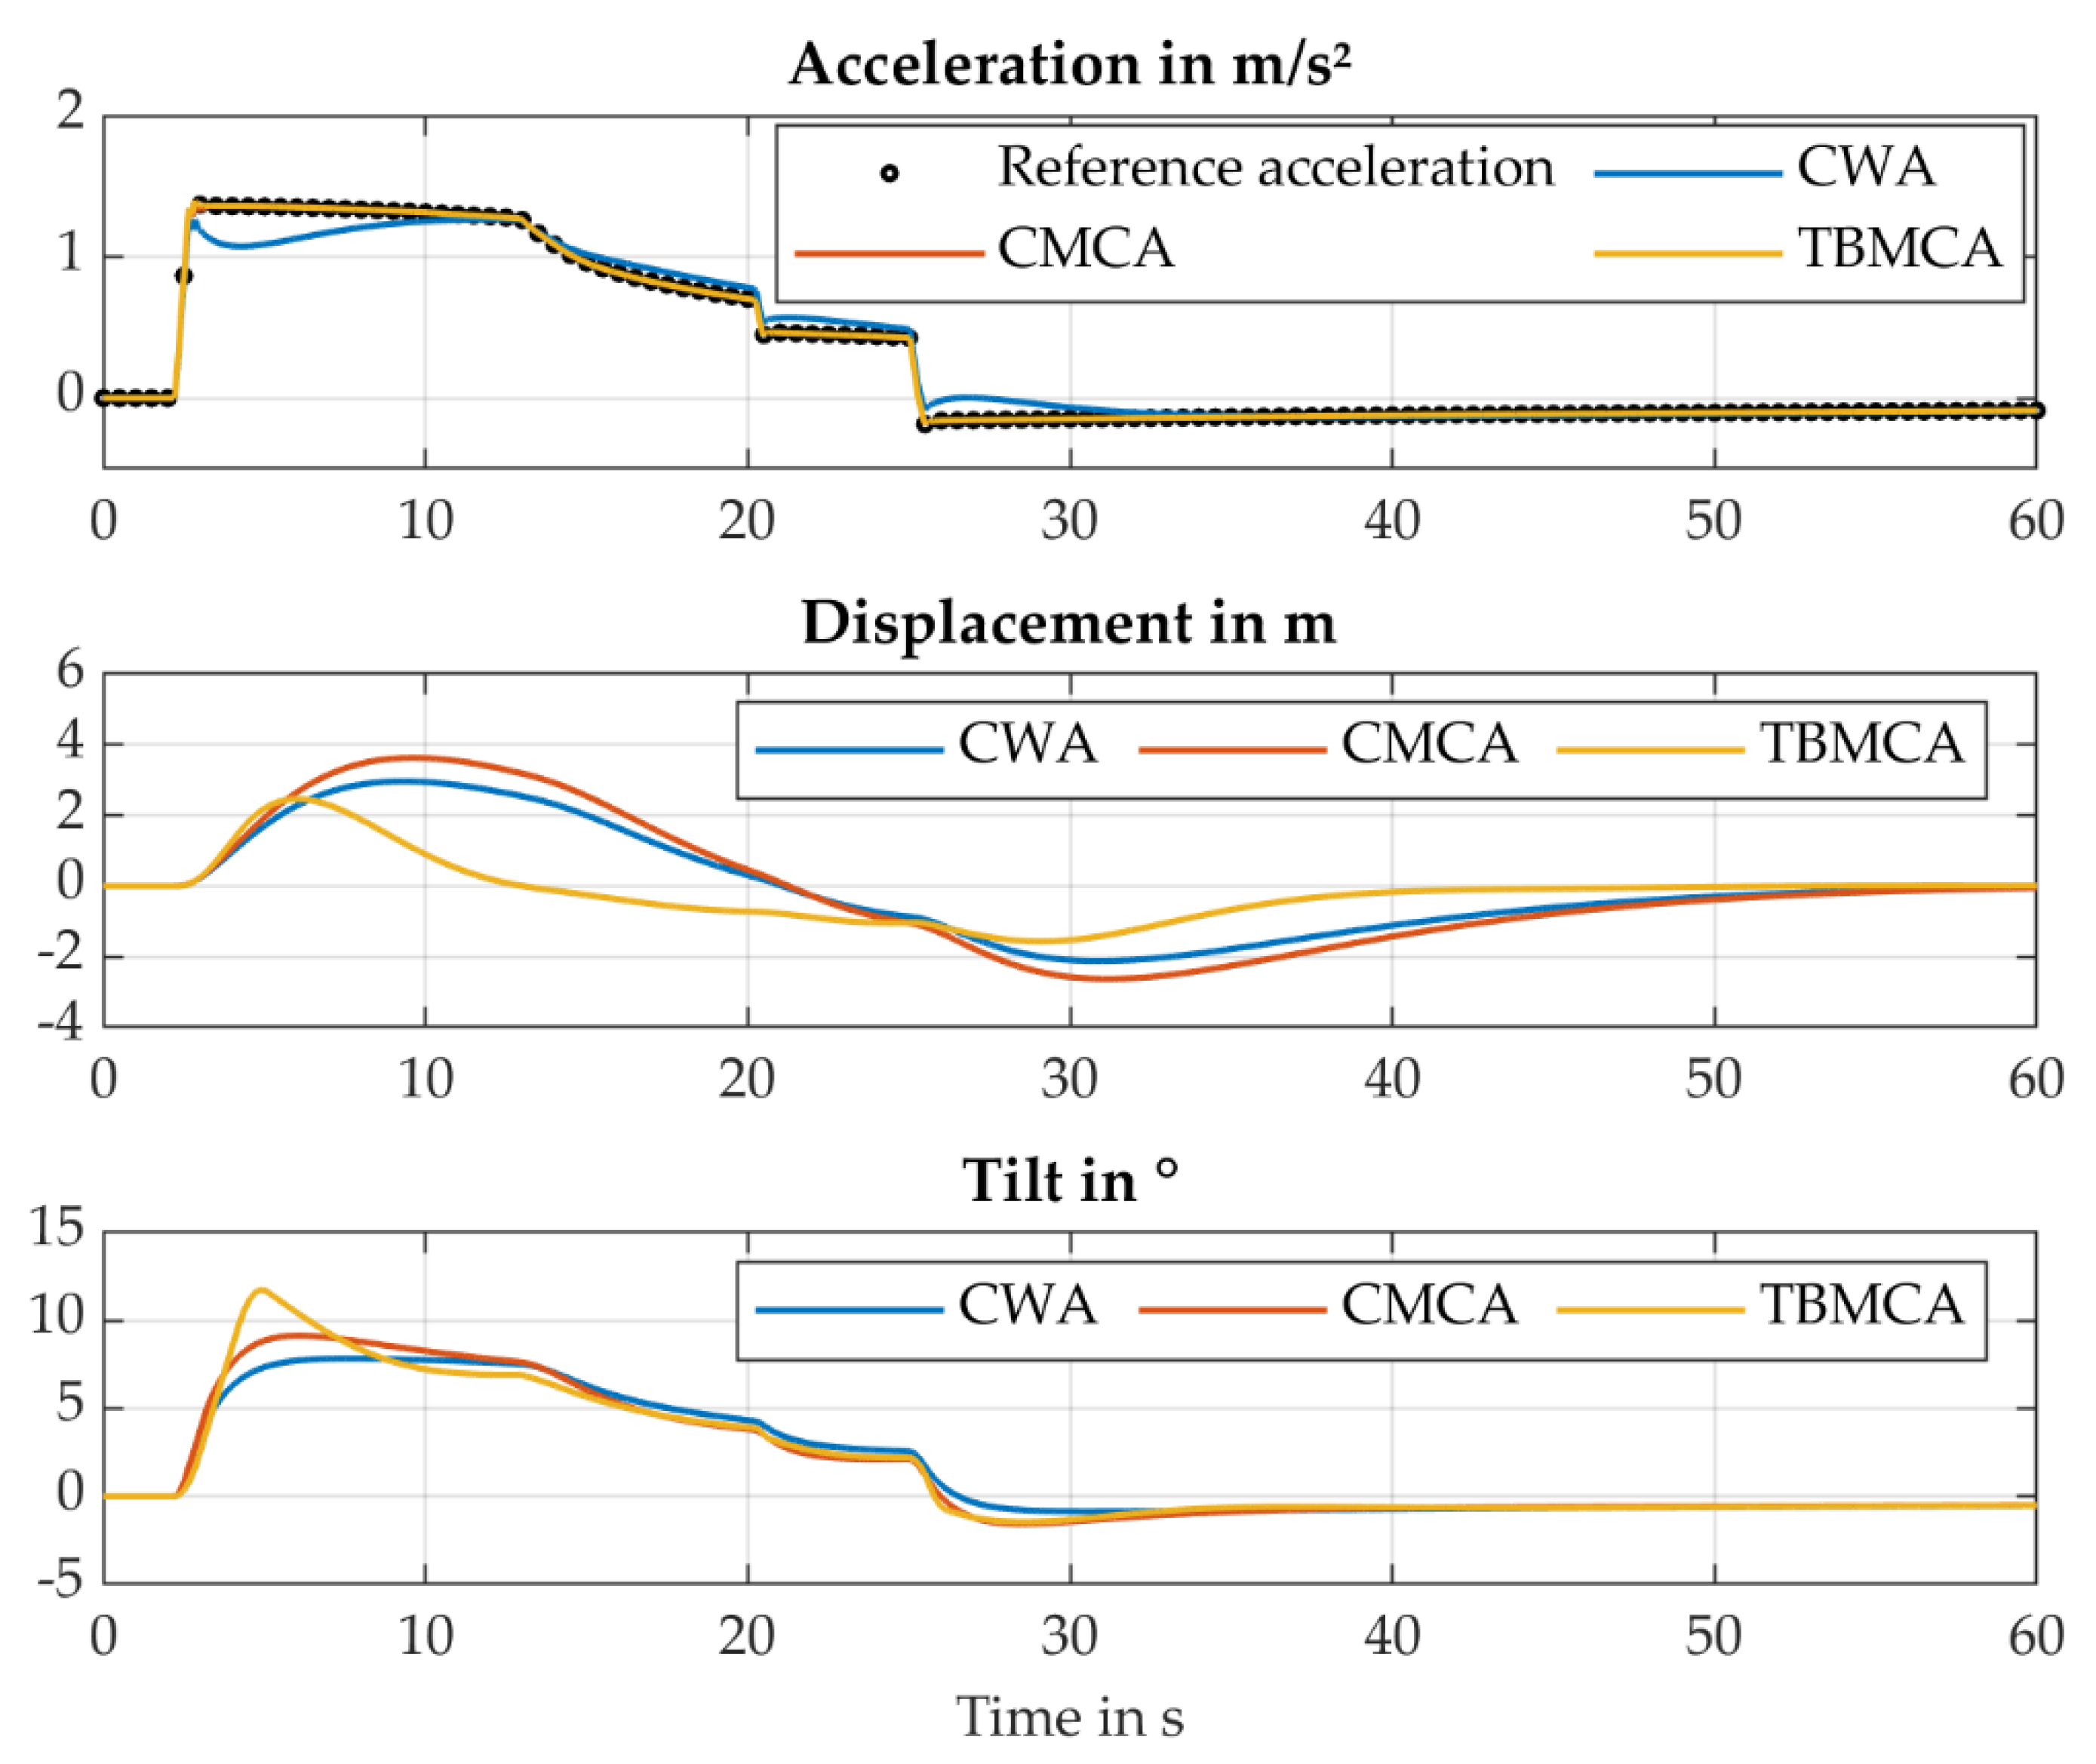
Figure 5 shows the MCA outputs of an acceleration with 50% APP and a scaling factor of 0.5. It can be seen that the output of the TBMCA exactly follows the reference acceleration. The CMCA follows the reference acceleration only with a small error in the beginning. For the CWA, the biggest inaccuracies occur after dynamic changes in the acceleration (3–7 s and 20–30 s).
Regarding the workspace demand, the translational displacement for the TBMCA can be reduced by 22% compared to the CWA and by 37% compared to the CMCA due to the high washout rate. This, on the other hand, comes with a higher maximum tilt angle.
The results for the WLTC are summarized in
Table 3 and discussed later.
3.2. Performance According to Quality Metrics
The MCAs were then compared regarding quantitative quality metrics. As quality metrics, the correlation coefficient (CC, Equation (3)), the absolute difference (AD, Equation (4)) [
15] and the root mean square error (RMSE, Equation (5)) were calculated:
The cross-correlation coefficient CC is defined as the normalized cross-correlation of the reference signal
and the output signal
. It lies in the range between 0 and 1 and indicates a better result if CC is close to 1. The absolute difference AD describes “the ratio of the area of the difference between the two signals divided by the area of the reference signal” [
15]. The RMSE is commonly used to compare data [
16]. For AD and RMSE, a small value is desired.
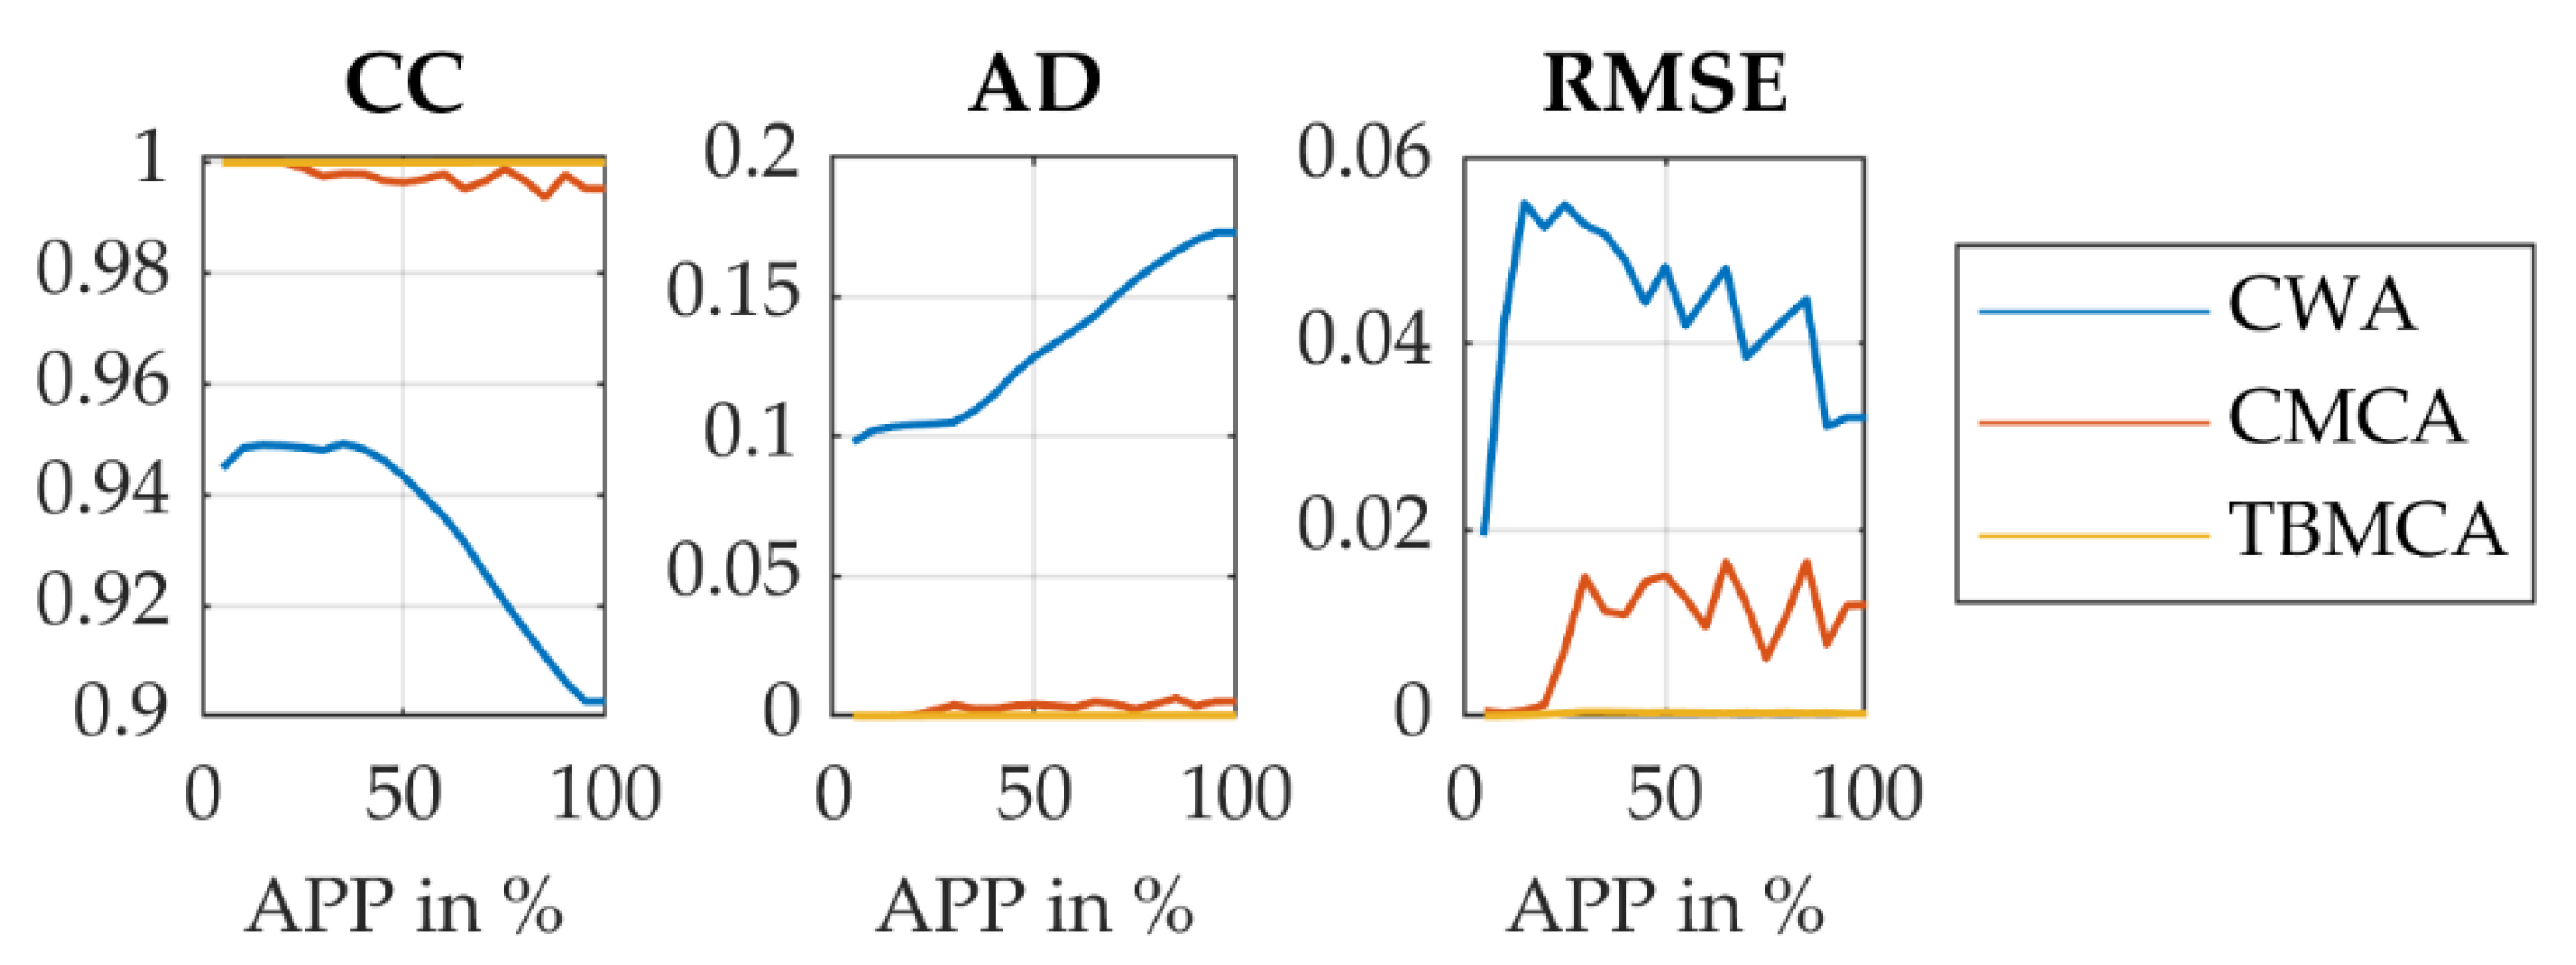
Figure 6 shows the results for the individual quality metrics plotted against the APP. It can be seen that the proposed motion cueing algorithm TBMCA outperforms the CMCA and the CWA at all applied metrics. Furthermore, it can be seen that the performance of the CWA decreases with increasing APP. The CWA can reproduce these more dynamic maneuvers with higher maximum accelerations and jerk only with a loss of accuracy. For the CMCA, relatively small errors occur during high dynamic acceleration changes. The TBMCA can also reproduce these dynamic components. It shows even better accuracy than the CMCA, which has an acceptable performance. Thus, values for AD and RMSE in the range of 10
−4 can be achieved.
For the WLTC, the results are presented in
Table 3. They confirm the high accuracy of the TBMCA with regard to CC, AD and RMSE. Since no high accelerations occur, for all MCAs, a scaling factor of 1 is suitable. The results show that the workspace demand for the TBMCA is slightly greater than that for the CWA and lower than that for the CMCA. Regarding the tilt, the TBMCA has the widest range, since it was developed to map most of the reference acceleration via tilt coordination.
3.3. Limitations of the TBMCA
Regardless of the almost perfect simulation results, there are also limitations resulting from the closed-loop implementation.
First, if the scaling factor is set too high, the tilt rotation can exceed its limit. Higher values are filtered by the saturation function. However, this results in a high translational acceleration component that cannot be represented within the limited linear motion space.
Second, if the tilt rotation is relatively high or low at a constant level (i.e., at high and low lasting accelerations), and the reference acceleration changes suddenly, the tilt coordination will follow the reference signal only with a time delay due to the rotation rate limit. This also results in a high translational acceleration component that cannot be represented within the limited linear motion space. Thus, for the TBMCA a slightly higher translational workspace demand or a lower scaling factor is necessary if acceleration and braking change suddenly.
Considering this, the study design has an important influence on the parametrization of the TBMCA.
4. Study
The proposed motion cueing algorithm outperforms the CWA and the CMCA in a simulation environment for the given test scenarios. The next step was a study on the subjective evaluation of the TBMCA.
4.1. Study Design
The driving profile in this study consisted of an acceleration phase, a coasting phase and a braking phase. It was calculated by using the Speed4E driveline model and scaled by 50%. In the first maneuver, the test subjects were asked to accelerate up to a speed of 120 km/h by pushing the APP by 50%. As an orientation, the APP and BPP (brake pedal position) were displayed in virtual reality (VR). The APP was limited to 50%, and the BPP was limited to 30%, on the software side, in order to ensure that all the test subjects experienced the same drive profile. A maximum acceleration of 2.80 m/s
2 (scaled 1.40 m/s
2) was reached, which lies in the range of accelerations in typical traffic situations of 1.0 to 3.3 m/s
2 [
17] (p. 102). After the acceleration phase, a coasting phase to 100 km/h followed. Finally, the test subjects braked into standstill. In addition, the negative acceleration was downscaled with a factor of 0.6, which leads to a more realistic feeling in braking situations [
6] (p. 105). This whole maneuver was repeated once to obtain more reliable results.
During the whole study, the test subjects wore an Oculus Rift VR Headset. Wind and tire noises were presented via noise-cancelling headphones. After the maneuvers, the test subjects answered the following four questions:
How do you rate the quality of the acceleration presentation on a scale from 1 (very bad) to 7 (very good)?
How strong was the feeling of being rotated on a scale from 1 (very weak) to 7 (very strong)?
How often did you feel that improper accelerations occurred on a scale from 1 (not at all) to 7 (very often)?
How do you rate the correspondence between the visual and vestibular sensory impression on a scale from 1 (very bad) to 7 (very good)?
The first question relates to the overall evaluation of the presented acceleration. The second question concerns the perception of the tilt rate and tilt acceleration. The third question refers to the washout, and the fourth question refers to the impact of scaling on the evaluation of the visual and vestibular impression. For every question, the test subjects had the possibility to explain their rating.
4.2. Results
The participant group consisted of 13 male and 4 female test subjects between the ages of 22 and 35 (M = 26.7; SD = 4.0). Eight of them were scientific employees, and nine of them were students at Technical University Darmstadt. Eight test subjects already had experience in a dynamic driving simulator.
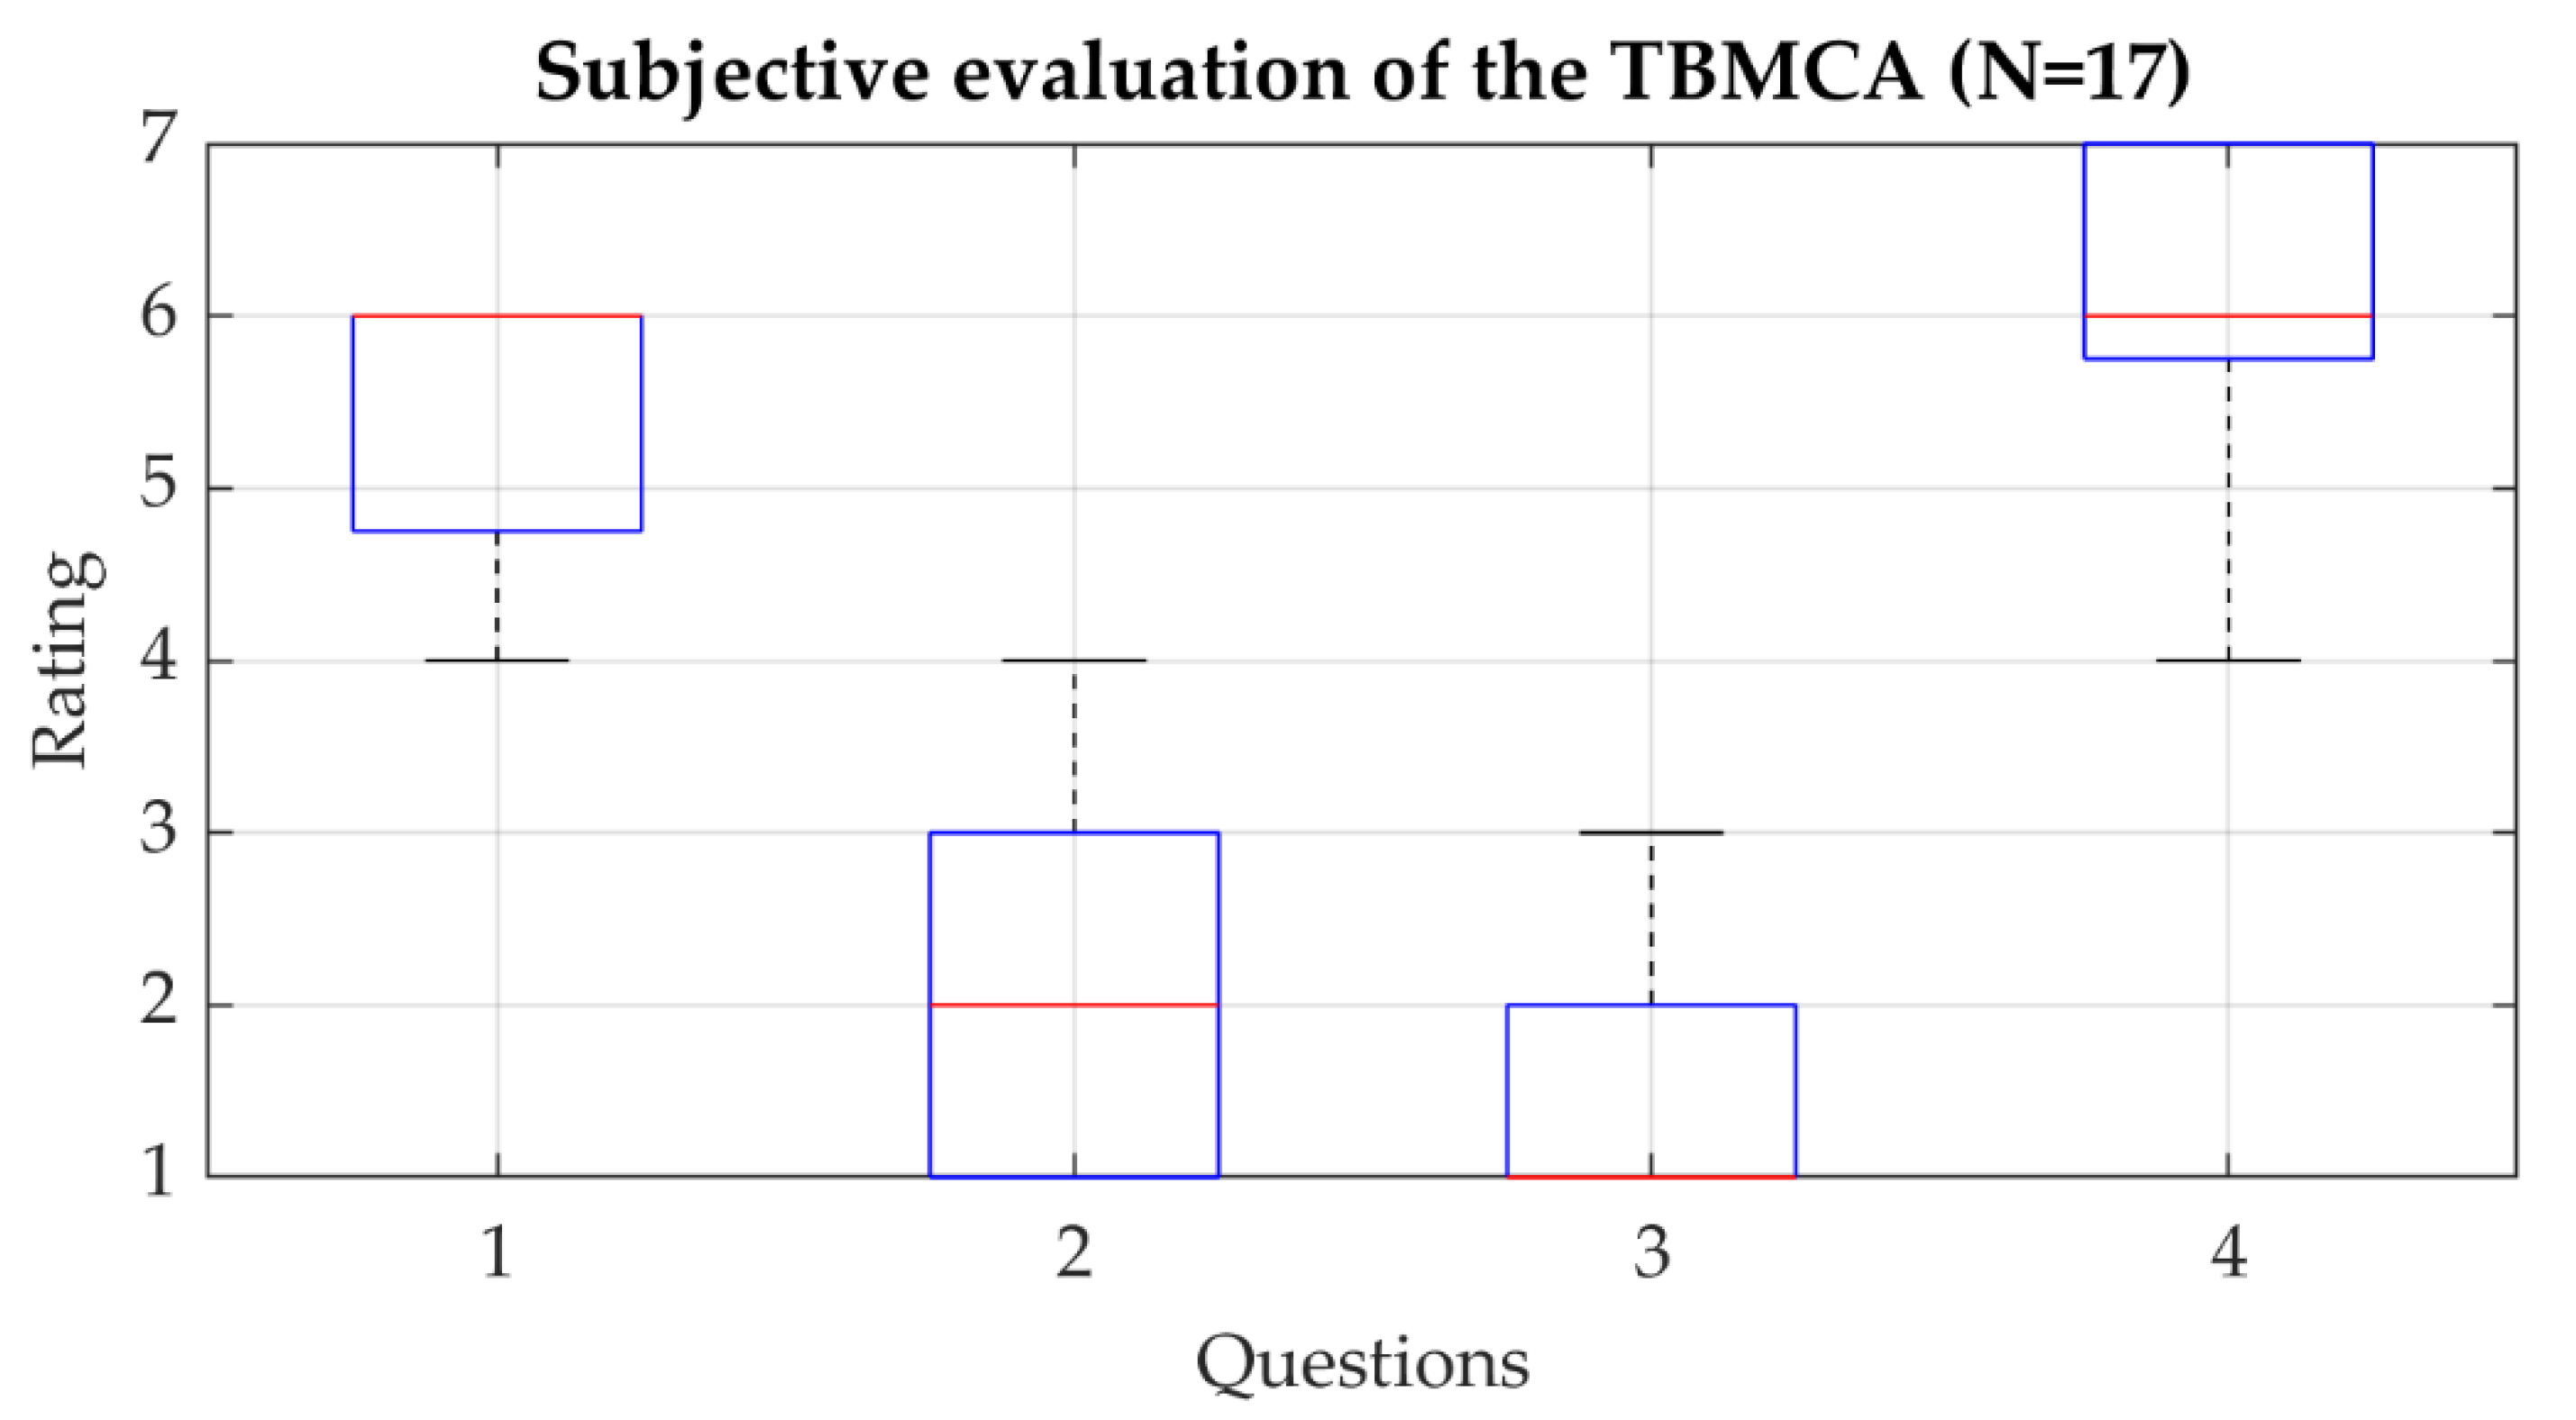
Figure 7 shows the results of the subjective evaluation.
For all four questions, Wilcoxon signed-rank tests were applied. The test statistics indicate that the median values (6, 2, 1, 6) deviate significantly from the scale median value of 4 at the 0.1% significance level (p < 0.001).
The results show that the overall impression was good (Question 1). Most of the negative impressions referred to the transition from the acceleration phase to the coasting phase, which results in a sharp change in acceleration. However, this criticism concerns the vehicle model and the motion cueing algorithm as such. The turning rates and accelerations were rated as not noticeable or slightly noticeable by most of the test subjects (Question 2). Nevertheless, one test subject felt the tilt. The washout was hardly noticed at all (Question 3). This is relevant insofar as the relatively high washout rate was fully compensated by the motion cueing algorithm. Last but not least, the scaling of 50% was not perceived negatively by most test subjects (Question 4). The evaluation shows that a high correspondence between visual and vestibular perception was achieved.
5. Conclusions
In this paper, a threshold-based motion cueing algorithm was developed and evaluated throughout a test subject study in the IMS driving simulator. In the simulation environment, it was compared to the classical washout algorithm and the compensation algorithm. The translational workspace demand can be reduced by over 20% for specific driving scenarios whilst enhancing the tilt angle activity. By means of the selected objective criteria of cross-correlation, absolute difference and RMSE, it showed nearly ideal results. Subjective evaluation demonstrated that even high washout rates can be realized without the test subjects noticing. Overall, the motion cueing was rated as very good.
Further research will focus on exploiting the given workspace through prepositioning strategies. This could further decrease the overall workspace demand and thus allow higher scaling factors for dynamic acceleration motion cueing.
Author Contributions
Conceptualization, E.K. and S.R.; methodology, E.K.; validation, E.K., P.H. and S.R.; formal analysis, E.K., P.H. and S.R.; investigation, E.K.; writing—original draft preparation, E.K.; writing—review and editing, P.H. and S.R.; visualization, E.K.; supervision, S.R. All authors have read and agreed to the published version of the manuscript.
Funding
This research received no external funding.
Institutional Review Board Statement
Not applicable.
Informed Consent Statement
Informed consent was obtained from all subjects involved in the study.
Data Availability Statement
Conflicts of Interest
The authors declare no conflict of interest.
References
- Carsten, O.; Jamson, A.H. Chapter 7—Driving Simulators as Research Tools in Traffic Psychology. In Handbook of Traffic Psychology, 1st ed.; Porter, B.E., Ed.; Elsevier-Academic Press: London, UK, 2011; pp. 87–96. ISBN 978-0-12-381984-0. [Google Scholar]
- Bock, T. Vehicle in the Loop—Test- und Simulationsumgebung für Fahrerassistenzsysteme, 1st ed.; Cuvillier Verlag: Göttingen, Germany, 2008; ISBN 9783736927278. [Google Scholar]
- Fischer, M. Motion-Cueing-Algorithmen für Eine Realitätsnahe Bewegungssimulation. Ph.D. Dissertation, Technische Universität Braunschweig, Braunschweig, Germany, 2009. [Google Scholar]
- Betz, A.; Winner, H.; Ancochea, M.; Graupner, M. Motion Analysis of a Wheeled Mobile Driving Simulator for Urban Traffic Situations. In Proceedings of the Driving Simulation Conference Europe 2012, Paris, France, 6–7 September 2012. [Google Scholar]
- Betz, A. Feasibility Analysis and Design of Wheeled Mobile Driving Simulators for Urban Traffic Simulation; VDI Verlag: Düsseldorf, Germany, 2015; ISBN 9783183786121. [Google Scholar]
- Erler, P. Untersuchung von Vorausschauenden Motion-Cueing-Algorithmen in Einem Neuartigen Längsdynamischen Fahrsimulator; Shaker Verlag: Düren, Germany, 2019. [Google Scholar]
- Reid, L.D.; Nahon, M.A. Flight Simulation Motion-Base Drive Algorithms: Part 1. Developing and Testing Equations; UTIAS Report, No. 296; University of Toronto: Toronto, ON, Canada, 1985. [Google Scholar]
- Groen, E.L.; Bles, W. How to use body tilt for the simulation of linear self motion. J. Vestib. Res. 2004, 14, 375–385. [Google Scholar] [CrossRef] [PubMed]
- Florent, C.; Zhou, F.; Andras, K. Pitch tilt rendering for an 8-DOF driving simulator. In Proceedings of the Driving Simulation Conference 2015 Europe VR, Tübingen, Germany, 16–18 September 2015; pp. 55–61. [Google Scholar]
- Aykent, B.; Paillot, D.; Frédéric, M.; Zhou, F.; Kemeny, A. Study of the Influence of Different Washout Algorithms on Simulator Sickness for a Driving Simulation Task. In Proceedings of the ASME 2011 World Conference on Innovative Virtual Reality, Milan, Italy, 27–29 June 2011; pp. 331–341. [Google Scholar]
- Sammet, T. Motion-Cueing-Algorithmen für die Fahrsimulation; VDI Verlag: Düsseldorf, Germany, 2007; ISBN 9783183643127. [Google Scholar]
- Mileti, M.; Schweigert, D.; Pflaum, H.; Stahl, K. Speed4E: Hyper-High-Speed Driveline and Gearbox for BEVs. In Proceedings of the CTI Symposium USA, Novi, MI, USA, 13–16 May 2019. [Google Scholar]
- Rockwell, T.H.; Snider, J.N. An Investigation of Variability in Driving Performance on the Highway; U.S. Department of Health, Education, and Welfare: Arlington, VA, USA, 1967. [Google Scholar]
- Bubb, H. Automobilergonomie; Springer: Wiesbaden, Germany, 2015; ISBN 978-3-8348-1890-4. [Google Scholar]
- Kolff, M.; Venrooij, J.; Pool, D.M.; Mulder, M. Comparison of Quality Metrics between Motion Cueing Algorithms in a Virtual Test Environment. In Proceedings of the Driving Simulation Conference Europe 2020 VR, Antibes, France, 9–11 September 2020. [Google Scholar]
- Hyndman, R.J.; Koehler, A.B. Another look at measures of forecast accuracy. Int. J. Forecast. 2006, 22, 679–688. [Google Scholar] [CrossRef] [Green Version]
- Müller, T.A. Ermittlung Vestibulärer Wahrnehmungsschwellen zur Zielgerichteten Gestaltung der Fahrzeug-Längsdynamik; Technische Universität München: München, Germany, 2015. [Google Scholar]
| Publisher’s Note: MDPI stays neutral with regard to jurisdictional claims in published maps and institutional affiliations. |
© 2021 by the authors. Licensee MDPI, Basel, Switzerland. This article is an open access article distributed under the terms and conditions of the Creative Commons Attribution (CC BY) license (https://creativecommons.org/licenses/by/4.0/).


