Article

The Role of Exopolysaccharide-Producing Streptococcus thermophilus on Physical Properties of Stirred Skim Milk Gel

Institute of Natural Materials Technology, Technische Universität Dresden, 01062 Dresden, Germany
*
Author to whom correspondence should be addressed.
Dairy 2022, 3(4), 761-775; https://doi.org/10.3390/dairy3040052
Submission received: 16 September 2022 / Revised: 19 October 2022 / Accepted: 25 October 2022 / Published: 28 October 2022
(This article belongs to the Special Issue Tailoring Physical Properties of Fermented Dairy Products)

Abstract

:
The techno-functionality of exopolysaccharides (EPS) from Streptococcus thermophilus in stirred fermented milk is affected by several extrinsic (e.g., base milk composition) and intrinsic (e.g., amount and properties of EPS) factors. The aim of this study was to use skim milk models to identify the key factors that influence the physical properties of stirred fermented milk with EPS. For that, fermentation was carried out with one of three single S. thermophilus strains (intrinsic factors) at two casein:whey protein ratios of the base milk, two acidification activities of the starters, and two fermentation temperatures (extrinsic factors). The effects of the factors on the acidification kinetics, EPS amount, susceptibility to syneresis, and texture properties were then discriminated by a multivariate ANOVA-simultaneous component analysis. Strains producing ropy EPS mainly determined the texture properties, whereas the extrinsic factors primarily affected the acidification kinetics and EPS amount. When capsular EPS were also present, the syneresis was lower; however, this effect was more pronounced after enrichment of base milk with whey protein. The EPS amount did not correlate with the texture or syneresis, pointing to the importance of other factors such as the EPS location (type) and EPS–protein interactions for their functionality in stirred fermented milk.

1. Introduction

Set and stirred yogurt as well as fresh cheese are among the most popular dairy products worldwide. According to Walstra et al. [1], stirred yogurt is a smooth and thick but still pourable product, with at least 27 g/kg protein and a maximum of 150 g/kg fat [2]. The manufacture of plain stirred yogurt includes acid-induced gelation of homogenized and heated milk with thermophilic bacteria, traditionally Streptococcus thermophilus and Lactobacillus delbrueckii ssp. bulgaricus. Subsequently, the gel network is broken by stirring and straining and cooled before filling into containers [3].
Stirred fermented milks with a low fat content are particularly prone to texture defects such as low viscosity, susceptibility to “wheying-off” (syneresis), and/or graininess. To minimize these defects, several extrinsic factors can be altered, especially the base milk composition (protein content, casein:whey protein ratio), processing (homogenization and heating parameters, fermentation temperature, post-fermentation treatment) and starter culture [1]. Another option is adding hydrocolloids such as starch, pectin, or locust bean gum, which are often added during filling. However, besides some debates on health issues, consumers strive for products being nearly free from additives [4].
Exopolysaccharides (EPS) produced by thermophilic lactic acid bacteria in situ are known to thicken and stabilize fermented milk already at low concentration (≤200 mg/kg). The intrinsic factors for the techno-functionality of these high-molecular heteropolysaccharides arise from their broad diversity concerning monosaccharide composition, linearity and stiffness of the backbone, complexity of side chains, charge, and location (for recent reviews, see [5,6,7]). The EPS are usually liberated into the serum phase but may also remain attached to the bacterial cell wall, referred to as free EPS and capsular EPS (cEPS), respectively. Some strains produce both types, others only free EPS, which may be further classified by the degree of ropiness they induce in the product.
The impact of EPS on physical properties of stirred fermented milk is still not fully understood and, among others, linked to the EPS amount, their structural properties, and interactions with proteins [5,8]. With the onset of bacteria growth, both acidification and EPS synthesis start concomitantly [9,10], which may induce early interactions between and with proteins. Several extrinsic factors increased the EPS amount: fermentation at a lower temperature (39 °C versus 45 °C for S. thermophilus ST-143; [11]), base milk with a higher dry matter content [12], or a higher casein:whey protein ratio [9,13]. Intrinsic factors comprise the mechanism and rate of EPS synthesis and strain-specific responses to the above-mentioned extrinsic factors [6]. To decouple EPS synthesis and acidification, Mende et al. [14] isolated ropy EPS from S. thermophilus ST-143 and added different amounts to milk prior to chemical acidification. The apparent viscosity of stirred acid skim milk gels increased, and syneresis decreased with the amount of EPS added. Folkenberg et al. [15] found moderately positive correlations between EPS amount and viscosity, while other studies reported no relationship [16,17].
Studies on fermented milk with EPS subjected to a high energy input during stirring similar to industrial production either investigated the effect of different starters (e.g., [15,18]) or of only one extrinsic factor. The latter were either backpressure in membrane valve during straining [10], milk enrichment with whey fractions [13], dry matter of base milk [19], or the fermentation temperature (32 °C versus 42 °C) [20]. The different manufacturing conditions in these studies, however, make unambiguous statements difficult. Additionally, the adjustment of more than one extrinsic factor is required to minimize texture defects of dairy products. The aim of the current research was, therefore, to examine three extrinsic factors and three starters to identify key factors that influence the physical properties of model systems for stirred fermented milk. The following extrinsic factors were varied: acidification activity of the starters, casein:whey protein ratio of the base milk, and fermentation temperature (37 °C versus 42 °C). Multiple-strain cultures are only of limited value for investigating the effects of EPS [21]; thus, two single S. thermophilus strains producing different types of EPS and a reference strain were used. The intrinsic and extrinsic factors were then discriminated by means of multivariate analysis to gain deeper insight into the key factors for texture enhancement.

2. Materials and Methods

2.1. Materials and Microorganisms

Low-heat skim milk powder and whey protein concentrate powder (GermanProt 8000) were provided by Sachsenmilch Leppersdorf GmbH (Leppersdorf, Germany) and sweet whey permeate powder by wheyco GmbH (Hamburg, Germany). All chemicals were obtained from Carl Roth GmbH & Co. KG (Karlsruhe, Germany) and Pronase E (EC 3.4.24.4) from Sigma-Aldrich Chemie GmbH (Steinheim, Germany).
Three S. thermophilus strains were provided by two starter culture producers: ST-1G+ produces non-ropy EPS and cEPS, ST-2E+ ropy EPS and cEPS as classified by Surber et al. [22], and ST-2F, which is non-texturizing according to the manufacturer. The ‘+’ in the strain name indicates the ability to produce cEPS. Strains were stored as cryo-cultures at −80 °C. Pre-cultures were prepared by anaerobic incubation of one cryo-bead at 40 °C for 48 h in a semi-defined medium with 200 mM lactose as the carbohydrate source [18]. For the production of direct starters, an aqueous solution of 120 g/kg whey permeate powder was inoculated with 10 mL/L pre-culture and aerobically fermented at 42 °C under stirring at 160 rpm and continuous pH recording with a 6-channel pH logger (EA Instruments Ltd., Wembley, United Kingdom). At pH 4.75, cells were separated from 15 mL aliquots by centrifugation (19,000× g, 15 min, 6 °C) and stored at −80 °C until further use. To enhance acidification activity of the direct starters, the whey permeate solution was additionally spiked with 10 g/kg tryptone.

2.2. Experimental Design

Stirred skim milk gels were manufactured from base milk with the natural ratio of casein:whey protein (C/WP) of 4.0:1 using the three S. thermophilus single strain direct starters, either with low (fermentation at 37 °C) or high acidification activity (fermentation at 37 °C and 42 °C). Additional experiments were performed with a C/WP ratio of 1.5:1 with high-activity starters at 37 °C.
All stirred gels were made in duplicate, giving a total of 24 batches. For each batch, textural analyses were carried out in duplicate after 3 d and 14 d storage at 6 °C. The sedimentation behavior was analyzed on day 5, and the particle size and microstructure were evaluated on day 7.

2.3. Milk Powder Analysis and Base Milk Preparation

The dry matter of the powders was determined by oven drying at 103 °C for 4 h, and the ash content was determined after 4 h incineration at 550 °C in a muffle furnace. Lactose was quantified enzymatically using a Lactose/D-Galactose kit (R-Biopharm AG, Darmstadt, Germany). The total [23], non-protein- [24] and non-casein nitrogen content [25] were analyzed using the Kjeldahl method, with a N-to-protein conversion factor of 6.38. All analyses were carried out in triplicate.
Reconstituted skim milk with a C/WP ratio of 4.0:1 refers to 120 g/kg skim milk powder in deionized water. Its calculated gross composition is 42 g/kg protein, 61 g/kg lactose, and 5 g/kg ash. For preparing the base milk with a C/WP ratio of 1.5:1, skim milk, whey protein concentrate, and lactose were dispersed to obtain 120 g/kg dry matter. The gross composition of this base milk was as follows: 42 g/kg protein, 63 g/kg lactose, and 6 g/kg ash. Base milks were heated to 90 °C for 10 min, cooled to 10 °C, and stored at 6 °C until further use.

2.4. Production of Stirred Skim Milk Gels

Base milk (1.5 kg) was warmed to fermentation temperature, inoculated with the direct starter, and fermented aerobically in 2 L containers (diameter = 130 mm) until pH 4.60. The subsequent stirring regime included cooling in ice water to approximately 15 °C, moving a perforated plunger (diameter = 120 mm) 10 times upwards and downwards for 2 × 30 s [19], and stirring with a 3-wing propeller blade (diameter = 90 mm) mounted on a Eurostar power control-visc stirrer (IKA GmbH & Co. KG, Staufen, Germany) for 3 min at 400 rpm. This is equivalent to an energy input of approximately 76 kJ/m3. From the pH profiles monitored during fermentation, the following parameters were evaluated: fermentation time until pH 4.6 (tpH=4.6), maximum acidification rate from the minimum of the first derivative (vAcidification) and the respective time (tvAcidification).

2.5. Properties of Stirred Skim Milk Gels

2.5.1. Exopolysaccharide Production and Serum Viscosity

The EPS amount was determined as reported by Mende et al. [18] and Surber et al. [22]. Briefly, 5.0 g stirred gel was treated with 0.25 mL of 10 g/L Pronase E at 37 °C for approximately 18 h and heated for enzyme inactivation (10 min at 90 °C). After cooling in ice water and adjusting to 90 g/L trichloroacetic acid, cells and protein were removed by centrifugation (6 °C, 19,000× g, 15 min). EPS in the supernatant was precipitated with chilled ethanol and, after centrifugation, dissolved in water, dialyzed against deionized water, and freeze-dried. The EPS amount is expressed as the milligram glucose equivalent (GE) per kilogram, determined by the phenol-sulfuric acid method [26].
The dynamic viscosity of the serum phase (ηserum) obtained by centrifugation of the stirred gel was determined by a LOVIS rolling ball viscometer (Anton Paar GmbH, Ostfildern, Germany) according to Surber et al. [22].

2.5.2. Analysis of Physical Properties and Microstructure

Stirred gels were equilibrated to 15 °C and subjected to hysteresis loop experiments using a stress-controlled AR-G2 rheometer (TA Instruments, New Castle, DE, USA) equipped with a recessed bottom concentric cylinder geometry (inner diameter = 28 mm, outer diameter = 30 mm, height = 42 mm). After gently transferring into the cup and lowering the bob, the samples were equilibrated for 5 min. The shear rate was increased linearly from 0 to 100/s within 100 s and decreased again to 0/s within another 100 s, and the shear stress was recorded every second. For estimation of the shear stability of the products, the hysteresis loop area between the upward and downward curve was integrated and related to the shear stress at 100/s [27]. A shear rate sweep experiment was performed on a new specimen by increasing the shear rate in log increments from 0.001/s to 100/s (five points per decade). After pre-shearing for 110 s at each data point, the torque was recorded for 10 s. The static yield stress and apparent viscosity at a shear rate of 1/s and 100/s were taken from the curves.
The particle size distribution of stirred gels was analyzed by laser diffraction (Helos KR with Sucell, Sympatec GmbH, Clausthal-Zellerfeld, Germany; λ = 633 nm). Samples diluted in distilled water to an optical density of 10–15% were equilibrated for 5 min under stirring and analyzed in a measuring range of 0.5–175 mm. The 90% percentile of the distribution (dV,90) was taken as an indicator of the particle size.
The microstructure was visualized by confocal laser scanning microscopy using a 63× objective (HCX PLAPO Lambda blue oil mounted to TCS SP5 MP invers, Leica Microsystems GmbH, Wetzlar, Germany). For that, 40 µL of an aqueous solution of 1 g/L Nile blue (Carl Pinnow, Berlin-Schöneberg, Germany) in a four-well chamber slide (Nunc™ Lab-Tek™ II; Thermo Fisher Scientific, Waltham, MA, USA) was layered with approximately 0.5 mL stirred gel. Then, proteins were observed in multiple areas after excitation at 633 nm (helium-neon laser, emission: 670–737 nm) and representative micrographs were selected.

2.5.3. Determination of Serum Release

After centrifugation of the stirred gels at 6 °C and 1000× g for 10 min, the expelled serum was removed by a Pasteur pipette, and forced syneresis was calculated as the ratio of the mass of expelled serum to total gel mass before centrifugation [19].
For time-resolved determination of phase separation, an analytical photocentrifuge was used (LUMiSizer® LS 610, LUM GmbH, Berlin, Germany). Rectangular polycarbonate cuvettes (10 × 8 mm2 base area) were filled with ~1.75 mL gel and closed with an in-house developed plug (length = 54 mm) to prevent movement of the sample. After overnight storage, cuvettes were centrifuged at 15 °C and 1000× g, and a light intensity of 865 nm was recorded with a charge-coupled device sensor. The sedimentation velocity was calculated from the transmission profiles with SEPView® 6 (LUM GmbH) from the position of the phase boundary at 30% transmission in the range of 50–150 s.

2.6. Statistical Data Evaluation

Unless stated otherwise, data are expressed as arithmetic mean ± half deviation range (n = 2) or arithmetic mean ± standard deviation (n > 2). OriginPro® 2019b (OriginLab Co., Northampton, MA, USA) was used to perform dependent t-tests and one-factor ANOVA with Tukey post hoc tests. To interpret the effects of the extrinsic and intrinsic factors on the stirred gel properties, an ANOVA-simultaneous component analysis (ASCA) was performed after auto-scaling to the respective standard deviation and centering with Solo 8.9.1 (Eigenvector Research Inc., Manson, WA, USA) according to the ASCA+ approach by Thiel et al. [28]. Since missing values reduce the number of observations, measured values were supplemented with random numbers of a normal distribution that had the same mean and the same deviation using the approach of Saccenti et al. [29]. The mean value of the respective parameter–strain combination was used for visualization of the scores. The significance of the factors and their interaction was assessed by means of permutation tests with 1000 randomizations.

3. Results and Discussion

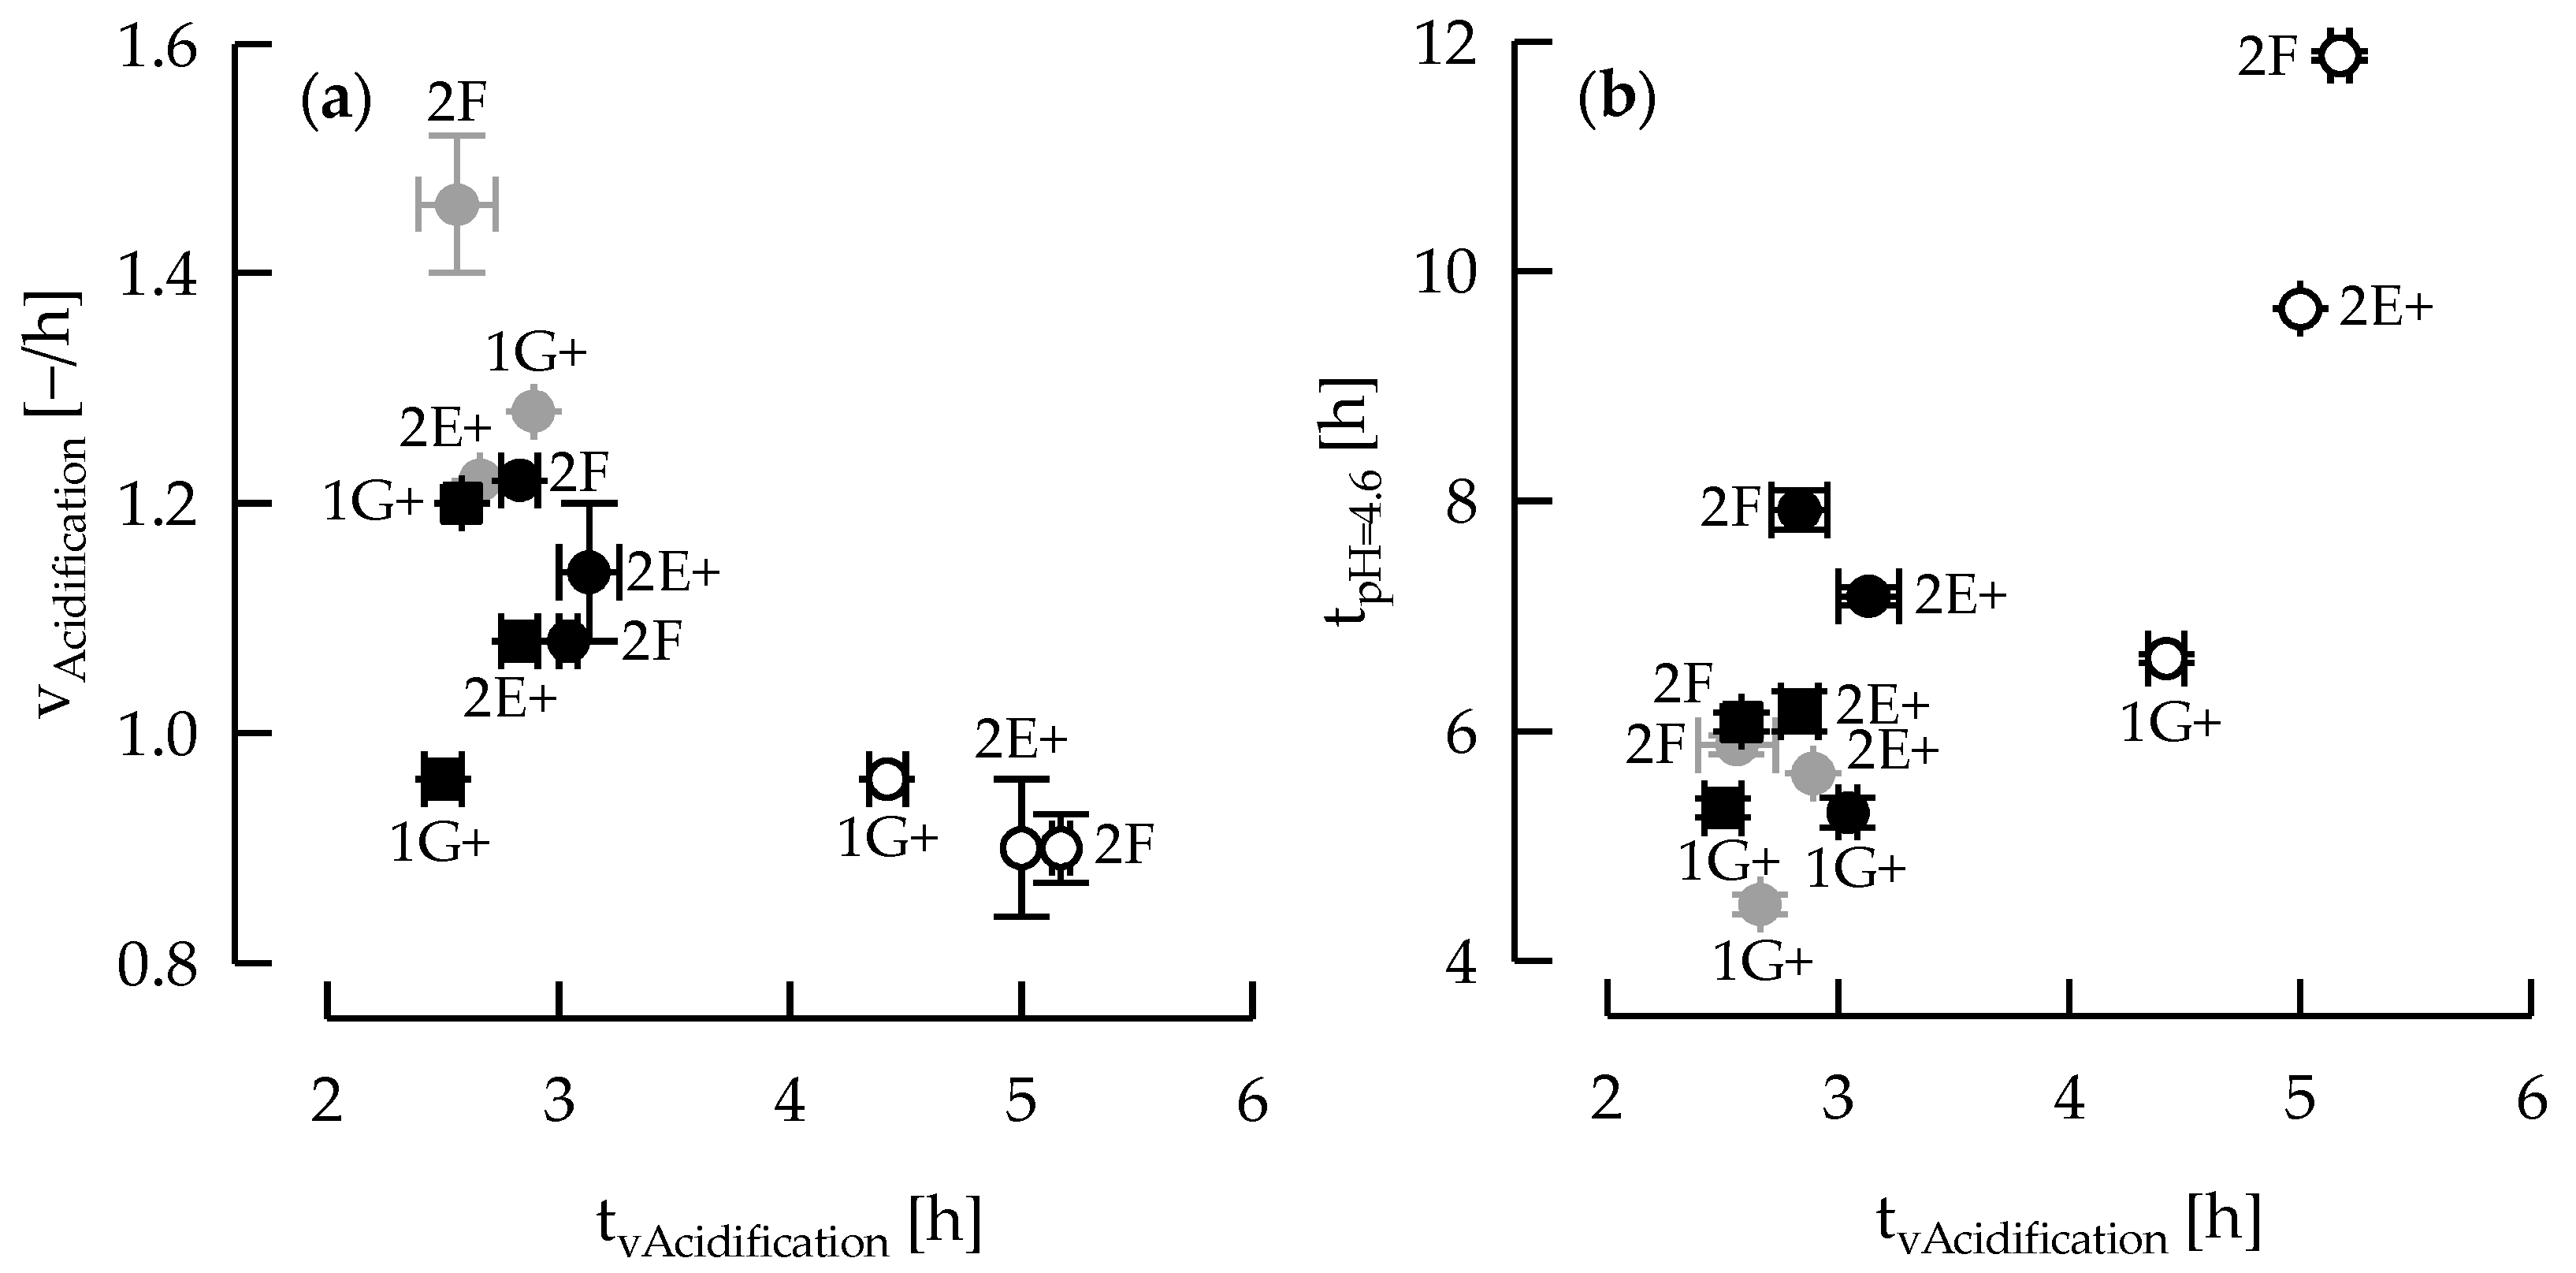
3.1. Acidification Kinetic and EPS Production

Direct starters from whey permeate medium enriched with tryptone exhibited a higher acidification rate, and less time was needed to reach the maximum acidification rate (Figure 1). The higher acidification activity can be attributed to the additional availability of already hydrolyzed nitrogen fractions originating from enriched medium used for direct starter preparation [30]. Consequently, the fermentation time until pH 4.6 of each of the individual strains was shorter for starters with high acidification activity. Additionally, fermentation was also faster at higher temperatures, especially when ST-2E and ST-2F were used. The overall shortest fermentation time and highest acidification rate were observed for base milk with a C/WP ratio of 1.5:1. Amatayakul et al. [12] and Nguyen et al. [9] explained the faster fermentation of base milk with a C/WP ratio of approx. 1:1 with different EPS producers with the reduced buffering capacity of the milk due to its low casein content. Post-acidification occurred in all the stirred gels in our study during cold storage: pH = 4.4 ± 0.08 after 3 d and 4.2 ± 0.07 after 14 d.
The highest EPS amount was produced under the following combination of extrinsic factors: C/WP ratio of 4.0:1, starters with high acidification activity, and fermentation temperature of 37 °C (Figure 2). The EPS amounts were lower in the case of base milk with a C/WP ratio of 1.5:1 or when the fermentation temperature was set to 42 °C. This is in line with literature data on the effects of the fermentation temperature (30, 37 or 42 °C) during production of set acid gels [31], and lower EPS amounts were also observed at shorter fermentation times when gels were produced from base milk with a lower C/WP ratio [9,12]. Consequently, it can be assumed that a retarded lactic acid production due to a low temperature or a high buffering capacity of the base milk contribute to a higher EPS amount in the final product. However, ST-2E+ and ST-2F starters with low acidification activity produced only low EPS amounts at 37 °C, indicating poor bacterial growth as EPS production is generally known to be growth-associated [16].
The dynamic viscosity of the serum phase showed a stronger dependence on the intrinsic factors than the EPS amount, e.g., the viscosity was generally higher for ST-2E+ than for ST-1G+, indicating the presence of ropy EPS [22]. ST-2F, however, showed a peculiar behavior. For this strain, enrichment of direct starter medium with tryptone resulted in the ability of ST-2F to produce ropy EPS. In a recent review [6], EPS synthesis of lactic acid bacteria was described as being very complex. Several factors such as the substrate and growth conditions may affect the macromolecular properties of EPS and, therefore, their techno-functionality in the final product. It was, for instance, observed that the type and amount of the carbohydrate and nitrogen source as well as fermentation temperature affect the molecular mass and intrinsic viscosity of some EPS from S. thermophilus [32,33].

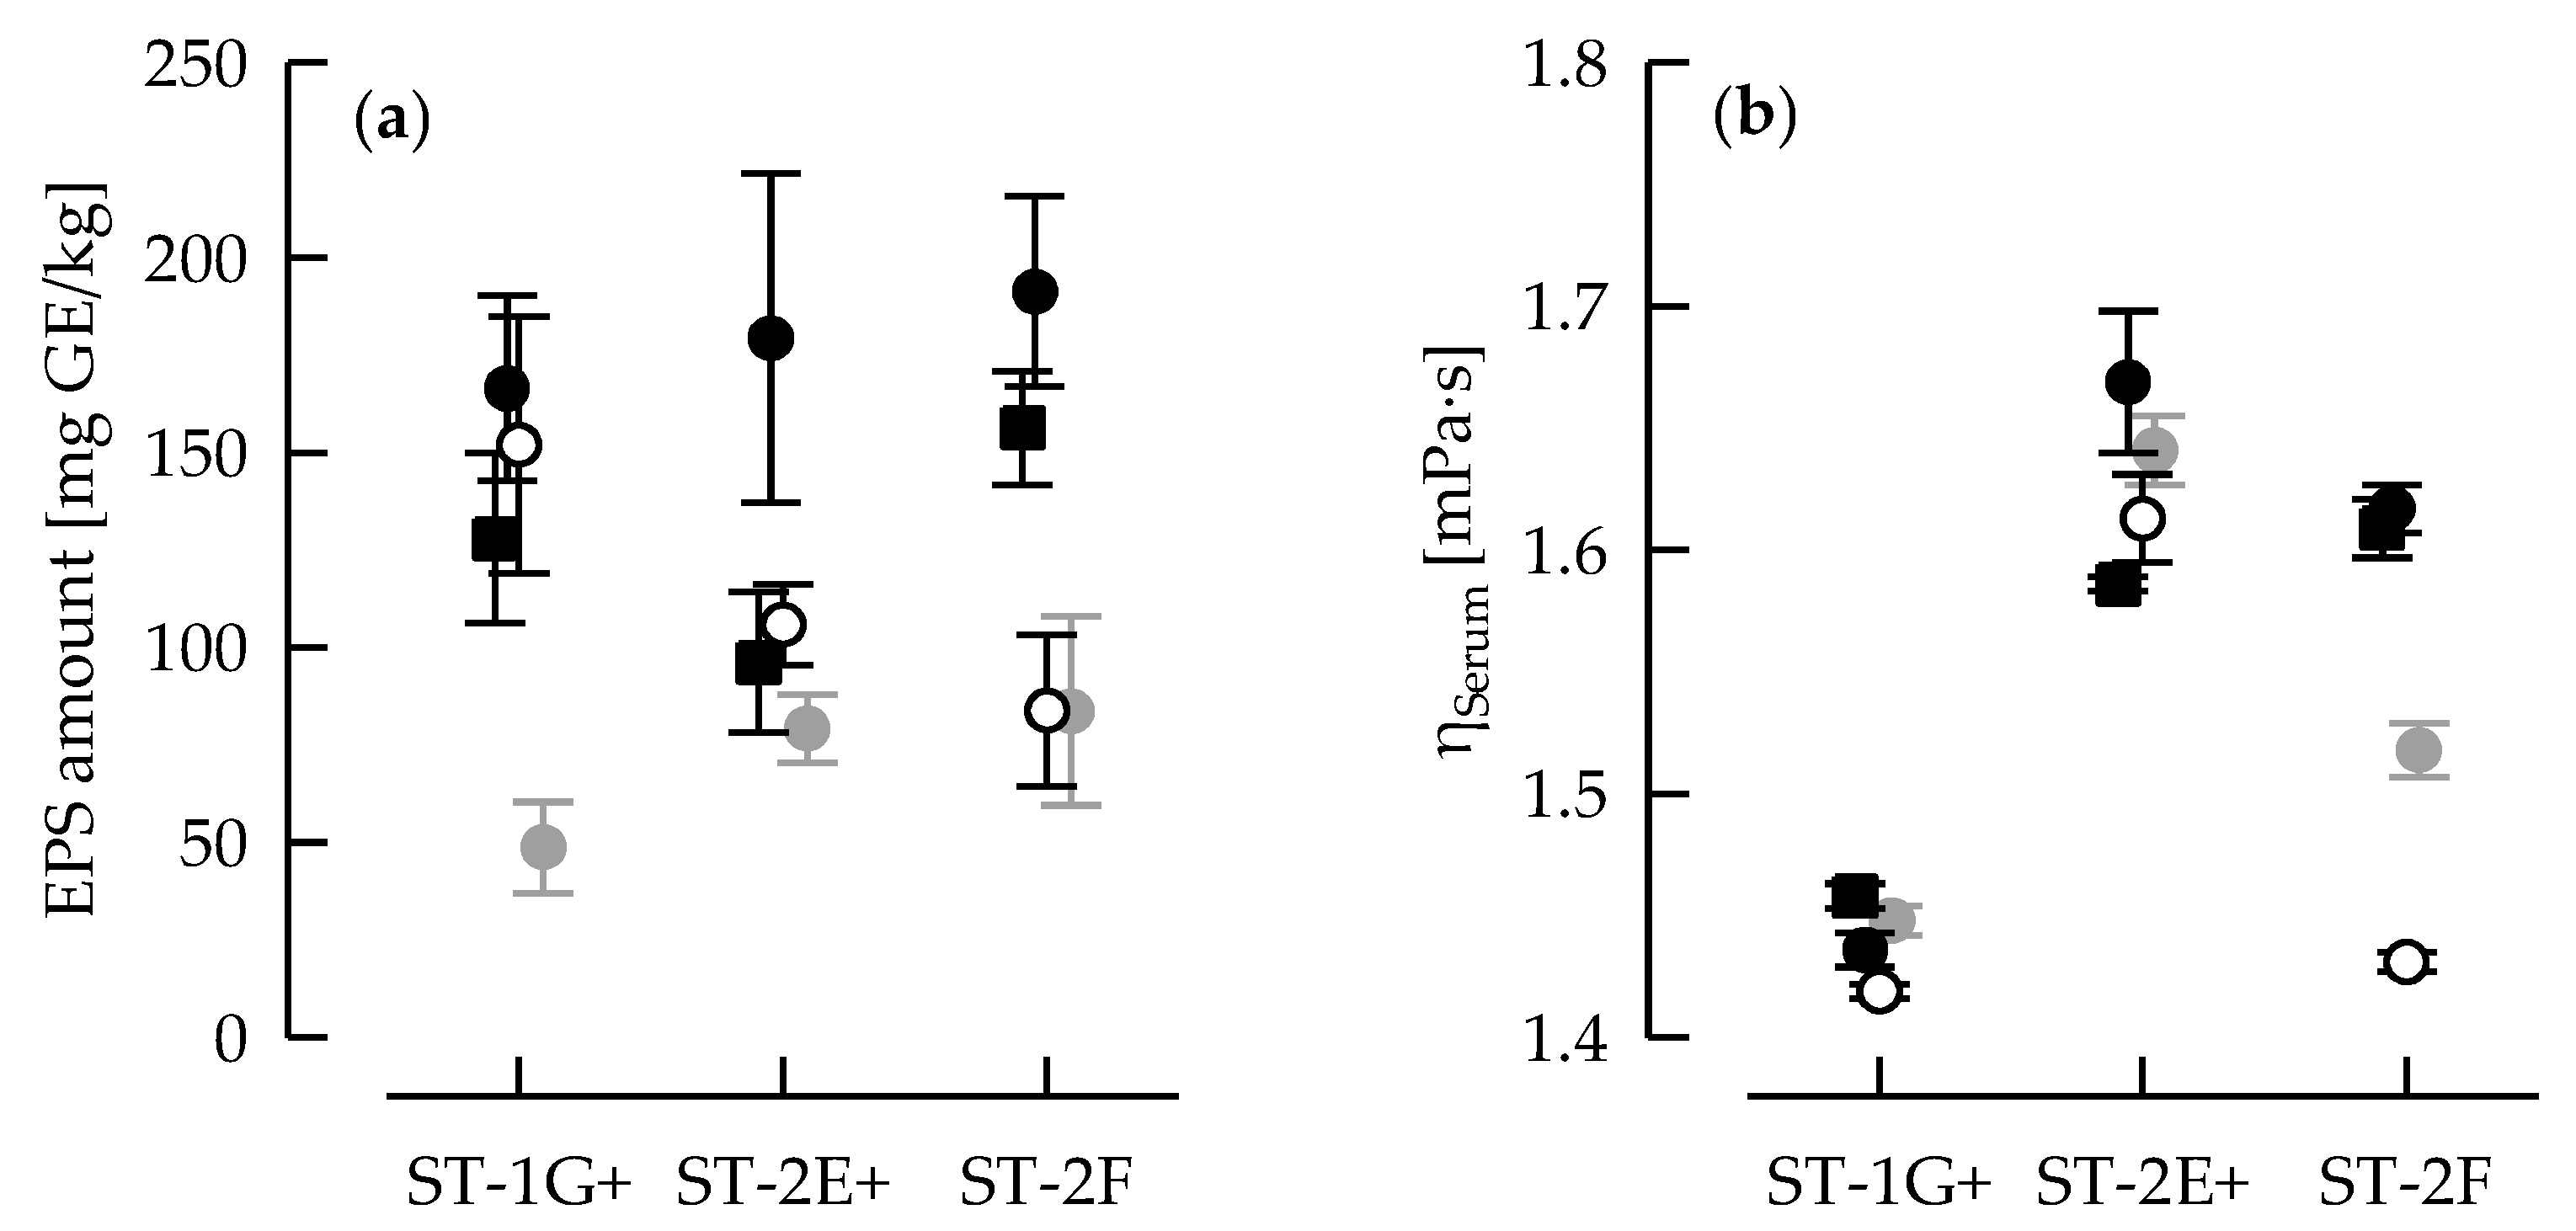
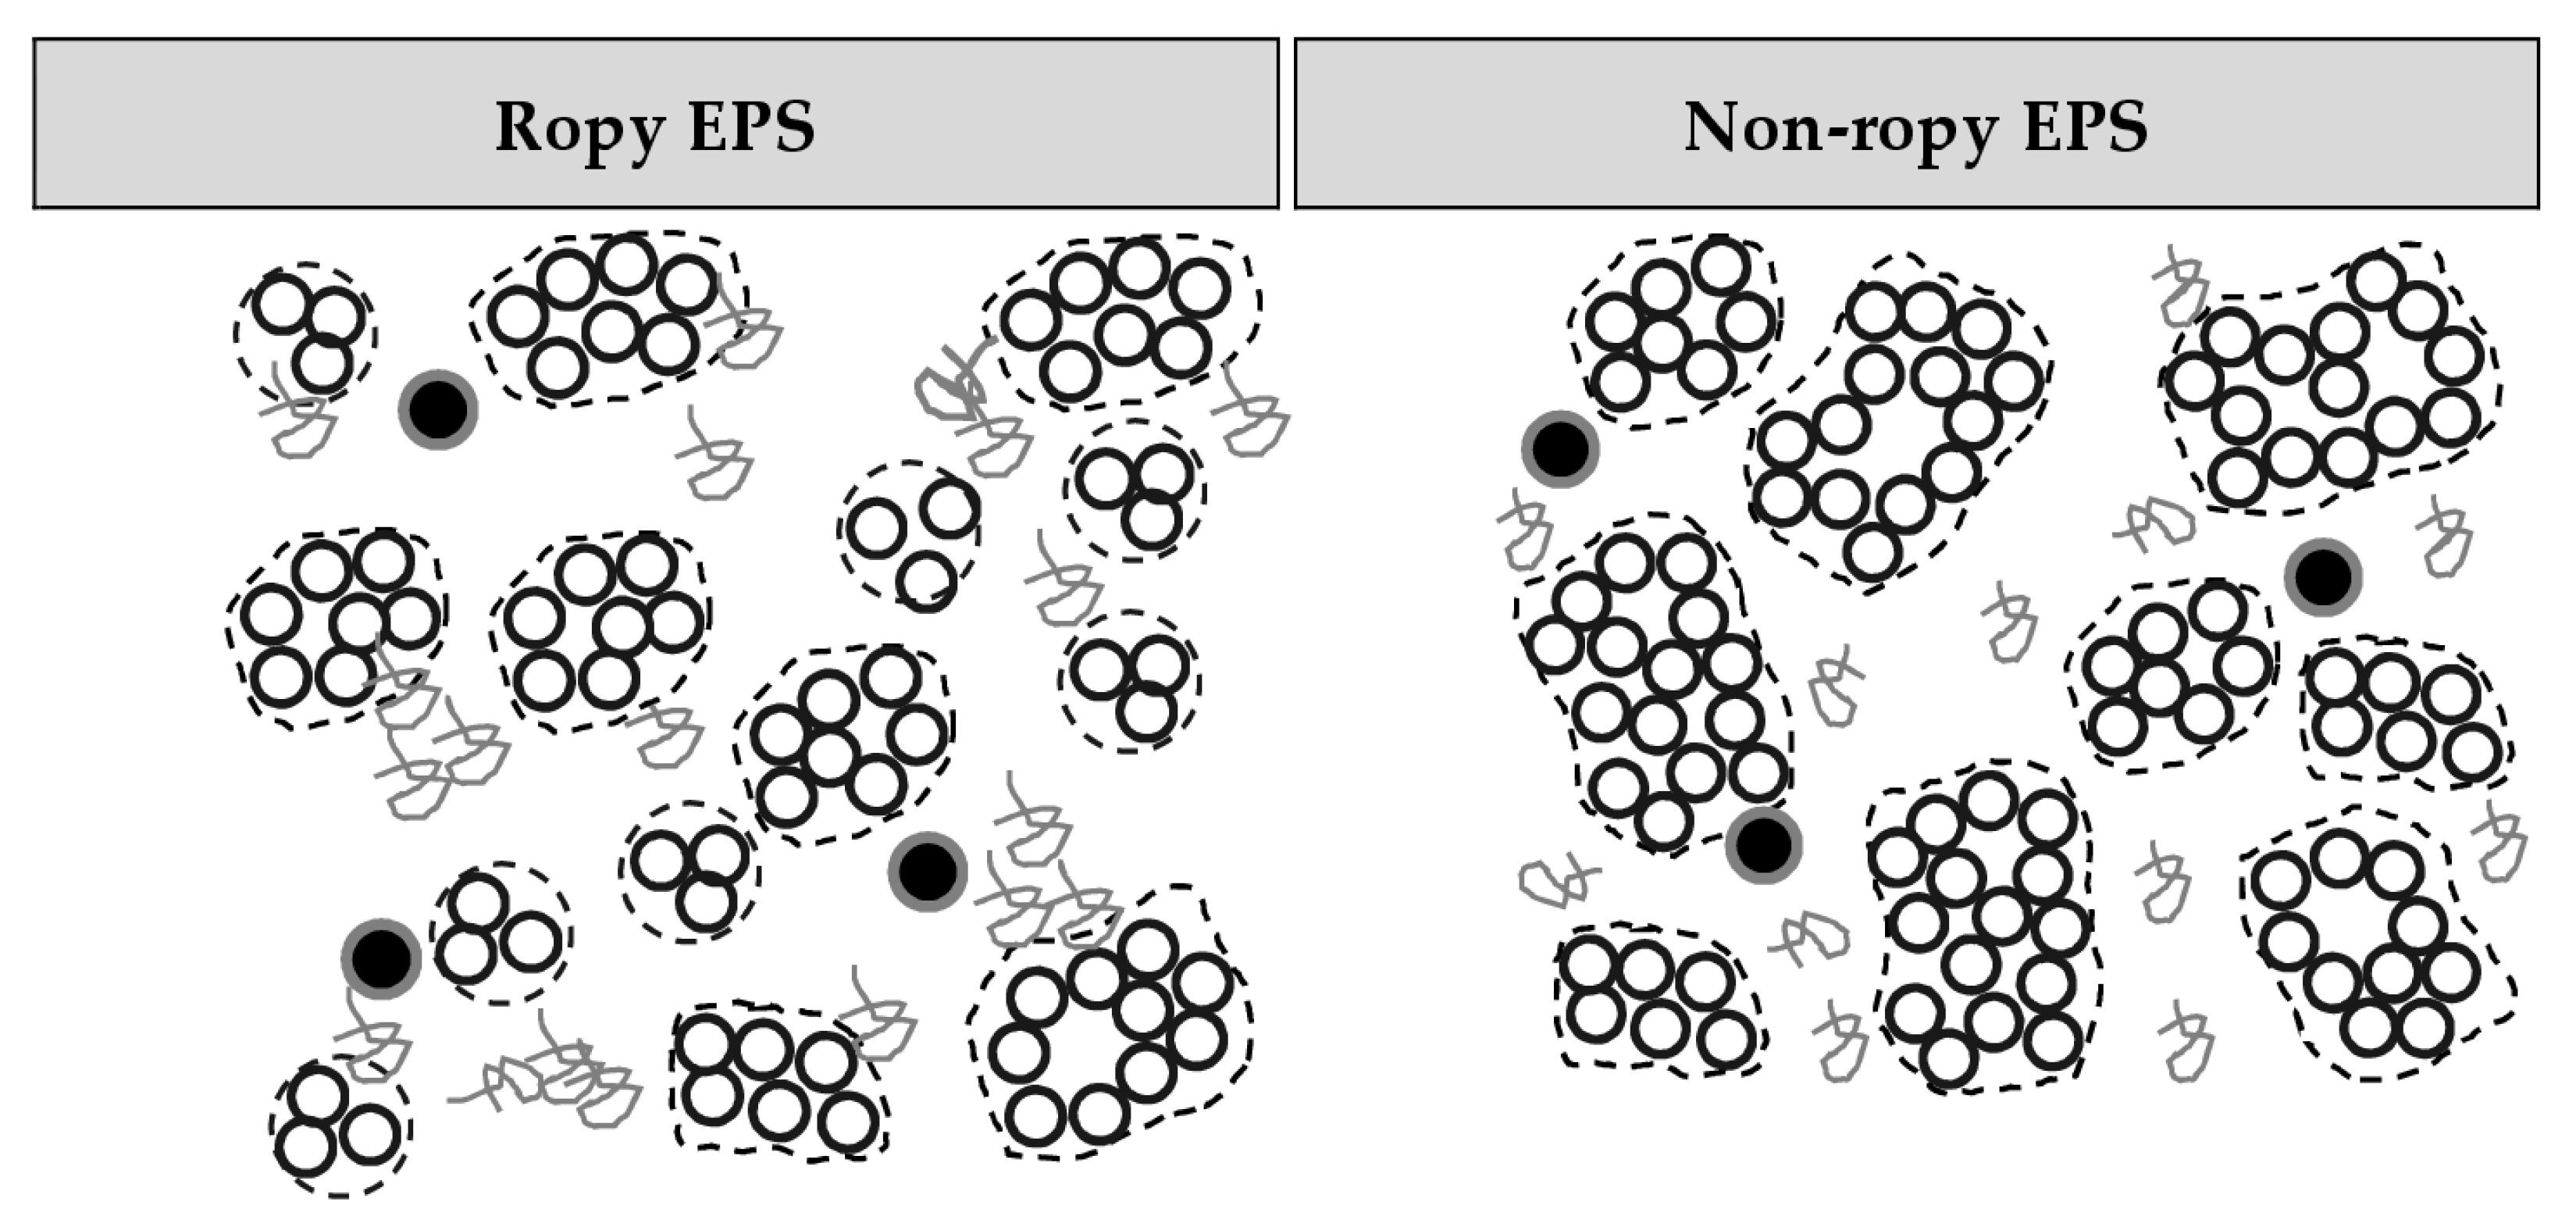
3.2. Casein: Whey Protein Ratio and Capsular EPS Affect Phase Separation

Generally, the sedimentation velocity of gel particles was lower in gels produced from milk with a C/WP ratio of 1.5:1 (Figure 3). After fermentation at 37 °C, ST-1G+ triggered a lower sedimentation velocity as well as lower forced syneresis of gels than ST-2E+ or ST-2F. A similar trend was observed for forced syneresis after 14 d, with the correlation of the respective values measured after 3 d and 14 d being significant (r = 0.86; p < 0.001). Hence, susceptibility to syneresis of stirred gels is lower either when more denatured whey proteins or when capsular EPS are present.
Remeuf et al. [34] explained reduced syneresis due to a higher fraction of denatured whey proteins with their ability to immobilize more water due to their positive charge, contributing to a higher degree of cross-linking within the gel network. Several authors reported that the presence of cEPS also resulted in gels with reduced forced syneresis [12,35,36]. This was related to a higher water binding capacity of the cEPS isolates from a S. thermophilus ST-143 [37]. Hassan et al. [35] observed that cells with a capsule diameter of ~5 µm contributed more pronouncedly to serum retention than capsules with ~2 µm. Therefore, we hypothesize that the capsules of ST-1G+ are larger, which will be evaluated in a forthcoming study.

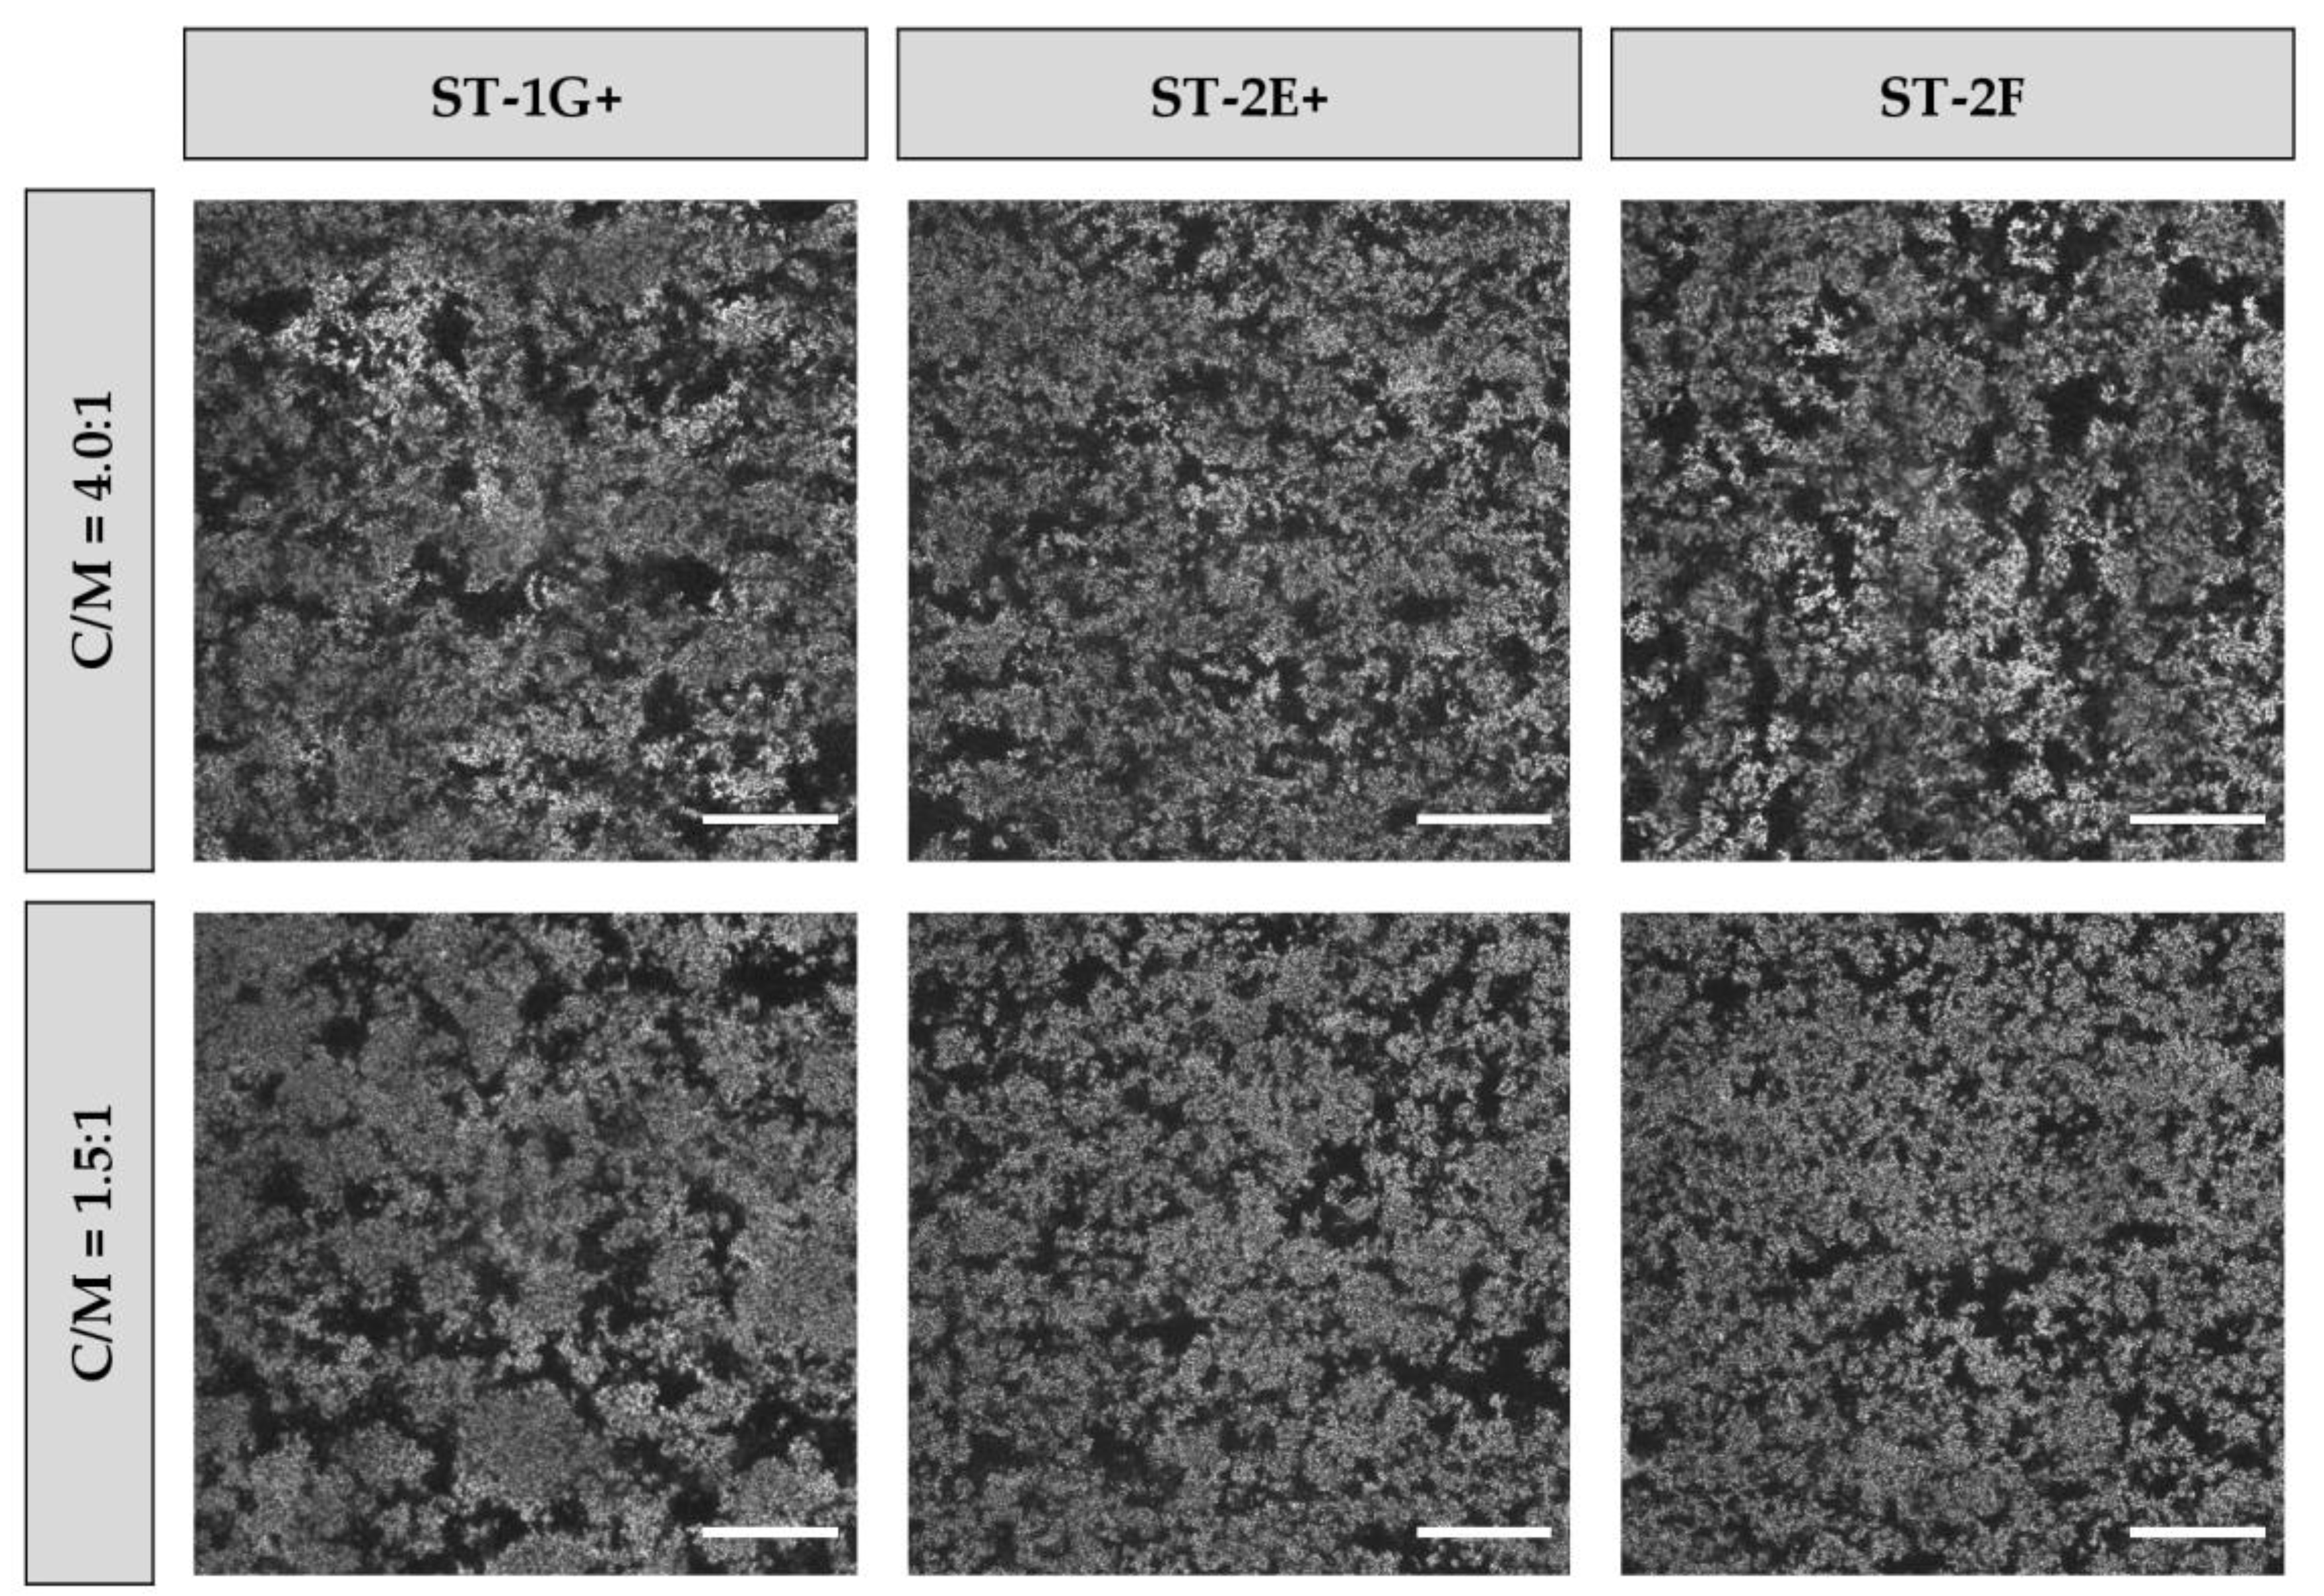
3.3. Particle Size and Microstructure

The volume-weighted particle size distribution in stirred gels appeared as monomodal, and dV,90 was always lower for gels made with ropy EPS-producer ST-2E+ (Table 1). This was confirmed by laser scanning microscopy (Figure 4). Generally, pores in the microstructure showed almost the same size, which can be explained by a high energy input during shearing [10]. In our study, larger gel particles at a lower C/WP ratio for ST-1G+ can be attributed to increased aggregation of proteins because of the higher fraction of denatured whey proteins [34], and being at a fermentation temperature of 42 °C induces faster gel network formation [38].

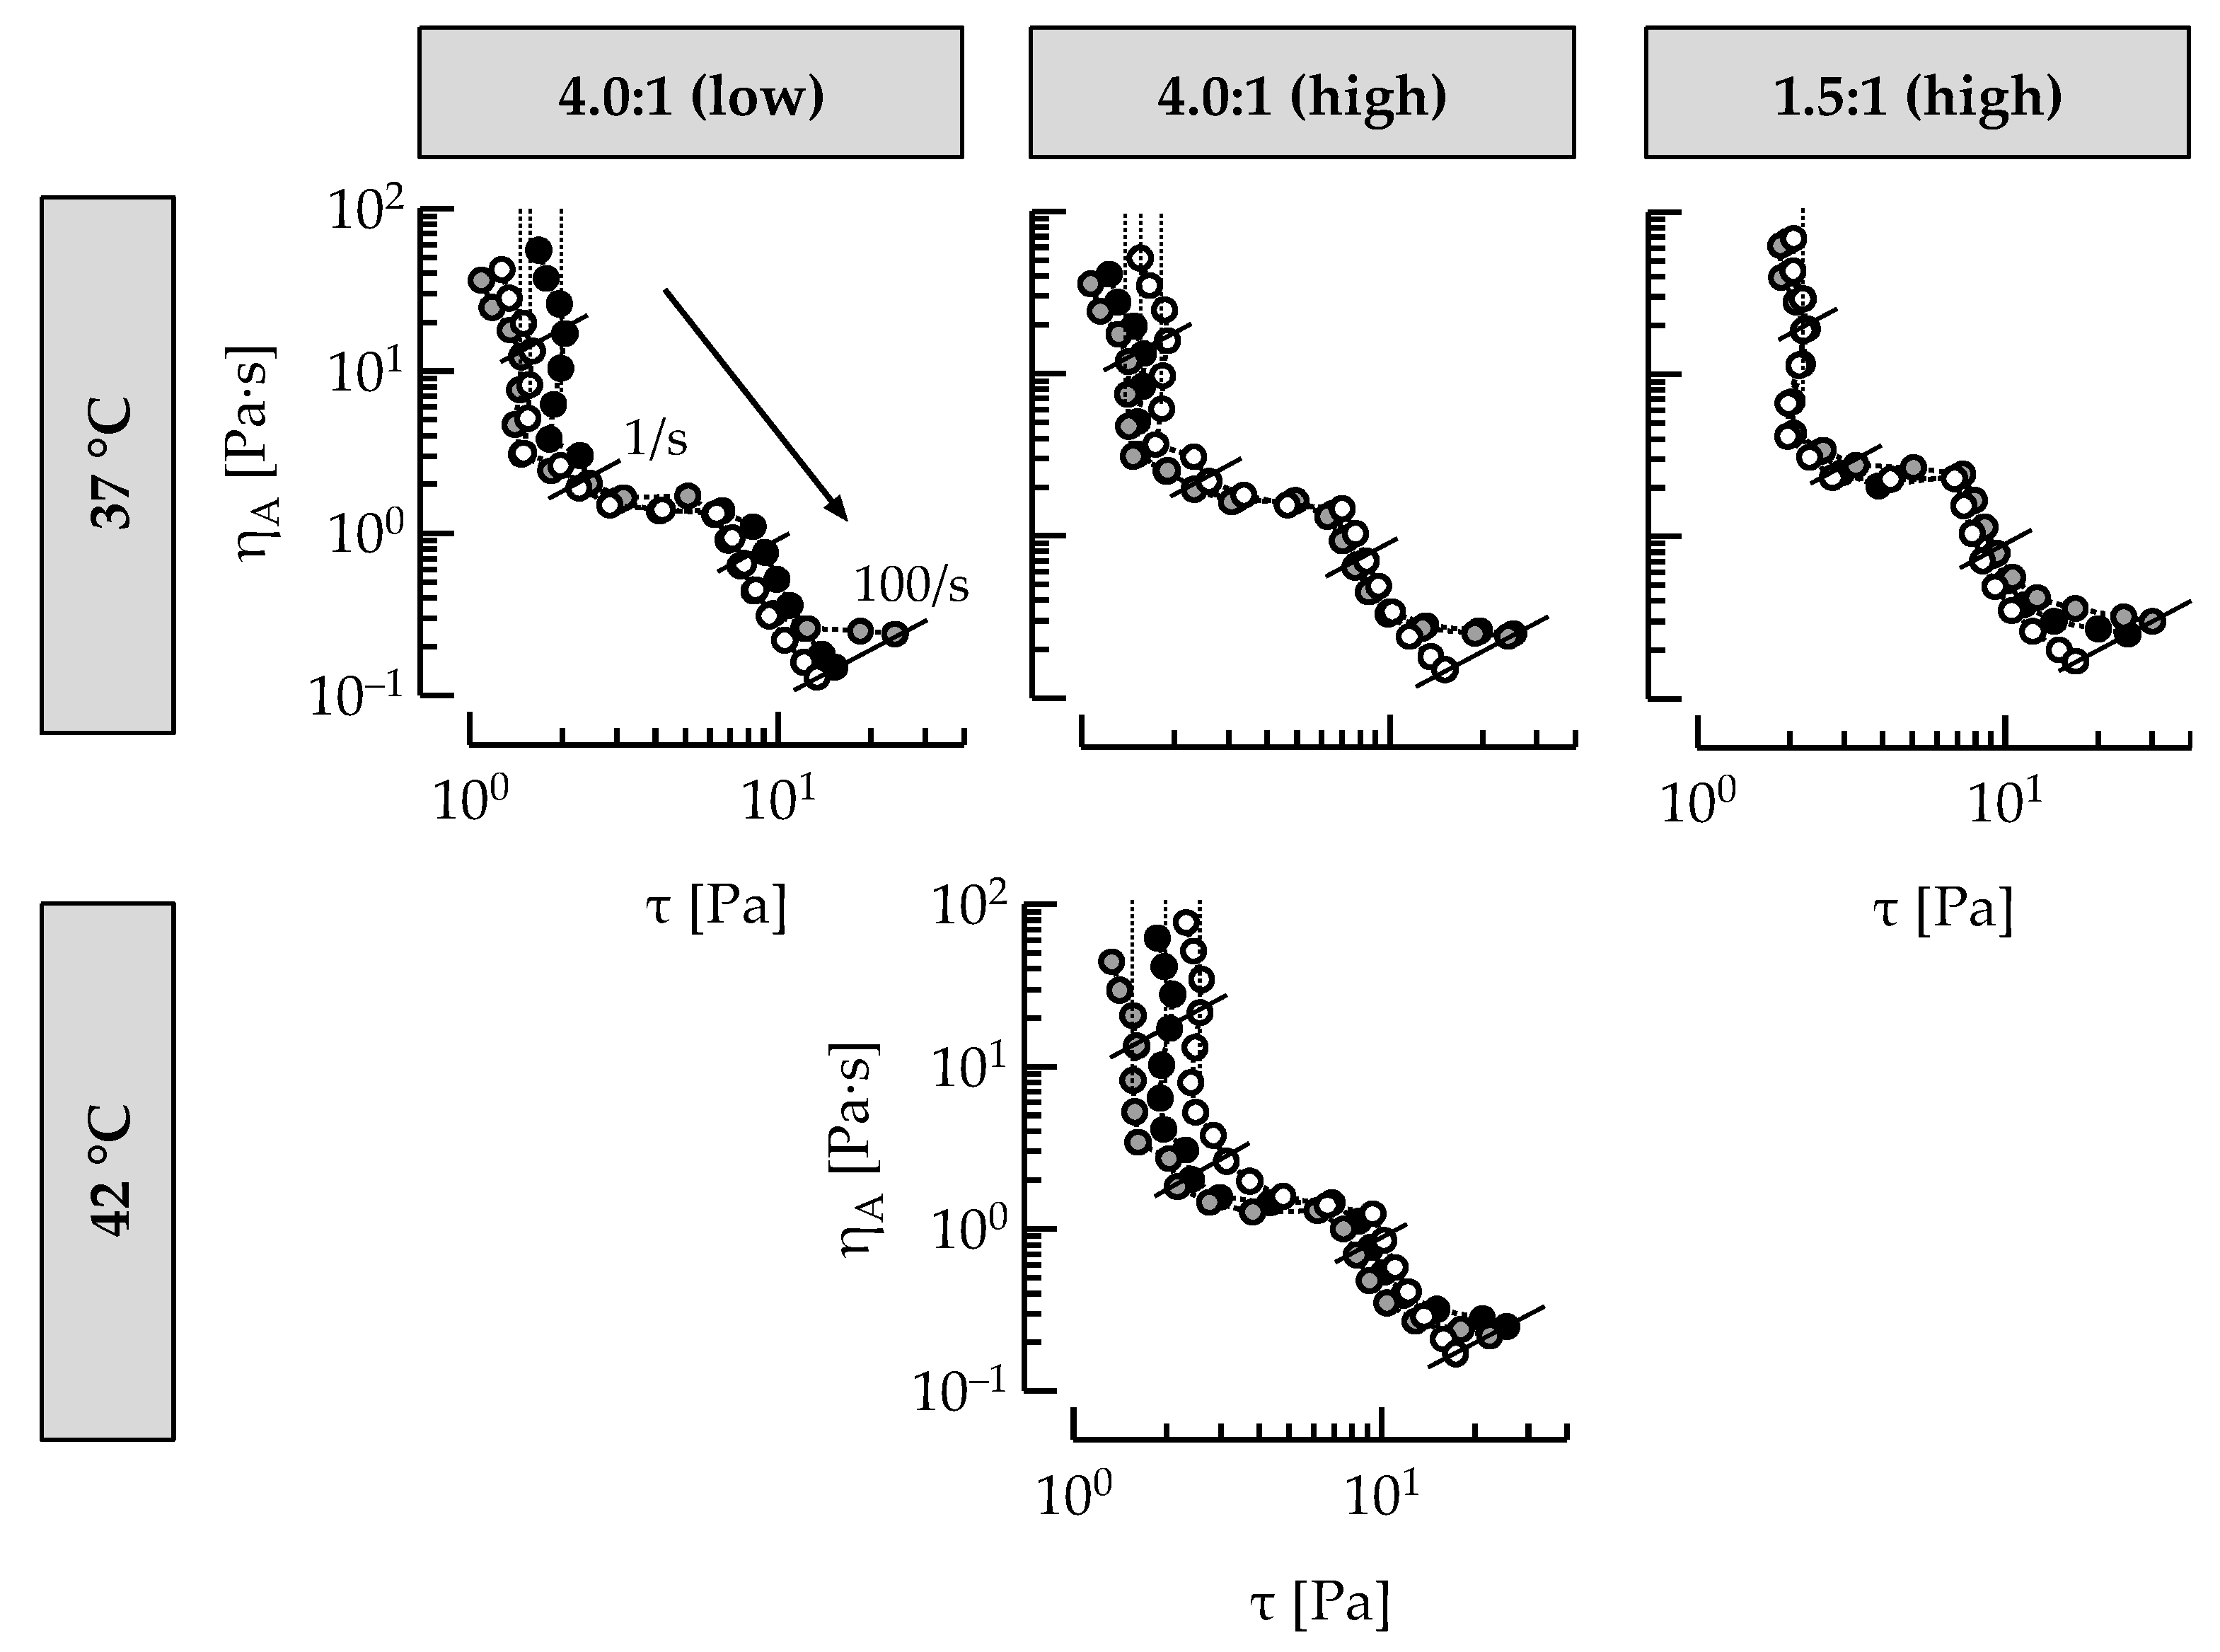
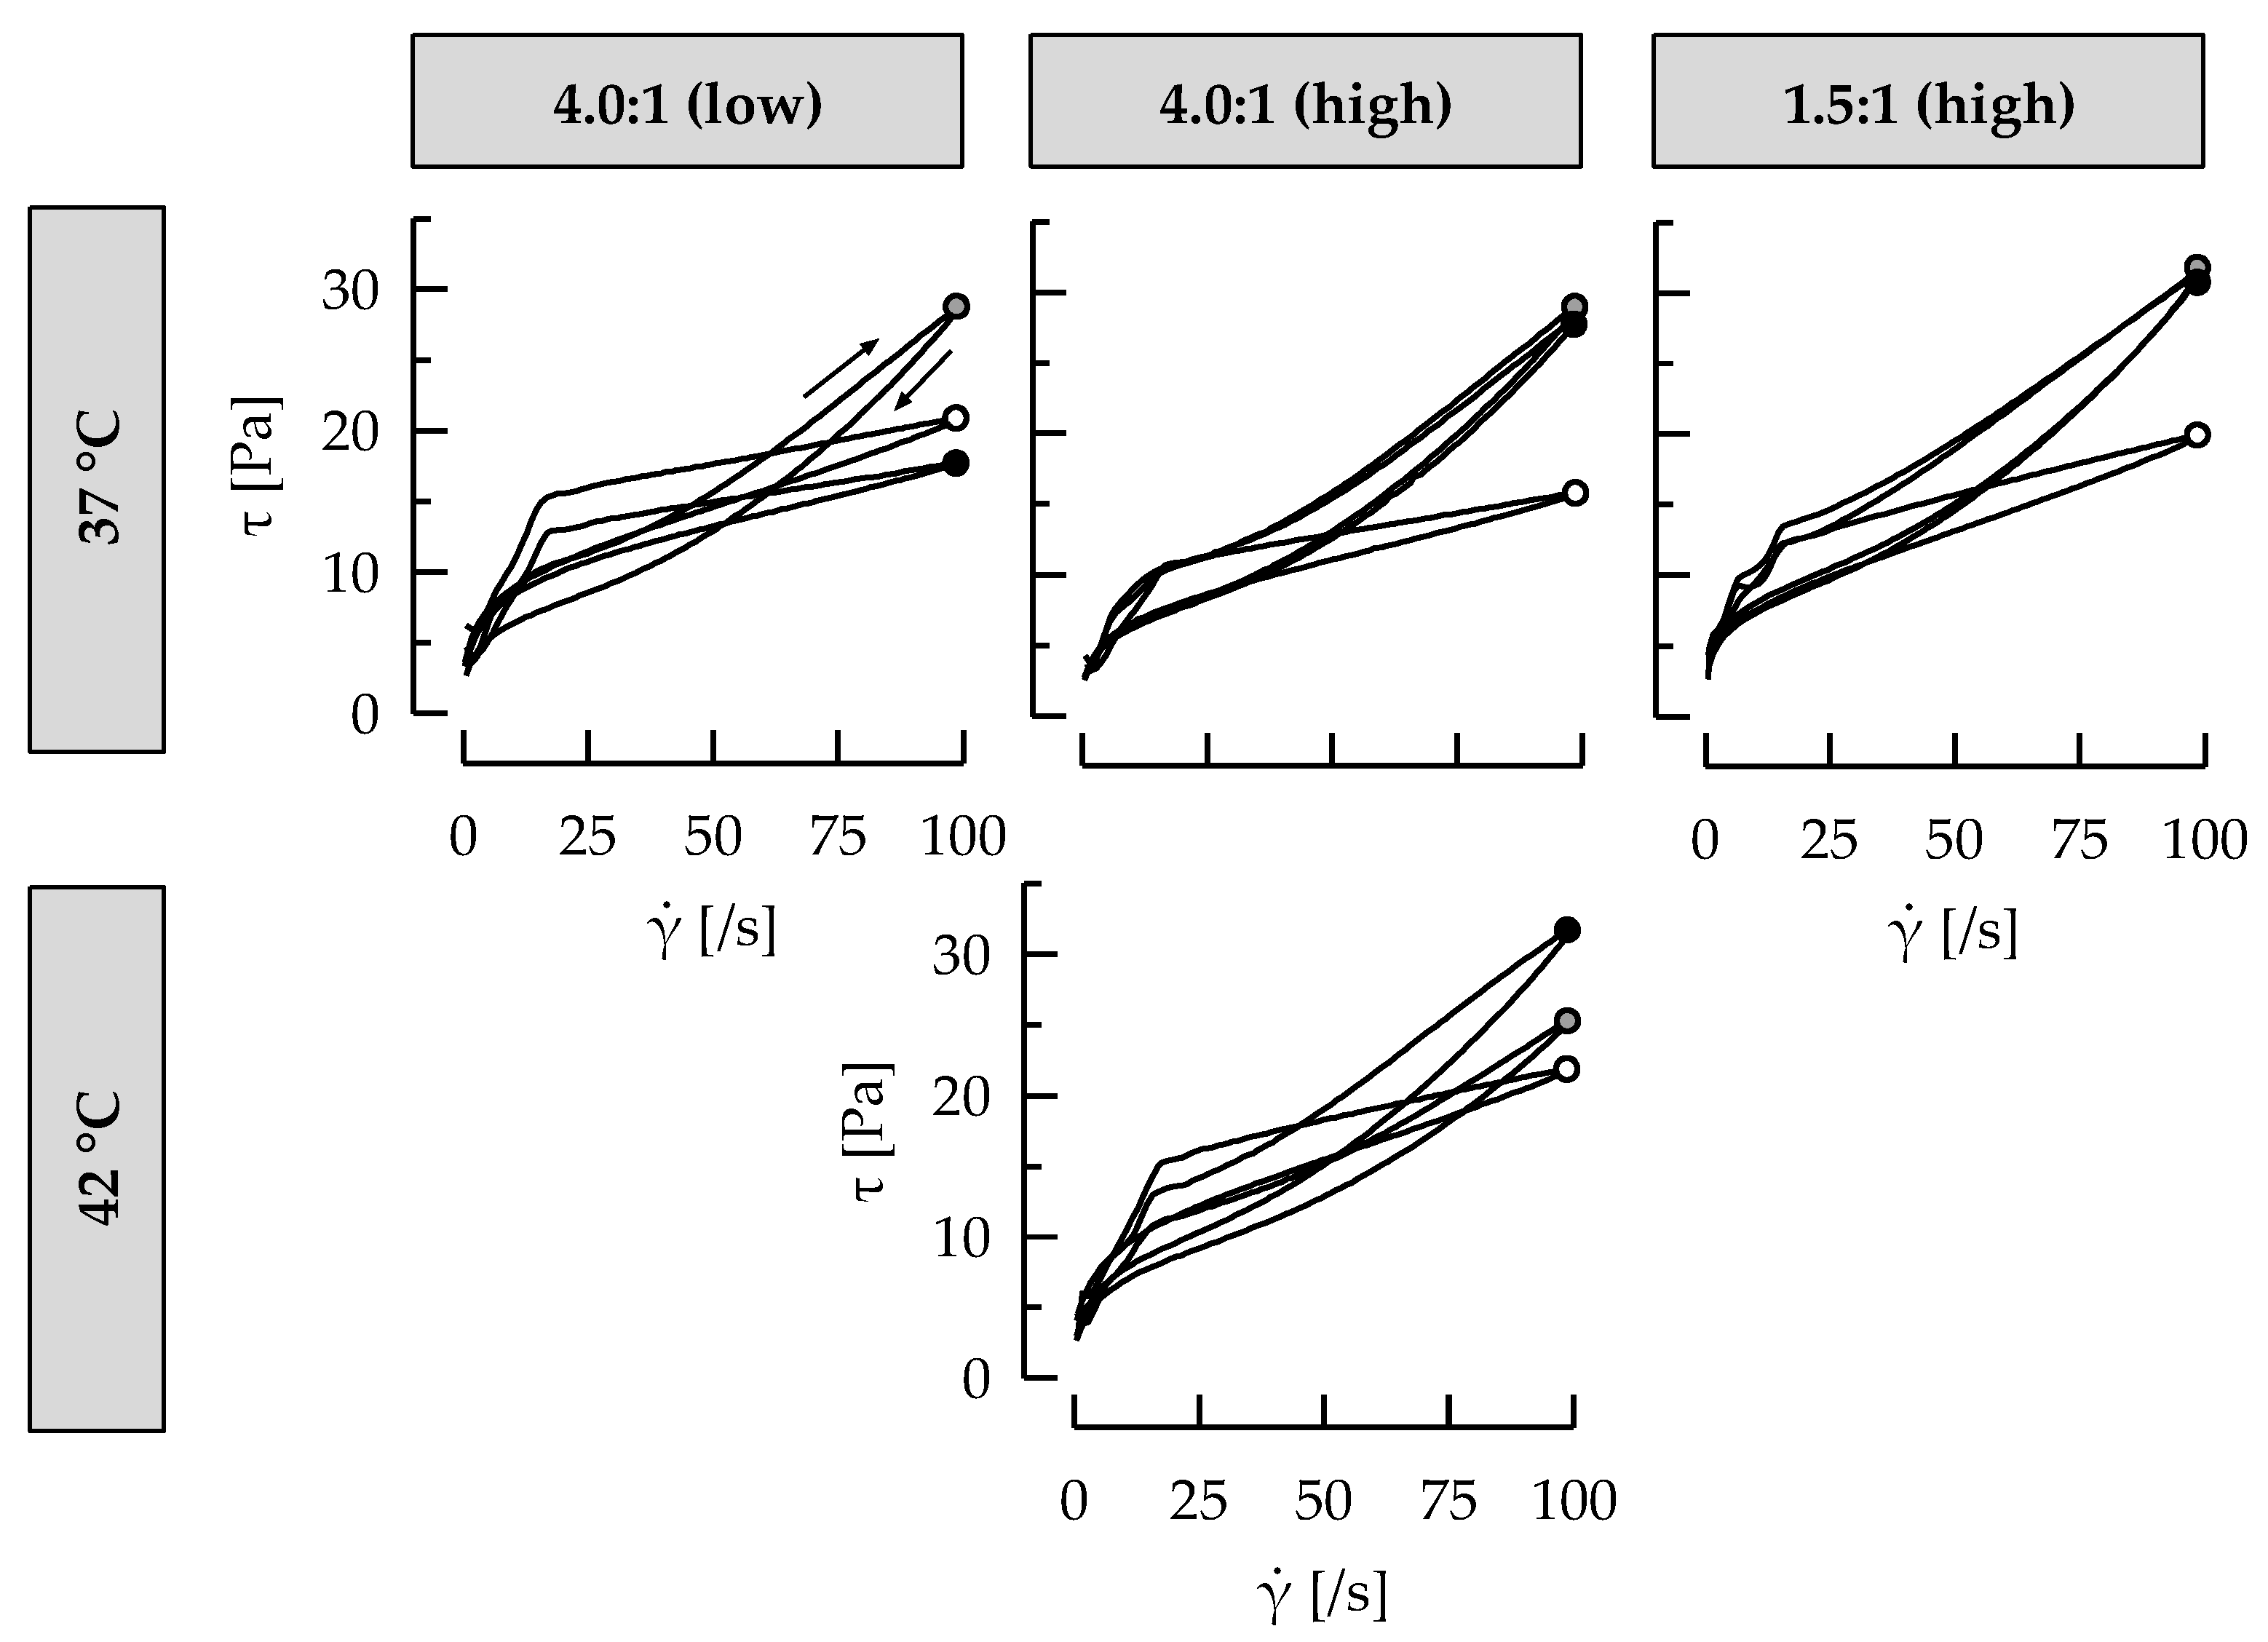
3.4. Casein: Whey Protein Ratio and Ropy EPS Affect Shear Viscosity

In the beginning of the experiments, the apparent viscosity decreased at almost constant shear stress (shear rate < 0.5/s) then remained constant while the shear stress increased, and finally decreased again when shear rate exceeded approx. 5/s (Figure 5). The region relatively constant shear stress can be considered as static yield stress [27]. Both static yield stress (calculated from data points at a shear rate of 0.08–0.19/s) and the apparent viscosity at a shear rate of 1/s were higher in case of a C/WP ratio of 1.5:1 or when non-ropy EPS were present. Similar effects were found for stirred gels from milk treated by high pressure homogenization at 600 MPa and were attributed to more intense interactions between caseins and denatured whey proteins [39]. This correlates with our findings concerning enhanced protein interactions in gels from milk with a C/WP ratio of 1.5:1. Non-ropy EPS and cEPS are also reported to induce protein interactions, probably due to reducing the distances between gel particles [10] and by immobilizing more water compared to ropy EPS [37]. In contrast, the steric hindrance of ropy EPS impaired these interactions [9,40]. Hence, our observation of a lower yield stress and viscosity at 1/s for gels with ropy EPS is consistent with literature results.
Above 30/s, the effect of ropy EPS on the apparent shear viscosity became more obvious. A positive correlation between apparent viscosity at high shear rates and ropiness was frequently also observed by other authors [10,18,41]. In our study, the apparent viscosity at 100/s correlated well with the serum viscosity (r = 0.90; p < 0.001), whereas this was not the case for the apparent viscosity at 1/s (r = −0.10; p > 0.1). As cells and proteins were separated by centrifugation, the relatively high shear rates in the capillary of the rolling ball viscosimeter (~400/s at an angle of 70°) may contribute to more intense interactions between ropy EPS in the serum. In stirred gels, shear-induced rearrangements may not only reduce particle size but may also separate ropy EPS from the proteins [10]. Consequently, shearing of gels facilitates more intense interactions between ropy EPS, thus resulting in a higher product viscosity.
During cold storage, the yield stress and apparent viscosity increased significantly (p < 0.05) from day 3 to day 14. The slope of the regression functions is in the range of 1.1–1.3, indicating an average increase in the respective analytical values of 10–30% due to rebodying of the gel structure.

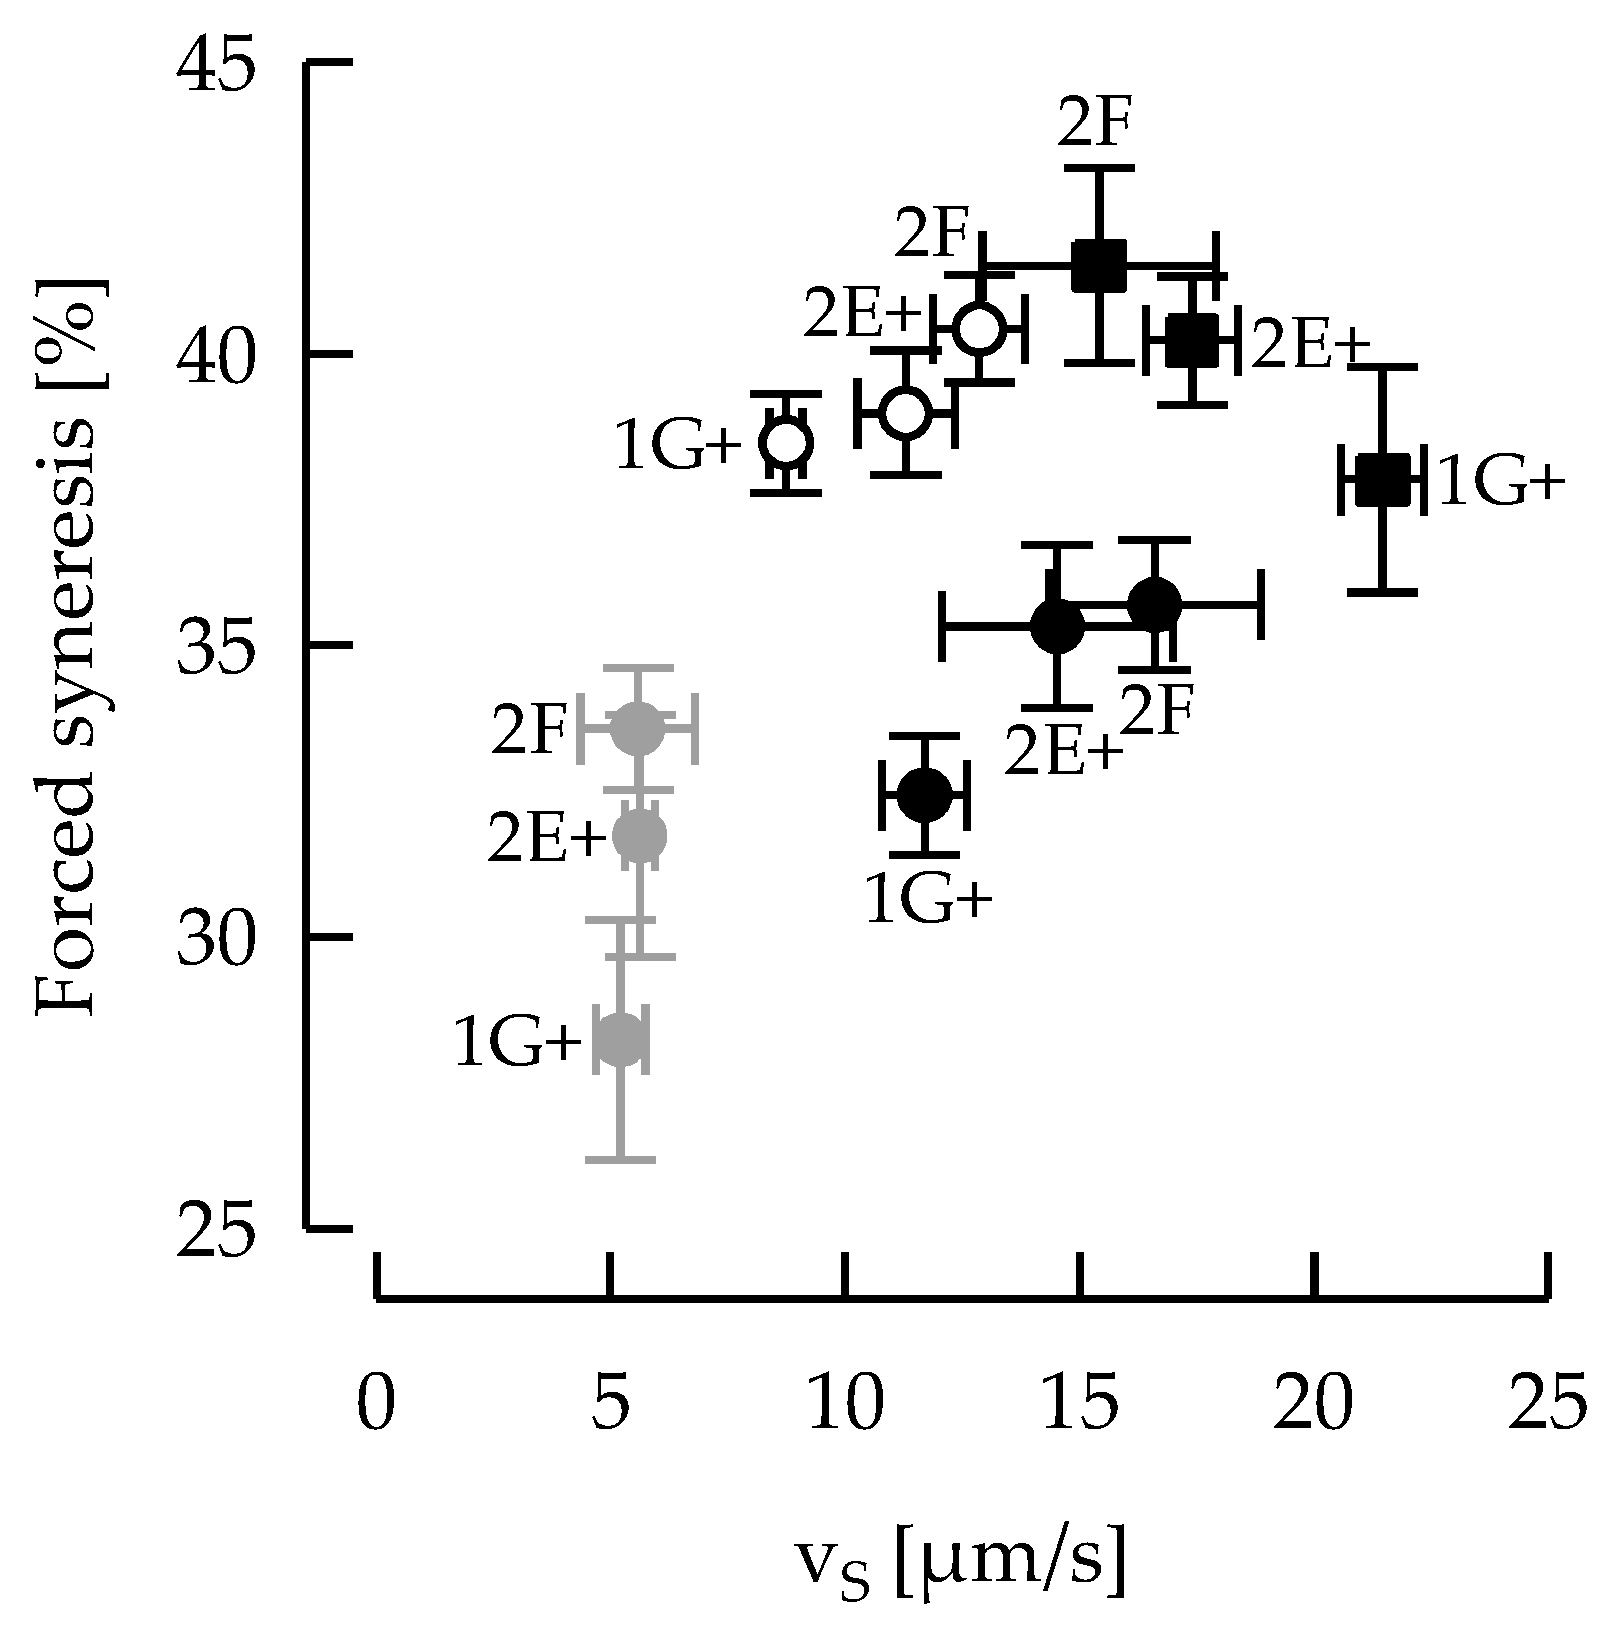
3.5. Ropy EPS Are Relevant for Shear Stability

The time-dependent shear stability of stirred gels to shear was investigated by hysteresis loop experiments following other studies, for instance [10,19,27]. The upward flow curves showed a sharp increase in shear stress with shear rate, followed by a nearly linear increase (Figure 6). With ropy EPS, the increase was slightly exponential and the final shear stress at 100/s was significantly higher (27–35 Pa) than with non-ropy EPS (15–22 Pa). The respective viscosity correlated significantly with the apparent viscosity at 100/s from the logarithmic flow curves (p < 0.01, slope: 0.85).
For all samples, the shear stress measured in the downward curve was lower, indicating significant time-dependent effects. The area between the two curves can be taken as an indicator of structural degradation caused by a defined shear regime [15,27]. In our study, this area was larger for gels made with ropy EPS (Table 2), confirming studies of other authors [13,18,41]. Both higher shear stress and a higher hysteresis area caused by ropy EPS indicate that the more structure is present, the more is destroyed. The hysteresis area was therefore scaled to the shear stress at 100/s, which was proposed as a measure of the degree of structural breakdown [27]. Gels from milk with a C/WP ratio of 1.5:1 had a significantly higher degree of structural breakdown (12.7 ± 1.02/s) than from C/WP = 4.0:1 (10.1 ± 1.14/s; p < 0.05), indicating lower shear stability. We found a negative correlation between the degree of shear-induced structural breakdown and fermentation time (r = -0.70; p < 0.05). Robinson et al. [38] also stated that gel networks are less connected after faster fermentation.
In the case of gels from milk with a C/WP ratio of 4.0:1, the degree of structural breakdown was marginally lower when ropy EPS (9.7 ± 0.67/s) instead of non-ropy EPS were present (10.7 ± 1.33/s). It can therefore be concluded that ropy EPS highly contribute to structure (higher shear stress at 100/s), which is only partly destroyed after shearing (higher hysteresis area), and a higher shear stability. During cold storage, the measure for the structural breakdown increased significantly from day 3 to day 14 (p < 0.05; slope: 1.2).

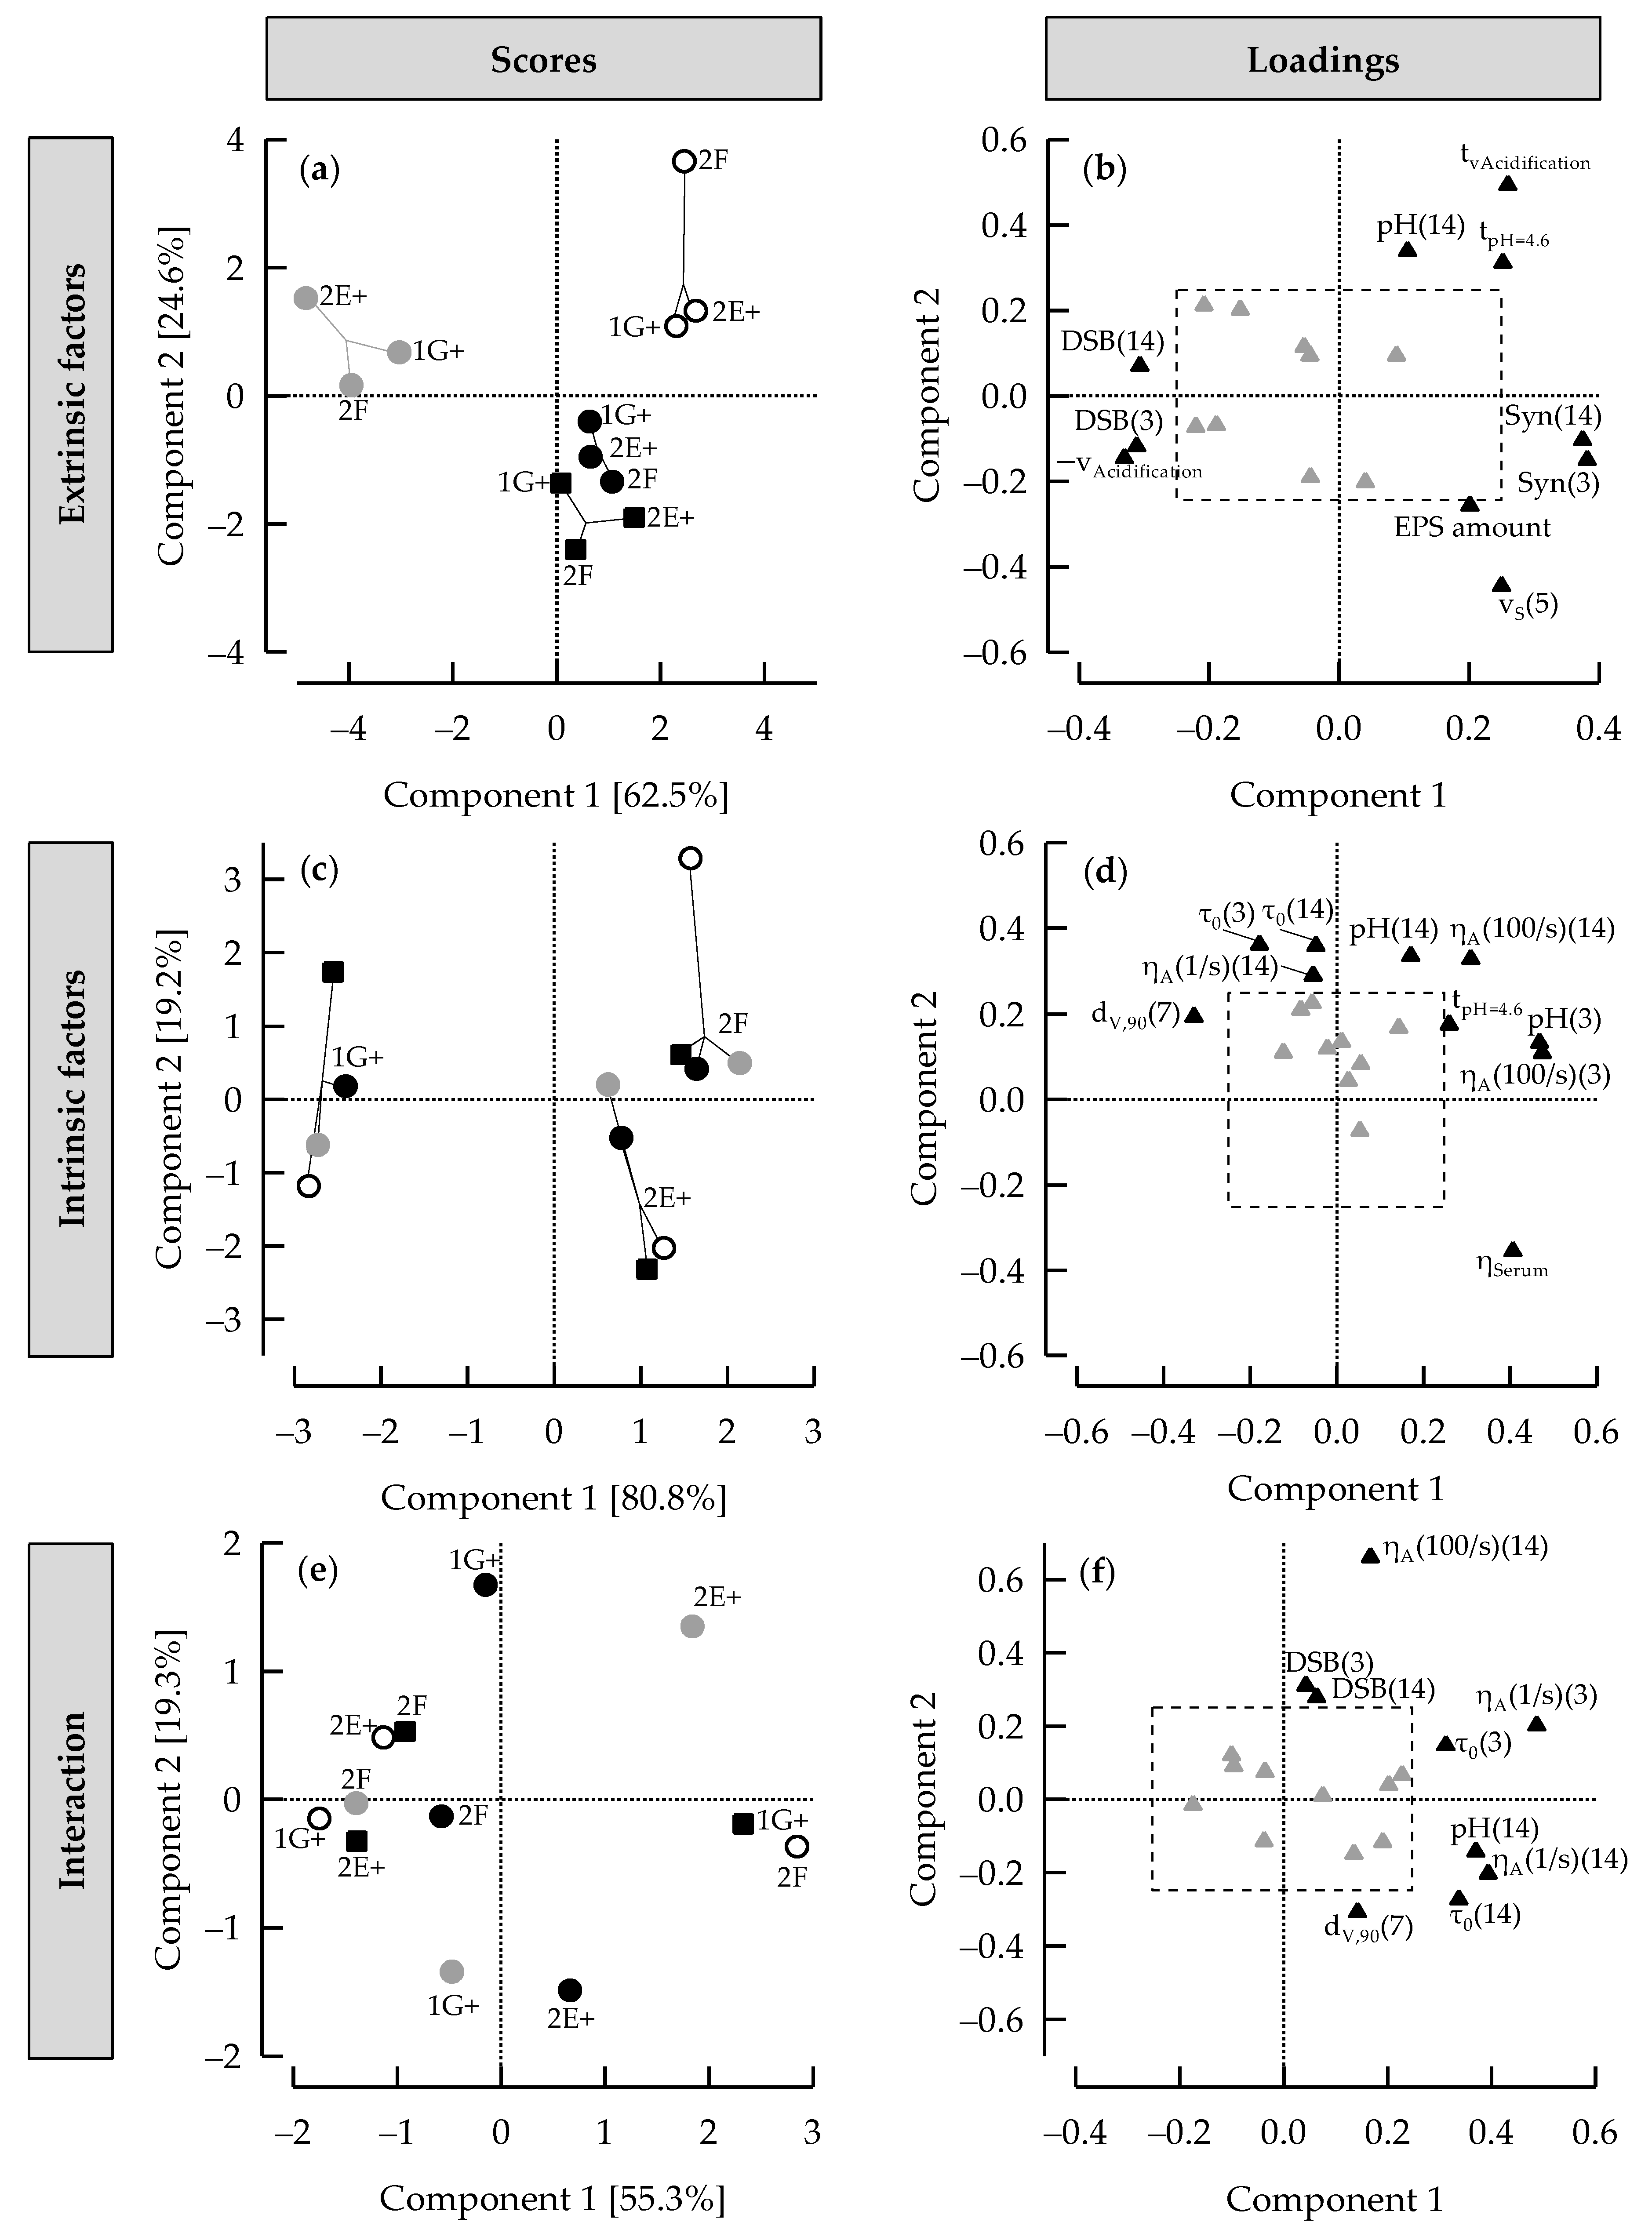
3.6. ASCA+ to Distinguish between Effects of Extrinsic and Intrinsic Factors on Stirred Gels

The relationship between controlled factors and the respective responses (e.g., EPS amount, texture properties) was explored by multivariate data analysis. Methods such as principal component analysis (PCA) search for linear combinations of responses that result in the highest amount of variance explained by all factors [42]. In our PCA, only 59% of the total variance was described by the first two components. However, to meet the Kaiser criterium (Eigenvalues > 1), components 1 to 4, explaining 85% of the variance, were necessary.
To distinguish between the effects caused by several factors, Smilde et al. [43] introduced a combination of ANOVA and PCA, the ASCA. For this analysis, the data are split into factors and interaction matrices by ANOVA, which are then fitted separately to an independent PCA model [44]. The following ANOVA model was used to study the effects of extrinsic (a) and intrinsic factors (b) on acidification kinetics, EPS amount, syneresis, and texture properties:
  x ab = µ + α a + β b + α β ab + ε ab
where µ is the overall mean of the response (x), αa and βb are the means related to the extrinsic or intrinsic factors, respectively, and (αβ)ab is their interaction. The variation not described by factors and interaction is taken into account in the residual term (εab) [44].
Permutation tests revealed more pronounced effects attributable to extrinsic (48.3%) than to intrinsic factors and their interaction (23.2% and 21.4%, respectively), which all had a significant impact (p = 0.001). Figure 7a shows the scores for the extrinsic factors, which clearly separate based on acidification activity and the C/WP ratio. Larger associated loadings (Figure 7b) refer to those scores that are more strongly explained by components 1 and 2. When considering loadings with ≥ |0.25| per component, the extrinsic factors mainly influenced acidification kinetics, EPS amount, syneresis, and the degree of structural breakdown. Other texture properties such as the particle size, apparent viscosity at 100/s, and serum viscosity had loadings ≥ |0.25| for intrinsic factors (Figure 7d). In the respective score plot (Figure 7c), the S. thermophilus strains were separated by component 1 specifically into ropy or non-ropy EPS producers. In the direction of loadings for yield stress were scores for stirred gels with ST-1G+ after fermentation at 42 °C or when using starters with low acidification activity of ST-2F. The loadings for apparent viscosity at 1/s after 3 d were <0.25 for both factors and were therefore included in the interaction (Figure 7e,f). However, interpretation of the interaction is not intuitive as this submodel is based on the deviation of the main effects [42,44]. Unlike PCA, the number of components is different for each factor; therefore, interaction scores are not suitable for assessing similarity based on the distance between points [42]. Consequently, a discrimination can only be made within each factor. In our study, differences within the extrinsic and intrinsic factors were mainly observed for the C/WP ratio and ST-1G+, respectively.
The ASCA+ analysis clearly showed that the effect size of extrinsic factors is more than twice as high as the effect size of the intrinsic factors or their interaction. While extrinsic factors mainly affected the acidification, EPS amount, and syneresis, the ropy EPS largely determined the texture properties. cEPS were able to reduce syneresis, with this effect being more pronounced after enrichment of base milk with whey proteins. As there was no strong relationship with texture properties, the EPS amount alone cannot exclusively serve to explain the techno-functionality of the EPS in the gels (see also [13,18]). This means that other factors such as the EPS location and interactions are more relevant for the development of structure and texture.
Figure 8 shows a schematic representation of microstructure of stirred gels as affected by EPS type. Non-ropy EPS are most likely located in the pores, whereas ropy EPS were assumed to interact with gel particles [10,15]. We found a higher serum viscosity with ropy EPS and concluded that these EPS were also freely present in the serum. Thus, ropy EPS can accumulate, which was already observed by microscopic visualization of EPS in stirred gels [10]. The shear-induced rearrangements result in more intense interactions between ropy EPS rather than between protein and EPS, which can impair protein–protein interactions (smaller gel particles, lower yield stress) and could provoke ropiness.

4. Conclusions

The ASCA+ analysis revealed a more than twice as high effect size of extrinsic factors compared to the effect size of intrinsic factors or its interaction. From the loading plots, however, it is obvious that ropy EPS mainly determine texture properties, while manufacturing parameters primarily affect acidification kinetics and the EPS amount. Capsular EPS reduced the syneresis, but the enrichment of base milk with whey protein was more efficient. The EPS amount was higher in case of base milk with a higher casein:whey protein ratio or when the fermentation temperature was lower; however, the EPS amount did not correlate with texture properties. This indicates that factors such as the water-binding capacity of capsular EPS may be important to reduce the syneresis, and specific structural properties of ropy EPS are very likely to improve the texture of fermented milk via enhanced EPS–protein interactions, which will both be discussed in a forthcoming study.

Author Contributions

Conceptualization, G.S. and D.J.; methodology, G.S. and D.J.; validation, G.S., H.R. and D.J.; investigation, G.S.; resources, G.S.; writing—original draft preparation, G.S.; writing—review and editing, H.R. and D.J.; visualization, G.S.; supervision, H.R. and D.J.; project administration, H.R. and D.J.; funding acquisition, H.R. and D.J. All authors have read and agreed to the published version of the manuscript.

Funding

The IGF Projects 18318 BR and 20769 BR of the FEI were supported via AiF within the program for promoting the Industrial Collective Research (IGF) of the Federal Ministry of Economic Affairs and Climate Action (BMWK), based on a resolution of the German Parliament.

Institutional Review Board Statement

Not applicable.

Informed Consent Statement

Not applicable.

Data Availability Statement

Not applicable.

Acknowledgments

The assistance of Eric Bach and Anton Müller in obtaining the data on stirred skim milk gels is gratefully acknowledged. We would like to thank Chr. Hansen A/S (Hørsholm, Denmark) and DSM Food Specialties B.V. (Delft, The Netherlands) for providing strains. Special thanks also go to Frank Babick and André Kupka from Research Group of Mechanical Process Engineering (Institute of Process Engineering and Environmental Technology, Technische Universität Dresden, Dresden, Germany) for providing the LUMiSizer® and corresponding support.

Conflicts of Interest

The authors declare no conflict of interest.

References

  1. Walstra, P.; Wouters, J.T.M.; Geurts, T.J. Dairy Science and Technology; CRC Press: New York, NY, USA, 2006. [Google Scholar]
  2. FAO/WHO. Codex Alimentarius International Food Standards: Codex Standard for Fermented Milks; Food and Agriculture Organisation of the United Nations/World Health Organisation: Geneva, Switzerland, 2003; CODEX STAN 243-2003. [Google Scholar]
  3. Mokoonlall, A.; Nöbel, S.; Hinrichs, J. Post-processing of fermented milk to stirred products: Reviewing the effects on gel structure. Trends Food Sci. Technol. 2016, 54, 26–36. [Google Scholar] [CrossRef]
  4. Román, S.; Sánchez-Siles, L.M.; Siegrist, M. The importance of food naturalness for consumers: Results of a systematic review. Trends Food Sci. Technol. 2017, 67, 44–57. [Google Scholar] [CrossRef]
  5. Mende, S.; Rohm, H.; Jaros, D. Influence of exopolysaccharides on the structure, texture, stability and sensory properties of yoghurt and related products. Int. Dairy J. 2016, 52, 57–71. [Google Scholar] [CrossRef]
  6. Zeidan, A.A.; Poulsen, V.K.; Janzen, T.; Buldo, P.; Derkx, P.M.F.; Øregaard, G.; Neves, A.R. Polysaccharide production by lactic acid bacteria: From genes to industrial applications. FEMS Microbiol. Rev. 2017, 41, S168–S200. [Google Scholar] [CrossRef] [Green Version]
  7. Zhou, Y.; Cui, Y.; Qu, X. Exopolysaccharides of lactic acid bacteria: Structure, bioactivity and associations: A review. Carbohydr. Polym. 2019, 207, 317–332. [Google Scholar] [CrossRef] [PubMed]
  8. van de Velde, F.; de Hoog, E.H.A.; Oosterveld, A.; Tromp, R.H. Protein-polysaccharide interactions to alter texture. Annu. Rev. Food Sci. Technol. 2015, 6, 371–388. [Google Scholar] [CrossRef]
  9. Nguyen, A.T.B.; Nigen, M.; Jimenez, L.; Ait-Abderahim, H.; Cunault, C.; Marchesseau, S.; Picart-Palmade, L. A multi-scale approach to identify the role of heat treatment, milk protein composition and starter culture on the gel formation and the texture defects of acid milk gel. Food Hydrocoll. 2018, 85, 299–310. [Google Scholar] [CrossRef]
  10. Zhang, L.; Folkenberg, D.M.; Amigo, J.M.; Ipsen, R. Effect of exopolysaccharide-producing starter cultures and post-fermentation mechanical treatment on textural properties and microstructure of low-fat yoghurt. Int. Dairy J. 2016, 53, 10–19. [Google Scholar] [CrossRef]
  11. Khanal, S.N.; Lucey, J.A. Effect of fermentation temperature on the properties of exopolysaccharides and the acid gelation behaviour for milk fermented by Streptococcus thermophilus strains DGCC7785 and ST-143. J. Dairy Sci. 2018, 101, 3799–3811. [Google Scholar] [CrossRef]
  12. Amatayakul, T.; Sherkat, F.; Shah, N.P. Physical characteristics of set yoghurt made with altered casein to whey protein ratios and EPS-producing starter cultures at 9 and 14% total solids. Food Hydrocoll. 2006, 20, 314–324. [Google Scholar] [CrossRef]
  13. Buldo, P.; Benfeldt, C.; Folkenberg, D.M.; Jensen, H.B.; Amigo, J.M.; Sieuwerts, S.; Thygesen, K.; van den Berg, F.; Ipsen, R. The role of exopolysaccharide-producing cultures and whey protein ingredients in yoghurt. LWT Food Sci. Technol. 2016, 72, 189–198. [Google Scholar] [CrossRef]
  14. Mende, S.; Peter, M.; Bartels, K.; Rohm, H.; Jaros, D. Addition of purified exopolysaccharide isolates from S. thermophilus to milk and their impact on the rheology of acid gels. Food Hydrocoll. 2013, 32, 178–185. [Google Scholar] [CrossRef]
  15. Folkenberg, D.M.; Dejmek, P.; Skriver, A.; Ipsen, R. Interactions between EPS-producing Streptococcus thermophilus strains in mixed yoghurt cultures. J. Dairy Res. 2006, 73, 385–393. [Google Scholar] [CrossRef] [PubMed]
  16. Vaningelgem, F.; Zamfir, M.; Mozzi, F.; Adriany, T.; Vancanneyt, M.; Swings, J.; De Vuyst, L. Biodiversity of exopolysaccharides produced by Streptococcus thermophilus strains is reflected in their production and their molecular and functional characteristics. Appl. Environ. Microbiol. 2004, 70, 900–912. [Google Scholar] [CrossRef] [PubMed] [Green Version]
  17. Hamet, M.F.; Piermaria, J.A.; Abraham, A.G. Selection of EPS-producing Lactobacillus strains isolated from kefir grains and rheological characterization of the fermented milks. LWT Food Sci. Technol. 2015, 63, 129–135. [Google Scholar] [CrossRef]
  18. Mende, S.; Mentner, C.; Thomas, S.; Rohm, H.; Jaros, D. Exopolysaccharide production by three different strains of Streptococcus thermophilus and its effect on physical properties of acidified milk. Eng. Life Sci. 2012, 12, 466–474. [Google Scholar] [CrossRef]
  19. Jaros, D.; Haque, A.; Kneifel, W.; Rohm, H. Influence of the starter culture on the relationship between dry matter content and physical properties of stirred yogurt. Milchwiss. Milk Sci. Int. 2002, 57, 447–450. [Google Scholar]
  20. Skriver, A.; Roemer, H.; Qvist, K.B. Rheological characterization of stirred yoghurt: Viscometry. J. Texture Stud. 1993, 24, 185–198. [Google Scholar] [CrossRef]
  21. Bullard, J.; St-Gelais, D.; Turgeon, S.L. Production of set yoghurts using thermophilic starters composed of two strains with different growth biocompatibilities and producing different exopolysaccharides. Int. Dairy J. 2018, 79, 33–42. [Google Scholar] [CrossRef]
  22. Surber, G.; Mende, S.; Jaros, D.; Rohm, H. Clustering of Streptococcus thermophilus strains to establish a relation between exopolysaccharide characteristics and gel properties of acidified milk. Foods 2019, 8, 146. [Google Scholar] [CrossRef] [Green Version]
  23. EN ISO 8968-1:2014; ISO Milk and Milk Products—Determination of Nitrogen Content—Part 1: Kjeldahl Principle and Crude Protein Calculation. German Version. International Organization for Standardization: Geneva, Switzerland, 2014.
  24. EN ISO/DIS 8968-4:2013; ISO Milk and Milk Products—Determination of Nitrogen Content—Part 4: Determination of Protein and Non Protein Nitrogen Content and True Protein Content Calculation (Reference Method). German Version. International Organization for Standardization: Geneva, Switzerland, 2013.
  25. ISO 17997-1:2004; ISO Milk—Determination of Casein-Nitrogen Content—Part 1: Indirect Method (Reference Method). International Organization for Standardization: Geneva, Switzerland, 2004.
  26. Dubois, M.; Gilles, K.A.; Hamilton, J.K.; Rebers, P.A.; Smith, F. Colorimetric method for determination of sugars and related substances. Anal. Chem. 1956, 28, 350–356. [Google Scholar] [CrossRef]
  27. Jaros, D.; Heidig, C.; Rohm, H. Enzymatic modification through microbial transglutaminase enhances the viscosity of stirred yogurt. J. Texture Stud. 2007, 38, 179–198. [Google Scholar] [CrossRef]
  28. Thiel, M.; Féraud, B.; Govaerts, B. ASCA+ and APCA+: Extensions of ASCA and APCA in the analysis of unbalanced multifactorial designs. J. Chemom. 2017, 31, 2895. [Google Scholar] [CrossRef]
  29. Saccenti, E.; Smilde, A.K.; Camacho, J. Group-Wise ANOVA Simultaneous Component analysis for designed omics experiments. Metabolomics 2018, 14, 1–18. [Google Scholar] [CrossRef] [Green Version]
  30. Oliveira, M.N.; Sodini, I.; Remeuf, F.; Corrieu, G. Effect of milk supplementation and culture composition on acidification, textural properties and microbiological stability of fermented milks containing probiotic bacteria. Int. Dairy J. 2001, 11, 935–942. [Google Scholar] [CrossRef]
  31. Purwandari, U.; Shah, N.P.; Vasiljevic, T. Effects of exopolysaccharide-producing strains of Streptococcus thermophilus on technological and rheological properties of set-type yoghurt. Int. Dairy J. 2007, 17, 1344–1352. [Google Scholar] [CrossRef]
  32. Li, D.; Li, J.; Zhao, F.; Wang, G.; Qin, Q.; Hao, Y. The influence of fermentation condition on production and molecular mass of EPS produced by Streptococcus thermophilus 05-34 in milk-based medium. Food Chem. 2016, 197, 367–372. [Google Scholar] [CrossRef]
  33. Shene, C.; Canquil, N.; Bravo, S.; Rubilar, M. Production of the exopolysaccharides by Streptococcus thermophilus: Effect of growth conditions on fermentation kinetics and intrinsic viscosity. Int. J. Food Microbiol. 2008, 124, 279–284. [Google Scholar] [CrossRef] [PubMed]
  34. Remeuf, F.; Mohammed, S.; Sodini, I.; Tissier, J.P. Preliminary observations on the effects of milk fortification and heating on microstructure and physical properties of stirred yogurt. Int. Dairy J. 2003, 13, 773–782. [Google Scholar] [CrossRef]
  35. Hassan, A.N.N.; Frank, J.F.; Schmidt, K.A.A.; Shalabi, S.I.I. Textural properties of yogurt made with encapsulated non-ropy lactic cultures. J. Dairy Sci. 1996, 79, 2098–2103. [Google Scholar] [CrossRef]
  36. Amatayakul, T.; Halmos, A.L.; Sherkat, F.; Shah, N.P. Physical characteristics of yoghurts made using exopolysaccharide-producing starter cultures and varying casein to whey protein ratios. Int. Dairy J. 2006, 16, 40–51. [Google Scholar] [CrossRef]
  37. Mende, S.; Dong, T.; Rathemacher, A.; Rohm, H.; Jaros, D. Physicochemical characterisation of the exopolysaccharides of Streptococcus thermophilus ST-143. Int. J. Food Sci. Technol. 2014, 49, 1254–1263. [Google Scholar] [CrossRef]
  38. Robinson, R.K.; Lucey, J.A.; Tamime, A.Y. Manufacture of Yoghurt. In Fermented Milks; Tamime, A.Y., Ed.; Blackwell Publishing: Oxford, UK, 2006; pp. 53–75. [Google Scholar]
  39. Knudsen, J.C.; Karlsson, A.O.; Ipsen, R.; Skibsted, L.H. Rheology of stirred acidified skim milk gels with different particle interactions. Colloids Surf. A Physicochem. Eng. Asp. 2006, 274, 56–61. [Google Scholar] [CrossRef]
  40. Hahn, C.; Müller, E.; Wille, S.; Weiss, J.; Atamer, Z.; Hinrichs, J. Control of microgel particle growth in fresh cheese (concentrated fermented milk) with an exopolysaccharide-producing starter culture. Int. Dairy J. 2014, 36, 46–54. [Google Scholar] [CrossRef]
  41. Folkenberg, D.M.; Dejmek, P.; Skriver, A.; Skov Guldager, H.; Ipsen, R. Sensory and Rheological screening of exopolysaccharide producing strains of bacterial yoghurt cultures. Int. Dairy J. 2006, 16, 111–118. [Google Scholar] [CrossRef]
  42. Bertinetto, C.; Engel, J.; Jansen, J. ANOVA Simultaneous component analysis: A tutorial review. Anal. Chim. Acta X 2020, 6, 100061. [Google Scholar] [CrossRef]
  43. Smilde, A.K.; Jansen, J.J.; Hoefsloot, H.C.J.; Lamers, R.J.A.N.; van der Greef, J.; Timmerman, M.E. ANOVA-simultaneous component analysis (ASCA): A new tool for analysing designed metabolomics data. Bioinformatics 2005, 21, 3043–3048. [Google Scholar] [CrossRef]
  44. Saccenti, E.; Camacho, J. Multivariate exploratory data analysis using component models. Compr. Foodomics 2021, 241–268. [Google Scholar] [CrossRef]
Figure 1. (a) Maximum acidification rate (vAcidification) and (b) fermentation time until pH 4.6 (tpH=4.6) versus time at vAcidification (tvAcidification) of milk with a C/WP ratio of 4.0:1 after fermentation with low activity starters at 37 °C (white circles). Black circles, similar conditions but fermentation with high-activity starters. Black squares, fermentation with high-activity starters at 42 °C. Grey circles, fermentation of milk with a C/WP ratio of 1.5:1 with high-activity starters at 37 °C.
Dairy 03 00052 g001
Figure 2. (a) EPS amount and (b) dynamic viscosity of serum phase (ηserum) of stirred gels from milk with a C/WP ratio of 4.0:1 after fermentation with low activity starters at 37 °C (white circles). Black circles, similar conditions but fermentation with high-activity starters. Black squares, fermentation with high-activity starters at 42 °C. Grey circles, fermentation of milk with a C/WP ratio of 1.5:1 with high-activity starters at 37 °C. Symbols are slightly shifted along the x-axis for a better visibility.
Dairy 03 00052 g002
Figure 3. Forced syneresis after 3 d (n = 12) versus sedimentation velocity (vS) after 5 d (n = 4) of cold storage of stirred gels from milk with a C/WP ratio of 4.0:1 after fermentation with low activity starters at 37 °C (white circles). Black circles, similar conditions but fermentation with high-activity starters. Black squares, fermentation with high-activity starters at 42 °C. Grey circles, fermentation of milk with a C/WP ratio of 1.5:1 with high-activity starters at 37 °C.
Dairy 03 00052 g003
Figure 4. Confocal laser scanning micrographs of the protein phase of stirred gels after 7 d of cold storage. Gels were produced from base milk with casein:whey protein ratio of 4.0:1 or 1.5:1 by inoculation with direct starters of high acidification activity and fermentation at 37 °C. Proteins appear in white, serum in black. Scale bar, 50 μm.
Dairy 03 00052 g004
Figure 5. Apparent shear viscosity (ηA) versus shear stress (τ) (n = 6) of stirred gels produced with ST-1G+ (white), ST-2E+ (grey) or ST-2F (black) after 3 d of cold storage. The arrow indicates shear rate increase, dotted lines refer to static yield stress of the respective samples. Gels were produced from base milk with casein:whey protein ratio of 4.0:1 or 1.5:1 by inoculation with low- or high-activity starters, fermentation temperature was 37 °C or 42 °C.
Dairy 03 00052 g005
Figure 6. Shear stress (τ) versus shear rate ( γ ˙ ) (n = 1) of stirred gels produced with ST-1G+ (white), ST-2E+ (grey) or ST-2F (black) after 3 d of cold storage. Gels were produced from base milk with casein:whey protein ratio of 4.0:1 or 1.5:1 by inoculation with low- or high-activity starters, fermentation temperature was 37 °C or 42 °C. Arrows indicate direction of measurement.
Dairy 03 00052 g006
Figure 7. Averaged scores (dimensionless) of the (a) extrinsic and (c) intrinsic factors as well as their (e) interaction of ASCA+ analysis (for explanation of circles and squares see caption of Figure 1). Variance of component is indicated as percentage in square brackets. Loadings (b,d,f); dimensionless) that were ≥ |0.25| (indicated by dashed line) in one component are labeled with: Syn, forced syneresis; DSB, degree of structural breakdown and see text as well as figure captions (black triangles). The information in round brackets indicates the cold storage period in days. All other loadings are displayed as grey triangles. Please note different x- and y-axis scaling in charts.
Dairy 03 00052 g007
Figure 8. Schematic representation of the microstructure of stirred gels: casein associated with denatured whey protein (black, open), ropy or non-ropy EPS (grey) and cells (black, closed) with capsular EPS (dark gray border) in the serum (white).
Dairy 03 00052 g008
Table 1. Particle size (dV,90, µm) of stirred gels after 7 d of cold storage (n = 4). Gels were produced from base milk with casein:whey protein ratio of 4.0:1 or 1.5:1 by inoculation with low- or high-activity starters and fermentation at a fermentation temperature of 37 °C or 42 °C 1.
Casein: Whey Protein Ratio
(Acidification Activity of Direct Starter)
Temperature [°C]Strain4.0:1 (Low)4.0:1 (High)1.5:1 (High)
37ST-1G+34 c ± 1.429 d ± 3.242 b ± 4.5
ST-2E+23 e ± 1.024 e ± 1.322 e ± 1.3
ST-2F33 c ± 3.624 e ± 0.623 e ± 1.1
42ST-1G+ 50 a ± 4.4
ST-2E+33 c,d ± 0.8
ST-2F37 c ± 2.2
1 Arithmetic mean ± standard deviation. Means with different letters are significantly different (p < 0.05).
Table 2. Hysteresis area (Pa/s) of stirred gel after 3 d of cold storage (n = 4). Gels were produced from base milk with casein:whey protein ratio of 4.0:1 or 1.5:1 by inoculation with low- or high-activity starters and fermentation at a fermentation temperature of 37 °C or 42 °C 1.
Casein: Whey Protein Ratio
(Acidification Activity of Direct Starter)
Temperature [°C]Strain4.0:1 (Low)4.0:1 (High)1.5:1 (High)
37ST-1G+126 g ± 11.7164 e,f,g ± 23.9199 d,e,f ± 11.2
ST-2E+204 d,e,f ± 20.1206 d,e ± 15.4389 a ± 51.7
ST-2F137 f,g ± 9.3237 c,d ± 11.8303 b,c ± 47.7
42ST-1G+ 206 d,e ± 18.7
ST-2E+ 217 d,e ± 17.6
ST-2F 344 a,b ± 43.3
1 Arithmetic mean ± standard deviation. Means with different letters are significantly different (p < 0.05).
Publisher’s Note: MDPI stays neutral with regard to jurisdictional claims in published maps and institutional affiliations.

