
Packaging Weight, Filling Ratio and Filling Efficiency of Yogurt and Relevant Packagings Depending on Commercial Packaging Design, Material, Packaging Type and Filling Quantity

 , ,
, , 
Abstract
:1. Introduction
1.1. Relevance of Packaging for the Environment
1.2. Packaging Consumption in Germany
1.3. Materials and Packaging Production Process for Yogurt Packaging
1.4. Packaging Efficiencies
1.5. Intention of This Study and Hypotheses
2. Materials and Methods
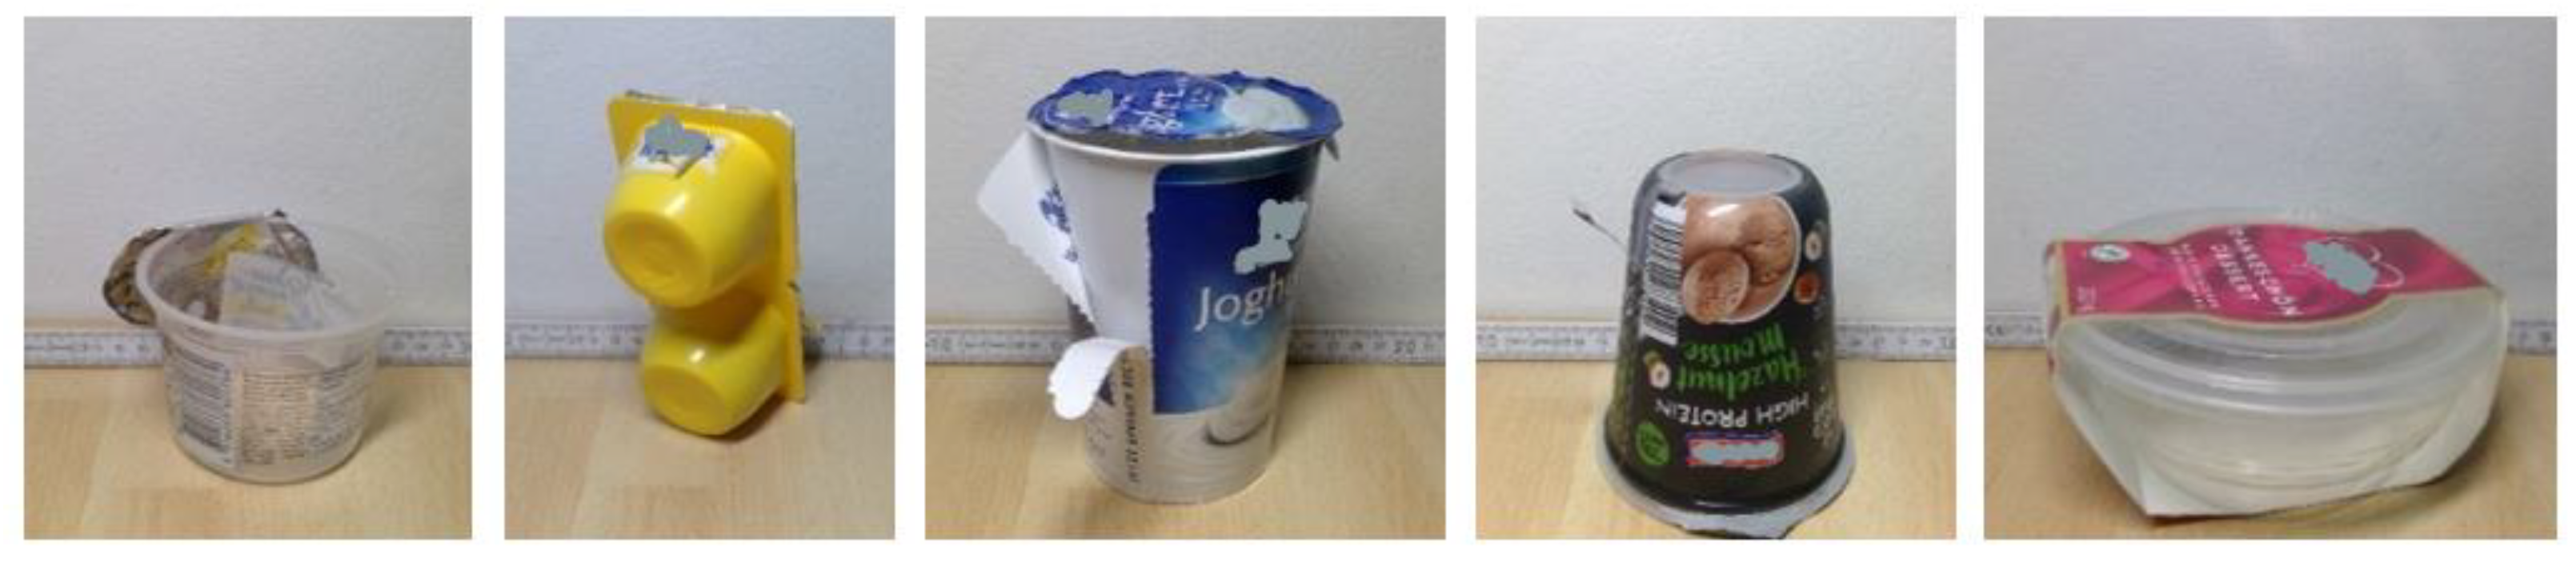
2.1. Sample Acquisition
2.2. Sample Processing
2.3. Packaging Classification
- Category: yogurt, dessert, drink yogurt, Skyr, cream cheese, curd, drink, yogurt alternative such as soya-drink or coconut-drink;
- Packaging: Cup, bottle, glass jar and other glass packaging, bucket, pouch, brick made of beverage carton;
- Materials: PP, PS, PE-HD, PET, rPET, paper laminate, glass single-use and multi-use
- Lid material: aluminium, PP, PET, metal, paper laminate, PE-HD;
- Decoration and decoration material: direct printing, plastic label, paper label, shrink sleeve, carton sleeve, secondary packaging;
- Label category: in-mould label, carton-plastic combination;
- Secondary packaging material: carton, plastic, plastic and aluminium lid, lid made of PET- or PP-film;
- Secondary packaging: sleeve, lid, top-up, separate cup (e.g., for honey);
- Production method: thermoforming, injection moulding, film extrusion, injection-blow-moulding, extrusion-blow moulding, extrusion coating, lamination, glass forming;
- Shape: round, cornered, pouch;
- Optical properties: white, transparent, brown, multi-colour;
- Board type: FSC-mix, primary fibre, pulp, secondary fibre;
- Marketing aspects: health claims (‘Actimel’), surrogate product, Ayran, fruit yogurt for children, Greek yogurt, yogurt with corner, yogurt with foot-segment at packaging (‘Zott’), yogurt with top-up, kefir, ‘Müllermilch’, curd, ‘Quetschies’ (yogurt in pouch), Skyr, street-food to go, drink yogurt;
- Disposal note: all disposal notes, post-consumer recycling system, green dot, carton sleeve to be separated from cup, deposit information, no information about disposal.
- Company of cup production;
- Recycling advice, remarks, certificates;
- Printing techniques;
- Light transmission (visual evaluation);
- Pressure resistance (haptically evaluation).
2.4. Measuring of Weights
- Cup weight without label;
- Cup weight with fixed label (with IML or paper label);
- Lid weight, label weight;
- Outer packaging weight; and
- The maximum rim full volume of the container.
3. Results and Discussion
3.1. Product Categories, Packaging Means, Bundles, Filling Weight Distributions, Filling Ratios, Materials and Processes for Packaging Production
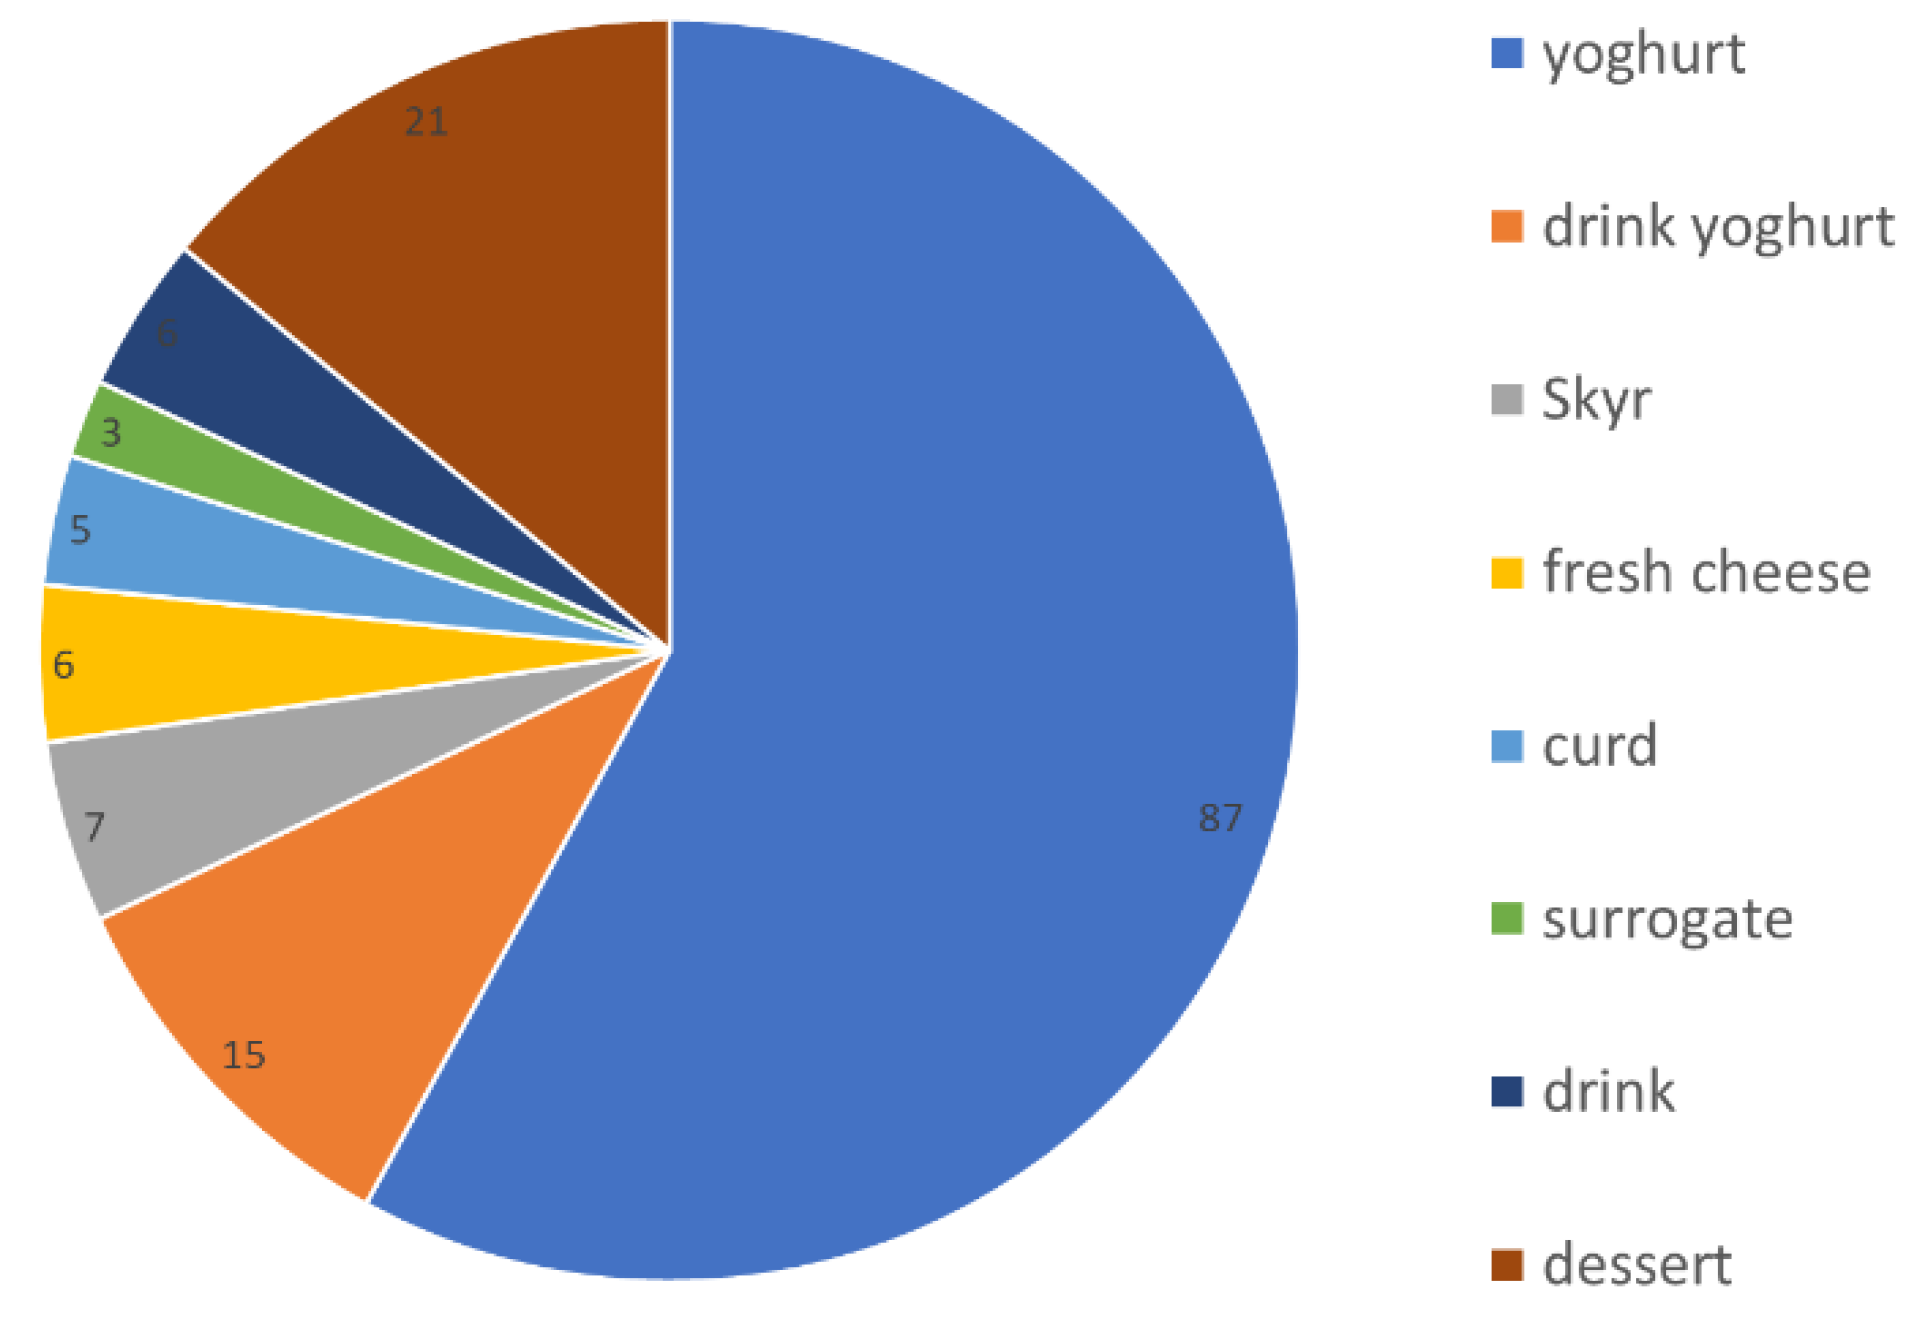
3.1.1. Product Categories
3.1.2. Packaging Means
3.1.3. Bundles
3.1.4. Filling Weight Distribution
3.1.5. Filling Ratio
3.1.6. Materials and Processes for Packaging Material Production
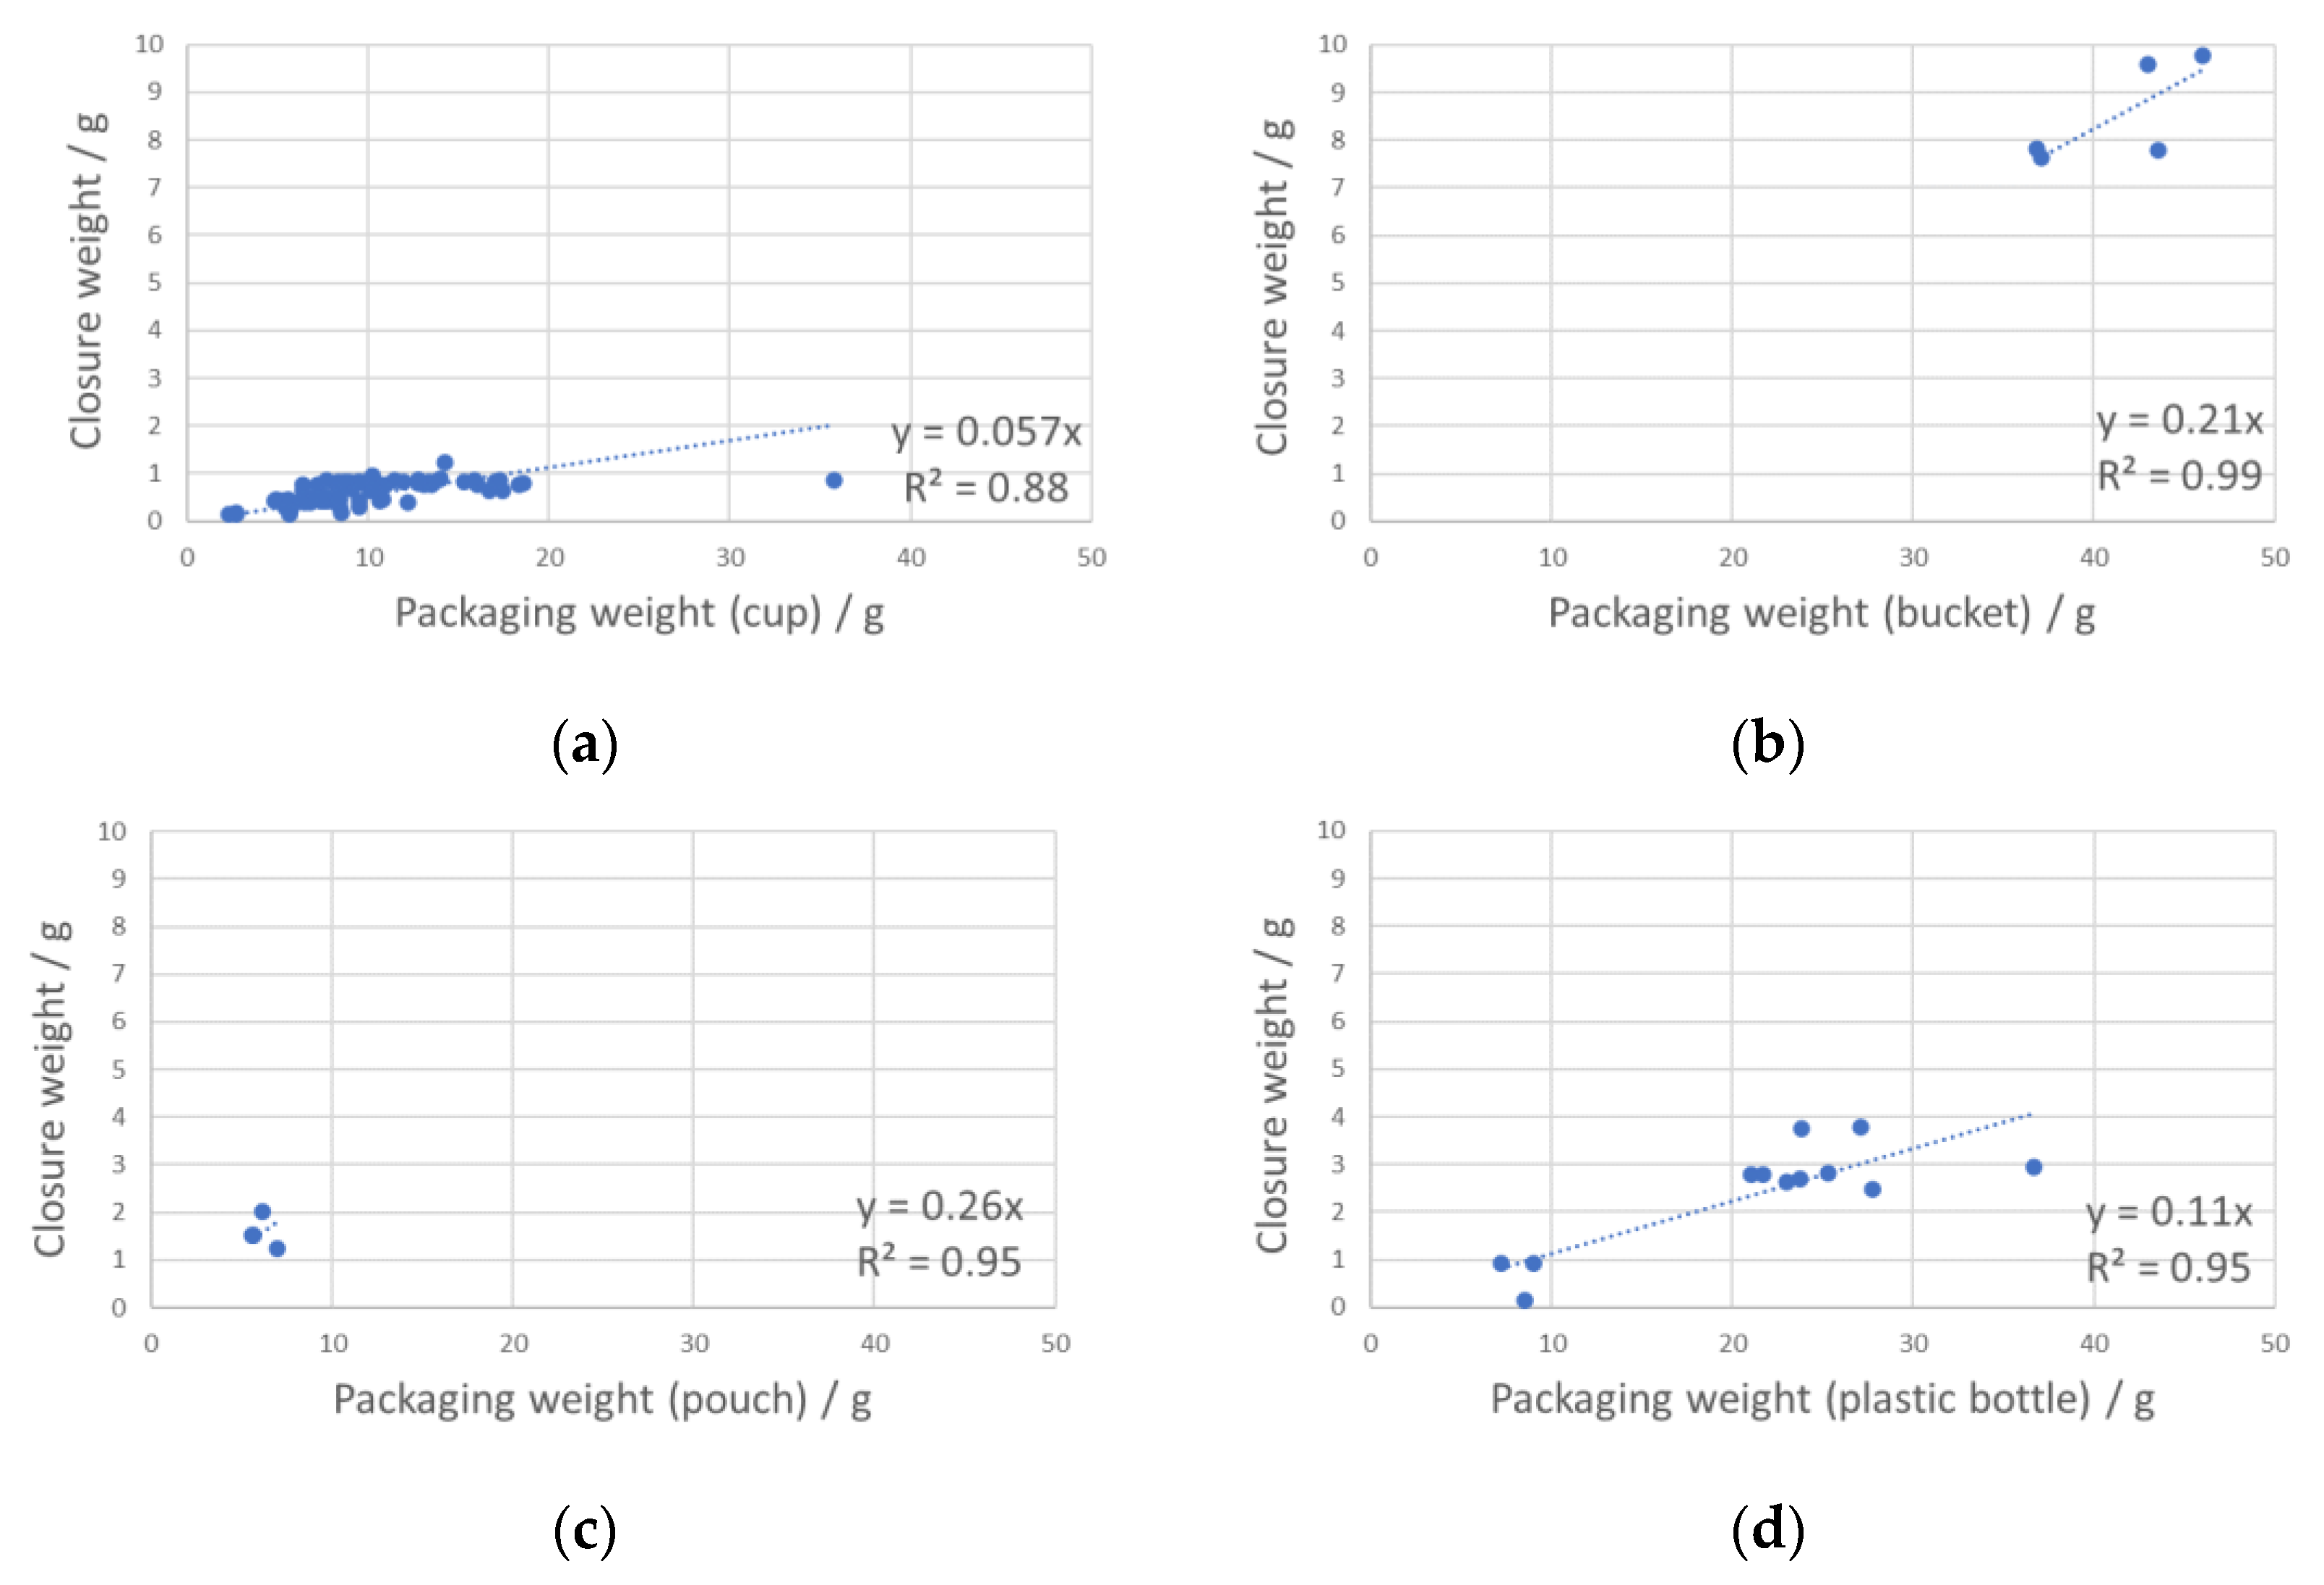
3.2. Closure to Packaging Weight Ratio
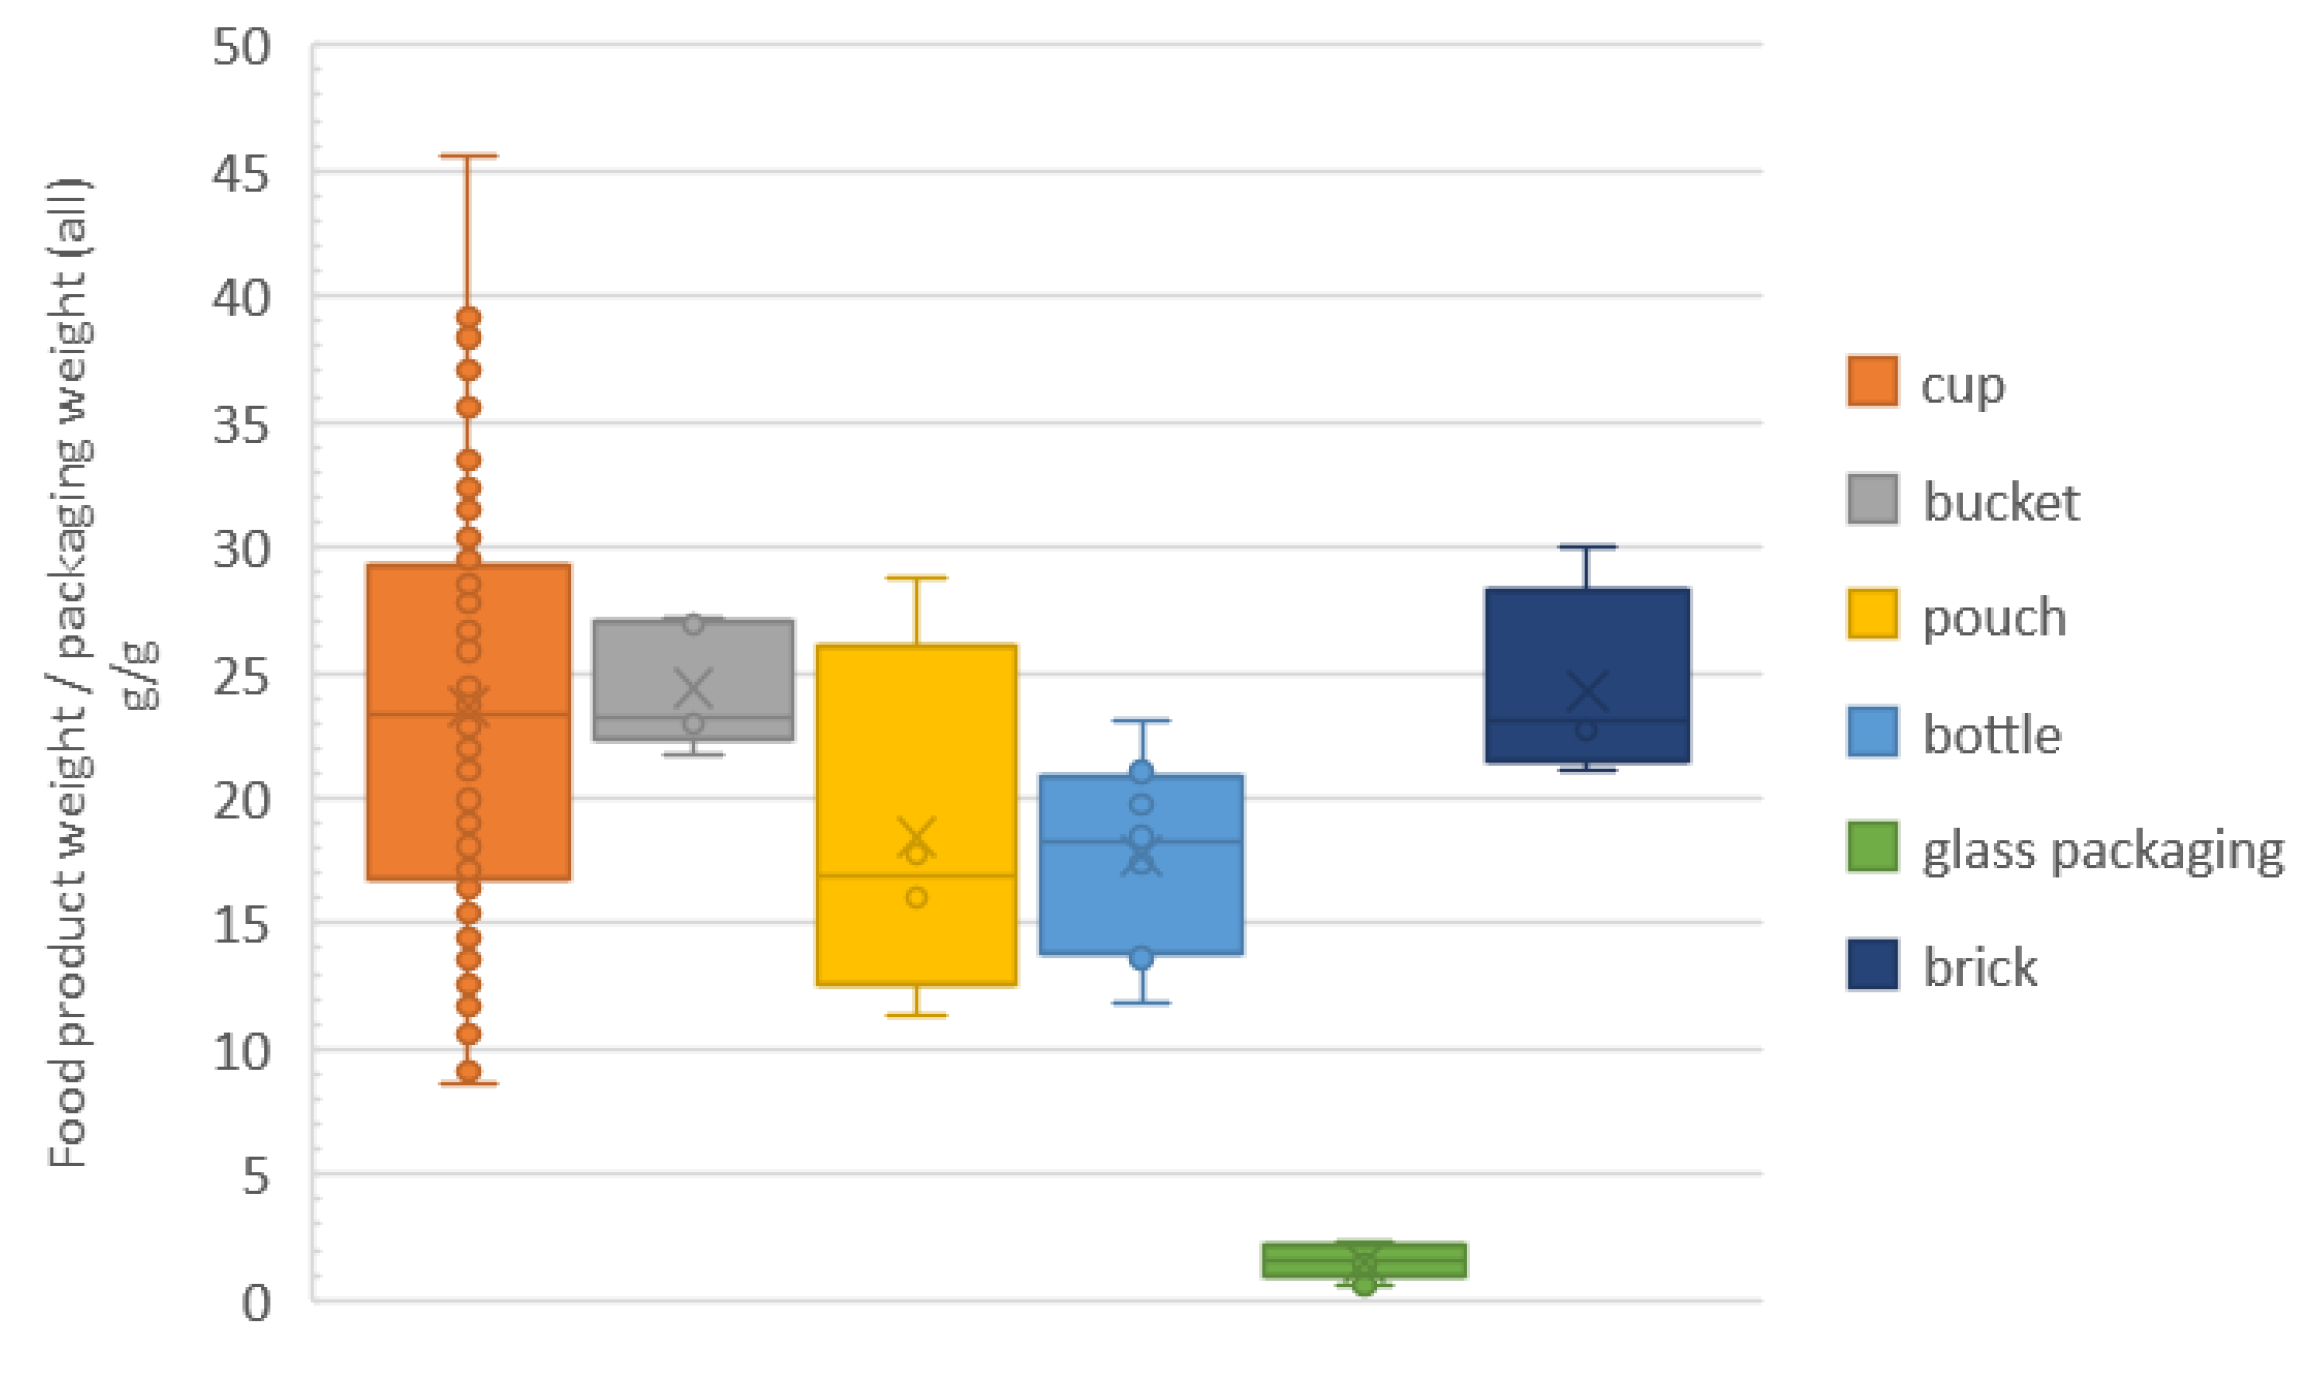
3.3. Packaging Efficiencies at All Different Types of Packaging
Packaging Efficiencies Related to Food Product Weight
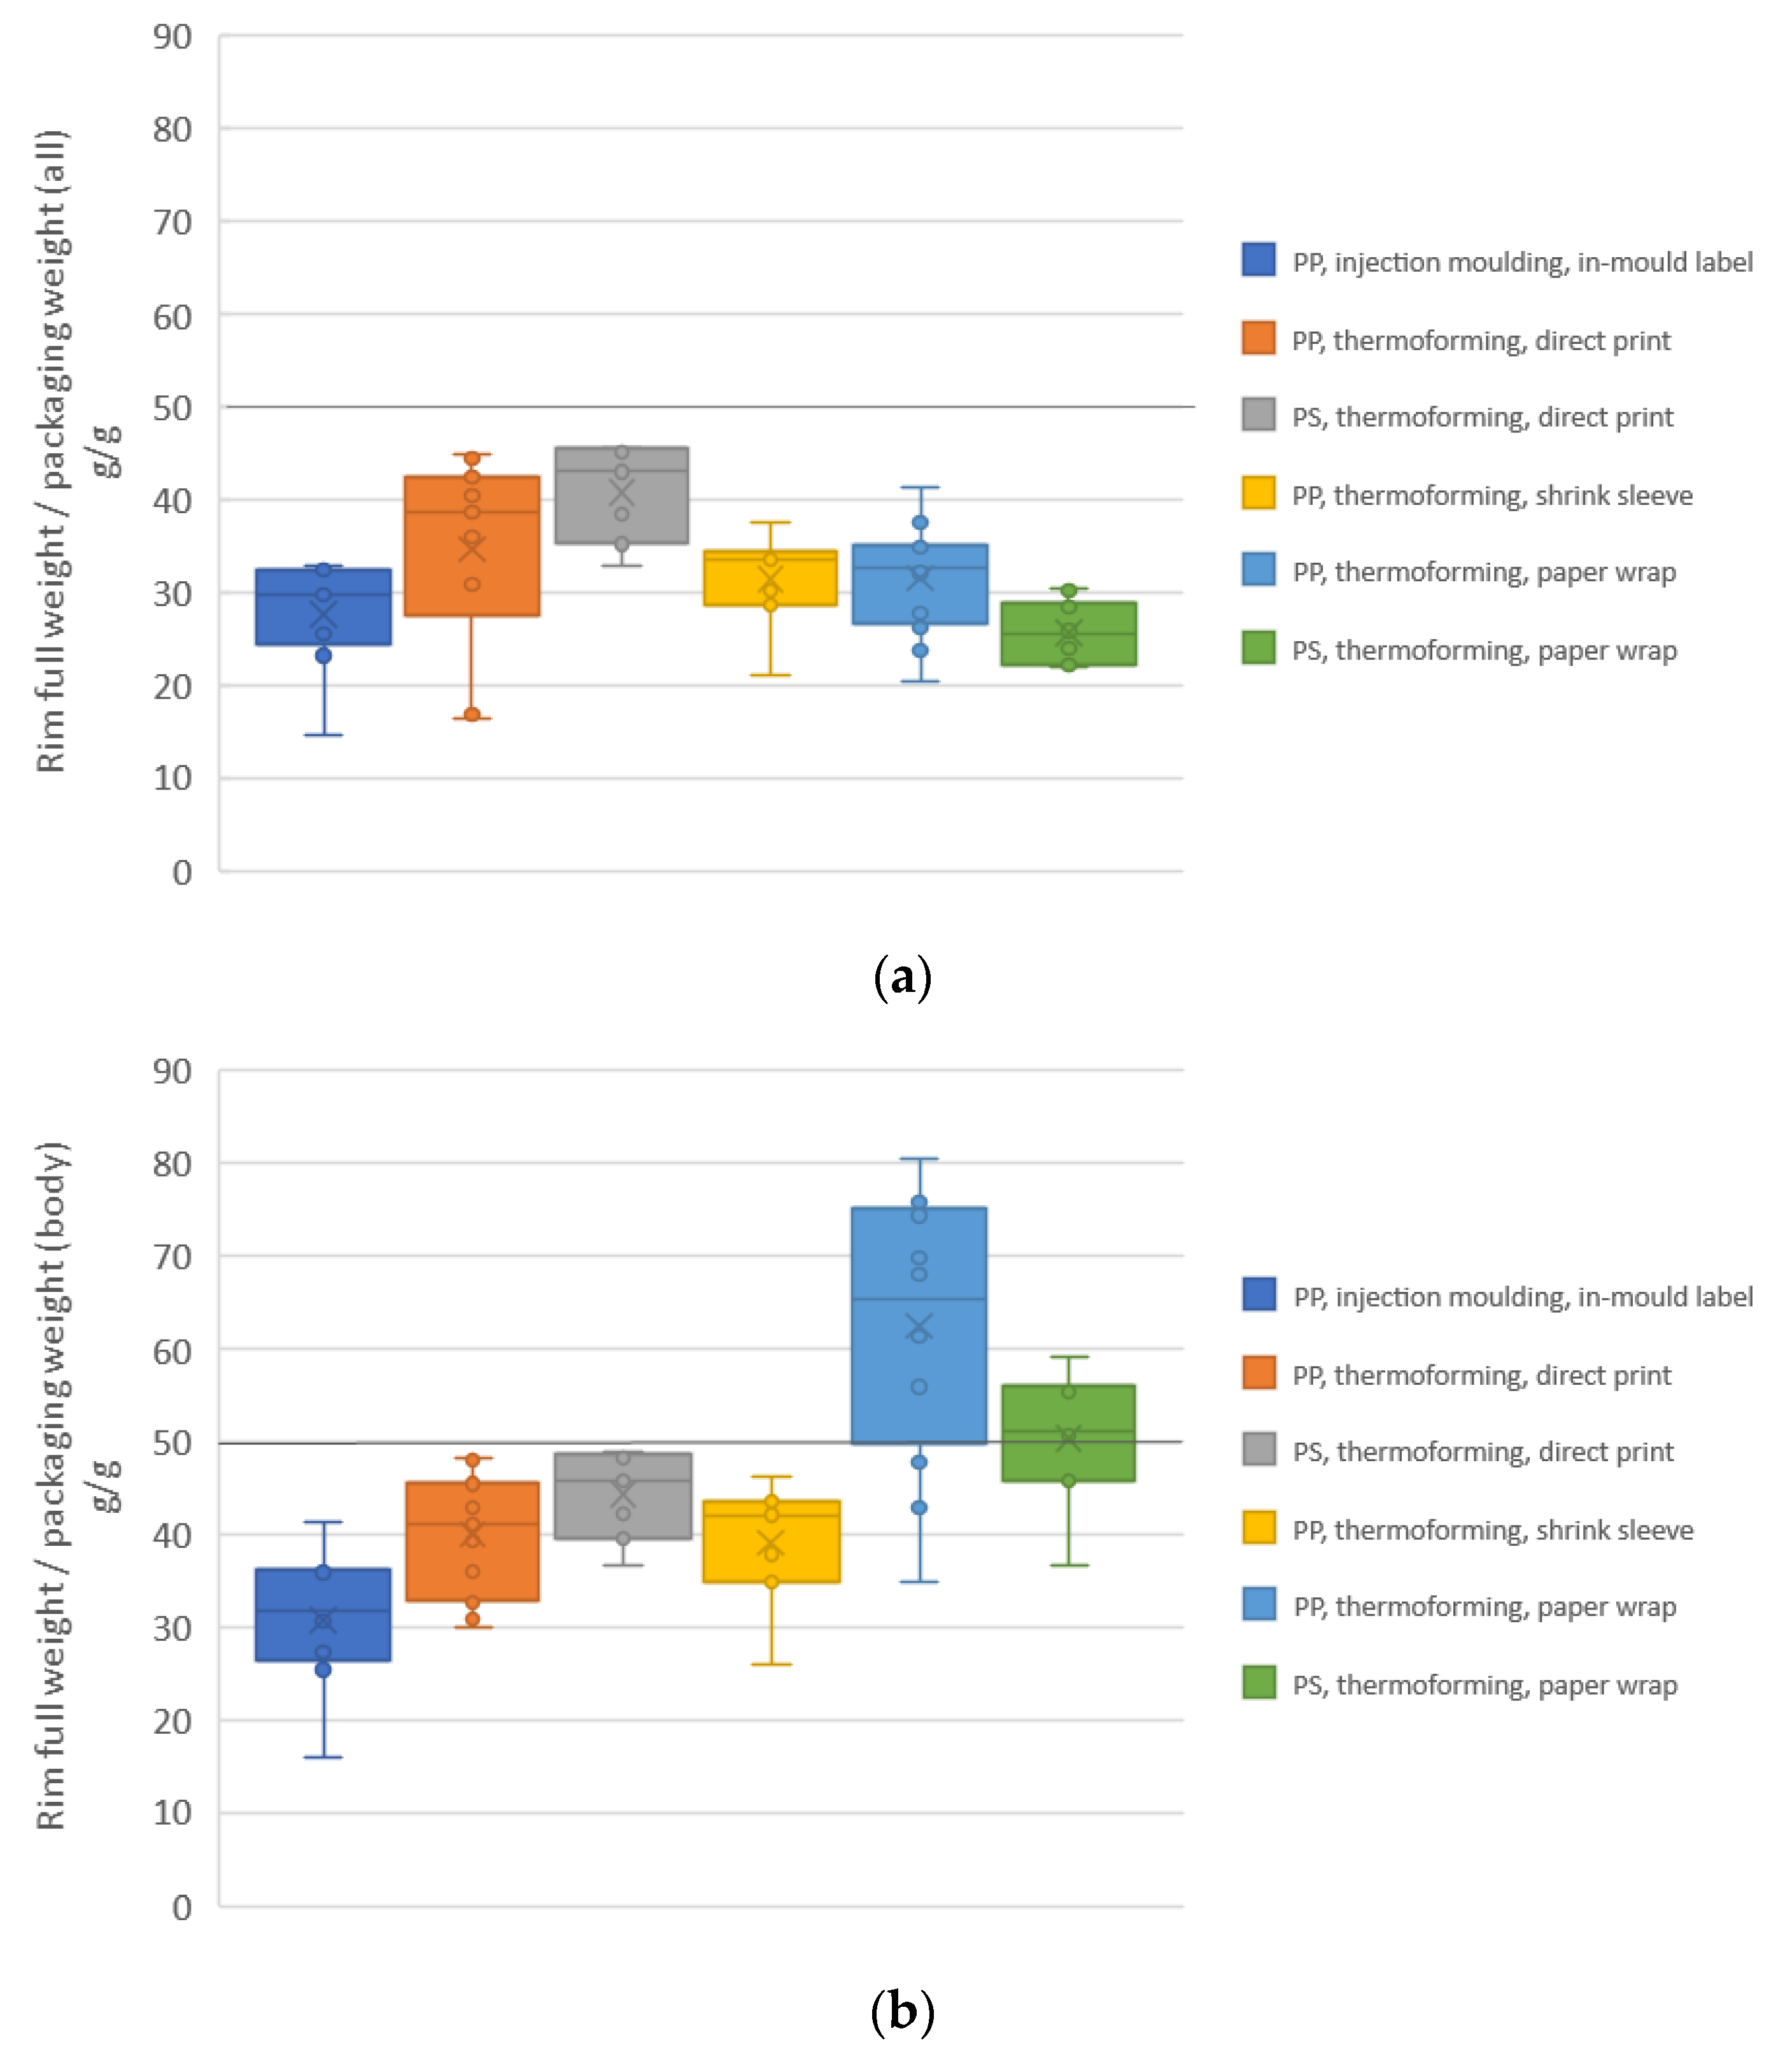
3.4. Packaging Efficiencies of Cups
3.5. Disposal Advice on Packagings
3.6. Correlation between Product Cost and Packaging Use
4. Conclusions
Supplementary Materials
Author Contributions
Funding
Institutional Review Board Statement
Informed Consent Statement
Data Availability Statement
Acknowledgments
Conflicts of Interest
References
- Lindh, H.; Williams, H.; Olsson, A.; Wikström, F. Elucidating the indirect contributions of packaging to sustainable development: A terminology of packaging functions and features. Packag. Technol. Sci. 2016, 29, 225–246. [Google Scholar] [CrossRef]
- Welle, F. Food packaging. Chem. Unserer Zeit 2007, 41, 96–106. [Google Scholar] [CrossRef]
- Rasul, S.F.; Noori, R.J.; Ali, K.M.; Khdhir, R.B.; Ahmed, S.R.; Qadir, A.M. Roles of different packaging materials on the quality and shelf life of yogurt. Food Sci. Technol. 2022, 42. [Google Scholar] [CrossRef]
- Brody, A.L. Sustainability and alternatives to today’s food packaging. Food Technol. 2006, 60, 72–74. [Google Scholar]
- Reichert, C.L.; Bugnicourt, E.; Coltelli, M.-B.; Cinelli, P.; Lazzeri, A.; Canesi, I.; Braca, F.; Martínez, B.M.; Alonso, R.; Agostinis, L.; et al. Bio-based packaging: Materials, modifications, industrial applications and sustainability. Polymers 2020, 12, 1558. [Google Scholar] [CrossRef] [PubMed]
- Aggarwal, A.; Schmid, M.; Patel, M.K.; Langowski, H.-C. Function-driven investigation of non-renewable energy use and greenhouse gas emissions for material selection in food packaging applications: Case study of yoghurt packaging. In Proceedings of the 27th CIRP Life Cycle Engineering Conference, LCE 2020, Grenoble, France, 13–15 May 2020; Brissaud, D., Zwolinski, P., Paris, H., Riel, A., Eds.; Elsevier: Amsterdam, The Netherlands, 2020; pp. 728–733, ISBN 22128271. [Google Scholar]
- Shah, M.A.; Schmid, M.; Aggarwal, A.; Wani, A.A. Testing and quality assurance of bioplastics. In Food Packaging Materials: Testing & Quality Assurance; CRC Press: Boca Raton, FL, USA, 2017; pp. 201–231. ISBN 9781466559950. [Google Scholar]
- Philp, J.C.; Bartsev, A.; Ritchie, R.J.; Baucher, M.-A.; Guy, K. Bioplastics science from a policy vantage point. New Biotechnol. 2013, 30, 635–646. [Google Scholar] [CrossRef] [PubMed]
- Verghese, K.; Lewis, H.; Fitzpatrick, L. Packaging for Sustainability; Springer: London, UK, 2012; ISBN 9780857299888. [Google Scholar]
- Licciardello, F. Packaging, blessing in disguise. Review on its diverse contribution to food sustainability. Trends Food Sci. Technol. 2017, 65, 32–39. [Google Scholar] [CrossRef]
- Sinclair, A.J.; Fenton, R.W. Stewardship for packaging and packaging waste: Key policy elements for sustainability. Can. Public Admin. 1997, 40, 123–148. [Google Scholar] [CrossRef]
- Bailey, I.G. Competition, sustainability and packaging policy in the UK. J. Environ. Plan. Manag. 1999, 42, 83–102. [Google Scholar] [CrossRef]
- Bailey, I. Principles, policies and practice: Evaluating the environmental sustainability of Britain’s packaging regulations. Sustain. Dev. 2000, 8, 51–64. [Google Scholar] [CrossRef]
- Lewis, H. Defining product stewardship and sustainability in the Australian packaging industry. Environ. Sci. Policy 2005, 8, 45–55. [Google Scholar] [CrossRef]
- European Union. Communication from the Commission to the European Parliament, the Council, the European Economic and Social Committee and the Committee of the Regions a European Strategy for Plastics in a Circular Economy, Document 52018DC0028; COM/2018/028 Final; European Union: Brussels, Belgium, 2018. [Google Scholar]
- Deutscher Bundestag. Gesetz Über das Inverkehrbringen, die Rücknahme und die Hochwertige Verwertung von Verpackungen: (VerpackG); Bundesgesetzblatt: Köln, Germany, 2017; pp. 2234–2261.
- Lewis, H.; Verghese, K.; Fitzpatrick, L. Evaluating the sustainability impacts of packaging: The plastic carry bag dilemma. Packag. Technol. Sci. 2010, 23, 145–160. [Google Scholar] [CrossRef]
- Wever, R.; Vogtländer, J. Eco-efficient value creation: An alternative perspective on packaging and sustainability. Packag. Technol. Sci. 2013, 26, 229–248. [Google Scholar] [CrossRef]
- Pauer, E.; Wohner, B.; Heinrich, V.; Tacker, M. Assessing the environmental sustainability of food packaging: An extended life cycle assessment including packaging-related food losses and waste and circularity assessment. Sustainability 2019, 11, 925. [Google Scholar] [CrossRef]
- Keller, J.; Scagnetti, C.; Albrecht, S. The Relevance of Recyclability for the Life Cycle Assessment of Packaging Based on Design for Life Cycle. Sustainability 2022, 14, 4076. [Google Scholar] [CrossRef]
- Dormer, A.; Finn, D.P.; Ward, P.; Cullen, J. Carbon footprint analysis in plastics manufacturing. J. Clean. Prod. 2013, 51, 133–141. [Google Scholar] [CrossRef]
- Suwanmanee, U.; Varabuntoonvit, V.; Chaiwutthinan, P.; Tajan, M.; Mungcharoen, T.; Leejarkpai, T. Life cycle assessment of single use thermoform boxes made from polystyrene (PS), polylactic acid, (PLA), and PLA/starch: Cradle to consumer gate. Int. J. Life Cycle Assess. 2013, 18, 401–417. [Google Scholar] [CrossRef]
- Keoleian, G.A.; Phipps, A.W.; Dritz, T.; Brachfeld, D. Life Cycle Environmental Performance and Improvement of a Yogurt Product Delivery System. Packag. Technol. Sci. 2004, 17, 85–103. [Google Scholar] [CrossRef]
- Detzel, A.; Bender, C.; Ettinger, T.; Schmidt, A.; Kauertz, B. Rahmendokument zu den Übersichtsökobilanzen im Projekt Innoredux, Heidelberg. 2021. Available online: https://www.plastik-reduzieren.de/ (accessed on 1 May 2022).
- Statista. Verpackungen: Verbrauch pro Person in Deutschland bis 2019. Available online: https://de.statista.com/statistik/daten/studie/914344/umfrage/verpackungen-verbrauch-pro-person-in-deutschland/ (accessed on 1 March 2022).
- Statista. Verbrauch von Verpackungen nach Materialart in Deutschland im Jahr 2018 (in 1.000 Tonnen). Available online: https://de.statista.com/statistik/daten/studie/914285/umfrage/verpackungen-verbrauch-in-deutschland/ (accessed on 1 March 2022).
- BMUV. Verpackungen gesamt Verbrauch, Verwertung, Quoten 1991 bis 2018 (in Kilotonnen) in der Bundesrepublik Deutschland. 2020. Available online: https://www.bmuv.de/fileadmin/Daten_BMU/Download_PDF/Abfallwirtschaft/datentabelle_verbrauch_verwertung_quoten_bf.pdf (accessed on 1 April 2022).
- Burger, A.; Cayé, N.; Jaegermann, C.; Schüler, K. Texte 148/2021, Aufkommen und Verwertung von Verpackungsabfällen in Deutschland im Jahr 2019, Abschlussbericht, 2021. Available online: https://www.umweltbundesamt.de/sites/default/files/medien/1410/publikationen/2021-11-23_texte_148-2021_aufkommen-verwertung-verpackungsabfaelle-deutschland-2019_bf.pdf (accessed on 1 March 2022).
- Chandan, R.C.; Kilara, A. Manufacturing Yogurt and Fermented Milks, 2nd ed.; John Wiley and Sons: Hoboken, NJ, USA, 2013; ISBN 9781119967088. [Google Scholar]
- Verriet, J.; Leroy, F. Yogurt’s flexible image during its rise in popularity in post-war Belgium. Appetite 2017, 108, 132–140. [Google Scholar] [CrossRef]
- Wierzejska, R.; Siuba-Strzelińska, M.; Jarosz, M. Evaluation of dairy products available on the Polish market in the context of nutrient profiles. Clear arguments for reformulation of foodstuffs. Rocz. Panstw. Zakl. Hig. 2017, 68, 43–50. [Google Scholar]
- Aryana, K.J.; Olson, D.W. A 100-Year Review: Yogurt and other cultured dairy products. J. Dairy Sci. 2017, 100, 9987–10013. [Google Scholar] [CrossRef] [PubMed]
- Corrieu, G.; Béal, C. Yogurt: The product and its manufacture. In Encyclopedia of Food and Health; Caballero, B., Finglas, P.M., Toldrá, F., Eds.; Academic Press: Oxford, UK, 2016; pp. 617–624. ISBN 978-0-12-384953-3. [Google Scholar]
- Behare, P.; Kumar, H.; Mandal, S. Yogurt: Yogurt based products. In Encyclopedia of Food and Health; Caballero, B., Finglas, P.M., Toldrá, F., Eds.; Academic Press: Oxford, UK, 2016; pp. 625–631. ISBN 978-0-12-384953-3. [Google Scholar]
- Rokka, J.; Uusitalo, L. Preference for green packaging in consumer product choices—Do consumers care? Int. J. Consum. Stud. 2008, 32, 516–525. [Google Scholar] [CrossRef]
- Farhoodi, M.; Emam-Djomeh, Z.; Oromiehie, A.; Ehsani, M.R. Influence of menthol absorption on the mechanical properties of PET bottles. Iran. Polym. J. Eng. Ed. 2009, 18, 227–232. [Google Scholar]
- Farhoodi, M.; Emam-Djomeh, Z.; Falah, A.; Sabetghadam, S.; Nemati, M. Effect of menthol absorption by packaging material on the quality of yogurt drink during storage time. J. Agric. Sci. Technol. 2013, 15, 1373–1380. [Google Scholar]
- Ahrens, S. Produktion von Joghurt (ohne Zusätze) in Deutschland in den Jahren 2000 bis 2020. 2021. Available online: https://de.statista.com/statistik/daten/studie/239697/umfrage/herstellung-von-joghurterzeugnissen-in-deutschland/ (accessed on 1 May 2022).
- Wohner, B.; Schwarzinger, N.; Gürlich, U.; Heinrich, V.; Tacker, M. Technical emptiability of dairy product packaging and its environmental implications in Austria. PeerJ 2019, 2019, e7578. [Google Scholar] [CrossRef] [PubMed]
- Heidbreder, L.M.; Bablok, I.; Drews, S.; Menzel, C. Tackling the plastic problem: A review on perceptions, behaviors, and interventions. Sci. Total Environ. 2019, 668, 1077–1093. [Google Scholar] [CrossRef] [PubMed]
- Franz, R.; Welle, F. Recycling of post-consumer packaging materials into new food packaging applications—Critical review of the European approach and future perspectives. Sustainability 2022, 14, 824. [Google Scholar] [CrossRef]
- Guazzotti, V.; Hendrich, V.; Gruner, A.; Fiedler, D.; Störmer, A.; Welle, F. Migration of styrene in yogurt and dairy products packaged in polystyrene: Results from market samples. Foods 2022, 11, 2120. [Google Scholar] [CrossRef]
- Markevičiūtė, Z.; Varžinskas, V. Smart Material Choice: The Importance of Circular Design Strategy Applications for Bio-Based Food Packaging Preproduction and End-of-Life Life Cycle Stages. Sustainability 2022, 14, 6366. [Google Scholar] [CrossRef]
- Sirisinha, K.; Wirasate, S.; Sirisinha, C.; Wattanakrai, N. One-Pot Reactive Melt Recycling of PLA Post-Consumer Waste for the Production of Block Copolymer Nanocomposites of High Strength and Ductility. Polymers 2022, 14, 3642. [Google Scholar] [CrossRef]
- Jungbluth, N.; Keller, R.; Meili, C. Life cycle assessment of a detailed dairy processing model and recommendations for the allocation to single products. Int. J. Life Cycle Assess. 2018, 23, 1806–1813. [Google Scholar] [CrossRef]
- Weinkötz, P.; Schade, C. To each Yoghurt tub, its own polystyrene. Kunsts. Int. 2006, 96, 55–59. [Google Scholar]
- Bonten, C. Kunststofftechnik: Einführung und Grundlagen, 3rd ed.; Hanser: Munich, Germany, 2020; ISBN 9783446465381. [Google Scholar]
- Rosato, D.V.; Rosato, D.V.; Rosato, M.G. (Eds.) Injection Molding Handbook, 3rd ed.; Springer International Publishing: Cham, Switzerland, 2000; ISBN 9781461545972. [Google Scholar]
- Selke, S.E.M.; Culter, J.D. Plastics Packaging: Properties, Processing, Applications, and Regulations, 3rd ed.; Hanser Publishers: Munich, Germany, 2016; ISBN 9781569905463. [Google Scholar]
- Engelmann, S. Advanced Thermoforming: Methods, Machines and Materials, Applications and Automation; John Wiley & Sons: New York, NY, USA, 2012; ISBN 9781118207055. [Google Scholar]
- Schwarzmann, P. Thermoforming: A Practical Guide, 2nd ed.; Hanser Publishers: Cincinnati, OH, USA, 2019. [Google Scholar]
- Kayatz, F.; Schult, A.; Majschak, J.-P.; Liebmann, A. New developments in thermoforming. Kunsts. Int. 2017, 107, 24–26. [Google Scholar]
- Wagner, S.; Münsch, M.; Kayatz, F.; Majschak, J.-P.; Delgado, A. Modeling of the Compressed-Air Flow Impact for Thermoforming Simulations; Springer: Berlin/Heidelberg, Germany, 2018; ISBN 14397358. [Google Scholar]
- Wagner, S.; Kayatz, F.; Münsch, M.; Sanjon, C.W.; Hauptmann, M.; Delgado, A. Numerical modeling of forming air impact thermoforming. Int. J. Adv. Manuf. Technol. 2022, 120, 4917–4933. [Google Scholar] [CrossRef]
- Wagner, S.; Sheikhi, R.; Kayatz, F.; Münsch, M.; Hauptmann, M.; Delgado, A. Fluid–structure-interaction simulations of forming-air impact thermoforming. Polym. Eng. Sci. 2022, 62, 1294–1309. [Google Scholar] [CrossRef]
- Kuehne, G. Thermoforming. Kunsts Ger. Plast. 1981, 71, 28–29. [Google Scholar]
- Guo, C.; Guo, H. Progress in the Degradability of Biodegradable Film Materials for Packaging. Membranes 2022, 12, 500. [Google Scholar] [CrossRef]
- Sängerlaub, S.; Lehmann, E.; Müller, K.; Wani, A.A. Porosity, thickness distribution and water vapour sorption of thermoformed foamed PP films with dispersed sodium chloride for humidity regulation. Food Packag. Shelf Life 2020, 24, 100482. [Google Scholar] [CrossRef]
- Hopmann, C.; Michaeli, W. Einführung in die Kunststoffverarbeitung, 8th ed.; Hanser: Munich, Germany, 2017; ISBN 9783446453562. [Google Scholar]
- Singh, P.; Saengerlaub, S.; Wani, A.A.; Langowski, H.-C. Role of plastics additives for food packaging. Pigment Resin Technol. 2012, 41, 368–379. [Google Scholar] [CrossRef]
- Tawfik, M.S.; Huyghebaert, A. Polystyrene cups and containers: Styrene migration. Food Addit. Contam. 1998, 15, 592–599. [Google Scholar] [CrossRef]
- Vitrac, O.; Challe, B.; Leblanc, J.-C.; Feigenbaum, A. Contamination of packaged food by substances migrating from a direct-contact plastic layer: Assessment using a generic quantitative household scale methodology. Food Addit. Contam. 2007, 24, 75–94. [Google Scholar] [CrossRef] [PubMed]
- Vitrac, O.; Leblanc, J.-C. Consumer exposure to substances in plastic packaging. I. Assessment of the contribution of styrene from yogurt pots. Food Addit. Contam. 2007, 24, 194–215. [Google Scholar] [CrossRef] [PubMed]
- Pilevar, Z.; Bahrami, A.; Beikzadeh, S.; Hosseini, H.; Jafari, S.M. Migration of styrene monomer from polystyrene packaging materials into foods: Characterization and safety evaluation. Trends Food Sci. Technol. 2019, 91, 248–261. [Google Scholar] [CrossRef]
- Guazzotti, V.; Gruner, A.; Juric, M.; Hendrich, V.; Störmer, A.; Welle, F. Migration testing of GPPS and HIPS polymers: Swelling effect caused by food simulants compared to real foods. Molecules 2022, 27, 823. [Google Scholar] [CrossRef] [PubMed]
- Welle, F. Diffusion coefficients and activation energies of diffusion of organic molecules in polystyrene below and above glass transition temperature. Polymers 2021, 13, 1317. [Google Scholar] [CrossRef]
- Belcher, S.L. Practical Guide to Injection Blow Molding; CRC Press: Boca Raton, FL, USA, 2007; ISBN 9780429119262. [Google Scholar]
- Müller, K. Oxygen permeability of plastic bottles for oxygen sensitive beverages. Brew. Sci. 2007, 60, 74–83. [Google Scholar]
- Müller, K.; Welle, F. PET in beverage packaging. Kunsts Plast. Eur. 2005, 95, 120–125. [Google Scholar]
- Franz, R.; Welle, F. Post-consumer Poly(ethylene terephthalate) for direct food contact applications—Final proof of food law compliance. Dtsch. Lebensm.-Rundsch. 1999, 95, 424–427. [Google Scholar]
- Franz, R.; Welle, F. Recycled poly(ethylene terephthalate) for direct food contact applications: Challenge test of an inline recycling process. Food Addit. Contam. 2002, 19, 502–511. [Google Scholar] [CrossRef]
- Franz, R.; Mauer, A.; Welle, F. European survey on post-consumer poly(ethylene terephthalate) (PET) materials to determine contamination levels and maximum consumer exposure from food packages made from recycled PET. Food Addit. Contam. 2004, 21, 265–286. [Google Scholar] [CrossRef]
- Benyathiar, P.; Kumar, P.; Carpenter, G.; Brace, J.; Mishra, D.K. Polyethylene Terephthalate (PET) Bottle-to-Bottle Recycling for the Beverage Industry: A Review. Polymers 2022, 14, 2366. [Google Scholar] [CrossRef]
- Pinter, E.; Welle, F.; Mayrhofer, E.; Pechhacker, A.; Motloch, L.; Lahme, V.; Grant, A.; Tacker, M. Circularity study on pet bottle-to-bottle recycling. Sustainability 2021, 13, 7370. [Google Scholar] [CrossRef]
- Müller, K.; Sängerlaub, S.; Kramer, A.; Huber, C.; Fritsch, K. Temperature-dependent oxygen permeation through PET/MXD6-barrier blend bottles with and without oxygen absorber. Brew. Sci. 2011, 64, 161–167. [Google Scholar] [CrossRef]
- Sängerlaub, S.; Müller, K. Long-time performance of bottles made of pet blended with various concentrations of oxygen scavenger additive stored at different temperatures. Packag. Technol. Sci. 2017, 30, 45–58. [Google Scholar] [CrossRef]
- Sängerlaub, S.; Glas, C.E.; Schlemmer, D.; Müller, K. Influence of multiple extrusions of blends made of polyethylene terephthalate and an oxygen scavenger on processing and packaging-related properties. J. Plast. Film Sheet. 2020, 36, 260–284. [Google Scholar] [CrossRef]
- Thielen, M. Extrusion Blow Molding; Hanser Publications: Munich, Germany, 2021; ISBN 9781569908419. [Google Scholar]
- Zhang, J.; Gong, M.; Du, T.; Hen, C.; Wang, S.; Lu, X.; Li, K. Study on technology of room temperature yogurt in HDPE bottles. J. Food Sci. Technol. 2018, 36, 106–110. [Google Scholar] [CrossRef]
- Welle, F. Post-consumer contamination in high-density polyethylene (HDPE) milk bottles and the design of a bottle-to-bottle recycling process. Food Addit. Contam. 2005, 22, 999–1011. [Google Scholar] [CrossRef]
- Knights, M. Leading the way in IML packaging. Plast. Technol. 2005, 51, 88. [Google Scholar]
- Baur, E.; Harsch, G.; Moneke, M. Werkstoff-Führer Kunststoffe: Eigenschaften—Prüfungen—Kennwerte, 11th ed.; Hanser: Munich, Germany, 2019; ISBN 9783446457980. [Google Scholar]
- Qiu, R.; Qi, Y.; Wan, X. An event-related potential study of consumers’ responses to food bundles. Appetite 2020, 147, 104538. [Google Scholar] [CrossRef]
- Carroll, K.A.; Samek, A.; Zepeda, L. Consumer Preference for Food Bundles under Cognitive Load: A Grocery Shopping Experiment. Foods 2022, 11, 973. [Google Scholar] [CrossRef]
- Gell, M. Packaging innovations and evolution in the food & drinks sector. WRAP 2013. Available online: https://www.iopp.org/files/wrap_innovations.pdf (accessed on 1 May 2022).
- Becerril-Arreola, R.; Bucklin, R.E. Beverage bottle capacity, packaging efficiency, and the potential for plastic waste reduction. Sci. Rep. 2021, 11, 3542. [Google Scholar] [CrossRef] [PubMed]
- GVM Gesellschaft für Verpackungsmarktforschung mbH. Entwicklung von Konsumverhalten, Aufkommen und Materialeffizienz von Verpackungen, Mainz. 2022. Available online: https://www.bvse.de/dateien2020/2-PDF/01-Nachrichten/03-Kunststoff/2022/GVM_Studie_Konsum__Verpackung_-_Tag_der_Verpackung_2022.pdf (accessed on 1 May 2022).
- Licciardello, F.; Sapienza, G.; Mazzaglia, A.; D’Amico, L.; Tornatore, G.; Muratore, G. Packaging reduction to improve the sustainability of carbonated soft drinks. Ital. J. Food Sci. 2015, 2015, 1–6. [Google Scholar]
- Gaedeke, H. Trennverfahren—Schwimm/Sink-Verfahren: Modul 03—Entsorgung und Recycling. [ER+7]. Plastic 360. Available online: https://www.chemie.uni-wuerzburg.de/fileadmin/08010034/user_upload/plastic360/Zusatzmaterialien/ER_7_Schwimm-Sink-Verfahren.pdf (accessed on 1 May 2022).
- Sängerlaub, S.; Seibel, K.; Miesbauer, O.; Pant, A.; Kiese, S.; Rodler, N.; Schmid, M.; Müller, K. Functional properties of foamed and/or stretched polypropylene-films containing sodium chloride particles for humidity regulation. Polym. Test 2018, 65, 339–351. [Google Scholar] [CrossRef]
- Sängerlaub, S.; Böhmer, M.; Stramm, C. Influence of stretching ratio and salt concentration on the porosity of polypropylene films containing sodium chloride particles. J. Appl. Polym. Sci. 2013, 129, 1238–1248. [Google Scholar] [CrossRef]
- Sängerlaub, S.; Miesbauer, O.; Michael, L.; Müller, K.; Stramm, C.; Pecyna, M.; Langowski, H.-C. Humidity regulation by stretched PP and PLA films with dispersed CaCl2. J. Appl. Polym. Sci. 2018, 135, 45713. [Google Scholar] [CrossRef]
- Lechleitner, A.; Schwabl, D.; Schubert, T.; Bauer, M.; Lehner, M. Chemisches Recycling von gemischten Kunststoffabfällen als ergänzender Recyclingpfad zur Erhöhung der Recyclingquote. Österr. Wasser-Abfallw. 2020, 72, 47–60. [Google Scholar] [CrossRef]
- Kaiser, K.; Schmid, M.; Schlummer, M. Recycling of Polymer-Based Multilayer Packaging: A Review. Recycling 2018, 3, 1. [Google Scholar] [CrossRef]
- Lohse, H.; Weber, J.; Helduser, S.; Hauptmann, M.; Majschak, J.-P.; Enz, B.; Heibig, A. Pulling of paper and carton: Electrohydraulic drive system enables a flexible process design. Olhydraul. Pneum. 2010, 54, 118–123. [Google Scholar]
- Hauptmann, M.; Majschak, J.-P. New quality level of packaging components from paperboard through technology improvement in 3D forming. Packag. Technol. Sci. 2011, 24, 419–432. [Google Scholar] [CrossRef]
- Hauptmann, M.; Ehlert, S.; Majschak, J.-P. The effect of concave base shape elements on the three dimensional forming process of advanced paperboard structures. Packag. Technol. Sci. 2014, 27, 975–986. [Google Scholar] [CrossRef]
- Vishtal, A.; Hauptmann, M.; Zelm, R.; Majschak, J.-P.; Retulainen, E. 3D forming of paperboard: The influence of paperboard properties on formability. Packag. Technol. Sci. 2014, 27, 677–691. [Google Scholar] [CrossRef]
- Hauptmann, M.; Wallmeier, M.; Erhard, K.; Zelm, R.; Majschak, J.-P. The role of material composition, fiber properties and deformation mechanisms in the deep drawing of paperboard. Cellulose 2015, 22, 3377–3395. [Google Scholar] [CrossRef]
- Wallmeier, M.; Hauptmann, M.; Majschak, J.-P. New methods for quality analysis of deep-drawn packaging components from paperboard. Packag. Technol. Sci. 2015, 28, 91–100. [Google Scholar] [CrossRef]
- Hauptmann, M.; Kaulfürst, S.; Majschak, J.-P. Advances on geometrical limits in the deep drawing process of paperboard. BioResources 2016, 11, 10042–10056. [Google Scholar] [CrossRef]
- Hauptmann, M.; Majschak, J.-P. Characterization of influences on the wall stability of deep drawn paperboard shapes. BioResources 2016, 11, 2640–2654. [Google Scholar] [CrossRef]
- Hauptmann, M.; Weyhe, J.; Majschak, J.-P. Optimisation of deep drawn paperboard structures by adaptation of the blank holder force trajectory. J. Mater. Process. Technol. 2016, 232, 142–152. [Google Scholar] [CrossRef]
- Wallmeier, M.; Hauptmann, M.; Majschak, J.-P. The occurrence of rupture in deep-drawing of paperboard. BioResources 2016, 11, 4688–4704. [Google Scholar] [CrossRef]
- Wallmeier, M.; Noack, K.; Hauptmann, M.; Majschak, J.-P. Shape accuracy analysis of deep drawn packaging components made of paperboard. Nord. Pulp Pap. Res. J. 2016, 31, 323–332. [Google Scholar] [CrossRef]
- Hauptmann, M.; Kustermann, T.; Schmalholz, M.; Haug, H.; Majschak, J.-P. Examination of the transferability of technological key features of paperboard deep drawing towards the application in fast-running packaging machines. Packag. Technol. Sci. 2017, 30, 21–31. [Google Scholar] [CrossRef]
- Lenske, A.; Müller, T.; Penter, L.; Schneider, M.; Hauptmann, M.; Majschak, J.-P. Evaluating the factors influencing the friction behavior of paperboard during the deep drawing process. BioResources 2017, 12, 8340–8358. [Google Scholar] [CrossRef]
- Löwe, A.; Hauptmann, M.; Majschak, J.-P. The effect of ultrasonic oscillation on the quality of 3D shapes during deep-drawing of paperboard. BioResources 2017, 12, 7178–7194. [Google Scholar] [CrossRef]
- Löwe, A.; Hofmann, A.; Hauptmann, M. The use and application of ultrasonic vibrations in the 3D deformation of paper and cardboard. J. Mater. Process. Technol. 2017, 240, 23–32. [Google Scholar] [CrossRef]
- Müller, T.; Lenske, A.; Hauptmann, M.; Majschak, J.-P. Analysis of dominant process parameters in deep-drawing of paperboard. BioResources 2017, 12, 3530–3545. [Google Scholar] [CrossRef] [Green Version]
- Müller, T.; Lenske, A.; Hauptmann, M.; Majschak, J.-P. Method for fast quality evaluation of deep-drawn paperboard packaging components. Packag. Technol. Sci. 2017, 30, 703–710. [Google Scholar] [CrossRef]
- Müller, T.; Meyer, M.; Lenske, A.; Hauptmann, M.; Majschak, J.-P. Optical inline quality assessment of deep-drawn paperboard containers. J. Mater. Process. Technol. 2018, 262, 615–621. [Google Scholar] [CrossRef]
- Hauptmann, M. The path to formable cellulose-based barrier solutions in packaging. In Proceedings of the 17th Biennial TAPPI European PLACE Conference 2019, Porto, Portugal, 20–22 May 2019; TAPPI Press: Peachtree Corners, GA, USA, 2019; pp. 50–60, ISBN 9781510888012. [Google Scholar]
- Hofmann, A.; Wallmeier, M.; Hauptmann, M.; Majschak, J.-P. Characterization of the material elongation in the deep drawing of paperboard. Packag. Technol. Sci. 2019, 32, 287–296. [Google Scholar] [CrossRef]
- Lenske, A.; Müller, T.; Hauptmann, M.; Majschak, J.-P. New method to evaluate the frictional behavior within the forming gap during the deep drawing process of paperboard. BioResources 2019, 13, 5580–5597. [Google Scholar] [CrossRef]
- Müller, T.; Lenske, A.; Barbier, C.; Hauptmann, M.; Majschak, J.-P. Geometry-invariant wrinkle detection in sealing rims of paperboard containers. BioResources 2019, 14, 2536–2549. [Google Scholar] [CrossRef]
- Löwe, A.; Nikowski, A.; Hauptmann, M. Functional design of sonotrodes for deep-drawing of cardboard. BioResources 2020, 15, 2763–2773. [Google Scholar] [CrossRef]
- Balzarotti, S.; Maviglia, B.; Biassoni, F.; Ciceri, M.R. Glass vs. plastic: Affective judgments of food packages after visual and haptic exploration. Procedia Manuf. 2015, 3, 2251–2258. [Google Scholar] [CrossRef]
- Saint-Eve, A.; Lévy, C.; le Moigne, M.; Ducruet, V.; Souchon, I. Quality changes in yogurt during storage in different packaging materials. Food Chem. 2008, 110, 285–293. [Google Scholar] [CrossRef] [PubMed]
- Wang, C.; Qiu, L.; Zhang, W.; Wan, X. Influence of flavor variety and color variety on consumer preference and choices of yogurt bundles. Food Qual. Prefer. 2022, 96, 104424. [Google Scholar] [CrossRef]
- Schmidt, S.; Wellbrock, W. Alltäglicher nachhaltiger Konsum—Bewusster Umgang mit Lebensmitteln vs. skandalträchtige Verschwendung. In Nachhaltiger Konsum: Best Practices aus Wissenschaft, Unternehmenspraxis, Gesellschaft, Verwaltung und Politik; Wellbrock, W., Ludin, D., Eds.; Springer Fachmedien Wiesbaden: Wiesbaden, Germany, 2021; pp. 719–741. ISBN 978-3-658-33353-9. [Google Scholar]
- Leibinger, T. (Ed.) Downsizing bei Konsumgütern: Wahrnehmung und Reaktionen von Konsumenten; Springer Fachmedien: Wiesbaden, Germany, 2017; ISBN 978-3-658-18971-6. [Google Scholar]
- Bosiers, L.; Engelmann, S. Thermoformed packaging made of PLA. Kunsts Plast. Eur. 2003, 93, 21–23+48. [Google Scholar]
- Green, R.; Kunnemann, D. (Eds.) PLA—A Renewable/Sustainable Packaging Option. In Proceedings of the TAPPI 2006 PLACE Conference, Cincinnati, OH, USA, 17–21 September 2006. [Google Scholar]
- Colomines, G.; Domenek, S.; Ducruet, V.; Guinault, A. Influences of the crystallisation rate on thermal and barrier properties of polylactide acid (PLA) food packaging films. Int. J. Mater. Form. 2008, 1, 607–610. [Google Scholar] [CrossRef]
- Topiarzová, R.; Čablík, V.; Nezvalová, L.; Fečko, P. Launch of biodegradable pla bottles: A sociological survey on packaging material awareness in the Czech Republic. Rocz. Ochr. R. 2011, 13, 149–162. [Google Scholar]
- Moretti, C.; Hamelin, L.; Jakobsen, L.G.; Junginger, M.H.; Steingrimsdottir, M.M.; Høibye, L.; Shen, L. Cradle-to-grave life cycle assessment of single-use cups made from PLA, PP and PET. Resour. Conserv. Recycl. 2021, 169, 105508. [Google Scholar] [CrossRef]
- Aggarwal, A.; Langowski, H.-C. Packaging functions and their role in technical development of food packaging systems: Functional equivalence in yoghurt packaging. In Proceedings of the 27th CIRP Life Cycle Engineering Conference, LCE 2020, Grenoble, France, 13–15 May 2020; Brissaud, D., Zwolinski, P., Paris, H., Riel, A., Eds.; Elsevier: Amsterdam, The Netherlands, 2020; pp. 405–410, ISBN 22128271. [Google Scholar]
- Sinclair, R.G. The Case for Polylactic Acid as a Commodity Packaging Plastic. J. Macromol. Sci. Part A 1996, 33, 585–597. [Google Scholar] [CrossRef]
- Mikloskova, H.; Witte, F.; Joeres, E.; Terjung, N. Storage stability of plain stirred whole milk yoghurt (3.7% fat) packed in polylactic acid and polystyrene. Int. Dairy J. 2021, 120, 105088. [Google Scholar] [CrossRef]
- Naitove, M.H. Conference report: Bioplastics are breaking out of their ‘green’ niche. Plast. Technol. 2012, 58, 13–17+58–62. [Google Scholar]
- Petchwattana, N.; Naknaen, P. Influence of packaging material and storage time on physical, chemical and microbiological properties of set yogurt: A comparative study between modified biodegradable poly(lactic acid) and polypropylene. J. Eng. Sci. Technol. 2016, 11, 1437–1449. [Google Scholar]
- Leaversuch, R. Renewable PLA polymer gets ‘green light’ for packaging uses. Plast. Technol. 2002, 48, 50–55. [Google Scholar]
- Sari, N.; Suteja, S.; Sapuan, S.; Ilyas, R. Properties and Food Packaging Application of Poly-(Lactic) Acid. In Bio-Based Packaging: Material, Environmental and Economic Aspects; John Wiley & Sons Ltd.: Hoboken, NJ, USA, 2021; ISBN 9781119381228. [Google Scholar]
- Herrmann, C.; Rhein, S.; Sträter, K.F. Consumers’ sustainability-related perception of and willingness-to-pay for food packaging alternatives. Resour. Conserv. Recycl. 2022, 181, 106219. [Google Scholar] [CrossRef]
- Voet, V.; Folkersma, R.; Jager, J. Plastics in the Circular Economy; De Gruyter: Berlin, Germany, 2021; ISBN 9783110666762. [Google Scholar]
- Rudolph, N.; Kiesel, R.; Aumnate, C. Understanding Plastics Recycling: Economic, Ecological, and Technical Aspects of Plastic Waste Handling, 2nd ed.; Hanser Publishers: Munich, Germany, 2021; ISBN 9781569908464. [Google Scholar]
- Welle, F. Is PET bottle-to-bottle recycling safe? Evaluation of post-consumer recycling processes according to the EFSA guidelines. Resour. Conserv. Recycl. 2013, 73, 41–45. [Google Scholar] [CrossRef]
- Welle, F. Twenty years of PET bottle to bottle recycling—An overview. Resour. Conserv. Recycl. 2011, 55, 865–875. [Google Scholar] [CrossRef]
- Lehner, M.; Schlemmer, D.; Sängerlaub, S. Recycling of blends made of polypropylene and an iron-based oxygen scavenger—Influence of multiple extrusions on the polymer stability and the oxygen absorption capacity. Polym. Degrad. Stab. 2015, 122, 122–132. [Google Scholar] [CrossRef]
- Ladhari, A.; Kucukpinar, E.; Stoll, H.; Sängerlaub, S. Comparison of properties with relevance for the automotive sector in mechanically recycled and virgin polypropylene. Recycling 2021, 6, 76. [Google Scholar] [CrossRef]
- Schlummer, M.; Maurer, A.; Agulla, K. That’s the “solution”! Kunsts Int. 2008, 98, 59–61. [Google Scholar]
- Strangl, M.; Fell, T.; Schlummer, M.; Maeurer, A.; Buettner, A. Characterization of odorous contaminants in post-consumer plastic packaging waste using multidimensional gas chromatographic separation coupled with olfactometric resolution. J. Sep. Sci. 2017, 40, 1500–1507. [Google Scholar] [CrossRef]
- Strangl, M.; Schlummer, M.; Maeurer, A.; Buettner, A. Comparison of the odorant composition of post-consumer high-density polyethylene waste with corresponding recycled and virgin pellets by combined instrumental and sensory analysis. J. Clean. Prod. 2018, 181, 599–607. [Google Scholar] [CrossRef]
- Strangl, M.; Ortner, E.; Buettner, A. Evaluation of the efficiency of odor removal from recycled HDPE using a modified recycling process. Resour. Conserv. Recycl. 2019, 146, 89–97. [Google Scholar] [CrossRef]
- Cabanes, A.; Strangl, M.; Ortner, E.; Fullana, A.; Buettner, A. Odorant composition of post-consumer LDPE bags originating from different collection systems. Waste Manag. 2020, 104, 228–238. [Google Scholar] [CrossRef]
- Strangl, M.; Ortner, E.; Fell, T.; Ginzinger, T.; Buettner, A. Odor characterization along the recycling process of post-consumer plastic film fractions. J. Clean. Prod. 2020, 260, 121104. [Google Scholar] [CrossRef]
- Strangl, M.; Lok, B.; Breunig, P.; Ortner, E.; Buettner, A. The challenge of deodorizing post-consumer polypropylene packaging: Screening of the effect of washing, color-sorting and heat exposure. Resour. Conserv. Recycl. 2021, 164, 105143. [Google Scholar] [CrossRef]
- Steenis, N.D.; van Herpen, E.; van der Lans, I.A.; Ligthart, T.N.; van Trijp, H.C. Consumer response to packaging design: The role of packaging materials and graphics in sustainability perceptions and product evaluations. J. Clean. Prod. 2017, 162, 286–298. [Google Scholar] [CrossRef]
- Niedziela, M.M.; Jordan, A.; Stone, H. Tasteful packaging: How health and ethical messaging can affect the consumer experience. Agro Food Ind. Hi-Tech 2016, 27, 34–37. [Google Scholar]
- Arrúa, A.; Vidal, L.; Antúnez, L.; Machín, L.; Martínez, J.; Curutchet, M.R.; Giménez, A.; Ares, G. Influence of label design on children’s perception of 2 snack foods. J. Nutr. Educ. Behav. 2017, 49, 211–217.e1. [Google Scholar] [CrossRef]
- Schifferstein, H.N.; Lemke, M.; de Boer, A. An exploratory study using graphic design to communicate consumer benefits on food packaging. Food Qual. Prefer. 2022, 97, 104458. [Google Scholar] [CrossRef]
- Wang, F.; Wang, H.; Cho, J.H. Consumer preference for yogurt packaging design using conjoint analysis. Sustainability 2022, 14, 3463. [Google Scholar] [CrossRef]
- Camacho, W.; Karlsson, S. NIR, DSC, and FTIR as quantitative methods for compositional analysis of blends of polymers obtained from recycled mixed plastic waste. Polym. Eng. Sci. 2001, 41, 1626–1635. [Google Scholar] [CrossRef]
- Kulcke, A.; Gurschler, C.; Spöck, G.; Leitner, R.; Kraft, M. On-line classification of synthetic polymers using near infrared spectral imaging. J. Near Infrared Spectrosc. 2003, 11, 71–81. [Google Scholar] [CrossRef]
- Tachwali, Y.; Al-Assaf, Y.; Al-Ali, A.R. Automatic multistage classification system for plastic bottles recycling. Resour. Conserv. Recycl. 2007, 52, 266–285. [Google Scholar] [CrossRef]
- Becker, W.; Sachsenheimer, K.; Klemenz, M. Detection of black plastics in the middle infrared spectrum (MIR) using photon Up-conversion technique for polymer recycling purposes. Polymers 2017, 9, 435. [Google Scholar] [CrossRef] [PubMed]
- Yan, H.; Siesler, H.W. Identification performance of different types of handheld near-infrared (NIR) spectrometers for the recycling of polymer commodities. Appl. Spectrosc. 2018, 72, 1362–1370. [Google Scholar] [CrossRef]
- Küppers, B.; Schloegl, S.; Oreski, G.; Pomberger, R.; Vollprecht, D. Influence of surface roughness and surface moisture of plastics on sensor-based sorting in the near infrared range. Waste Manag. Res. 2019, 37, 843–850. [Google Scholar] [CrossRef]
- Li, J.; Li, C.; Liao, Q.; Xu, Z. Environmentally-friendly technology for rapid on-line recycling of acrylonitrile-butadiene-styrene, polystyrene and polypropylene using near-infrared spectroscopy. J. Clean. Prod. 2019, 213, 838–844. [Google Scholar] [CrossRef]
- Signoret, C.; Caro-Bretelle, A.-S.; Lopez-Cuesta, J.-M.; Ienny, P.; Perrin, D. MIR spectral characterization of plastic to enable discrimination in an industrial recycling context: I. Specific case of styrenic polymers. Waste Manag. 2019, 95, 513–525. [Google Scholar] [CrossRef]
- Chen, X.; Kroell, N.; Feil, A.; Pretz, T. Determination of the composition of multilayer plastic packaging with nir spectroscopy. Detritus 2020, 13, 62–66. [Google Scholar] [CrossRef]
- Akopian, D.; Creutzburg, R.; Bassey, U.; Rojek, L.; Hartmann, M.; Creutzburg, R.; Volland, A. (Eds.) The Potential of NIR Spectroscopy in the Separation of Plastics for Pyrolysis. In Mobile Devices and Multimedia: Enabling Technologies, Algorithms, and Applications 2021, Proceedings of the IS&T International Symposium on Electronic Imaging 2021, held online, 11–28 January 2021; Society for Imaging Science and Technology: Springfield, VA, USA, 2021. [Google Scholar]
- Schmidt, J.; Auer, M.; Moesslein, J.; Wendler, P.; Wiethoff, S.; Lang-Koetz, C.; Woidasky, J. Challenges and solutions for plastic packaging in a circular economy. Chem. Ing. Tech. 2021, 93, 1751–1762. [Google Scholar] [CrossRef]
- Adarsh, U.K.; Kartha, V.B.; Santhosh, C.; Unnikrishnan, V.K. Spectroscopy: A promising tool for plastic waste management. TrAC Trends Anal. Chem. 2022, 149, 116534. [Google Scholar] [CrossRef]
- Neo, E.; Yeo, Z.; Low, J.; Goodship, V.; Debattista, K. A review on chemometric techniques with infrared, Raman and laser-induced breakdown spectroscopy for sorting plastic waste in the recycling industry. Resour. Conserv. Recycl. 2022, 180, 106217. [Google Scholar] [CrossRef]
- Bosset, J.O.; Daget, N.; Desarzens, C.; Dieffenbacher, A.; Flückiger, E.; Lavanchy, P.; Nick, B.; Pauchard, J.-P.; Tagliaferri, E. The influence of light transmittance and gas permeability of various packing materials on the quality of whole natural yoghurt during storage. LWT Food Sci. Technol. 1986, 19, 104–116. [Google Scholar]
- Frederiksen, C.S.; Haugaard, V.K.; Poll, L.; Miquel Becker, E. Light-induced quality changes in plain yoghurt packed in polylactate and polystyrene. Eur. Food Res. Technol. 2003, 217, 61–69. [Google Scholar] [CrossRef]
- Böhner, N.; Adolf, L.; Tybussek, T.; Rieblinger, K.; Verin, M.; Langowski, H.-C. Influence of novel retail lighting on the quality of coffee cream in different types of packaging. Int. Dairy J. 2017, 64, 37–47. [Google Scholar] [CrossRef]
- Beauchamp, J.; Zardin, E.; Silcock, P.; Bremer, P.J. Monitoring photooxidation-induced dynamic changes in the volatile composition of extended shelf life bovine milk by PTR-MS. J. Mass Spectrom. 2014, 49, 952–958. [Google Scholar] [CrossRef]
- Zardin, E.; Silcock, P.; Siefarth, C.; Bremer, P.J.; Beauchamp, J. Dynamic changes in the volatiles and sensory properties of chilled milk during exposure to light. Int. Dairy J. 2016, 62, 35–38. [Google Scholar] [CrossRef]
- Fellows, P.J. 25—Packaging. In Food Processing Technology, 3rd ed.; Fellows, P.J., Ed.; Woodhead Publishing Series in Food Science, Technology and Nutrition; Woodhead Publishing: Sawston, UK, 2009; pp. 713–781. ISBN 978-1-84569-216-2. [Google Scholar]
- Grayhurst, P. 7—Glass packaging. In Packaging Technology; Emblem, A., Emblem, H., Eds.; Woodhead Publishing: Sawston, UK, 2012; pp. 109–121. ISBN 978-1-84569-665-8. [Google Scholar]
- Ten Klooster, R.; de Koeijer, B.; de Lange, J. Towards a Generic Set of Packaging Material Key Figures. In Proceedings of the 28th IAPRI Symposium on Packaging, Lausanne, Switzerland, 9–12 May 2017. [Google Scholar]
- Lilienfeld, R. A Study of Packaging Efficiency as It Relates to Waste Prevention; Prepared by the Editors of The ULS Report January 2016; ULS: Louisville, CO, USA, 2016. [Google Scholar]
- Kauertz, B.; Busch, M.; Bader, J. Ökobilanzielle Betrachtung von Getränkeverbundkartons in Deutschland. In Den Getränkesegmenten Säfte und Nektare Sowie H-Milch und Frischmilch; IFEU: Heidelberg, Germany, 2020. [Google Scholar]


| Filling Weight/g | Cup | Bucket | Pouch | Bottle | Glass Packaging | Brick | ∑ |
|---|---|---|---|---|---|---|---|
| 50 | 2 | 2 | |||||
| 60 | 1 | 1 | |||||
| 65 | 1 | 1 | |||||
| 70 | 1 | 1 | |||||
| 75 | 1 | 1 | |||||
| 80 | 1 | 1 | |||||
| 90 | 1 | 1 | 2 | ||||
| 100 | 5 | 1 | 1 | 4 | 11 | ||
| 115 | 4 | 4 | |||||
| 120 | 1 | 1 | |||||
| 125 | 3 | 2 | 5 | ||||
| 130 | 1 | 1 | |||||
| 150 | 29 | 1 | 30 | ||||
| 160 | 2 | 2 | |||||
| 175 | 5 | 5 | |||||
| 180 | 2 | 2 | |||||
| 200 | 14 | 1 | 15 | ||||
| 230 | 1 | 1 | |||||
| 250 | 8 | 1 | 2 | 11 | |||
| 255 | 1 | 1 | |||||
| 300 | 3 | 3 | |||||
| 330 | 1 | 1 | |||||
| 375 | 1 | 1 | |||||
| 400 | 8 | 1 | 9 | ||||
| 423 | 1 | 1 | |||||
| 450 | 1 | 1 | 2 | ||||
| 500 | 16 | 7 | 3 | 2 | 28 | ||
| 1000 | 1 | 5 | 1 | 7 |
Publisher’s Note: MDPI stays neutral with regard to jurisdictional claims in published maps and institutional affiliations. |
© 2022 by the authors. Licensee MDPI, Basel, Switzerland. This article is an open access article distributed under the terms and conditions of the Creative Commons Attribution (CC BY) license (https://creativecommons.org/licenses/by/4.0/).
Share and Cite
Kostic, D.; Hoffmann, U.; Fürtauer, S.; Fell, T.; Yilmaz, C.; Burth, D.; Sängerlaub, S. Packaging Weight, Filling Ratio and Filling Efficiency of Yogurt and Relevant Packagings Depending on Commercial Packaging Design, Material, Packaging Type and Filling Quantity. Dairy 2022, 3, 668-692. https://doi.org/10.3390/dairy3030046
Kostic D, Hoffmann U, Fürtauer S, Fell T, Yilmaz C, Burth D, Sängerlaub S. Packaging Weight, Filling Ratio and Filling Efficiency of Yogurt and Relevant Packagings Depending on Commercial Packaging Design, Material, Packaging Type and Filling Quantity. Dairy. 2022; 3(3):668-692. https://doi.org/10.3390/dairy3030046
Chicago/Turabian StyleKostic, Dejan, Udo Hoffmann, Siegfried Fürtauer, Tanja Fell, Cihat Yilmaz, Dirk Burth, and Sven Sängerlaub. 2022. "Packaging Weight, Filling Ratio and Filling Efficiency of Yogurt and Relevant Packagings Depending on Commercial Packaging Design, Material, Packaging Type and Filling Quantity" Dairy 3, no. 3: 668-692. https://doi.org/10.3390/dairy3030046