1. Introduction
The current research in the agri-food industry is oriented toward characterizing and developing natural products rich in bioactive compounds with functional and nutraceutical properties which are able to improve consumers health and in the prevention of diseases. Among animal products, milk and dairy foods have recently attracted growing interest other than for their high nutritional value, also as a source of biologically active peptides implicated in many regulatory processes or pathways in the body [
1,
2], including the effectiveness in the blood pressure-lowering [
3,
4,
5,
6]. Recent data highlight significant increases in hypertension or high blood pressure (BP), closely associated with the risk for stroke and cardiovascular disease, which represent the main causes of death in developed countries [
7,
8]. Multiple and complex factors are responsible for the pathogenesis of hypertension. These include genetics, activation of the sympathetic nervous system and renin-angiotensin-aldosterone system, endothelial dysfunction, obesity, insulin resistance and excess dietary sodium intake [
9]. Dairy products containing bioactive peptides with potential antihypertensive properties may be considered possible candidates to develop new health-promoting functional foods capable of preventing and managing hypertension and associated cardiovascular events. These functional foods might support pharmacological treatments without known side effects. Most of antihypertensive peptides in milk inhibit ACE activity, which is a pivotal component in the control of blood pressure [
10]. Therefore, ACE inhibitory activity of milk peptides might contribute to a reduced incidence of hypertension [
11].
The first discovered and most extensively studied peptides showing strong ACE-inhibitory activity in vitro were Valine-Proline-Proline (VPP, f84–86 of β-casein) and Isoleucine-Proline-Proline (IPP, f74–76 of β-casein as well as f108–110 of κ-casein) isolated from sour milk [
12], but other peptides, showing similar activity, have been discovered in fermented or enzymatic hydrolysates of bovine α-, β-and κ-casein [
13,
14]. Their efficacy has been demonstrated by in vitro assays, cell cultures and in animal and human studies [
15,
16,
17].
Biopeptides with ACE inhibitory sequences were identified in cheeses of Italian [
18,
19], Spanish [
20], Dutch [
21], Australian [
22] and Swiss [
23] origin.
In cheeses, it has been observed that the release of these naturally formed peptides from the native protein and their bioactivity depend on the variety and ripening stage of cheese. As the ripening continues, peptides can be further degraded to inactive fragments, and this reduces their bioavailability and the potential antihypertensive effect in vivo [
24,
25,
26]. Gastrointestinal digestion is expected to further modify this pattern [
27] and, indeed, peptides are also likely to be formed in the gastrointestinal tract upon digestion of cheese [
28].
Parmigiano Reggiano (PR) is an Italian Protected Designation of Origin (PDO) hard cheese, produced in a restricted geographic area in Northern Italy according to a 1955 law that defined the standard of this cheese. Several known biopeptides have been found in PR cheese and/or its digested products in vitro [
29,
30]. In our study [
19], we highlighted, for the first time, a consistent ACE-inhibitory activity of undigested and in vitro digested 3-kDa water-soluble extract (WSE) from 32-month-aged Parmigiano Reggiano and Grana Padano cheeses, attributable to the presence of ACE-inhibiting peptides naturally formed during the ripening process of cheeses. Results also showed that the IC
50 values of WSE were not affected by in vitro enzymatic digestion. Considering this study, we carried out subsequent in vitro research to identify and characterize the biopeptides of PR responsible for the ACE-inhibitory activity showed in vitro [
15]. This research revealed and quantified the presence of the potent ACE-inhibitors VPP, IPP, LHLPLP and AYFYPEL (with the respective truncated forms HLPLP and AYFYPE) in the 3-kDa ultrafiltered WSE from 12-months aged PR cheese and in PR digestates. These results are predictive of the potential role of PR cheese in reducing BP in vivo.
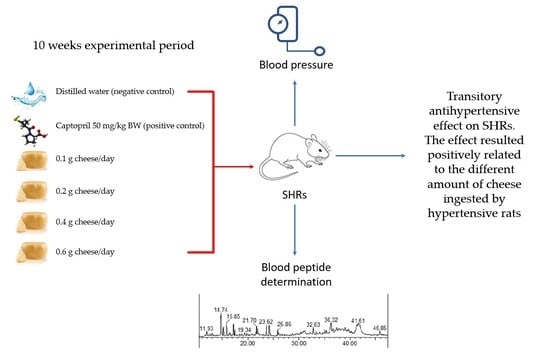
However, to date, nothing is known about the effects of dietary supplementation of PR cheese on blood pressure. Therefore, we performed an in vivo study to investigate the potential antihypertensive effect of dietary integration with four different amounts of 12 months aged PR cheese, already characterized in our previous in vitro study [
15], on spontaneously hypertensive rats (SHRs).
2. Materials and Methods
2.1. Determination of PR Cheese Chemical Composition and Mineral Elements Content
The sample of PR cheese aged for 12 months was manufactured using milk from Holstein cattle breed and was obtained from Italian manufacturer. The cheese sample was vacuum-wrapped and stored for a maximum of 5 days at 4 °C before analysis and administration.
For the determination of the PR cheese, the total nitrogen content was used Kjeldahl analysis [
31]. The total protein content was calculated from the nitrogen content by conversion of 6.38. The total fat content was determined by the Randall method [
32]. The moisture content was measured by direct heat method under vacuum conditions in vacuum oven at 100 °C for 5 h [
33]. Ash was determined with a furnace at 550 °C for 12 h [
34].
For determining Mg, Ca, Na, and K content [
35], cheese samples were mineralized through a MULTIWAVE GO PLUS microwave mineralizer (Anton Paar Italia S.r.l, Rivoli (Torino), Italy) before being analyzed by Atomic Absorption Spectrometer (AAS). An amount of 0.3 g of cheese was weighed in 50 mL Teflon vessels, with the addition of 8 mL of 67% HNO
3 for trace analysis (Carlo Erba Reagents, Milano, Italy), 1 mL of ASTM-I type ultrapure water and 1 mL of trace analysis grade H
2O
2. The microwave program consisted to a ramp from ambient temperature up to 180 °C in 10 min; then the in-vessel temperature was maintained at 180 °C for 20 min. After cooling, the digested sample solution was transferred into disposable 50 mL plastic tubes and brought to a volume of 10 mL with ultrapure water. The elemental analysis was performed by using an AA-7000 Atomic Absorption Spectrometer (Shimadzu Corporation, Tokyo, Japan) equipped with an ASC-7000 autosampler (Shimadzu, Tokyo, Japan). All the elements under examination (Mg, Ca, Na, and K) were analyses with a continuous flame atomization system (F-AAS) fueled with an air-acetylene gas mixture. A dilution by 1.000 with 2% HNO
3 was required to allow the samples’ absorbances to fall within the respective calibration curves. The readings were performed at 422.81 nm for Ca, 766.74 nm for K, 588.88 nm for Na and 285.01 nm for Mg. Calibrations were carried out by using certified standards (Carlo Erba Reagents, Milano, Italy) serially diluted to obtain 4 or 5 calibration points in the ranges: 0–2.5 ppm for Ca (R
2 = 1), 0–1 ppm for K (R
2 = 0.9998), 0–0.25 ppm for Mg (R
2 = 0.9999), and 0–0.5 ppm for Na (R
2 = 0.9985). To check the accuracy of the whole analytical process, Standard Reference Material 1549 (non-fat milk powder) certified by the National Institute of Standard and Technology (NIST, Gaithersburg, MD, USA) was used. The NIST sample (1 g) was mineralized according to the cheese samples procedure. The recovery values calculated for the studied elements were 92.4% for Ca, 70.8% for K, 70.2% for Mg and 81.9% for Na. The analytical data were corrected for the recovery. The cheese was analyzed in quadruple. All of the data are reported as g/100 g of cheese. The contents of the main chemical component and mineral elements of PR cheese are reported in
Table 1.
2.2. Animals and Experimental Design
All of the animal care and use procedures were reviewed by the Animal Care Ethics Committee of the University of Tuscia (Viterbo, Italy), approved by Italian Government Authorities, and were in accordance with European Guidelines. For the in vivo experiment, 30 male SHRs (Charles River Laboratories, Milan, Italy), 10 weeks old, were used. The SHRs were chosen for this study because represent the best accepted animal model for biology studies on human hypertension [
36].
Rats were housed in single cages under environmentally controlled conditions (23 °C and 12/12 h of light/dark cycles) with an inverted light cycle (constant darkness: from 07:00 a.m. to 07:00 p.m.; constant light: from 07:00 p.m. to 07:00 a.m.) to respect the normal circadian rhythm of animals.
All of the rats had free access to water and standard diet (Charles River diet, Purina 5L79), provided ad libitum throughout the study. Body weight (BW) was measured at the beginning (time 0) and at the end of the experimental period while systolic and diastolic blood pressure (SBP and DBP, respectively) were measured at time 0 and every 2 weeks, throughout the 10 weeks experimental period. After an adaptation period of three weeks to new environmental conditions, rats were subdivided into six groups (five animals/group) balanced for BW and BP. Each group received, in addition to the standard diet, a different daily treatment as follows: (1) 0.1 g PR cheese/rat, (2) 0.2 g PR cheese/rat, (3) 0.4 g PR cheese/rat, (4) 0.6 g PR cheese/rat, (5) captopril (50 mg/kg BW; Sigma Aldrich, Milan, Italy) that served as positive control and (6) distilled water, as the negative control. Captopril is a known potent, competitive inhibitor of angiotensin-converting enzyme (ACE) and is a drug used for high blood pressure treatment. All of the treatments were orally administered to rats over small pieces of cookies, fat, and salt free, 2 h after turning off the light.
In this study, a 12-months-age PR was chosen as this cheese cannot be sold before this period and the amounts of ACE-inhibitors, and their bioactivity, decreases as the ripening continues [
29]. The IC
50 of undigested and in vitro digested WSE and the content of ACE-inhibitory peptides of the cheese fed in the present study are described previously [
15].
The different doses of PR administered to rats have been chosen considering the minimum and the maximum amount of cheese that an adult man (70 kg BW) can really ingest on a daily basis, and with contents of fat, salt and cholesterol that do not cause side events for human health [
37].
2.3. Blood Pressure Measurements
Systolic and diastolic blood pressure (mmHg) of rats were measured every 2 weeks, 6 h after the PR, water or captopril ingestion, by using a non-invasive tail-cuff BP analyser (BP-2000, Visitech Systems, Apex, NC, USA). To allow for the optimal detection of the pulse of the tail artery, rats were kept under an infrared lamp at 36 °C for 10 min. The SBP and DBP values were presented as the average of at least five consecutive constant measurements [
19].
2.4. Blood Collection
At the end of the experimental period, after general anaesthesia, an intracardiac puncture for blood collection was performed to each rat. Blood samples were collected into vials containing heparin and immediately centrifuged. Plasma was separated and stored at −20 °C until analysed.
2.5. Biochemical Determinations
2.5.1. Reagents and Solvents
Peptides H-Ile-Pro-Pro-OH, H-Val-Pro-Pro-OH, H-Leu-His-Leu-Pro-Leu-Pro-OH (99.9%) and H-His-Leu-Pro-Leu-Pro-OH (96.2%) were purchased from Bachem (Bubendorf, Switzerland). N,N-dimethylformamide was purchased from Carlo Erba (Milan, Italy). Acetonitrile (≥99.95) was purchased from Honeywell (Morris Plains, NJ, USA). Fmoc-Tyr (tBu)-Wang resin (100–200 mesh), Fmoc-Gly-Wang resin (100–200 mesh), Fmoc-Glu (OtBu)-Wang resin (100–200 mesh), Fmoc-Leu-Wang resin (100–200 mesh), Fmoc-Leu-OH, Fmoc-Gly-OH, Fmoc-Ala-OH and Fmoc-Phe-OH, Fmoc-Arg (pbf)-OH and HBTU were purchased from Novabiochem (Merck, Darmstadt, Germany).
Deionized water was obtained with Select water purification system (Suez water, Thame, UK). Fmoc-Pro-OH (≥99%), N,N-diisopropylethylamine (≥99.0%), piperidine (99%), triisopropylsilane (98%), DL-dithiothreitol (≥99%), trifluoroacetic acid, dichloromethane, and formic acid (≥95%) were purchased from Sigma Aldrich (Saint Louis, MO, USA).
2.5.2. Peptide Synthesis
Peptides RYLGY, RYLG, AYFYPEL and AYFYPE were synthesised on solid phase using an automatic peptides synthesizer with a Fmoc/t-butyl strategy. Peptide synthesis is a method based on building peptides on an insoluble solid support. The Wang resins used were preloaded with Fmoc-tyrosin (tBu)-OH, Fmoc-glycine-OH, Fmoc-leucine-OH, and Fmoc-glutamic acid (OtBu)-OH, respectively. The synthesis was performed on a Syro I Fully Automatic peptide synthesizer (Biotage, Uppsala, Sweden) with a reaction scale of 25 µmol. Reaction steps were as follows:
(a) swelling: resin was shaken with 500 µL of dichloromethane, three cycles of 10 min each;
(b) deprotection of the N-term: one cycle was conducted with 40% v/v piperidine in dimethylformamide for 3 min, then a second cycle was conducted with 20% v/v piperidine in dimethylformamide for 12 min.
The resin was washed six times with dimethylformamide to remove piperidine residues;
(c) activation and coupling: in situ activation of the ester group was performed, adding to the resin the Fmoc amino acid, HBTU (2-(1H-benzotriazol-1-yl)-1,1,3,3-tetramethyluronium hexafluorophosphate) and DIEA (N,N-Diisopropylethylamine), in the ratio 1:4.03:3.97:8. The reaction lasted 40 min;
(d) reactions b and c were repeated until the end of the amino acid sequence.
The peptide was cleaved from the resin with a solution of trifluoroacetic acid, water, dithiothreitol and triisopropylsilane in the ratio 94:2.5:2.5:1 and purified on a Sep-Pak C18 cartridge (Waters, Milford, MA, USA). Peptides were quantified with HPLC-UV (λ = 214 nm) according to Kuipers and Gruppen, [
38]. Reaction yields: RYLGY 29%, RYLG 50%, AYFYPEL 47%, AYFYPE 70%.
2.6. UHPLC/ESI-MS/MS Analysis
UHPLC/ESI-MS/MS analysis stands for “Ultra High-Performance Liquid Chromatography coupled to Electrospray Ionization Tandem Mass Spectrometry”. This is a powerful analytical technique to separate compounds in complex mixtures and to detect them with very high specificity and selectivity. MS/MS conditions for standard peptides detection were tuned by infusion (10 µL/min) of a 10 µM aqueous solution. Optimized MS/MS parameters, used for the subsequent Selection Reaction Monitoring (SRM), are reported in
Table 2.
The separation was achieved by means of reverse phase ultra-high-performance liquid chromatography. Aeris Peptide 1.7 µm XB-C18 column (100 Å, 150 × 2.1 mm; Phenomenex, Torrance, CA, USA) was used for the chromatographic analysis, equipped with a Security Guard ULTRA Cartridge (C18-Peptide, ID 2.1 mm; Phenomenex, Torrance, CA, USA). Chromatographic separation was run in a Dionex Ultimate 3000 UHPLC. The flow was set at 0.2 mL/min, column temperature at 35 °C and sample temperature at 18 °C; eluent A was water with 0.1% (v/v) of formic acid and 0.2% (v/v) of acetonitrile, eluent B was acetonitrile with 0.1% (v/v) formic acid and 0.2% of water. Gradient elution was performed, according to the following parameters: 0–7 min 100% A, 7–50 min from 100% A to 50% A, 50–52.6 min 50% A, 52.6–53 min from 50% A to 0% A, 53–58.2 min 0% A, 58.2–59 min from 0% A to 100% A, 59–72 min 100% A (total analysis time 72 min).
Detection was achieved using a triple-stage quadrupole mass spectrometer (TSQ Vantage, Thermo Fisher Scientific, Waltham, MA, USA) with the following parameters: solvent delay 0–7 min, acquisition 7–58.2 min, ionization type positive ions; spray voltage 3500 V, vaporizer temperature 250 °C; sheath gas pressure 22; capillary temperature 250 °C. For the Selected Reaction Monitoring method, the monitored transitions are reported in
Table 2. The first reported fragment was used as a quantifier, the second one as a qualifier. UHPLC/ESI-MS data were elaborated using Xcalibur software (Thermo Fisher Scientific, Waltham, MA, USA). Given the complexity of the matrix (rat sera), no direct analysis of the sample was possible due to the very high counter pressure of the system. Thus, prior to injection, sample clean-up was performed by solid phase extraction (SPE) using Sep-Pak C18 Plus short cartridges (Waters, Milford, MA, USA) according to the manufacturer instructions. Briefly, 100 µL of the sample was diluted to 2 mL with deionized water and flushed on the cartridge. Part of the interferences and salts are then removed by flushing 10 mL of solution A (water 98%, acetonitrile 2%, formic acid 0.1%). Finally, the peptide fraction is eluted with 5 mL of solution B (water 35%, acetonitrile 65%, formic acid 0.1%). Samples are dried under nitrogen flux and reconstituted with 100 µL of water acidified with 0.1% formic acid. Injection volume was 5 µL.
A calibration curve for the peptide standards was performed by injecting solutions at 20, 40, 60, 80 and 100 nM. Linearity, LOD (Limit of Detection) and LOQ (Limit of Quantification) were calculated from these curves. The LOD and LOQ values were calculated on the peptide solutions because of the limited amount of blank plasma available. The calculation of the LOD and the LOQ on the cheese samples (which are solid) would have implied an extraction phase from the cheese, which is different from the clean-up phase of the plasma, and thus the LOD and the LOQ would have been affected by the method used. Details are reported in
Table 3. Thus, a sample clean-up was performed with Sep-Pak cartridges. Recovery experiments were performed by spiking the blank sera with the peptide standards to a final concentration of 50 nM. Recovery rates were: (30%) VPP, (64%) IPP, (96%) RYLGY, (80%) RYLG, (67%) AYFYPEL, (75%) AYFYPE, (75%) LHLPLP and (103%) HLPLP.
2.7. Statistical Analyses
Data expressed as least-square means and standard error of the mean were analysed by repeated measures using a general linear model procedure considering the week of sampling as the repeated effect. SBP and DBP of rats were set as dependent variables, while PR, captopril, water, and week as independent variables.
The subject (rat) was included in the model and considered as an uncorrelated random effect. Duncan’s multiple range test was used to evaluate the differences and the significances were set at a value of p < 0.05. The analysis was carried out using the Statistica 7.0 software (Stat Soft, Inc., Tulsa, OK, USA).
3. Results
3.1. Body Weight
Table 4 shows the means and SE of BW in the different groups of SHRs at the beginning (time 0) and at the end of the experiment. At time 0, the averages of BW were similar in all examined groups of rats (296.8 ± 1.2 g), then gradually increased until the end of the treatment period, but no significant differences in BW gain were observed among all groups having dietary integration or water, except in rats receiving captopril (positive control) which showed a lower growth performance (
p < 0.05) than other rats.
3.2. Blood Pressures
No differences between systolic and diastolic blood pressure were found among all of the groups of SHRs tested at the beginning (time 0) of the study (
Table 5 and
Table 6).
Systolic pressure showed a decrease (p < 0.05) after 35 days from the beginning of the treatment in rats supplemented with 0.2 g/d of PR (−8 mmHg vs. day 0); after 21 days in rats supplemented with 0.4 g/d of PR (−8 mmHg vs. day 0), and after 21 (−8 mmHg vs. day 0) and 35 days (−13 mmHg vs. day 0) in rats supplemented with 0.6 g/d of PR. In the same period, dietary integration with 0.1 g/d of PR and water did not induce significant changes in SBP.
Diastolic pressure decreased (p < 0.05) after 21 days of treatment in SHRs supplemented with 0.1, 0.2, 0.4 and 0.6 g/d of PR (−14, −20, −27, −31 mmHg vs. day 0, respectively). Rats supplemented with 0.6 g/d of cheese maintained lower values of DBP also at 35 days (−29 mmHg vs. day 0). In the same period, dietary integration with water, did not show significant changes in DBP of SHRs.
Starting from the 35th days of PR treatment, both systolic and diastolic pressure increased (p < 0.05) in all groups of SHRs, reaching final values greater than that registered at the beginning of the trial.
As expected, due to a more immediate bioavailability of the active ingredients of captopril (positive control) compared to the biopeptides present in PR, the pharmacological treatment induced a decrease (p < 0.01) in BP in SHRs after 7 days (−34 mmHg vs. day 0, for SBP; −29 mmHg vs. day 0, for DBP) and BP remained low (p < 0.01) until the end of the experiment.
3.3. Biochemical Analysis
No ACE-inhibitory peptides or other PR-derived peptides under control were detected in the sera of rats treated with the different amounts of PR (from 0.1 to 0.6 g/d of cheese/rat), neither (as expected) in the controls treated with captopril or water in blood sampled at the end of the experimental period. The LOD and LOQ values (
Table 3) indicate a very low concentration of antihypertensive PR peptides in circulating blood.
4. Discussion
This study is part of the objectives of agri-food research intended to verify the potential antihypertensive effect of hard-cheeses. In particular, our research dealt with the effect of long-term intake of PR cheese on blood pressure changes in SHRs.
The results of the present study showed that daily dietary integration with four different amounts of 12-months aged PR cheese led to a transitory reduction in systolic and diastolic BP values of SHRs after 21 and 35 days of cheese intake and that reduction is positively related to the amount of PR consumed. As observed in some studies, including our previous research [
15,
19,
29], several ACE-inhibitory peptides with ascertained antihypertensive effects have been found in PR cheese and/or its in vitro digestates. Therefore, we can assume that the reduction in BP of SHRs observed in this study could be attributed to the antihypertensive components of PR. After the 35th day of treatment, no significant beneficial effect of PR hypotensive peptides on rats’ pressure was observed.
Most of the studies on antihypertensive peptides report conflicting results about the in vivo effects of biopeptides identified as potent ACE-inhibitors under in vitro conditions [
10,
39]. For example, acute BP lowering effect was observed in SHRs, but not in normotensive Wistar-Kyoto rats, after oral administration of food supplemented with IPP and VPP or after intravenous injection or intraperitoneal administration of ACE-inhibitory peptides from bovine lactoferrin [
12] or whey protein [
40]. In clinical trials, the enzymatically hydrolysed peptides IPP and VPP from milk proteins resulted clinically hypotensive only at elevated BP values and not in mild hypertensive subjects [
41]. Moreover, they were able to induce a small, pooled decrease in SBP and not in DBP [
42]. Other studies showed that IPP and VPP and other potent in vitro ACE-inhibitory peptides, such as α
s1-casein f(23–27) or the fragment 142–148 of β-lactoglobulin, did not lead to a significant change in BP of hypertensive subjects compared with placebo [
43,
44].
However, several variables may be responsible for the different BP responses observed in vivo, for example, the different animal model used, the hypertensive state of animals or patients, the number of peptides provided and the time and the route of administration.
The best approach to establish the relationship between in vitro and in vivo efficacy of biopeptides is considering their bioavailability, needed for their bioactivity in vivo [
45]. Indeed, to exert biological effects in vivo, peptides must be absorbed in an intact form until reaching the bloodstream and the target organs [
46].
This is determined by many factors linked to digestion and other processing that could mean that the in vitro digestion model is not completely representative of the in vivo system where biopeptides can be generated in lower amount or maybe degraded to shorter inactive fragments by gastrointestinal proteinases and peptidases which occur during these processes [
10,
46]. Moreover, after gastrointestinal digestion, further cleavage of biopeptides can occur during their absorption through the intestinal epithelium by cytosolic peptidases present on the enterocytic brush border, or during their passage into the bloodstream by vascular endothelial tissue peptidases and soluble plasma peptidases [
47]. Additionally, Yamada et al. [
48] reported that a further cause for the loss of activity by peptides is their modification in the liver. All of these processes play an important role in determining the integrity and the final amount of the circulating peptides that could be too low to seriously limit their acceptable bioavailability and therefore the antihypertensive effect in vivo [
49]. For example, Vermeirssen et al. [
50] assessed that the peptide Ala-Leu-Pro-Met-His-Ile-Arg, derived from a tryptic digest β-lactoglobulin, resisted to gastrointestinal digestion, and was absorbed intact across the Caco-2 cell monolayer (an in vitro model of human intestinal epithelium), but the amount of biopeptides was too low to exert a hypotensive activity. Other studies reported that ACE inhibitory peptides are partially hydrolysed by Caco2 cell peptidases and only a small percentage can cross intact the intestinal barrier [
15,
51]. Van der Pijl et al. [
52], in a study on pig model, found that the synthetic tripeptides, IPP, VPP and LPP, administered intravenously or intragastrically, reached the blood circulation intact, but with a bioavailability of about 0.1% and with a half-live of absorption and elimination maximally about 5 and 15 min, respectively, suggesting that under these conditions their bioactive effect would be rather acute. The results of these studies clearly indicate that peptides to exert their biological activity (for example, BP lowering) need to reach the blood circulation and the target organs not only in an intact or active form but also in a physiologically relevant concentration [
46].
In the present study, dietary supplementation with PR cheese only induced a transitory antihypertensive effect on SHRs that was no longer noticeable after week 5 and up to the end of the experimental period. This transitory antihypertensive effect is not easy to explain. The bioavailability of the ACE inhibitory peptides (considering digestion and assimilation, and, above all, the amount) was probably not sufficient to determine a very evident and permanent bioactivity. Another possible justification is that in the second part of the trial the increase in BP, linked to the enhance of age SHRs, might have masked and reduced the effects of hypotensive biopeptides. This hypothesis is also supported by the lack of detection of ACE-inhibitory peptides in the sera of SHRs at the end of the experimental period (the limits of detection for the studied biopeptides was lower than their IC
50, [
1]) and that could explain the outcome of the study.


 ,
, 
