
In Vitro and In Vivo Evaluation of the Effects of a Compound Based on Plants, Yeast and Trace Elements on the Ruminal Function of Dairy Cows


Abstract
:
1. Introduction
2. Materials and Methods
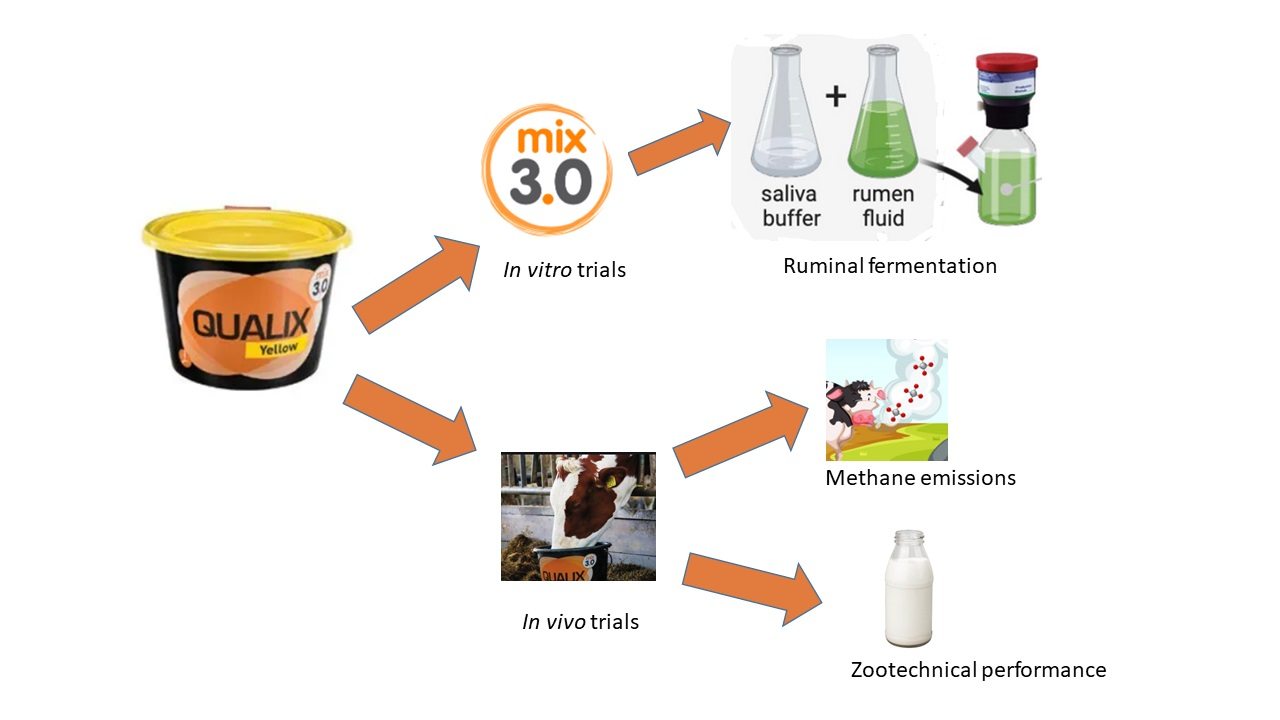
2.1. In Vitro Trials
2.2. In Vivo Trials
2.2.1. Study Site
2.2.2. Experimental Design and Animals
2.2.3. Pasture Layout
2.2.4. Statistical Analysis
- Statistical Analysis In Vitro
- Statistical Analysis In Vivo
3. Results
3.1. In Vitro
3.2. In Vivo
3.2.1. Grazing
3.2.2. Mineral Inputs
3.2.3. Production Performance
4. Discussion
5. Conclusions
6. Patents
Author Contributions
Funding
Institutional Review Board Statement
Informed Consent Statement
Data Availability Statement
Conflicts of Interest
References
- Wilkinson, J.M.; Lee, M.R.F.; Rivero, M.J.; Chamberlain, A.T. Some challenges and opportunities for grazing dairy cows on temperate pastures. Grass Forage Sci. 2020, 75, 1–17. [Google Scholar] [CrossRef]
- Clay, N.; Garnett, T.; Lorimer, J. Dairy intensification: Drivers, impacts and alternatives. Ambio 2020, 49, 35–48. [Google Scholar] [CrossRef] [Green Version]
- Knapp, J.R.R.; Laur, G.L.L.; Vadas, P.A.A.; Weiss, W.P.P.; Tricarico, J.M.M. Invited review: Enteric methane in dairy cattle production: Quantifying the opportunities and impact of reducing emissions. J. Dairy Sci. 2014, 97, 3231–3261. [Google Scholar] [CrossRef] [PubMed] [Green Version]
- Gerber, P.J.; Hristov, A.N.; Henderson, B.; Makkar, H.; Oh, J.; Lee, C.; Meinen, R.; Montes, F.; Ott, T.; Firkins, J.; et al. Technical options for the mitigation of direct methane and nitrous oxide emissions from livestock: A review. Animal 2013, 7, 220–234. [Google Scholar] [CrossRef] [PubMed] [Green Version]
- Castillo, A.R.; Kebreab, E.; Beever, D.E.; France, J. A review of efficiency of nitrogen utilisation in lactating dairy cows and its relationship with environmental pollution. J. Anim. Feed Sci. 2000, 9, 1–32. [Google Scholar] [CrossRef]
- Szumacher-Strabel, M.; Cieślak, A. Potential of phytofactors to mitigate rumen ammonia and methane production. J. Anim. Feed Sci. 2010, 19, 319–337. [Google Scholar] [CrossRef]
- Andrieu, S. Is there a role for organic trace element supplements in transition cow health? Vet. J. 2008, 176, 77–83. [Google Scholar] [CrossRef] [PubMed]
- Spears, J.W.; Weiss, W.P. INVITED REVIEW: Mineral and vitamin nutrition in ruminants 1. Prof. Anim. Sci. 2014, 30, 180–191. [Google Scholar] [CrossRef]
- Mulligan, F.J.; Doherty, M.L. Production diseases of the transition cow. Vet. J. 2008, 176, 3–9. [Google Scholar] [CrossRef]
- Sordillo, L.M. Selenium-dependent regulation of oxidative stress and immunity in periparturient dairy cattle. Vet. Med. Int. 2013, 2013, 154045. [Google Scholar] [CrossRef] [Green Version]
- NRC. Nutrient Requirements of Dairy Cattle: Seventh Revised Edition; National Academy of Sciences: Washington, DC, USA, 2001. [Google Scholar]
- Menke, K.H.; Steingass, H. Estimation of the energic feed value obtained from chemical analysis and in vitro gas production using rumen fluid. Anim. Res. Dev. 1988, 28, 7–55. [Google Scholar]
- Menke, K.H.; Raab, L.; Salewski, A.; Steingass, H.; Fritz, D.; Schneider, W. The estimation of the digestibility and metabolizable energy content of ruminant feedingstuffs from the gas production when they are incubated with rumen liquor in vitro. J. Agric. Sci. 1979, 93, 217–222. [Google Scholar] [CrossRef] [Green Version]
- Association of Official Analytical Chemists. Official Methods of Analysis, 15th ed.; AOAC: Arlington, VA, USA, 1990. [Google Scholar]
- Van Soest, P.; Robertson, J.; Lewis, B. Methods for dietary fiber, neutral fiber and nonstarch polysaccharides in relation to animal nutrition. J. Dairy Sci. 1991, 74, 3588–3595. [Google Scholar] [CrossRef]
- Hébrard-Labit, C.; Meffray, L. Comparaison de méthodes d’analyse des Éléments Traces Métalliques ETM et des Hydrocarbures Aromatiques Polycycliques HAP sur les sols et les végétaux. Rapp. Rech. Du Cent. D’études Sur Les Réseaux Les Transp. L’urbanisme Les Constr. Publiques (CERTU) 2004, 73–74. [Google Scholar]
- Garnsworthy, P.C.; Craigon, J.; Hernandez-Medrano, J.H.; Saunders, N. On-farm methane measurements during milking correlate with total methane production by individual dairy cows. J. Dairy Sci. 2012, 95, 3166–3180. [Google Scholar] [CrossRef] [Green Version]
- Garnsworthy, P.C.; Craigon, J.; Hernandez-Medrano, J.H.; Saunders, N. Variation among individual dairy cows in methane measurements made on farm during milking. J. Dairy Sci. 2012, 95, 3181–3189. [Google Scholar] [CrossRef] [Green Version]
- Haque, M.N.; Cornou, C.; Madsen, J. Individual variation and repeatability of methane production from dairy cows estimated by the CO2 method in automatic milking system. Animal 2017, 9, 1567–1576. [Google Scholar] [CrossRef] [Green Version]
- Vanlierde, A.; Vanrobays, M.L.; Gengler, N.; Dardenne, P.; Froidmont, E.; Soyeurt, H.; McParland, S.; Lewis, E.; Deighton, M.H.; Mathot, M.; et al. Milk mid-infrared spectra enable prediction of lactation-stage-dependent methane emissions of dairy cattle within routine population-scale milk recording schemes. Anim. Prod. Sci. 2016, 56, 258–264. [Google Scholar] [CrossRef] [Green Version]
- Vanlierde, A.; Soyeurt, H.; Gengler, N.; Colinet, F.G.; Froidmont, E.; Kreuzer, M.; Grandl, F.; Bell, M.; Lund, P.; Olijhoek, D.W.; et al. Short communication: Development of an equation for estimating methane emissions of dairy cows from milk Fourier transform mid-infrared spectra by using reference data obtained exclusively from respiration chambers. J. Dairy Sci. 2018, 101, 7618–7624. [Google Scholar] [CrossRef] [Green Version]
- Denninger, T.M.; Schwarm, A.; Dohme-Meier, F.; Münger, A.; Bapst, B.; Wegmann, S.; Grandl, F.; Vanlierde, A.; Sorg, D.; Ortmann, S.; et al. Accuracy of methane emissions predicted from milk mid-infrared spectra and measured by laser methane detectors in Brown Swiss dairy cows. J. Dairy Sci. 2020, 103, 2024–2039. [Google Scholar] [CrossRef]
- Denninger, T.M.; Dohme-Meier, F.; Eggerschwiler, L.; Vanlierde, A.; Grandl, F.; Gredler, B.; Kreuzer, M.; Schwarm, A.; Münger, A. Persistence of differences between dairy cows categorized as low or high methane emitters, as estimated from milk mid-infrared spectra and measured by GreenFeed. J. Dairy Sci. 2019, 102, 11751–11765. [Google Scholar] [CrossRef] [Green Version]
- Edmonson, A.J.; Lean, I.J.; Weaver, L.D.; Farver, T.; Webster, G. A body condition scoring chart for Holstein dairy cows. J. Dairy Sci. 1989, 72, 68–78. [Google Scholar] [CrossRef]
- Carta, P. The Physically Effective Fiber of Total Mixed Rations and its Effects on dairy Cow Performances. Ph.D. Thesis, Università degli Studi di Sassari, Sassari, Italy, 2010. [Google Scholar]
- Weiss, B. Update on Trace Mineral Requirements for Dairy Cattle. Available online: https://dairy-cattle.extension.org/update-on-trace-mineral-requirements-for-dairy-cattle/ (accessed on 24 August 2021).
- Meschy, F. Alimentation minérale et vitaminique des ruminants: Actualisation des connaissances. Prod. Anim. 2007, 20, 119–128. [Google Scholar] [CrossRef]
- Perdomo, M.C.; Marsola, R.S.; Favoreto, M.G.; Adesogan, A.; Staples, C.R.; Santos, J.E.P. Effects of feeding live yeast at 2 dosages on performance and feeding behavior of dairy cows under heat stress. J. Dairy Sci. 2020, 103, 325–339. [Google Scholar] [CrossRef] [PubMed] [Green Version]
- Eckard, R.J.; Grainger, C.; de Klein, C.A.M. Options for the abatement of methane and nitrous oxide from ruminant production: A review. Livest. Sci. 2010, 130, 47–56. [Google Scholar] [CrossRef]
- Calsamiglia, S.; Busquet, M.; Cardozo, P.W.; Castillejos, L.; Ferret, A. Invited review: Essential oils as modifiers of rumen microbial fermentation. J. Dairy Sci. 2007, 90, 2580–2595. [Google Scholar] [CrossRef] [Green Version]
- El-Saber Batiha, G.; Magdy Beshbishy, A.; Wasef, L.G.; Elewa, Y.H.; Al-Sagan, A.; Abd El-Hack, M.E.; Taha, A.E.; Abd-Elhakim, Y.M.; Devkota, H.P. Chemical constituents and pharmacological activities of Garlic (Allium sativum L.): A review. Nutrients 2020, 12, 872. [Google Scholar] [CrossRef] [Green Version]
- Greathead, H. Plants and plant extracts for improving animal productivity. In Proceedings of the Nutrition Society; Cambridge University Press: Cambridge, UK, 2003; pp. 279–290. [Google Scholar]
- Lewis, K.A.; Tzilivakis, J.; Green, A.; Warner, D.J. Potential of feed additives to improve the environmental impact of European livestock farming: A multi-issue analysis. Int. J. Agric. Sustain. 2015, 13, 55–68. [Google Scholar] [CrossRef] [Green Version]
- Góral, I.; Wojciechowski, K. Surface activity and foaming properties of saponin-rich plants extracts. Adv. Colloid Interface Sci. 2020, 279, 102145. [Google Scholar] [CrossRef]
- Wanapat, M.; Cherdthong, A.; Phesatcha, K.; Kang, S. Dietary sources and their effects on animal production and environmental sustainability. Anim. Nutr. 2015, 1, 96–103. [Google Scholar] [CrossRef]
- Martin, C.; Morgavi, D.P.; Doreau, M. Methane mitigation in ruminants: From microbe to the farm scale. Animal 2010, 4, 351–365. [Google Scholar] [CrossRef] [Green Version]
- Beauchemin, K.A.; Kreuzer, M.; Mcallister, T.A. Nutritional management for enteric methane abatement. Aust. J. Exp. Agric. 2008, 28, 21–27. [Google Scholar] [CrossRef]
- Van Zijderveld, S.M.; Gerrits, W.J.J.; Dijkstra, J.; Newbold, J.R.; Hulshof, R.B.A.; Perdok, H.B. Persistency of methane mitigation by dietary nitrate supplementation in dairy cows. J. Dairy Sci. 2011, 94, 4028–4038. [Google Scholar] [CrossRef]
- Dijkstra, J.; Oenema, O.; Bannink, A. Dietary strategies to reducing N excretion from cattle: Implications for methane emissions. Curr. Opin. Environ. Sustain. 2011, 3, 414–422. [Google Scholar] [CrossRef]
- Khiaosa-ard, R.; Zebeli, Q. Cattle’s variation in rumen ecology and metabolism and its contributions to feed efficiency. Livest. Sci. 2014, 162, 66–75. [Google Scholar] [CrossRef]
- Hristov, A.N.; Oh, J.; Firkins, J.L.; Dijkstra, J.; Kebreab, E.; Waghorn, G.; Makkar, H.P.S.; Adesogan, A.T.; Yang, W.; Lee, C.; et al. SPECIAL TOPICS—Mitigation of methane and nitrous oxide emissions from animal operations: I. A review of enteric methane mitigation options 1. J. Anim. Sci. 2013, 91, 5045–5069. [Google Scholar] [CrossRef] [Green Version]
- Abdoun, K.; Stumpff, F.; Martens, H. Ammonia and urea transport across the rumen epithelium: A review. Anim. Health Res. Rev. 2006, 7, 43–59. [Google Scholar] [CrossRef] [Green Version]
- Oh, J.; Harper, M.; Hristov, A.N. Effects of lowering crude protein supply alone or in a combination with essential oils on productivity, rumen function and nutrient utilization in dairy cows. Animal 2019, 13, 2510–2518. [Google Scholar] [CrossRef]
- Oh, J.; Hristov, A.N. Effects of plant-derived bio-active compounds on rumen fermentation, nutrient utilization, immune response, and productivity of ruminant animals. ACS Symp. Ser. 2016, 1218, 167–186. [Google Scholar] [CrossRef]
- Jayanegara, A.; Yogianto, Y.; Wina, E.; Sudarman, A.; Kondo, M.; Obitsu, T.; Kreuzer, M. Combination effects of plant extracts rich in tannins and saponins as feed additives for mitigating in vitro ruminal methane and ammonia formation. Animals 2020, 10, 1531. [Google Scholar] [CrossRef] [PubMed]
- Lessire, F.; Jacquet, S.; Veselko, D.; Piraux, E.; Dufrasne, I. Evolution of grazing practices in Belgian dairy farms: Results of two surveys. Sustainability 2019, 11, 3997. [Google Scholar] [CrossRef] [Green Version]
- Kljak, K.; Heinrichs, B.S.; Heinrichs, A.J. Fecal particle dry matter and fiber distribution of heifers fed ad libitum and restricted with low and high forage quality. J. Dairy Sci. 2019, 102, 4694–4703. [Google Scholar] [CrossRef] [PubMed]
- Poppi, D.P.; Norton, B.W.; Minson, D.J.; Hendricksen, R.E. The validity of the critical size theory for particles leaving the rumen. J. Agric. Sci. 1980, 94, 275–280. [Google Scholar] [CrossRef]
- Beguin, J.M.; Dagorne, R.P.; Giirona, A. Teneur en éléments minéraux de l’herbe pâturée par les vaches laitières. In Proceedings of the Rencontres Autour des Recherches sur les Ruminants, Paris, France, 5–6 December 2001. [Google Scholar]


| Control | MIX 3.0 | Statistical Significance | |
|---|---|---|---|
| dNDF (%) after 24 h | 45.2 ± 3.3 | 50.2 ± 1.6 | * |
| dADF(%) after 24 h | 38.7 ± 2.1 | 43.1 ± 3.1 | * |
| Protozoa (×105/mL) after 6 h | 3.11 ± 2.1 | 1.96 ± 1.3 | ** |
| Protozoa (×105/mL) after 24 h | 4.09 ± 2.0 | 2.00 ± 1.9 | *** |
| CH4 (mL/g DM) | 22.8 ± 2.1 | 14.4 ± 1.2 | *** |
| NH3 (mMol/L) after 6 h | 7.81 ± 0.29 | 4.58 ± 1.94.0 | *** |
| NH3 (mMol/L) after 24 h | 14.86 ± 2.81 | 7.81 ± 0.74 | *** |
| Control | MIX 3.0 | Statistical Significance | |
|---|---|---|---|
| Acetic acid (mMol/L) after 6 h | 35.26 ± 4.5 | 34.18 ± 3.9 | ns |
| Acetic acid (mMol/L) after 24 h | 50.16 ± 2.6 | 49.54 ± 10.0 | ns |
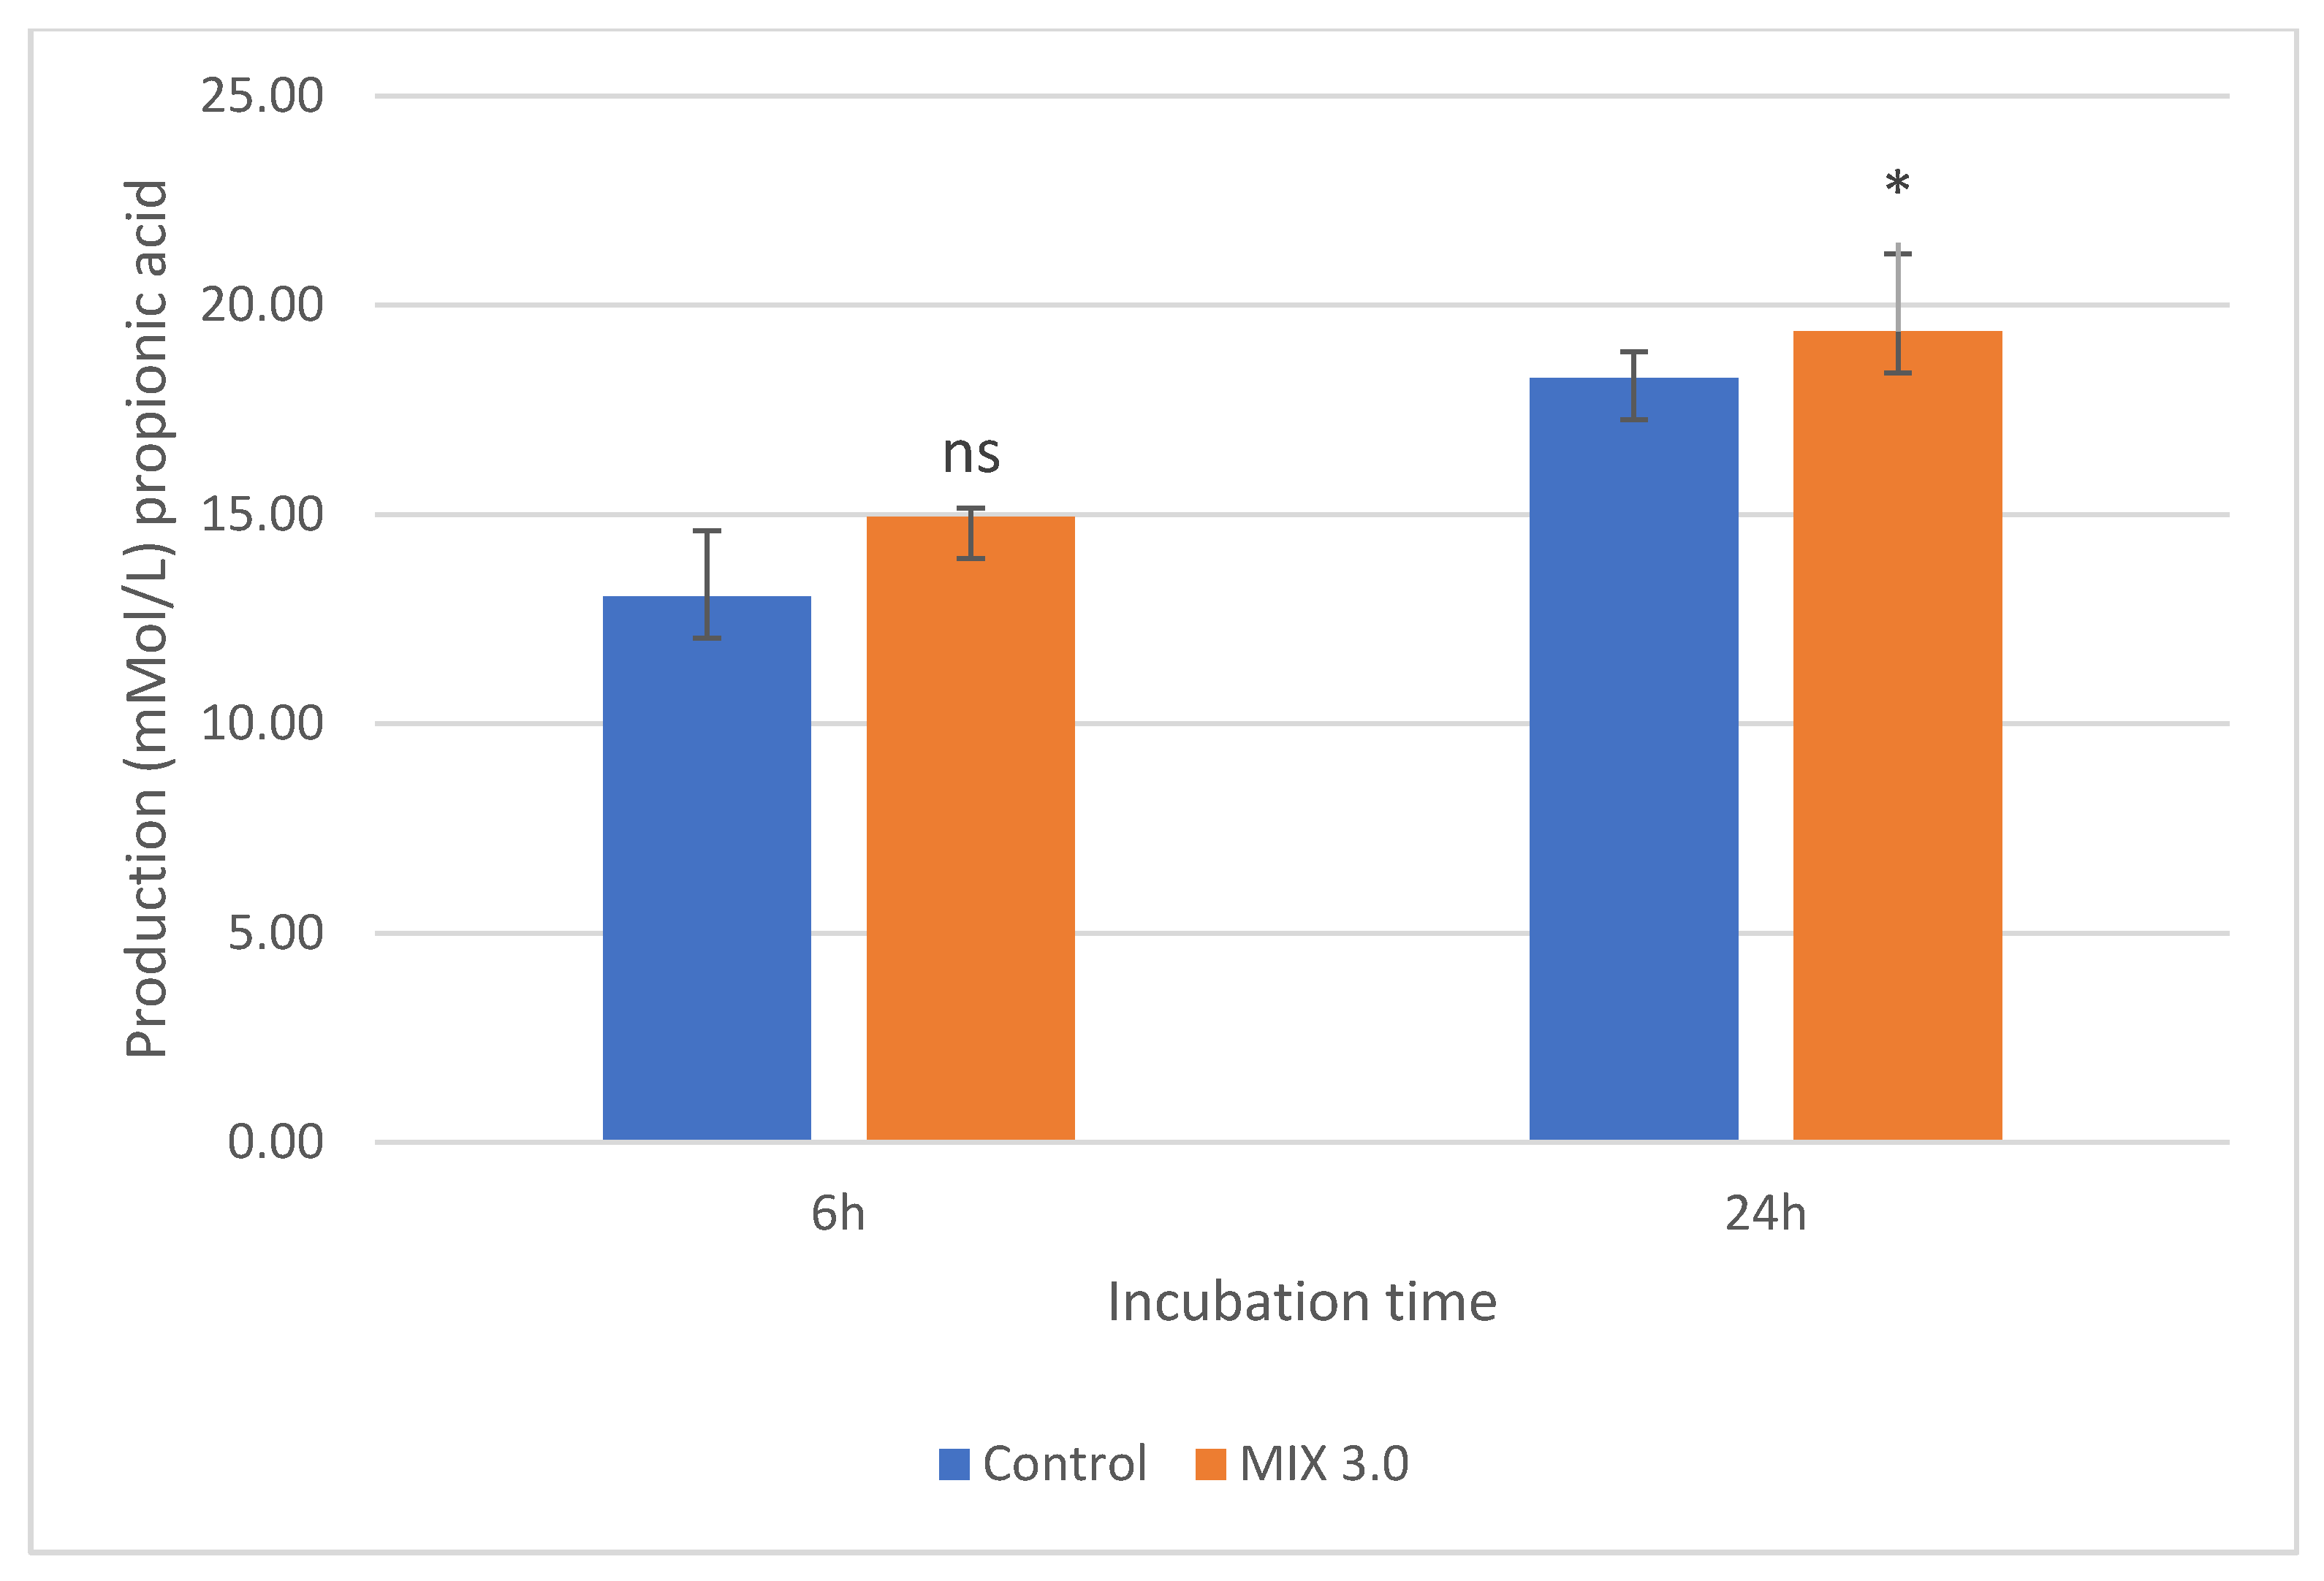
| Propionic acid (mMol/L) after 6 h | 13.04 ± 1.6 | 14.94 ± 0.2 | ns |
| Propionic acid (mMol/L) after 24 h | 18.26 ± 0.6 | 19.57 ± 1.9 | * |
| Butyric acid (mMol/L) after 6 h | 11.26 ± 1.9 | 9.56 ± 1.1 | ns |
| Butyric acid (mMol/L) after 24 h | 14.19 ± 0.7 | 13.00 ± 3.8 | ns |
| g/kg DM | Grazed Grass August | Grazed Grass September | Cereal Crop Silage | Concentrate |
|---|---|---|---|---|
| DM (%) | 21.7 ± 4.3 | 16.9 ± 2.9 | 32 | 88.5 |
| CP | 233 ± 29 | 260 ± 25 | 102 | 200 |
| Cellulose | 196 ± 12 | 204 ± 21 | 297 | 115 |
| NDF | 420 ± 12 | 411 ± 29 | 519 | 278 |
| ADF | 256 ± 13 | 261 ± 22 | 341 | 133 |
| Lignin | 49 ± 4 | 48 ± 5 | ||
| VEM | 1029 ± 30 | 1013 ± 30 | 760 | 870 |
| Total Ashes | 110 ± 6 | 142 ± 28 | 58 | 106 |
| Content (mg/kg DM) | Grazed Grass | Cereal Crop Silage | Concentrate |
|---|---|---|---|
| Zinc | 27 | 61 | 115 |
| Manganese | 20.5 | 25 | 83.3 |
| Copper | 9.4 | 5.6 | 23.1 |
| Cobalt | 0.1 | 0.03 | 1 |
| Selenium | 0.1 | 0.05 | 0.4 |
| Iodine | 0.1 | 0.3 | 1.6 |
| Inputs by Concentrate Intake 1.20 kg DM | Inputs by Grazed Grass Intake 10.5 kg DM | Inputs by Cereal Crop Intake 11.2 kg DM | Total (mg/d) | Inputs by QY Intake (mg/d) | Total (mg/d) GQY | Requirements (mg/d) [26] | Requirements (mg/d) [27] | |
|---|---|---|---|---|---|---|---|---|
| Zinc | 137 | 284 | 683 | 1105 | 236 | 1133 | 990 | 1195 |
| Manganese | 100 | 215 | 280 | 595 | 28 | 831 | 582 | 1195 |
| Copper | 28 | 99 | 63 | 189 | 59 | 248 | 506 | 445 |
| Cobalt | 1.20 | 1.05 | 0.34 | 2.59 | 4.72 | 7.31 | 8.80 | 6.60 |
| Selenium | 0.48 | 1.05 | 0.54 | 2.06 | 1.18 | 3.25 | 6.60 | 2.2 |
| Iodine | 1.92 | 1.05 | 3.36 | 6.33 | 11.8 | 18.13 | 9.92 | 12.0 |
| Total Diet Fed to GQY | Total Diet Fed to GC | |
|---|---|---|
| Total kg DM fed per day | 23 | 23.2 |
| Nutritional inputs | ||
| g/kg DM | ||
| DM | 290 | 300 |
| CP | 173 | 174 |
| cellulose | 242 | 241 |
| NDF | 457 | 456 |
| ADF | 291 | 290 |
| VEM | 882 | 885 |
| Mineral inputs mg/kg DM | ||
| Zinc | 49 | 49 |
| Manganese | 36.1 | 26.7 |
| Copper | 10.8 | 8.4 |
| Cobalt | 0.32 | 0.12 |
| Selenium | 0.14 | 0.09 |
| Iodine | 0.79 | 0.29 |
| Group | Statistical Significance | ||||
|---|---|---|---|---|---|
| GQY | GC | Gr Effect | S Effect | Gr X S | |
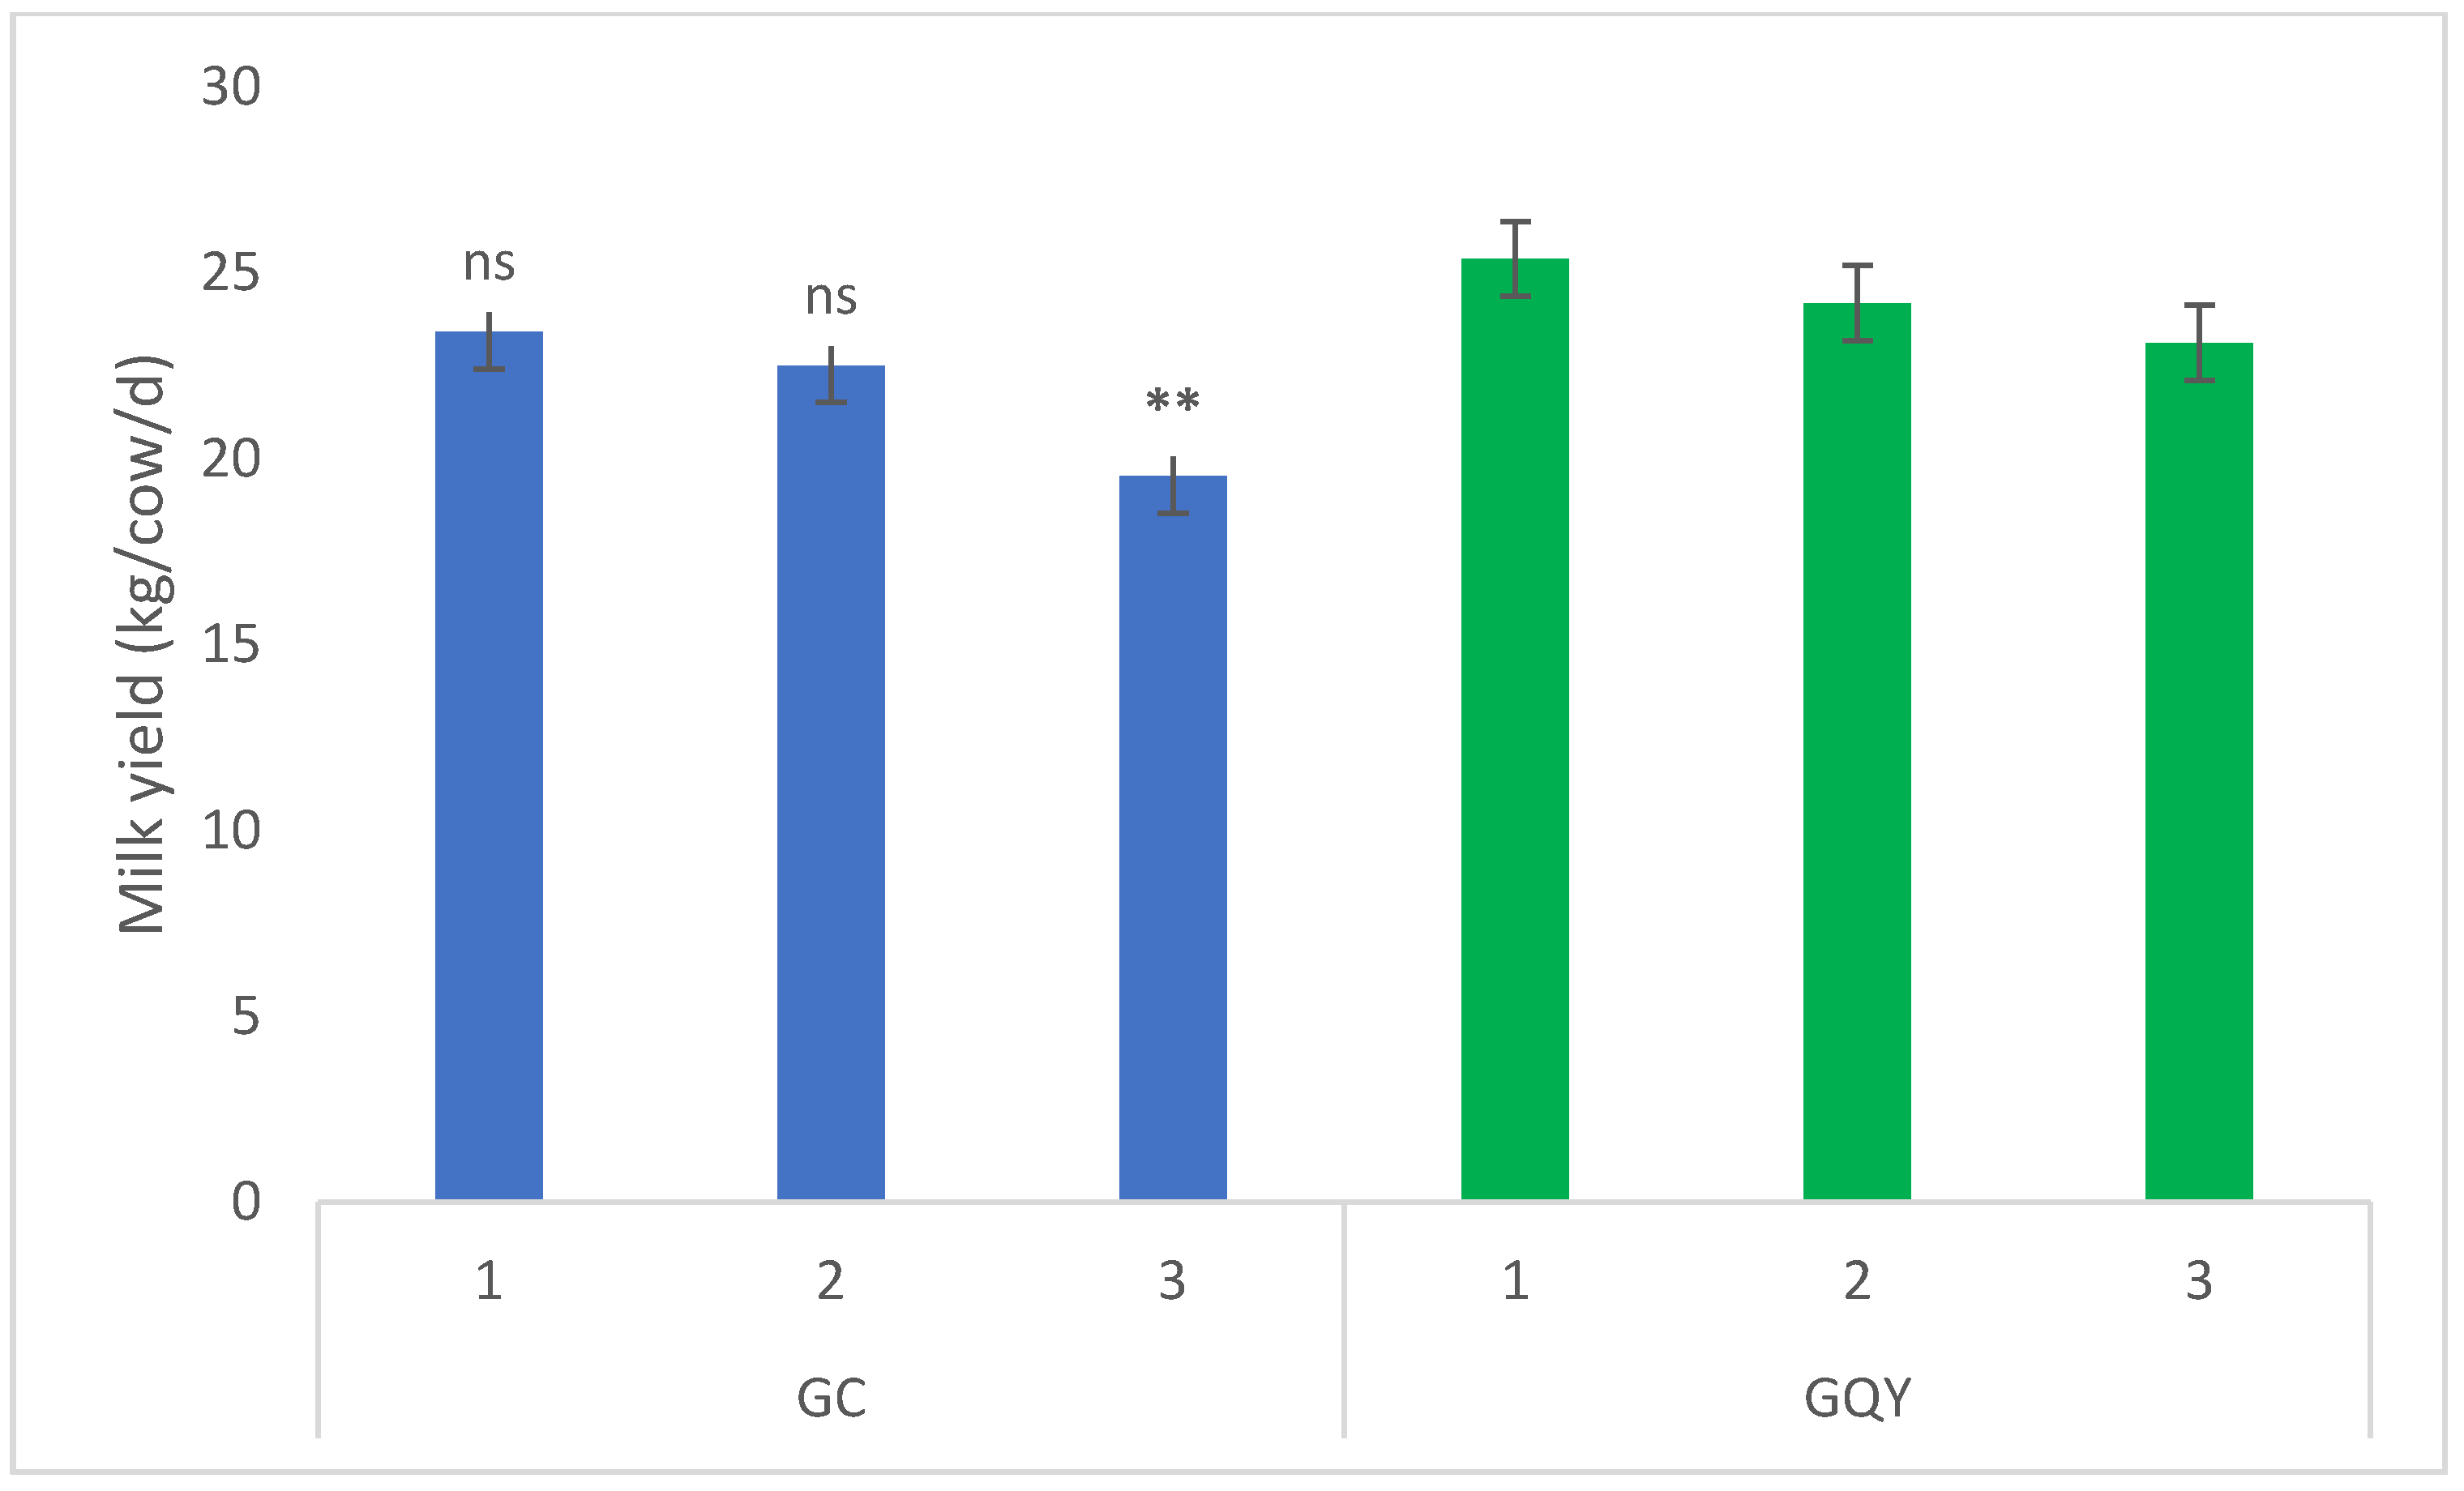
| MY (kg/cow/d) | 24.22 ± 1.02 | 21.82 ± 1.00 | p < 0.1 | *** | *** |
| Concentrate consumption (kg DM/cow/d) | 1.20 ± 0.03 | 1.49 ± 0.03 | *** | *** | *** |
| ECM (kg/cow/d) | 25.28 ± 0.92 | 24.12 ± 0.98 | ns | *** | *** |
| F% | 4.04 ± 0.10 | 4.25 ± 0.10 | ns | *** | ns |
| P% | 3.43 ± 0.07 | 3.46 ± 0.07 | ns | *** | ns |
| Urea (mg/L) | 383 ± 9 | 356 ± 9 | * | *** | *** |
| Methane (g/cow/day) | 444 ± 13 | 445 ± 13 | ns | *** | ns |
| Methane (g)/kg of milk | 17.98 ± 0.97 | 20.25 ± 0.94 | p < 0.1 | *** | *** |
| Methane (g)/kg of ECM | 17.73± 0.89 | 19.26 ± 0.87 | ns | *** | *** |
| Methane in breath samples per visit to ACS (ppm) | 0.100 ± 0.016 | 0.112 ± 0.013 | *** | ns | ns |
Publisher’s Note: MDPI stays neutral with regard to jurisdictional claims in published maps and institutional affiliations. |
© 2021 by the authors. Licensee MDPI, Basel, Switzerland. This article is an open access article distributed under the terms and conditions of the Creative Commons Attribution (CC BY) license (https://creativecommons.org/licenses/by/4.0/).
Share and Cite
Lessire, F.; Point, S.; Laza Knoerr, A.-L.; Dufrasne, I. In Vitro and In Vivo Evaluation of the Effects of a Compound Based on Plants, Yeast and Trace Elements on the Ruminal Function of Dairy Cows. Dairy 2021, 2, 542-555. https://doi.org/10.3390/dairy2040043
Lessire F, Point S, Laza Knoerr A-L, Dufrasne I. In Vitro and In Vivo Evaluation of the Effects of a Compound Based on Plants, Yeast and Trace Elements on the Ruminal Function of Dairy Cows. Dairy. 2021; 2(4):542-555. https://doi.org/10.3390/dairy2040043
Chicago/Turabian StyleLessire, Francoise, Sandra Point, Anca-Lucia Laza Knoerr, and Isabelle Dufrasne. 2021. "In Vitro and In Vivo Evaluation of the Effects of a Compound Based on Plants, Yeast and Trace Elements on the Ruminal Function of Dairy Cows" Dairy 2, no. 4: 542-555. https://doi.org/10.3390/dairy2040043