Article

The Use of Membrane Filtration to Increase Native Whey Proteins in Infant Formula

1
Teagasc Food Research Centre, Moorepark, Fermoy, P61 C996 Co. Cork, Ireland
2
Department of Biological Sciences, Munster Technological University, T12 P928 Co. Cork, Ireland
3
Department of Biomedical Sciences, Faculty of Health and Medical Sciences, University of Copenhagen, 2200 Copenhagen, Denmark
*
Author to whom correspondence should be addressed.
Dairy 2021, 2(4), 515-529; https://doi.org/10.3390/dairy2040041
Submission received: 15 August 2021 / Revised: 8 September 2021 / Accepted: 9 September 2021 / Published: 23 September 2021

Abstract

:
The introduction of membrane filtration during infant milk formula (IMF) processing represents an innovative approach to increasing native protein content compared to standard IMF. The objective of this study was to compare IMF powder produced using a standard process and IMF produced from raw bovine skim milk with added whey protein isolate using a split-stream process incorporating a ceramic 1.4 μm filter followed by a polyvinylidene difluoride polymeric 0.2 μm filter. Retentates from 0.2 μm microfiltration (MF) were blended with fat, lactose, and minerals and subsequently high-temperature treated (125 °C × 5 s). The heat-treated retentate was merged with the permeate from the 0.2 μm MF, homogenised, and spray-dried (referred to as membrane-filtered IMF or MEM-IMF). A control IMF was also produced using standard treatment (referred to as high-temperature IMF or HT-IMF) without membrane filtration. Both IMF products were characterised by high-performance liquid chromatography, particle size, and enzyme activity assays. MEM-IMF powder had significantly higher amounts of native (1.1 g per 100 g powder) and monomeric (1.48 g per 100 g powder) whey proteins when compared to 0.18 and 0.46 g per 100 g powder in HT-IMF, respectively. MEM-IMF also exhibited a lower degree of protein aggregation compared to HT-IMF. Comparison of microbial and Maillard by-products markers demonstrated that a safe IMF product could be produced at scale, although levels of the Maillard by-product marker, carboxymethyl-lysine, were not significantly reduced in MEM-IMF. This study demonstrates how membrane filtration can be used to retain native proteins during IMF manufacture.

1. Introduction

Infant milk formula (IMF) simulates the protein composition of human milk in terms of the whey protein to casein ratio (60:40 in most commercial first stage IMF) by the addition of whey proteins [1]. Protein composition and amino acid concentrations in IMF may closely resemble human milk, but breast milk is by its nature unheated, so all proteins are in their native form. Heat treatments are critical during the manufacture of IMF, with two primary purposes: (1) microbiological safety, where heat is applied to eliminate pathogenic microbes, and (2) removal of water by evaporative concentration and spray drying during powder manufacture [2,3]. Depending on the manufacturing process, IMF usually undergoes several thermal treatments, which have a profound effect on the structure of native proteins and promote the formation of Maillard and oxidation products [4]. Membrane filtration technology has been applied in dairy industrial processing as an alternative to heat treatment to a limited extent. Specifically, cross-flow microfiltration (MF) provides a non-thermal approach to the control of microbial numbers and is used to manufacture extended shelf life (ESL) dairy products at the industrial scale. The most commonly used membrane for ESL has a 1.4 μm pore size, since it effectively reduces the microbial population in combination with pasteurisation without significantly affecting the major milk components [5]. The possibility of incorporating MF in IMF production was recently reported for the first time by Yu et al. [6], who employed a combination of 0.8 and 0.1 µm membranes to produce IMF with a high content of native proteins.
The denaturation and aggregation of whey proteins have been shown to affect their behaviour during gastro-intestinal transit, in particular during gastric digestion in adults and infants, both in vitro and in vivo [7]. Protein coagulation during the gastric phase is considered a rate-determining step for the digestion kinetics of proteins and rate of gastric emptying [8]. Gastric restructuring results in changes to the calcium and phosphate equilibrium within the casein micelle as well as the unfolding and aggregation of whey proteins [9,10]. In addition, changes in the globular structure of β-lactoglobulin (β-lg) and α-lactalbumin (α-la) can affect accessibility to cleavage sites for digestive proteases, resulting in the production of alternative peptides in vitro and in vivo, with potentially different bioactivities [11,12,13]. We have recently reported that IMF produced with a split-stream process incorporating a membrane filtration step was altered in the protein hydrolysis profile at the end of a simulated in vitro gastric digestion compared to IMF produced using a standard high-temperature process [14]. This influenced the panel of bioavailable peptides detected in the basolateral compartment of a model of the intestinal epithelium (Caco-2 monolayer) and significantly increased tight junction protein, claudin 1, and improved tight junction integrity. These results suggested potential benefits for the alternative split-stream process, and the objective of this paper is to describe in detail the lab-scale production of the membrane-filtered infant milk formula (MEM-IMF)). The alternative process would be expected to produce a modified protein profile compared to standard processing, so the extent of protein aggregation and denaturation was determined for the MEM-IMF and compared to standard high-heat-treated infant milk formula (HT-IMF). Microbiological and chemical quality were also investigated for guiding further scale-up production.

2. Materials and Methods

2.1. Materials

Raw bovine whole milk was collected from the dairy farm at the Teagasc, Animal and Grassland Research and Innovation Centre, Moorepark, Fermoy, Co., Cork, Ireland. It was skimmed at 40 °C using a disc bowl centrifuge (FT15 Disc Bowl Centrifuge) at the Biofunctional Engineering Facility, Teagasc Food Research Centre, Moorepark. The skim portion was held at 4 °C for less than 3 h until further use. Whey protein isolate (WPI, protein content 91.6%) was obtained from Agropur. Lactose (93.55% purity) was sourced from Glanbia Ingredients Ireland. The composition of the fresh skim milk and the powder ingredients are provided in Table 1. Vegetable oil was purchased from a local shop. Mineral salts were supplied from Sigma Aldrich and Alfa Aesar and included magnesium chloride hexahydrate, calcium hydrogen phosphate dihydrate, potassium chloride, zinc sulfate heptahydrate, potassium citrate tribasic monohydrate, iron (II) sulfate heptahydrate, and calcium carbonate. HPLC chemicals were obtained from Sigma Aldrich and included urea, 2-mercaptoethanol, and trifluoroacetic acid (TFA). Milli-Q® water (Millipore) was used for all HPLC eluents.

2.2. Microbiological Analyses

Total bacterial counts (TBC) in raw milk, permeate, retentates, and powders were determined using Tryptic Soy Agar (LabM). Suitable dilutions of the samples were plated in triplicate, and the plates were incubated for 24 h at 37 °C. TBC was determined using direct counts and reported as colony-forming units (CFU) per mL or mg averaged from triplicate samplings. The presence/absence of specific pathogens was determined by selective plating of powder samples on DFI Agar (Cronobacter), VRBG Agar (Enterobacteriacae), Chromogenic Listeria Agar, and XLD Agar (Salmonella).

2.3. Compositional Analysis

Total protein, lactose, fat, and total skim milk solids were determined by Fourier transform infrared spectroscopy using a DairySpec FT instrument (Bentley Instruments Inc., Chaska, MN, USA) before they were mixed with WPI. Total proteins and non-protein nitrogen were determined using the Kjeldahl method [15,16], applying a nitrogen–protein conversion factor of 6.38 [17]. The fat content was determined using the Gerber method [18]. The lactose content was measured by the ISO reference method [19]. Mineral analysis was performed with Agilent 7700s inductively coupled plasma mass spectrometry (ICP-MS) (Agilent Technologies, Santa Clara, CA, USA).
The moisture of IMF powders was analysed by using a LECO TGA-701 gravimetric oven (LECO Instruments, St. Joseph, MI, USA). IMF powders were placed in crucibles and heated to 102 °C until crucibles reached a constant mass (approximately 3 h) to determine evaporating moisture.

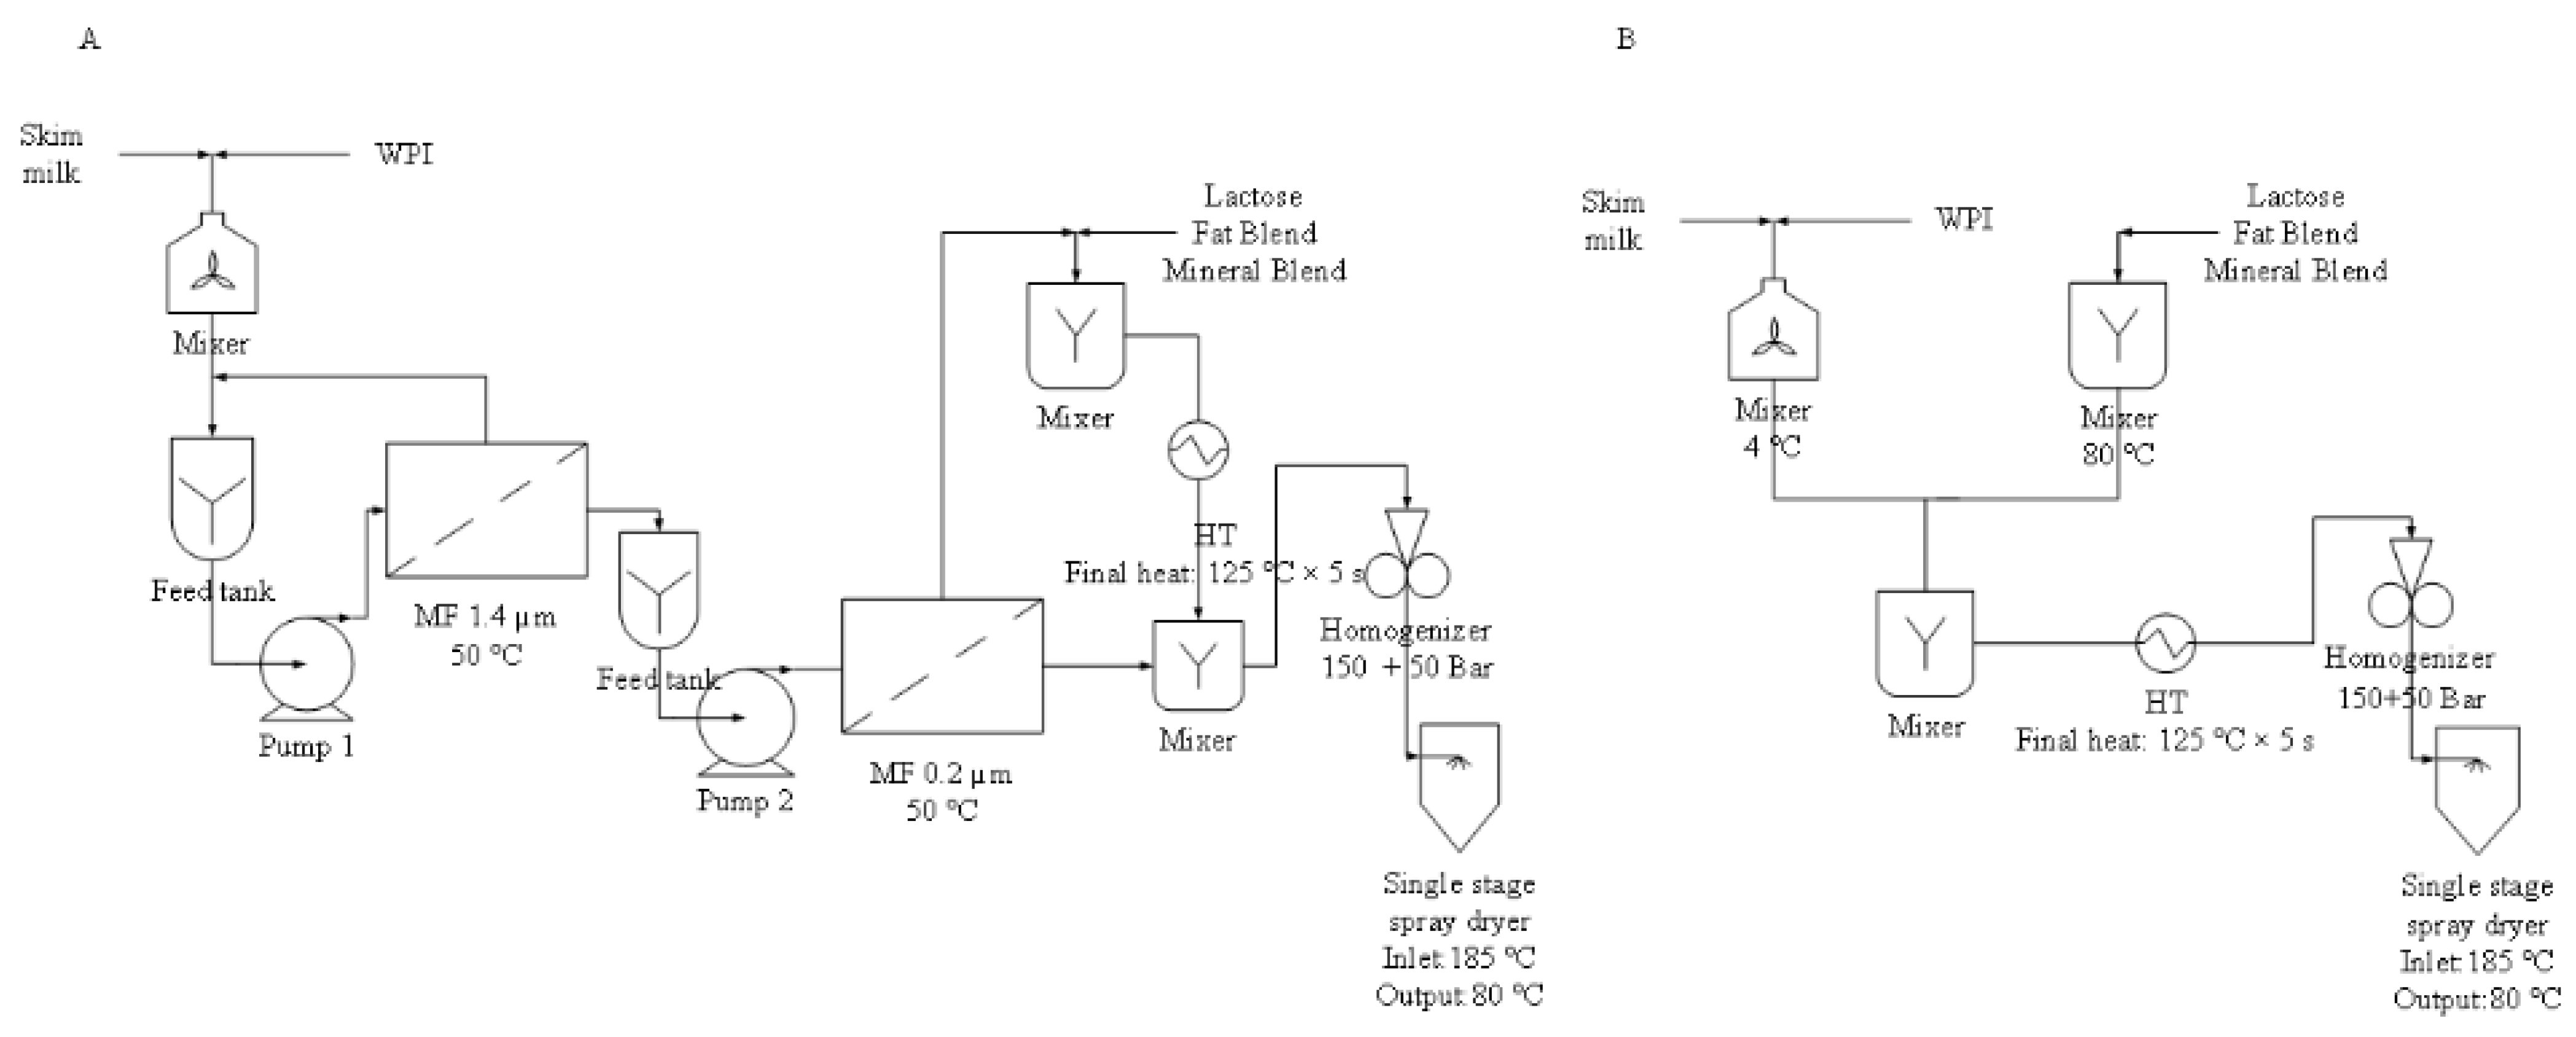
2.4. Infant Milk Formula Preparation and Powder Manufacture

IMFs in this study were selected based on the recommendations for first stage IMF [20]. The ratio of macronutrients, protein:lactose:fat, was 1.29:7:3.49, respectively. The protein had a whey protein to casein ratio of 60:40. Table 1 shows the macro-nutrients composition per 100 g IMF powder. HT-IMF and MEM-IMF powder samples were manufactured independently in triplicate from three batches of skim milk.

2.4.1. Cascade Membrane-Filtration during Infant Milk Formula Processing

Ceramic 1.4 μm Microfiltration

Figure 1A shows a flowchart for the production of membrane-filtered IMF (MEM-IMF). To minimise heat treatment, the milk was not pasteurised prior to processing. The first phase membrane filtration employed a seven-channel (60 mm length, Ø 10 mm, membrane area 0.032 m2) 1.4 μm ceramic microfiltration membrane (TAMI Industries) integrated into a bench-top multi-membrane filtration unit (3 L system volume), operated in batch mode. The plant and membranes were cleaned according to the standard clean-in-place (CIP) procedure [21] pre- and post-run by recirculating an alkaline cleaning solution (UltrasilTM 115, Ecolab Ltd., St. Paul, MN, USA).
The plant was equilibrated using reverse osmosis (RO) water at 50 °C. The clean water flux was 45 L h−1. WPI was rehydrated in skim milk according to the masses outlined in Table 2 and stored overnight at 4 °C. This whey-protein-enriched milk is referred to as [60:40] milk throughout the study. The rehydrated [60:40] milk was pre-heated to 50 °C before feeding to the filtration plant. The 1.4 μm MF process was carried out at 50 °C with a retentate recirculation flow rate of 360 L h−1. The retentate pressure in and out were set at 0.18 and 0.08 MPa, respectively, while the permeate out was operated without back pressure, giving a transmembrane pressure (TMP) of 0.13 MPa. The permeate stream was collected in a separate tank. The recirculation was stopped when a volumetric concentration factor (VCF) of 3 was reached. The amount of feed, retentate, and permeate for each filtration step is shown in Table 2. The permeate was stored at 4 °C until further use. The retentates from this phase were discarded. The VCF was calculated as the ratio of the feed volume (Vf) and the final retentate volume (Vr); Vr is the difference between the feed volume and the permeate volume (Vp):
Volume concentration factor V C F = Vf Vr = Vf Vf Vp .

Polymeric 0.2 μm Microfiltration

The permeate from the 1.4 μm MF step was further filtered using two 0.2 μm polyvinylidene difluoride (PVDF) spiral-wound polymeric microfiltration membranes in parallel, Model No. 1812F (membrane area 0.33 m2, Synder), using the same bench-top multi-membrane filtration unit. The amount of feed, retentate, and permeate for each filtration step is shown in Table 2. The 0.2 μm MF feed (permeate from 1.4 μm MF) was heated to 50 °C prior to microfiltration. The 0.2 μm MF processing was carried out at 50 °C with a retentate recirculation flow rate of 390 L h−1. The retentate pressures in and out were set at 0.18 and 0.12 MPa, respectively, while the permeate out was operated without a back pressure, giving a TMP of 0.15 MPa. The permeate stream was collected once it reached 3% total solids, while the retentate was recirculated into the 0.2 μm MF feed tank. To maximise native protein recovery, processing was completed when the maximum VCF of the laboratory scale equipment (3.2) was reached. The retentate was pumped out of the system using the same amount of RO water as the system volume. Both permeate and retentate streams were collected in separate tanks and were stored overnight at 4 °C. Pre-run CIP was applied by recirculating an alkaline cleaner (Ultrasil™ 115, Ecolab Ltd., St. Paul, MN, USA) for 20 min at 50 °C. Post-run CIP was performed with Ultrasil™ 69 (caustic solution) and Ultrasil™ 67 (enzymatic solution) blend, Ultrasil™ 78 (nitric acid), and Ultrasil™ 115 (caustic solution) for 20 min of each at 50 °C.

Mixing Ingredients, Homogenising, and Spray-Drying

Fat, lactose, and minerals (see Table 2) were weighed and dissolved in RO water for 60 min at 80 °C. The mixture was cooled to 50 °C and mixed with the 0.2 μm MF retentate. The combined solution was heated at 125 °C × 5 s (UHT/HTST Lab-25 EHVH, MicroThermics, Raleigh, NC, USA) without a homogenisation step. This heated stream was mixed with the 0.2 μm MF permeate (12.5% total solid) and homogenised at 15 and 5 MPa for the first and second stages, respectively. The homogenised IMFs were finally spray-dried by a single stage spray dryer with an inlet temperature of 185 °C and an outlet temperature of 80 °C (Anhydro F1 Lab Dryer).

2.4.2. High-Heat-Treated Infant Milk Formula (HT-IMF) Powder Processing

Figure 1B shows the flowchart for the production of the HT-IMF powder. WPI was dissolved in skim milk overnight at 4 °C. Fat and lactose (Table 2) were weighed and rehydrated in RO water for 20 min at 80 °C, then cooled down to 50 °C before being mixed with the [60:40] milk blend. The [60:40] milk was mixed with the fat, lactose, and mineral solution for 30 min (12.8% total solids), adjusted to pH 6.7 by addition of HCl or NaOH, then heated 125 °C × 5 s by using a MicroThermics unit. The heated IMF was then homogenised (15 and 5 MPa for the first and second stages, respectively). The liquid HT-IMF was then spray-dried using a single stage spray dryer with an inlet temperature of 185 °C and an outlet temperature of 80 °C.

2.5. Protein Analysis

2.5.1. Protein Profile during Membrane Filtration and IMF Powders

The protein profile and content during 1.4 and 0.2 μm MF were determined in the feed, permeate, retentate, and final IMF powders. Total protein content was determined using the Kjeldahl method [15,16], applying a nitrogen–protein conversion factor of 6.38 [17]. Protein profiles were measured by using reversed phase high pressure liquid chromatography (RP-HPLC) [22]. The permeates and retentates of both 1.4 μm and 0.2 μm MFs were diluted in a denaturing sample buffer 1 in 20 and 1 in 40, respectively (7 M urea and 20 mM bis-tris propane buffer). IMF powders were rehydrated to 10% (w/v) in Milli-Q water at 4 °C for 30 min, then diluted 1 in 10 using the same buffer.

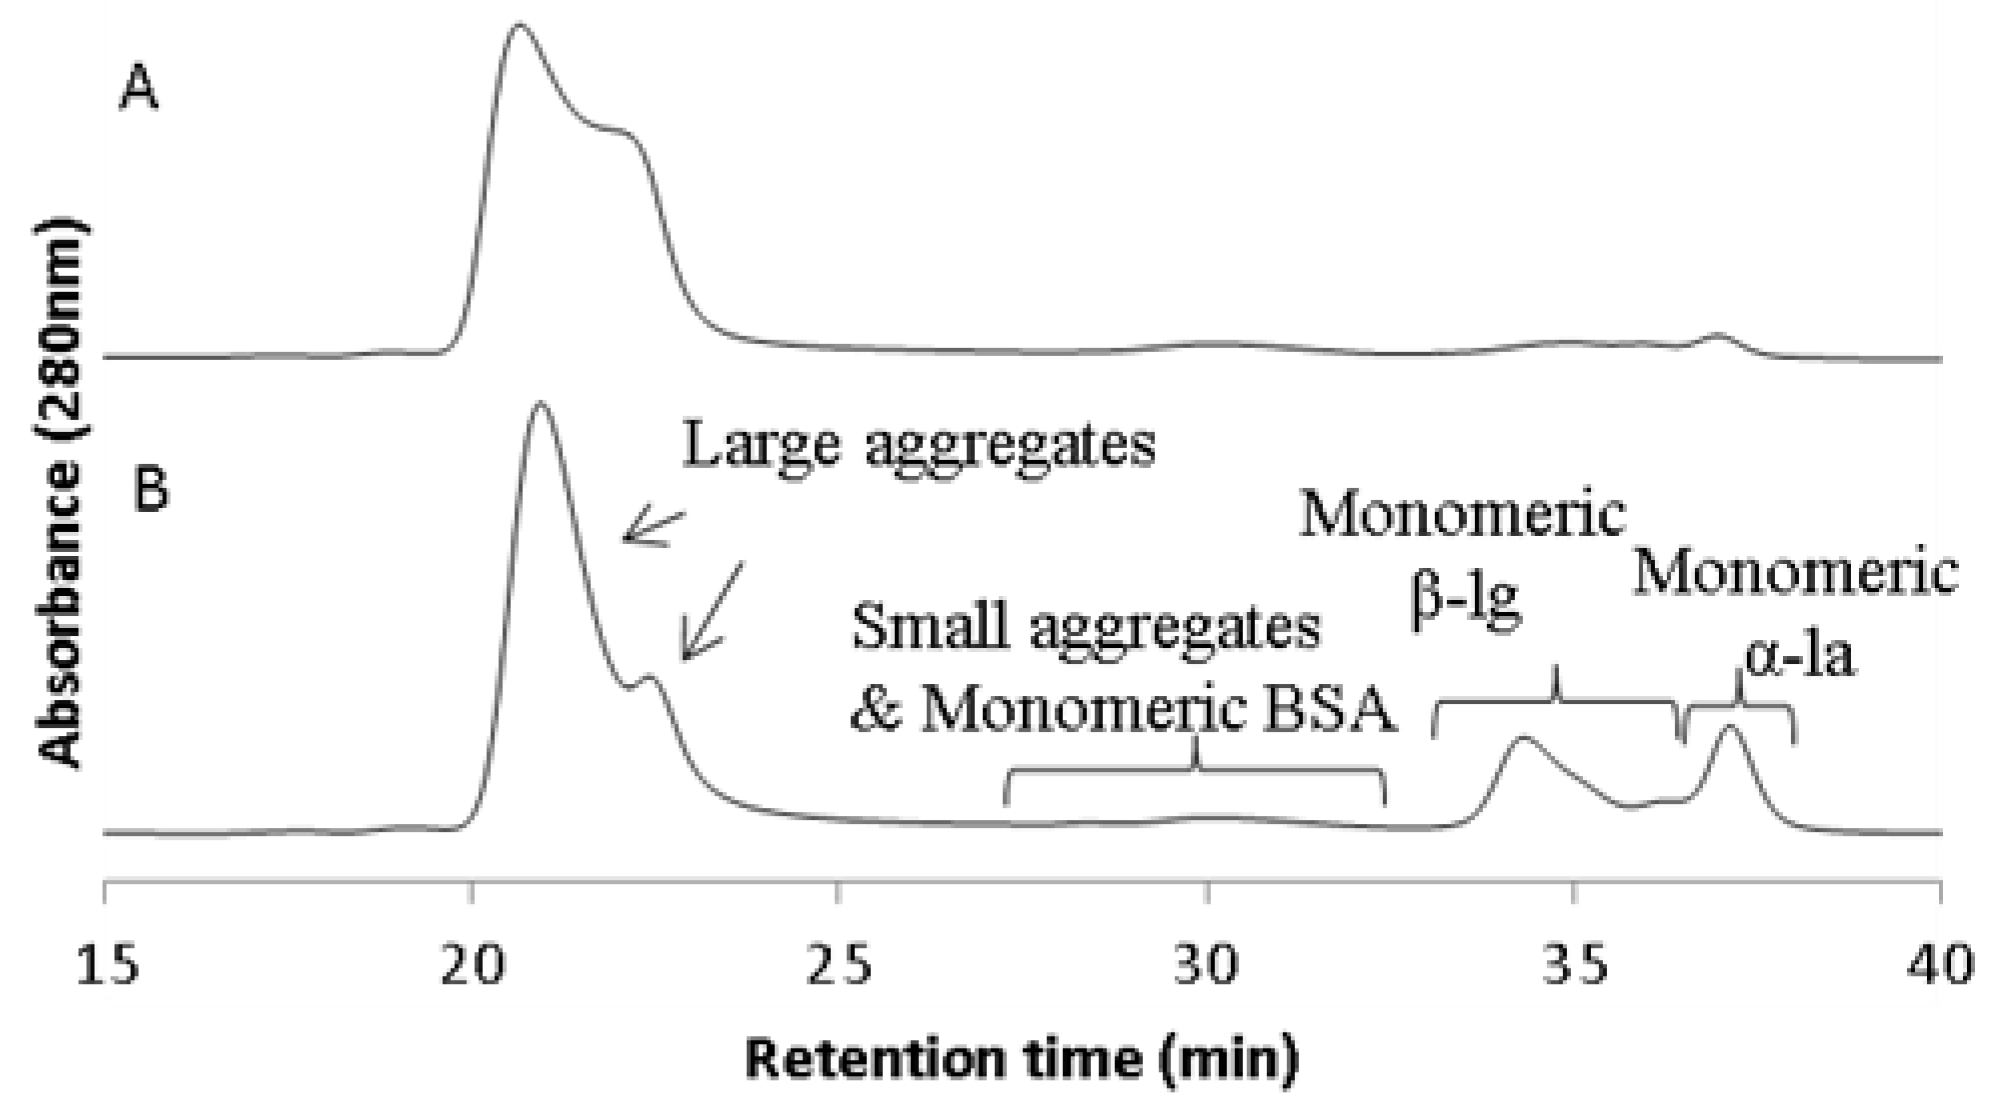
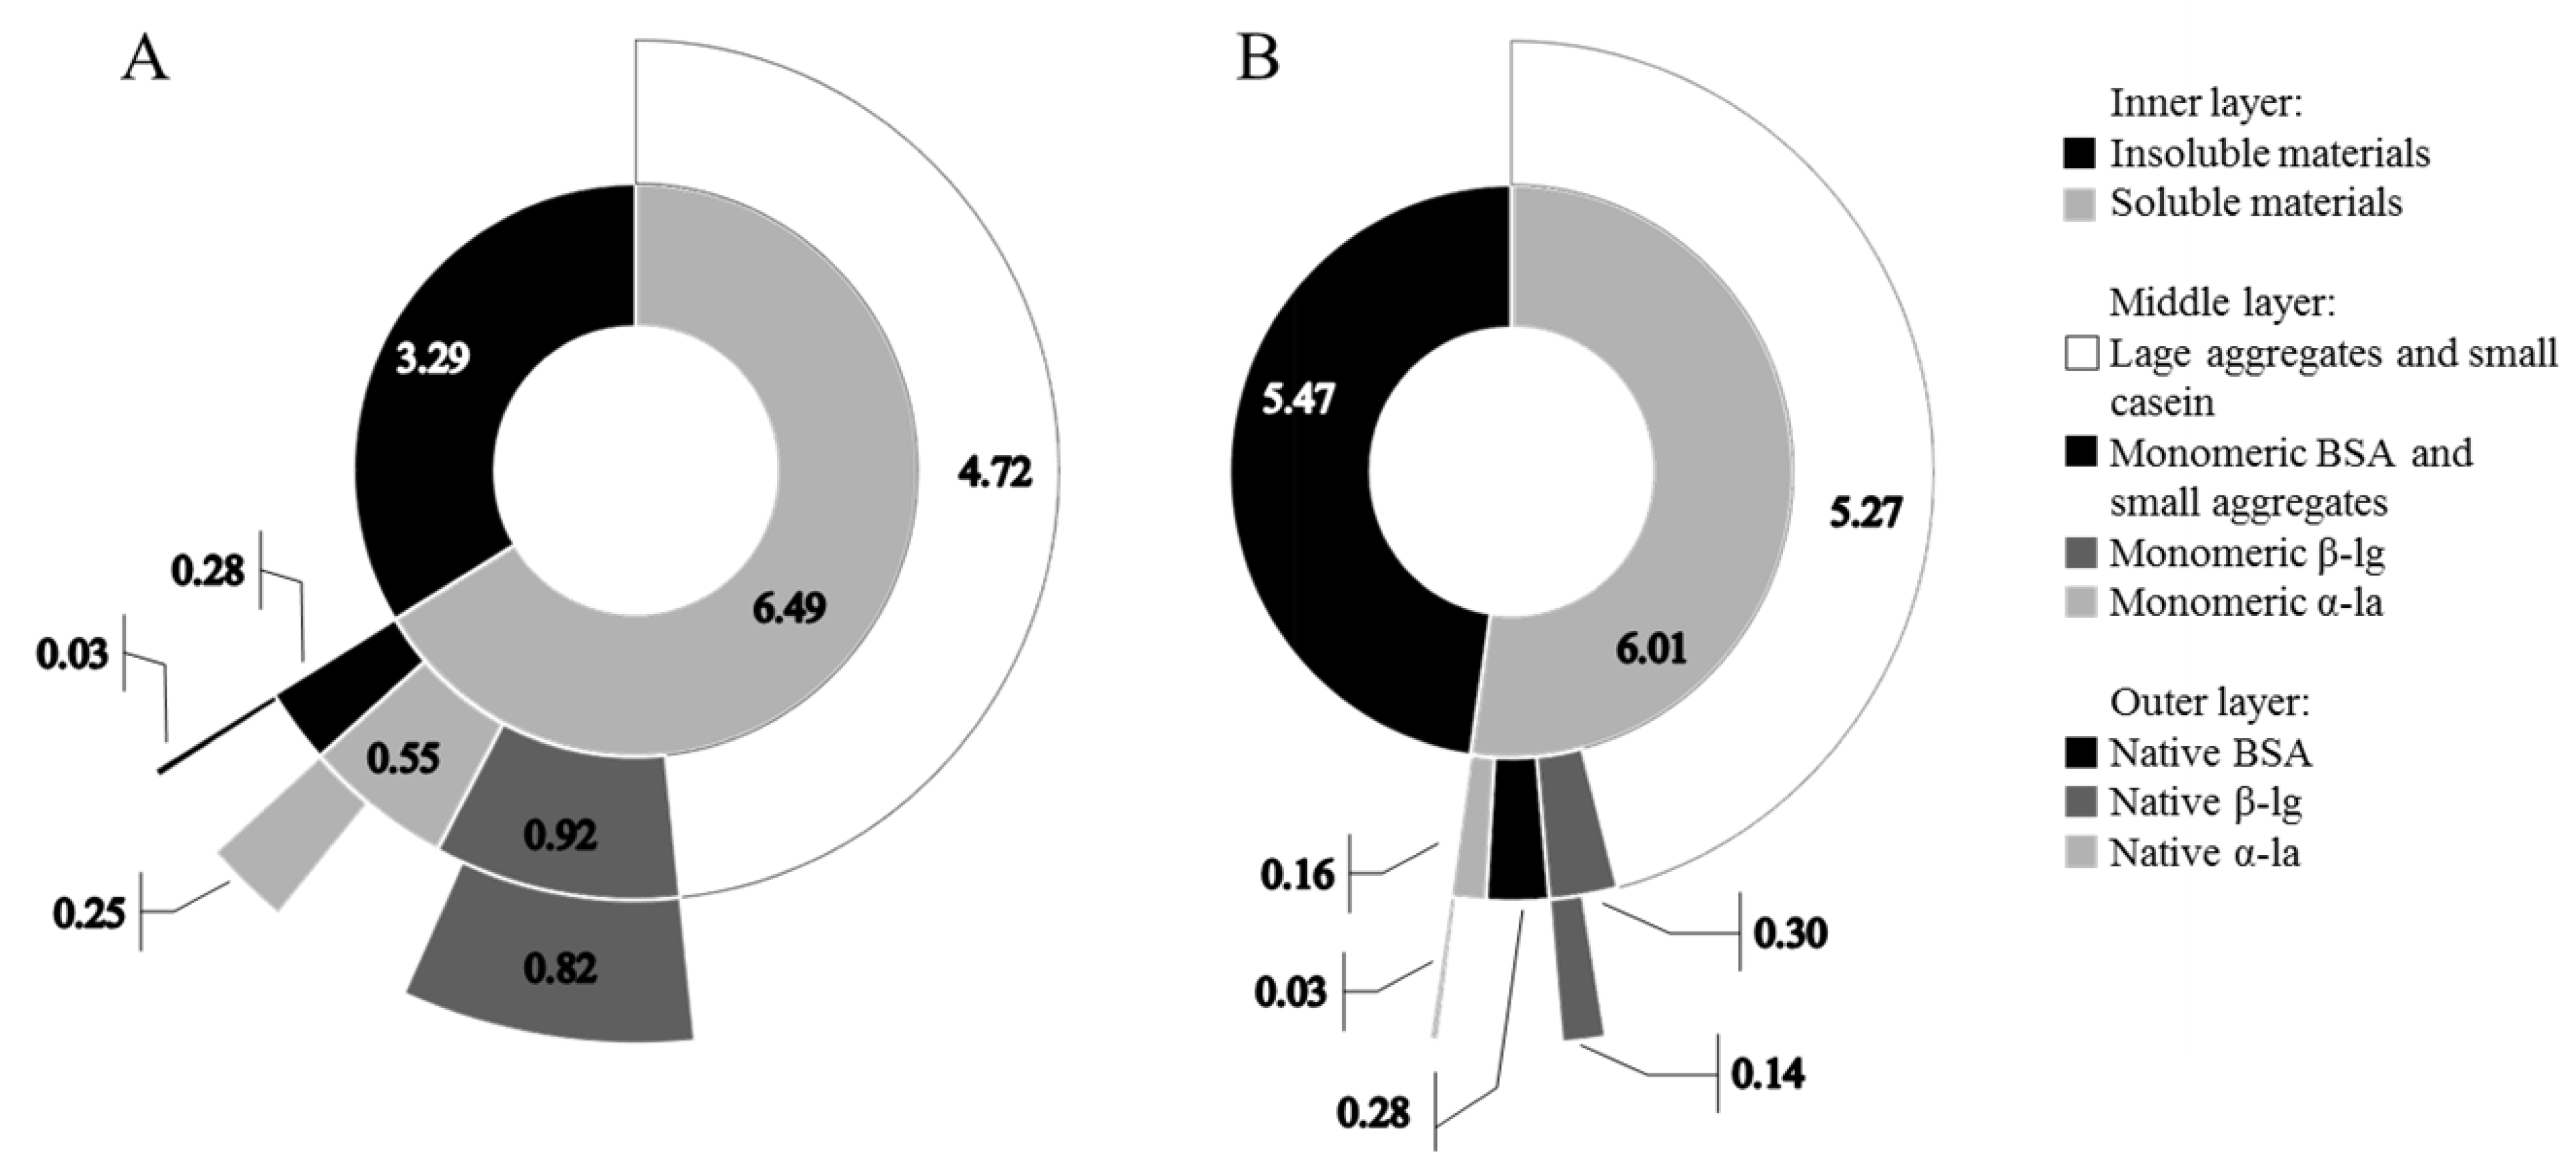
2.5.2. Size Distribution of Proteins and Aggregates by Size Exclusion Chromatography HPLC

Size exclusion chromatography (SEC) HPLC was used to determine the size distribution and proportion of soluble aggregates in the rehydrated IMF samples. IMF powders were dissolved at 2.5% (w/v) in Milli-Q water at 4 °C for 30 min. Solutions were filtered using 0.22 μm low-protein-binding syringe filters (Gilson) to remove micellar casein, fat, and insoluble protein aggregates. Samples were run on a Waters C2695 equipped with a UV/vis detector (Waters UV2489) at a wavelength of 280 nm. Samples (20 μL) were injected on two SEC columns, TSK Gel G2000SWXL and G3000SWXL (7.8 × 300 mm, Toso Haas Bioscience GmbH), connected in series. A sodium phosphate buffer (20 mM) at pH 7 with 0.02% (w/v) sodium azide was used as an elution buffer. The flow rate was 0.5 mL min−1 with an isocratic gradient for 60 min. A molecular mass calibration curve was created by using the elution times of a range of standard proteins (GE Healthcare): Ferritin (440 kDa), Aldolase (158 kDa), bovine serum albumin (BSA, 66.7 kDa), Ovalbumin (43 kDa), β-lg (18.3 kDa), and α-la (14.4 kDa). Data analysis and integration were performed using the Waters Empower software.
Sample preparation for the determination of insoluble protein material involved the rehydration of the IMF powders at 10% (w/v) in Milli-Q water. Solutions were centrifuged at 16,000× g at 4 °C for 3 min to precipitate insoluble materials followed by filtration using 0.22 μm low-protein-binding syringe filters. Filtered solutions, referred to as soluble proteins, had their protein content determined by the Kjeldahl method (nitrogen conversion factor of 6.38). A small amount of milk fat was separated and removed by centrifugation, and subsequent filtration affected the protein content in the aqueous layer, which was corrected for 2.76% (w/v) and 2.87% (w/v) lost fat for MEM-IMF and HT-IMF, respectively. The amounts of insoluble proteins were determined by subtraction of soluble proteins and lost fat from the total protein before centrifugation.

2.5.3. Quantification of Native Whey Proteins in IMF Powders

Caseins and denatured whey proteins, including non-native monomers, were removed by isoelectric precipitation at pH 4.6 to allow the quantification of native whey proteins. Native whey proteins where quantified by a RP-HPLC methods as described previously [22,23]. Briefly, IMF powder samples were dissolved at 10% (w/v) in Milli-Q water and diluted 1:5 in 0.1M sodium acetate buffer at pH 4.6 for isoelectric precipitation. The samples were centrifuged at 14,000× g for 30 min at 4 °C. The supernatants were filtered using a 0.22 μm low-protein-binding syringe filters. Samples were analysed using a HPLC system (HPLC, Waters Alliance e2695) equipped with a UV/visible detector (Waters UV2489 at 214 nm). A total of 20 μL of samples were injected onto a reversed phase PLRP-S column (100 Å, 3 μm, 150 × 2.1 mm; Agilent, Cork, Ireland), operated at a temperature of 28 °C and a flow rate of 0.3 mL min−1. The column was equilibrated in 70% solvent A (0.1% TFA in Milli-Q water) and 30% solvent B (90% acetonitrile, 0.1% TFA). Samples were eluted by a series of linear gradients: 0–1min 30% B, 1–10 min increased to 40% B, 10–18 min increased to 46% B, 18–24 min increased to 48.5% B, 24–40 min increased to 52% B; 40–42 min increased to 100% B for 2 min, and 42–44 min decreased to 30% B, then held at 30% B for 4 min to the end. Mixed protein calibration standards (α-la, BSA, β-lg A and β-lg B; Sigma-Aldrich, St. Louis, MO, USA) were prepared with concentrations of 20, 50, 100, and 200 μg mL−1. Data analysis was performed using the Waters Empower software.

2.6. Analysis of Maillard Reaction Byproducts

2.6.1. Analysis by Fluorescence Spectroscopy

The method described by Birlouez-Aragon et al. [24] was followed by some alterations. Basically, 5 mL of trichloroacetic acid (TCA, 40% w/v) was added to 5 mg of each prepared IMF sample and allowed to stand for 30 min. The samples were centrifuged at 6000× g for 10 min, and 250 μL of the supernatant was diluted in PBS. Then, 200 μL of the sample dilutions was transferred to a 96-well plate with 200 μL of the fresh quinine sulphate solution (0.1 mg/L in 0.1 N sulphuric acid) as the 100% fluorescence standard. The fluorescence intensity was measured at 345 nm excitation and 415 nm emission.

2.6.2. Determination of Amino Acids and Carboxymethyl-Lysine (CML) by LC/MS

Quantification of CML was carried out following acidic hydrolysis of the IMF samples stored at room temperature for 3 months in vacuum-sealed pouches according to Chen et al. [25] and Gamon et al. [26]. Briefly, IMF (10 mg) was reconstituted with PBS pH 7.4 in glass hydrolysis vials. The IMF was delipidated with 25 µL (0.3% w/v) deoxycholic acid and protein precipitated with 150 μL of 10% w/v TCA. Protein pellets were washed twice with ice-cold acetone and internal standards were added before drying in a SpeedVac. Samples were resuspended in 150 µL of 4M methane sulfonic acid containing 0.2% tryptamine and transferred to Pico-Tag hydrolysis vials. The samples were deoxygenated by purging with nitrogen gas three times and then subjected to acid hydrolysis under vacuum for 16 h at 110 °C. Samples were allowed to cool to room temperature before dilution into 0.1% formic acid (10 µL into 1 mL). Solid-phase extraction was performed using Strata X-C tubes. These were conditioned with 600 µL methanol, equilibrated with 0.1% formic acid in water, washed with formic acid in methanol, and eluted with 600 µL NH4OH in 20% acetonitrile. Elutions were dried down in a SpeedVac and stored at −80 °C. On the day of analysis, samples were resuspended in 50 µL 0.1% formic acid in water.
Samples were analysed by LC-MS, using a Bruker Impact-II Q-TOF mass spectrometer as described by [25]. Peak areas for CML were normalised to the CML internal standard from the same run with absolute quantification determined using peak area ratio standard curves (1–1000 ng mL−1) and normalised relative to the experimentally determined concentration of non-modified phenylalanine to account for any losses in sample processing.

2.7. Enzyme Assay

The enzyme activity of alkaline phosphatase (ALP, EC 3.1.3.1) was determined in 10% (w/v) IMF solutions using an ALP activity assay kit and Luminator (Charm Sciences, Lawrence, MA, USA) according to a standardised fluorimetric method [27]. Enzyme inactivation is an indicator of effective heat treatment, and generally, an ALP enzyme activity lower than 350 mU L−1 is an acceptable indicator that milk has undergone pasteurisation [28].

2.8. Statistical Analyses

Data are presented as the mean ± standard error of the mean with triple measurements of three replicates from independent samples. Statistical analysis was performed using IBM SPSS® Statistics Version 24. Significance was assumed at p < 0.05.

3. Results

3.1. Effect of Membrane Filtration on Protein Content

The total protein content and profile in the feed, permeate, and retentate of the 1.4 μm MF stream did not significantly (p > 0.05) change (Table 3), which indicated that all measured caseins and whey proteins were able to pass through the 1.4 μm membrane in line with previous reports [29,30]. The 0.2 μm MF step retained 59.94% (w/w) of total protein (at a VCF of 3.2) at a protein content of 12.45 ± 1.27 g 100 g−1 of solution in the retentate (Table 3). It consisted of 57.82% (w/w) whey proteins and 42.18% (w/w) casein, compared to the permeate with 67.03% (w/w) whey proteins and 32.97 (w/w) casein. Therefore, MEM-IMF powders had a statistically lower (p < 0.05) total protein compared with HT-IMF powders (Table 3) with the majority of protein loss occurring at the 0.2 μm MF stage.

3.2. Protein Profiles of IMFs

The SEC chromatograms of the soluble fraction of HT-IMF and MEM-IMF show peaks corresponding to large protein aggregates of 100 to 500 kDa (Figure 2), which is close to the exclusion volume of the columns. These could be aggregates of whey proteins, smaller casein particles, and combinations thereof [31,32]. HT-IMF powder had 5.47 g ± 0.52 100 g−1 of insoluble material (removed by centrifugation and filtration with 0.22 µm syringe filters), whereas MEM-IMF was more soluble with only 3.29 g ± 0.29 insoluble material per 100 g IMF powder. This is probably related to heat-induced unfolding and subsequent aggregation of whey proteins, as well as the binding of whey proteins to the casein micelles, which is known to affect solubility [33].
The supernatants containing native whey proteins were quantified by RP-HPLC, and Figure 3 shows the amount of native whey proteins per 100 g of powder. As expected, MEM-IMF powders had a significantly higher (p < 0.05) amount of native whey protein with 18.3% of total whey protein compared with only 2.5% of total whey protein in HT-IMF powders. It should be noted that analysis of the WPI powder, which contributes 83.3% of whey protein in the IMFs, revealed that 8.5% of the added whey protein was already denatured. Using a combination of SEC and RP-HPLC, it was possible to distinguish between native monomeric, non-native monomeric, and aggregated proteins [23]. Two peaks associated with monomeric β-lg and α-la in MEM-IMF were detected (Figure 2B), both of which appear absent in HT-IMF. In the MEM-IMF, 0.25 g ± 0.03 per 100 g powder was α-la in the native form, which equates to 23.0% of the total α-la and 45.5% of monomeric α-la (of the total α-la). For β-lg, 0.82 g ± 0.15 per 100 g of powder were native β-lg, which was 16.7% of the total β-lg and 89.3% of monomeric β-lg (Figure 3). Interestingly, a considerable amount of denatured α-la and β-lg in the MEM-IMF remained in the non-native monomeric state rather than in aggregated form. In contrast, in the HT-IMF powders, 16.57% of total α-la present was in its monomeric form compared to 5.19% for β-lg. This is in agreement with the results of Lin et al. [34], who reported that α-la exhibited high heat-tolerance due to a compact globular structure and its four disulfide bonds [35]. In contrast, β-lg has two disulfide bridges and reactive free sulfhydryl group (-SH), which facilitate the formation of non-reversible, covalent intermolecular disulphide bonds with other whey proteins or caseins [32,36]. Both α-la and β-lg are known to unfold, denature, and aggregate at temperatures above 75 °C [37] but the extent is dependent on multiple factors such as temperature, ionic strength, pH, and concentration.

3.3. Quality Markers

3.3.1. Microbiological Analysis

The protein analysis demonstrated that the 0.2 μm filtration altered the profile of the filtered stream. However, the permeate collected following the filtration steps was not sterile (Table 3) and still contained 1.4 × 10³ cfu mL−1. Bacterial cells are typically greater than 1 μm in length and 0.4 μm in width, which means 1.4 μm membranes are capable of significant reduction in bacterial counts [30]. However, a functional 0.2 μm membrane should have eliminated any bacterial cells. Microbial analysis of the final HT-IMF and MEM-IMF powders revealed low levels of contamination in both (Table 3), although selective plating did not detect any pathogens (Cronobacter, Listeria and Salmonella) of concern (data not shown).

3.3.2. Maillard Reaction Products

The intensity of fluorescence originating from advanced glycation end products (AGEs) is widely used as a marker of AGE-modified protein levels [38]. Therefore, we compared the fluorescence levels of commercial and HT-IMF and MEM-IMF. Significantly lower levels of fluorescence were observed for the MEM-IMF compared to HT-IMF and commercial samples (Table 3). This result suggests that MEM-IMF has reduced levels of AGE-modified proteins compared to infant formula manufactured using standard production processes. In addition, the levels of histidine and arginine are known glycation targets in heat-treated milk, and a significant reduction of arginine (−0.02 μM, p < 0.05) and histidine (−0.035 μM, p < 0.05) was detected by LC-MS in the HT-IMF-treated powders. In contrast, levels of CML, a commonly used biomarker of glycation, were not significantly different in the HT-IMF and MEM-IMF powders (Table 3). Therefore, while the membrane step may have reduced the overall heat load and generation of Maillard products, the split-stream process did not result in a significant reduction of the CML biomarker in the powder after storage under typical IMF conditions.

3.3.3. Alkaline Phosphatase Activity

Monitoring ALP activity, an indigenous milk enzyme, is a standard practice in dairy processing, with a threshold enzyme activity of 350 mU L−1 reflecting effective pasteurisation of milk or milk products [39]. HT-IMF powders presented a significantly lower enzyme activity (p < 0.05, Table 3) than MEM-IMF powders, confirming that the HT-IMF powders contain almost fully inactivated ALP. In contrast, ALP activity was high in MEM-IMF powders, indicating that the enzyme remained largely active, and it is likely that other endogenous enzymes also retain their activity in the MEM-IMF powders, although this may negatively affect product stability during shelf life [40]. This further demonstrates the ability of the split-stream process to preserve native proteins, including indigenous enzymes, in infant formula.

4. Discussion

A split-stream process produced infant milk formula with increased whey proteins in their native form and reduced the extent of protein aggregation. However, an absolute value of only 18.3% native whey protein in the MEM-IMF final powders is relatively low and was likely due to the lab-scale processing, which could only reach a VCF 3.2 at 0.2 μm MF stage. The unusually high levels of whey protein denaturation were consistent with a model IMF produced by Joyce et al. [41], who observed that 94.7% of β-lg and 78% of α-la were denatured when heated at 85 °C for 2 min, while added calcium further increased the denaturation levels to 98% and 94% for β-lg and α-la, respectively. In addition, the condensing effect of 0.2 μm MF enhanced the protein concentration in the retentate stream and may have resulted in more extensive denaturation, as observed in mixed whey protein systems during high-heat treatment [42].Moreover, the initial WPI powder, which contributes 83.3% of whey proteins in the IMFs, was found to have 8.5% of the whey protein already denatured. Spray-drying applied in our studies may also result in 20–25% whey protein denaturation [43,44]. The small scale of production also resulted in reduction of total protein in the MEM-IMF powders because of dilution and loss of the feed, which remained in the microfiltration unit at the end of the filtration cycle. This has been reported as a disadvantage of standard MF installations [45]. However, appropriate technological reconfigurations in the design of membrane plants can reduce the proportion of retentate volume [46]. In a follow-up scale-up pilot plant trial producing 200 kg batches of IMF powders, described in detail in the Supplementary Material section, the VCF reached a much higher value of 9.5 for the 0.2 μm MF. Under these conditions, the first stage MEM-IMF had 10.9 g of total protein per 100 g of powder with 4.02 g native whey protein compared to 11.4 g 100 g−1 powder of total protein and 0.3 g native whey protein. Yu et al. [6] reported a 6% and 58% of protein denaturation extent in the semi-industrial production of IMFs treated by 0.8 μm MF, followed by moderate heat treatment and successive heat treatment, respectively. Ultimately, a scale up process development of membrane filtrated IMF requires further optimisation regarding the type of possible membranes, spray-drying conditions, yield, cost, sources of ingredients, environmental sustainability, etc. However, the principal approach by which native whey proteins escape heat denaturation via a split-stream membrane filtration step, membrane filtration, remains the same for the lab and industrial-scale process.
The proportion of native and denatured proteins significantly influences the digestive kinetics of the gastric phase in adults and infants. We have recently reported that the MEM-IMF described here resulted in an altered protein hydrolysis profile at the end of a simulated static in vitro gastric digestion when compared to HT-IMF [14]. This affected the panel of bioavailable peptides detected in the basolateral compartment of Caco-2 monolayer and significantly increased tight junction protein, claudin 1, and improved tight junction integrity compared to HT-IMF. While the total native protein content was relatively low from the laboratory-scale MF process, these results highlight the potential benefits of adopting the novel IMF production process described in this paper.
One of the primary functions of the heat treatments in IMF production is control of microbial contamination. Previous studies have demonstrated the potential of 1.4 μm membranes to help control microbial contamination without significantly altering the product [30,47]. However, to achieve microbial reduction comparable to high-heat treatment, it requires a sterilising membrane, and bacterial cells were recovered from the 0.2 μm PVDF membrane permeate. Therefore, either the membrane fitted in the lab scale equipment was unable to retain all the bacteria from the feed material under the process conditions, or the equipment was contaminated despite pre- and post-run CIP protocols. The altered protein profile of the permeate indicated that the membrane was functioning properly and points to a contamination problem in the laboratory scale equipment. This also highlights the problem of replacing the established heat treatment in IMF with an alternative processes. Yu et al. [6] reported similar difficulties in trials with whey protein concentrate (WPC) obtained with 0.1 μm pore MF, which was not sterile due to postfiltration contamination. Therefore, the pilot-scale setup employed here successfully reduced the starting microbial load and produced IMF powder that meets EC No 2073/2005 specifications [48] but further work will be required to demonstrate that membrane filtration can be safely incorporated into IMF production and produce a safe reconstituted product.
Due to their specific formulation and processing conditions, IMFs typically show higher levels of glycation markers compared to other milk products, and the levels of AGEs in IMF may exceed those present in human breast milk by up to 670-fold [49]. MF offers the potential to reduce heat treatment and thereby Maillard reaction products. However, in this laboratory-scale production process, the levels of the CML marker were not significantly different to HT-IMF. Yu et al. [6] also reported that inclusion of a membrane step did not produce significant reduction in AGE markers, furosine, and CML, which could be attributed to Maillard reaction product generation during the spray-drying employed in both studies. These trial results suggest that the membrane technology is unlikely to provide a solution for Maillard reaction production accumulation in IMF products.

5. Conclusions

The current study has demonstrated that incorporating a membrane filtration step during infant formula processing can significantly increase the content of native proteins, which more closely resembles breast milk. A cascade membrane step consisting of a ceramic 1.4 μm filter followed by a PVDF polymeric 0.2 μm filter resulted in a reduction of total protein but reduced levels of denatured and aggregated proteins in the final MEM-IMF powder. The MEM-IMF powder met the microbial safety criteria for IMF but incorporating 0.2 μm membranes in the pilot scale set up did not completely eliminate microbial contamination, which requires further investigation.

Supplementary Materials

The following are available online at https://www.mdpi.com/article/10.3390/dairy2040041/s1, Table S1: Macro-nutrient content of ingredients, first stage (1st IMF) and second stage infant milk formula (2nd IMF) are expressed in g per 100 g powder. Table S2: Weight (in kg) of ingredients and process streams for processing membrane-filtered infant milk formula (MEM-IMF) and high-heat treated infant milk formula (HT-IMF). Table S3: Microfiltration (MF) processing performance parameters. Table S4: Protein profile present in final membrane-filtered infant milk formula (MEM-IMF) and high-heat treated infant milk formula (HT-IMF) powders. Figure S1. Processing scheme for the production of (A) membrane-filtered infant milk formula (MEM-IMF) and (B) high-heat treated infant milk formula (HT-IMF).

Author Contributions

Conceptualization, Y.C., M.C., C.S., J.T., L.F.G., M.J.D., L.G. and A.B.; methodology, Y.C., M.C., C.S., J.T., L.F.G., M.J.D., L.G. and A.B.; plant trials, Y.C. and C.S.; analysis, Y.C., M.C., C.S., J.T. and M.J.D.; original draft preparation, Y.C., M.C. and L.F.G.; review and editing, M.C., J.T., L.F.G., M.J.D., L.G. and A.B.; funding application, L.G. All authors have read and agreed to the published version of the manuscript.

Funding

This work was funded by the Irish Department of Agriculture, Food, and the Marine (FIRM grant 15/F/604-TOMI). André Brodkorb and Linda Giblin are funded by Science Foundation Ireland (SFI) and the Department of Agriculture, Food, and the Marine on behalf of the Government of Ireland under Grant Number [16/RC/3835]. The LC-MS studies were supported by a Novo Nordisk Foundation grant (NNF13OC0004294) to Michael Davies. Yihong Chen and Colm Shanahan are in receipt of a Teagasc Walsh Scholarship.

Institutional Review Board Statement

Not applicable.

Informed Consent Statement

Not applicable.

Data Availability Statement

Not applicable.

Conflicts of Interest

The authors declare no conflict of interest.

References

  1. Traves, D. Understanding infant formula. Paediatr. Child Health 2019, 29, 384–388. [Google Scholar] [CrossRef]
  2. Roux, S.; Courel, M.; Ait-Ameur, L.; Birlouez-Aragon, I.; Pain, J.-P. Kinetics of Maillard reactions in model infant formula during UHT treatment using a static batch ohmic heater. Dairy Sci. Technol. 2009, 89, 349–362. [Google Scholar] [CrossRef] [Green Version]
  3. Rudloff, S.; Lönnerdal, B. Solubility and Digestibility of Milk Proteins in Infant Formulas Exposed to Different Heat Treatments. J. Pediatr. Gastroenterol. Nutr. 1992, 15, 25–33. [Google Scholar] [CrossRef] [PubMed]
  4. Claeys, W.; Verraes, C.; Cardoen, S.; De Block, J.; Huyghebaert, A.; Raes, K.; Dewettinck, K.; Herman, L. Consumption of raw or heated milk from different species: An evaluation of the nutritional and potential health benefits. Food Control. 2014, 42, 188–201. [Google Scholar] [CrossRef]
  5. Doll, E.; Scherer, S.; Wenning, M. Spoilage of Microfiltered and Pasteurized Extended Shelf Life Milk Is Mainly Induced by Psychrotolerant Spore-Forming Bacteria that often Originate from Recontamination. Front. Microbiol. 2017, 8, 135. [Google Scholar] [CrossRef] [PubMed] [Green Version]
  6. Yu, X.; Leconte, N.; Méjean, S.; Garric, G.; Even, S.; Henry, G.; Tessier, F.; Howsam, M.; Croguennec, T.; Gésan-Guiziou, G.; et al. Semi-industrial production of a minimally processed infant formula powder using membrane filtration. J. Dairy Sci. 2021, 104, 5265–5278. [Google Scholar] [CrossRef]
  7. Van Lieshout, G.; Lambers, T.T.; Bragt, M.C.E.; Hettinga, K.A. How processing may affect milk protein digestion and overall physiological outcomes: A systematic review. Crit. Rev. Food Sci. Nutr. 2020, 60, 2422–2445. [Google Scholar] [CrossRef] [Green Version]
  8. Phosanam, A.; Chandrapala, J.; Huppertz, T.; Adhikari, B.; Zisu, B. In vitro digestion of infant formula model systems: Influence of casein to whey protein ratio. Int. Dairy J. 2021, 117, 105008. [Google Scholar] [CrossRef]
  9. Mulet-Cabero, A.-I.; Mackie, A.R.; Wilde, P.J.; Fenelon, M.A.; Brodkorb, A. Structural mechanism and kinetics of in vitro gastric digestion are affected by process-induced changes in bovine milk. Food Hydrocoll. 2019, 86, 172–183. [Google Scholar] [CrossRef]
  10. Horstman, A.M.; Ganzevles, R.A.; Kudla, U.; Kardinaal, A.F.; Borne, J.J.V.D.; Huppertz, T. Postprandial blood amino acid concentrations in older adults after consumption of dairy products: The role of the dairy matrix. Int. Dairy J. 2021, 113, 104890. [Google Scholar] [CrossRef]
  11. de Oliveira, S.C.; Deglaire, A.; Ménard, O.; Bellanger, A.; Rousseau, F.; Henry, G.; Dirson, E.; Carrière, F.; Dupont, D.; Bourlieu, C. Holder pasteurization impacts the proteolysis, lipolysis and disintegration of human milk under in vitro dynamic term newborn digestion. Food Res. Int. 2016, 88, 263–275. [Google Scholar] [CrossRef]
  12. Deglaire, A.; De Oliveira, S.C.; Jardin, J.; Briard-Bion, V.; Emily, M.; Ménard, O.; Bourlieu, C.; Dupont, D. Impact of human milk pasteurization on the kinetics of peptide release during in vitro dynamic term newborn digestion. Electrophoresis 2016, 37, 1839–1850. [Google Scholar] [CrossRef] [PubMed]
  13. Chatterton, D.E.; Smithers, G.; Roupas, P.; Brodkorb, A. Bioactivity of β-lactoglobulin and α-lactalbumin—Technological implications for processing. Int. Dairy J. 2006, 16, 1229–1240. [Google Scholar] [CrossRef]
  14. Bavaro, S.L.; Mamone, G.; Picariello, G.; Callanan, M.J.; Chen, Y.; Brodkorb, A.; Giblin, L. Thermal or membrane processing for Infant Milk Formula: Effects on protein digestion and integrity of the intestinal barrier. Food Chem. 2021, 347, 129019. [Google Scholar] [CrossRef] [PubMed]
  15. ISO. Milk. Determination of Nitrogen Content Part 1: Kjeldahl Method 2001; IOS 8968-1: 2001 (IDF 20-1:2001); ISO: Genevan, Switzerland, 2001. [Google Scholar]
  16. ISO. Milk. Determination of Casein-Nitrogen Content—Part 1: Indirect Method 2004; ISO 17997-1:2004 (IDF 29-1:2004); ISO: Genevan, Switzerland, 2004. [Google Scholar]
  17. Jones, D.B. Factors for Converting Percentages of Nitrogen in Foods and Feeds into Percentages of Proteins; US Department of Agriculture: Washington, DC, USA, 1931.
  18. ISO. Milk Determination of Fat Content 2008; ISO 2446:2008 (IDF 226:2008); ISO: Genevan, Switzerland, 2008. [Google Scholar]
  19. ISO. Milk and Milk Products. Determination of Lactose Content by High-Performance Liquid Chromatography (Reference Method) 2007; ISO 22662|IDF 198:2007; ISO: Genevan, Switzerland, 2007. [Google Scholar]
  20. EC. Commission Directive 2006/141/EC on Infant Formulae and Follow-on Formulae Amending Directive 1999/21/EC; 2006/141/EC 2006, OJ L401; EC: Brussels, Belgium, 2006. [Google Scholar]
  21. Blais, H.; Ho, Q.T.; Murphy, E.G.; Schroën, K.; Tobin, J.T. A cascade microfiltration and reverse osmosis approach for energy efficient concentration of skim milk. J. Food Eng. 2021, 300, 110511. [Google Scholar] [CrossRef]
  22. Gaspard, S.J.; Brodkorb, A. The Use of High Performance Liquid Chromatography for the Characterization of the Unfolding and Aggregation of Dairy Proteins; Springer Science and Business Media LLC: Berlin/Heidelberg, Germany, 2019; Volume 2039, pp. 103–115. [Google Scholar]
  23. Kehoe, J.J.; Wang, L.; Morris, E.R.; Brodkorb, A. Formation of Non-Native β-Lactoglobulin during Heat-Induced Denaturation. Food Biophys. 2011, 6, 487–496. [Google Scholar] [CrossRef] [Green Version]
  24. Birlouez-Aragon, I. Assessment of protein glycation markers in infant formulas. Food Chem. 2004, 87, 253–259. [Google Scholar] [CrossRef]
  25. Chen, Z.; Kondrashina, A.; Greco, I.; Gamon, L.F.; Lund, M.N.; Giblin, L.; Davies, M.J. Effects of Protein-Derived Amino Acid Modification Products Present in Infant Formula on Metabolic Function, Oxidative Stress, and Intestinal Permeability in Cell Models. J. Agric. Food Chem. 2019, 67, 5634–5646. [Google Scholar] [CrossRef]
  26. Gamon, L.; Guo, C.; He, J.; Hägglund, P.; Hawkins, C.; Davies, M.J. Absolute quantitative analysis of intact and oxidized amino acids by LC-MS without prior derivatization. Redox Biol. 2020, 36, 101586. [Google Scholar] [CrossRef]
  27. ISO. Milk and Milk Products Determination of Alkaline Phosphatase Activity—Part 1: Fluorimetric Method for Milk and Milk-Based Drinks 2013; ISO 11816-1 (IDF 155-1:2013) 13; ISO: Genevan, Switzerland, 2013. [Google Scholar]
  28. EC. Commission Regulation (EC) No 1664/2006 of 6 November 2006 Amending Regulation (EC) No 2074/2005 as Regards Implementing Measures for Certain Products of Animal Origin Intended for Human Consumption and Repealing Certain Implementing Measures; No. 1664/2006 2006, 1–33; EC: Brussels, Belgium, 2006. [Google Scholar]
  29. Hausmann, A.; Duke, M.C.; Demmer, T. Principles of Membrane Filtration; Wiley: Hoboken, NJ, USA, 2012; pp. 17–51. [Google Scholar]
  30. Griep, E.R.; Cheng, Y.; Moraru, C.I. Efficient removal of spores from skim milk using cold microfiltration: Spore size and surface property considerations. J. Dairy Sci. 2018, 101, 9703–9713. [Google Scholar] [CrossRef] [Green Version]
  31. Corredig, M.; Verespej, E.; Dalgleish, D.G.; Brodkorb, A. Interaction of Caseins with K-carrageenan Studied by Size Excluson-HPLC/Multi Angle Laser Light Scattering. In Gums and Stabilisers for the Food Industry; Williams, P.A., Phillips, G.O., Eds.; The Royal Society of Chemistry: Cambridge, UK, 2006; pp. 221–226. [Google Scholar]
  32. Gaspard, S.J.; Auty, M.A.; Kelly, A.; O’Mahony, J.A.; Brodkorb, A. Isolation and characterisation of κ-casein/whey protein particles from heated milk protein concentrate and role of κ-casein in whey protein aggregation. Int. Dairy J. 2017, 73, 98–108. [Google Scholar] [CrossRef]
  33. Singh, H. Heat stability of milk. Int. J. Dairy Technol. 2004, 57, 111–119. [Google Scholar] [CrossRef]
  34. Lin, S.; Sun, J.; Cao, D.; Cao, J.; Jiang, W. Distinction of different heat-treated bovine milks by native-PAGE fingerprinting of their whey proteins. Food Chem. 2010, 121, 803–808. [Google Scholar] [CrossRef]
  35. Mok, K.H.; Kuhn, L.; Goez, M.; Day, I.; Lin, J.C.; Andersen, N.H.; Hore, P. A pre-existing hydrophobic collapse in the unfolded state of an ultrafast folding protein. Nat. Cell Biol. 2007, 447, 106–109. [Google Scholar] [CrossRef] [Green Version]
  36. Singh, M.J.; Chandrapala, J.; Udabage, P.; McKinnon, I.; Augustin, M.A. Heat-induced changes in the properties of modified skim milks with different casein to whey protein ratios. J. Dairy Res. 2014, 82, 135–142. [Google Scholar] [CrossRef]
  37. Wijayanti, H.B.; Bansal, N.; Deeth, H.C. Stability of Whey Proteins during Thermal Processing: A Review. Compr. Rev. Food Sci. Food Saf. 2014, 13, 1235–1251. [Google Scholar] [CrossRef]
  38. Contreras-Calderón, J.; Guerra-Hernández, E.; García-Villanova, B. Utility of some indicators related to the Maillard browning reaction during processing of infant formulas. Food Chem. 2008, 114, 1265–1270. [Google Scholar] [CrossRef]
  39. Lorenzen, P.C.; Clawin-Rädecker, I.; Einhoff, K.; Hammer, P.; Hartmann, R.; Hoffmann, W.; Martin, D.; Molkentin, J.; Walte, H.G.; Devrese, M. A survey of the quality of extended shelf life (ESL) milk in relation to HTST and UHT milk. Int. J. Dairy Technol. 2011, 64, 166–178. [Google Scholar] [CrossRef]
  40. O’Mahony, J.A.; Fox, P.F.; Kelly, A. Indigenous Enzymes of Milk; Springer Science and Business Media LLC: Berlin/Heidelberg, Germany, 2012; pp. 337–385. [Google Scholar]
  41. Joyce, A.M.; Brodkorb, A.; Kelly, A.; O’Mahony, J.A. Separation of the effects of denaturation and aggregation on whey-casein protein interactions during the manufacture of a model infant formula. Dairy Sci. Technol. 2017, 96, 787–806. [Google Scholar] [CrossRef] [Green Version]
  42. Buggy, A.K.; McManus, J.; Brodkorb, A.; Hogan, S.A.; Fenelon, M.A. Pilot-scale formation of whey protein aggregates determine the stability of heat-treated whey protein solutions—Effect of pH and protein concentration. J. Dairy Sci. 2018, 101, 10819–10830. [Google Scholar] [CrossRef] [Green Version]
  43. Anandharamakrishnan, C.; Rielly, C.D.; Stapley, A.G.F. Effects of Process Variables on the Denaturation of Whey Proteins during Spray Drying. Dry. Technol. 2007, 25, 799–807. [Google Scholar] [CrossRef]
  44. Anandharamakrishnan, C.; Rielly, C.; Stapley, A. Loss of solubility of α-lactalbumin and β-lactoglobulin during the spray drying of whey proteins. LWT 2008, 41, 270–277. [Google Scholar] [CrossRef] [Green Version]
  45. Skrzypek, M.; Burger, M. Isoflux® ceramic membranes—Practical experiences in dairy industry. Desalination 2010, 250, 1095–1100. [Google Scholar] [CrossRef]
  46. Le, T.T.; Cabaltica, A.D.; Bui, V.M. Membrane separations in dairy processing. J. Food Res. Technol. 2014, 2, 1–14. [Google Scholar]
  47. Tomasula, P.; Mukhopadhyay, S.; Datta, N.; Porto-Fett, A.; Call, J.; Luchansky, J.; Renye, J.; Tunick, M. Pilot-scale crossflow-microfiltration and pasteurization to remove spores of Bacillus anthracis (Sterne) from milk. J. Dairy Sci. 2011, 94, 4277–4291. [Google Scholar] [CrossRef] [Green Version]
  48. EC. Commission Regulation (EC) No 2073/2005 of 15 November 2005 on Microbiological Criteria for Foodstuffs. No. 2073/2005 2020, OJ L 338; EC: Brussels, Belgium, 2020. [Google Scholar]
  49. Klenovics, K.S.; Boor, P.; Somoza, V.; Celec, P.; Fogliano, V.; Šebeková, K. Advanced Glycation End Products in Infant Formulas Do Not Contribute to Insulin Resistance Associated with Their Consumption. PLoS ONE 2013, 8, e53056. [Google Scholar] [CrossRef]
Figure 1. Processing scheme for the production of (A) membrane-filtrated infant milk formula (MEM-IMF) and (B) high-heat-treated infant formula (HT-IMF).
Dairy 02 00041 g001
Figure 2. Size exclusion chromatograms (SEC-HPLC) of (A) high-heat-treated infant milk formula (HT-IMF) and (B) membrane-filtered infant milk formula (MEM-IMF).
Dairy 02 00041 g002
Figure 3. (A) Membrane-filtered infant milk formula (MEM-IMF) and (B) high-heat-treated infant milk formula (HT-IMF). Inner layer: amount of soluble materials (light gray) and insoluble materials (black), g 100 g−1 IMF powder; Middle layer: amount of different molecular weight (Mw) distribution (g 100 g−1 IMF powder), large aggregates and small casein particles (100 to 500 kDa, white), monomeric BSA and small aggregates (30 to 100 kDa, black), monomeric β-lg (16 to 25 kDa, dark gray), and monomeric α-la (9 to 16.5 kDa, light gray); Outer layer: amount of native whey proteins (g 100 g−1 IMF powder), native BSA (black), native β-lg (dark gray), and native α-la (light gray).
Dairy 02 00041 g003
Table 1. Macro-nutrients content of ingredients and the first stage infant milk formula (IMF) expressed as g per 100 g powder.
ProductFatTotal ProteinCarbohydrate
Skim milk0.1 ± 0.053.51 ± 0.084.92 ± 0.12 a
WPItraces b91.6 ± 0.31traces b
Lactose traces btraces b96.67 ± 0.41
First stage IMF29.110.858.3
a lactose only. b traces < 0.1%.
Table 2. Average mass (in g) of ingredients for processing membrane-filtered infant milk formula (MEM-IMF) and high-heat-treated infant milk formula (HT-IMF).
Ingredients and Streams (g)MEM-IMFHT-IMF
Skim milk12,000 ± 04229 ± 92
WPI458 ± 9161 ± 0
1.4 μm MF
Feed12,458 ± 9
Permeate8305 ± 6
0.2 μm MF
Feed8305 ± 6
Permeate5710 ± 5
Retentate2595 ± 2
Lactose2735 ± 591446 ± 2
Fat1508 ± 35792 ± 2
Table 3. Protein profile and quality analysis of MF feed, permeate, and retentate and final membrane-filtered infant milk formula (MEM-IMF) and high-heat-treated infant milk formula (HT-IMF) powders.
1.4 μm Feed1.4 μm Permeate0.2 μm Permeate02 μm RetentateMEM-IMF PowderHT-IMF Powder
Total protein (g per 100 g solution) 16.86 a6.49 b3.37 c12.45 d
Total protein (g per 100 g powder) 1 9.73 ± 0.27 B11.40 ± 0.65 A
Protein profile (% of total protein) 2
ĸ-casein7.38 a7.48 a6.50 b7.74 c6.82 f6.38 d
αs-casein18.00 a18.01 a14.07 b19.01 c17.27 f18.28 d
β-casein14.21 a14.26 a12.39 b15.42 c14.16 f16.20 d
Total casein39.58 a39.74 a32.97 b42.18 c38.25 f40.86 d
α-la10.74 a10.85 a13.70 b9.43 c11.17 f8.47 d
β-lg B23.46 a23.18 a24.23 b22.61 c27.36 f28.41 d
β-lg A26.22 a26.23 a29.10 b25.78 c23.22 f22.26 d
Total whey protein60.42 a60.26 a67.03 b57.82 c61.75 f59.14 d
Total bacterial counts (TBC) 34.5 × 10⁵ 1.4 × 10³ 1.3 × 1025.6 × 101
Moisture (g per 100 g powder) 2.35 ± 0.04 B1.96 ± 0.01 A
Alkaline phosphatase (ALP) activity (mU 100 g−1 powder) 28,557 ± 463 B103.0 ± 12.5 A
Carboxymethyl-lysine (CML, ng mg−1) 4 3.65 ± 0.743.97 ± 0.70
Relative fluorescence 5 0.98 ± 0.041.36 ± 0.12
1 Total protein determined by Kjeldahl method; 2 Protein profile determined by RP-HPLC; a–d Values within a row with different superscripts are statistically different at p < 0.05; A, B Capital letters were used for powders; 3 CFU/mL liquid or CFU/mg powder; 4 CML levels normalised relative to the calculated concentration of non-modified phenylalanine; units in ng per mg of powder; 5 Fluorescence compared to quinine sulphate standard.
Publisher’s Note: MDPI stays neutral with regard to jurisdictional claims in published maps and institutional affiliations.

