Next Article in Journal
Parameter Estimation of KST-IRT Model under Local Dependence
Previous Article in Journal
Expanding NAEP and TIMSS Analysis to Include Additional Variables or a New Scoring Model Using the R Package Dire
 
 
Please note that, as of 22 March 2024, Psych has been renamed to Psychology International and is now published here.
Article

Increased Activity in the Prefrontal Cortex Related to Planning during a Handwriting Task

1
Department of Pediatrics and Child Health, Kurume University School of Medicine, 67 Asahi-machi, Kurume, Fukuoka 830-0011, Japan
2
Pattern Processing Lab, School of Computer Science and Engineering, The University of Aizu, Fukushima 965-8580, Japan
3
School of Computer Science and Engineering, The University of Aizu, Fukushima 965-8580, Japan
4
Faculty of Humanities and Social Sciences, Kumamoto University, Kumamoto 860-8555, Japan
*
Author to whom correspondence should be addressed.
Psych 2023, 5(3), 896-907; https://doi.org/10.3390/psych5030059
Submission received: 30 June 2023 / Revised: 3 August 2023 / Accepted: 8 August 2023 / Published: 18 August 2023
(This article belongs to the Section Cognitive Psychology)

Abstract

:
We investigated the relationship between the prefrontal cortex (PFC) and executive function during a drawing task. Thirty-three participants using pen tablets provided the data for this task. PFC activity was recorded using functional near-infrared spectroscopy (fNIRS) during a simple zig-zag task and a complex periodic line (PL) pattern task. For each task, there was a trace condition and a prediction condition. The Executive Function Questionnaire (EFQ) was used to examine the association between brain-function measurements and executive function during the task. PFC activity was analyzed in the right, middle, and left regions. Oxygenated hemoglobin values measured with fNIRS were converted to z-values and analyzed as a measure of brain activity. Drawing fluency was measured using the line length. In the PL pattern task, the line length was significantly shorter under the prediction condition than under the trace condition. Activity in the right PFC under the prediction condition was significantly higher than that under the trace condition in the PL pattern task, and the score of the EFQ planning subscale was associated with activity in the right PFC. Activity in the right PFC is important for fluent drawing, suggesting that it is also important during drawing activities involving symbols such as letters.

1. Introduction

Handwriting is a complex skill that requires several cognitive functions to recognize and express letters as shapes [1,2]. Writing begins before school age, and by the end of their elementary-school years, children can write fluently. One method of evaluating writing is writing fluency [3]. It has been reported that children with neurodevelopmental disorders experience difficulty writing letters smoothly; however, the factors behind this remain unclear [4]. Fluency is associated with executive function [5], and the prefrontal cortex (PFC) has been suggested to be the center of executive function [6]. In previous studies using letters as stimuli, it was impossible to avoid the influence of phonemes as a confounding factor of writing fluency. Therefore, we investigated PFC activity when drawing a simple shape and a sequence of different shapes using a phonologically unaffected continuous drawing task. Writing tasks have been suggested to be related to planning, which is one of the components of executive function [4,7]. Executive function is strongly associated with the PFC [7,8], and individual executive functions may be related to their area of localization within the PFC [9,10,11,12]. Previous studies have suggested that the right PFC is associated with inhibitory control of executive function [13,14] and that the middle PFC is associated with executive function switching [15]. A previous study that focused on tempo when writing letters showed a relationship with the right inferior parietal lobule [16]. However, the localization of activity within the PFC in relation to the continuous drawing of complex figures, such as letters, has not been clarified.
An increasing number of studies on letters are using pen tablets because they enable researchers to obtain dynamic indices during writing [17]. A pen tablet makes it possible to quantitatively measure dynamic indicators, such as writing speed and pressure. The relationship of these indices with diseases and disorders that cause difficulty in writing is being investigated [18,19]. Parkinson’s disease and neurodevelopmental disorders, including learning disorders, are the main objects of research as they cause difficulties with writing [18,19]. These are known to cause peculiarities regarding motor function, executive function, and PFC function. In this study, we aimed to examine the relationship between drawing and both PFC function and executive function.
Aleksandr Romanovich Luria is known to have tried to clarify the function of the brain using drawing tasks [20]. Luria tried to capture abnormalities in brain activity using a graphic test. In recent years, research has also captured drawing dynamics peculiar to Parkinson’s disease by applying this graphic test using a pen tablet [17]. There have been many previous studies on the relationship between handwriting and brain activity. However, there has been no mention of executive function, which is the cognitive process underlying goal-directed behavior. In this study, we used Luria’s graphic test, which is expected to be useful for discovering abnormalities in brain activity in the future, and focused on the activity of the PFC during continuous drawing in healthy adults. We hypothesized that our study would provide basic results regarding the activity of the PFC during continuous drawing and the executive functions required for continuous drawing. Our results may provide an important foundation for future writing research and research regarding people with impaired executive function.

2. Materials and Methods

Some studies using functional near-infrared spectroscopy (fNIRS) that focused on executive function and prefrontal activity divided the PFC into three regions [11,13,14]. In this study, we classified the PFC into three regions and measured PFC activity during drawing. We investigated the relationship between drawing and executive function based on the results of an executive function questionnaire. The task comprised a graphic test devised by Luria [20], which required participants to trace and copy simple and complex figures. The task included a zig-zag line and a periodic line pattern (PL pattern) component, as it has been suggested that the cognitive processes involved in these activities differ [20]. The PL pattern task alternately repeats different figures. Therefore, it is expected that inhibition control and planning abilities are required. Furthermore, each part of the task included trace and prediction conditions. The trace condition required participants to trace the pattern displayed across the screen with the pen. In the prediction condition, the participant would continue to draw the pattern displayed on the pen tablet independently, without looking at the figure. In the prediction condition, there is no cognitive conflict when drawing simple figures (zig-zag line task), but there is cognitive conflict when drawing complex figures (PL pattern task). To draw without making mistakes during the prediction condition in the PL pattern task, the ability to predict and draw while planning is required.
This study used Luria’s graphic test to measure brain activity during complex drawing activities. We aimed to provide new insights into the executive functions required for drawing by analyzing brain activity during drawing in conjunction with the results of a questionnaire.

2.1. Participants and Recruitment Process

Forty-one healthy undergraduate and graduate students in Japan were enrolled in this study (17 men and 24 women; mean age ± SD = 24.273 ± 3.864 years). None of the participants had any special training in painting or drawing. The exclusion criteria comprised the following: left-handedness, a mean Raven’s Colored Progressive Matrices (RCPM) score of ≥2 standard deviations (SD), and a score of 3 SD above or below the mean fNIRS score. Among the 41 participants, four were excluded owing to mechanical recording defects, two were excluded for being left-handed, and two were excluded for having a score 3 SD above or below the mean functional near-infrared spectroscopy (fNIRS) score. Thus, the data of 33 participants were analyzed (13 men and 20 women; mean age ± SD = 23.517 ± 3.994 years). The RCPM test and pegboard task (Ibaraki Prefectural University Finger Dexterity Test: IPUT) [21] were conducted before the pen tablet task. The RCPM test was administered to exclude cognitive deficits. Fingertip dexterity and coordination were assessed based on the participants’ reaction times to the IPUT. We excluded fNIRS scores that were > 3 SD away from the mean because these were likely to be contaminated by motion artifacts. All participants were confirmed to be right-handed based on the Edinburgh Handedness Inventory. Participants had normal finger motor and cognitive function and could perform the tasks accurately. Written consent was obtained from the participants before the measurement. The Ethics Committee of the Graduate School of Social and Cultural Sciences of Kumamoto University approved the protocol of the present study (approval number: 45, 20 July 2022).

2.2. Pen Tablet Task

We used a Wacom pen tablet (Cintiq Pro 16, DTH-1620; Wacom Inc., Saitama, Japan) to quantify the drawing dynamics [22]. The screen size of the active area was 15.6 inches, and the resolution was 2560 × 1440 pixels. The participants were required to draw on the tablet using a dedicated pen. The patterns drawn by the participants were recorded at a time resolution of 200 Hz. Data were acquired from the pen tablet in x and y coordinates (in pixels, with the origin at the upper left of the screen).
The participants sat on chairs at desks with the soles of their feet touching the floor. The pen tablet was placed in front of their body, and the distance between the pen tablet and their eyes was adjusted to approximately 40 cm. The stimulus was displayed on the pen tablet. This study adopted two patterns based on Luria’s graphic test [19]. One pattern corresponds to a set of continuous zig-zag lines (a continuous set of triangles with no base). In contrast, the other corresponded to a continuous PL pattern task (sequentially repeated squares and triangles with no base) (Figure 1). The starting point of the pattern was 3.3 cm from the top and 2.1 cm from the left side of the tablet screen. The zig-zag line task comprised a continuous line of 11 isosceles triangles with no base for each line. The angles of the apex and the bottom were 70 degrees and 80 degrees, respectively, and each side was 2.5 cm in length. Five lines were displayed on one screen. The distance between the starting points of the five lines was 3.5 cm. The participants were able to draw up to five lines on one screen. They were instructed to draw as quickly and accurately as possible, without lifting the nib from the tablet for all the tasks and conditions. The PL pattern was drawn into a stimulus diagram by alternately arranging a baseless quadrangle (2 cm height and 1.3 cm top width) and a baseless isosceles triangle (70-degree vertex). One cycle was set for squares and triangles, and 7.5 cycles were arranged in one row. Five lines of the PL pattern were presented on one screen in light gray for both conditions.
The task was based on the zig-zag line task. The PL pattern task involved repeating different figures in an alternating manner. The zig-zag line task is simple, whereas the PL pattern task is complex, requiring inhibition control and planning ability. Furthermore, each task included a trace condition and prediction condition. The trace condition required the participants to trace the entire pattern displayed on the screen with a pen. The prediction condition required the participants to predict and draw subsequent figures using part of the presented pattern. To draw the PL line task on the prediction condition, inhibition control, planning ability, and prediction ability are required.

2.3. Experimental Design

The zig-zag line and PL pattern tasks were performed separately. The order of task presentation was counterbalanced for each participant. The zig-zag line and PL pattern tasks each consisted of trace and prediction conditions. The conditions were presented in a specific order; the prediction condition was presented after the trace condition. Under the trace condition, the line was displayed in a light gray color, and the participants traced the indicated line. Under the prediction condition, after being shown the first part of the pattern, the participants tracked, predicted, and continued with the one-cycle pattern. Participants were required to move to the second line when the first line was completed. Each condition lasted 30 s, beginning with a 20 s rest period, during which the participants were required to fixate on a central cross symbol. During each 30 s task, new stimuli appeared on the screen 20 s after the participant’s response. Each task comprised one trace and one prediction condition. Each task was repeated for three trials. We required the participants to complete the tasks as quickly and accurately as possible. Participants were monitored to ensure that they drew as accurately as possible. This experiment was built on the protocol employed by previous studies using fNIRS [11,13,14,23,24].

2.4. fNIRS Recording and Analysis

fNIRS recordings were analyzed using a previously described method [14]. While the participants performed the pen tablet drawing task, their neural activity was recorded by measuring changes in oxygenated hemoglobin (oxy-Hb) levels using a multichannel fNIRS system (OEG-16®; Spectratech Inc., Tokyo, Japan) [25] (Figure 2). Oxy-Hb levels were expressed in mM·mm. The levels were converted to z-scores in the analysis. In this system, near-infrared laser diodes with two wavelengths (770 and 840 nm) were used to emit near-infrared light [26]. The re-emitted light was detected using avalanche photodiodes placed 3 cm from the emitters. The temporal resolution of the acquisition was approximately 0.65 s. The system measured oxy-Hb levels at a depth of approximately 3 cm below the scalp. In our system, six emitters and six detectors were placed at alternate points on a 2 × 6 grid, enabling us to detect signals from 16 channels (Figure 2). The center of the probe matrix was placed on Fpz (international 10–10 system), and the bottom left and bottom right corners were located at approximately F7 and F8, respectively, according to previous reports [11,13,23].
The fNIRS signals were sent to a data collection computer. The timing of each trial event was automatically recorded. Raw fNIRS recordings were passed through a band-pass filter (0.01–0.1 Hz) using a fast Fourier transform to reject records with movement artifacts [27]. Each record was converted to a z-score to compare traces across participants and channels to increase the signal-to-noise ratio [28,29,30,31,32]. The z-score was calculated using the mean and SD of oxy-Hb during the last 6 s of the rest period. Then, the mean and SD were adjusted to z-scores of 0 and 1, respectively, for each channel. Recordings > 3 SD away from the mean were excluded because of the potential contamination by motion artifacts. Any channels showing a difference among the right, middle, and left PFC were regarded as areas of interest. Signals from channels 1–6, 7–10, and 11–16 were averaged to yield. Those from channels 1–6 were averaged to yield the right PFC (dorsolateral PFC) activity, those from channels 7–10 were averaged to yield the middle PFC (frontal pore) activity, and those from channels 11–16 were averaged to yield the left PFC activity (dorsolateral PFC). In addition, the average signal for each channel during the last 20 s under the trace or prediction condition was used. The protocol, including the analysis method, was implemented according to a previous study [14].

2.5. Questionnaire

The Executive Function Questionnaire (EFQ) is a self-reported questionnaire that measures individual differences in executive function among healthy adults [29]. This questionnaire was used to measure the participants’ executive function in daily life. The questionnaire consists of 25 questions and 6 subclasses, including planning, absorption, efficacy, shifting, self-consciousness, and sustaining attention. The participants completed the EFQ by responding to each question on a scale from 1 (not at all) to 5 (extremely) points.
In the EFQ, “Planning” was defined as a function of setting goals and planning to achieve them. “Absorption” consisted of items that assessed enthusiasm. “Efficacy” consisted of items related to dexterity and work-processing efficiency. “Shifting” consisted of items related to the ability to switch strategies. “Self-consciousness” consisted of items related to self-perception and the awareness of one’s actions. “Sustaining attention” consisted of items related to the continuation of attention and concentration during tasks and work. Each item of the EFQ was considered independent, and the validity and reliability of the EFQ have been previously confirmed [27]. The reliability of this questionnaire has been shown previously, with Cronbach’s α of 0.805 for planning, 0.847 for absorption, 0.791 for efficacy, 0.706 for shifting, 0.827 for self-consciousness, and 0.769 for sustaining attention.

2.6. Data Analysis

2.6.1. Behavioral Data

All participants performed the tasks adequately. Therefore, we measured the drawn length based on the x and y coordinates of the participants’ drawing on the pen tablet. The length of the line drawn in 30 s was recorded as the index of fluency. In addition, we measured the time required to draw one cycle of the figure. Regarding the measurement time required to draw one cycle, a t-test was performed for the trace and prediction conditions of the zig-zag line task and the PL pattern task, respectively. A two-way analysis of variance (ANOVA) was performed with the task (zig-zag line and PL pattern task) and condition (trace and prediction). We used a multiple comparison approach based on the concept that pairwise comparisons are required after ANOVA [32]. In this study, data processing was performed using R software (version 3.6.3; R Software for Statistical Computing, Vienna, Austria). Statistical analysis was performed using IBM® SPSS® Statistics version 26 (IBM Corp., Armonk, NY, USA). Statistical significance levels were set at 5%.

2.6.2. fNIRS Data

Blood flow values of oxy-Hb were converted to z-scores (1–6 for the right PFC, 7–10 for the middle PFC, and 11–16 for the left PFC). The PFC was classified into three regions, and the values were averaged for each region. Data that exceeded 3 SD from the mean were excluded. A three-way ANOVA was performed with the brain region (right PFC, middle PFC, and left PFC), task (zig-zag line and PL pattern), and condition (trace and prediction). This method of analysis was based on a previous study [14]. Similar to the behavioral data analysis, we used a multiple comparison approach based on the concept that pairwise comparisons are required after ANOVA.

2.6.3. Questionnaire Data

We used the EFQ to examine the relevance of executive function. The correlation between EFQ scores and brain activity was analyzed. Furthermore, the participants were divided into the high and low groups based on the median value of right brain activity. A t-test was performed for each subcategory of the questionnaire.

3. Results

3.1. Behavioral Results
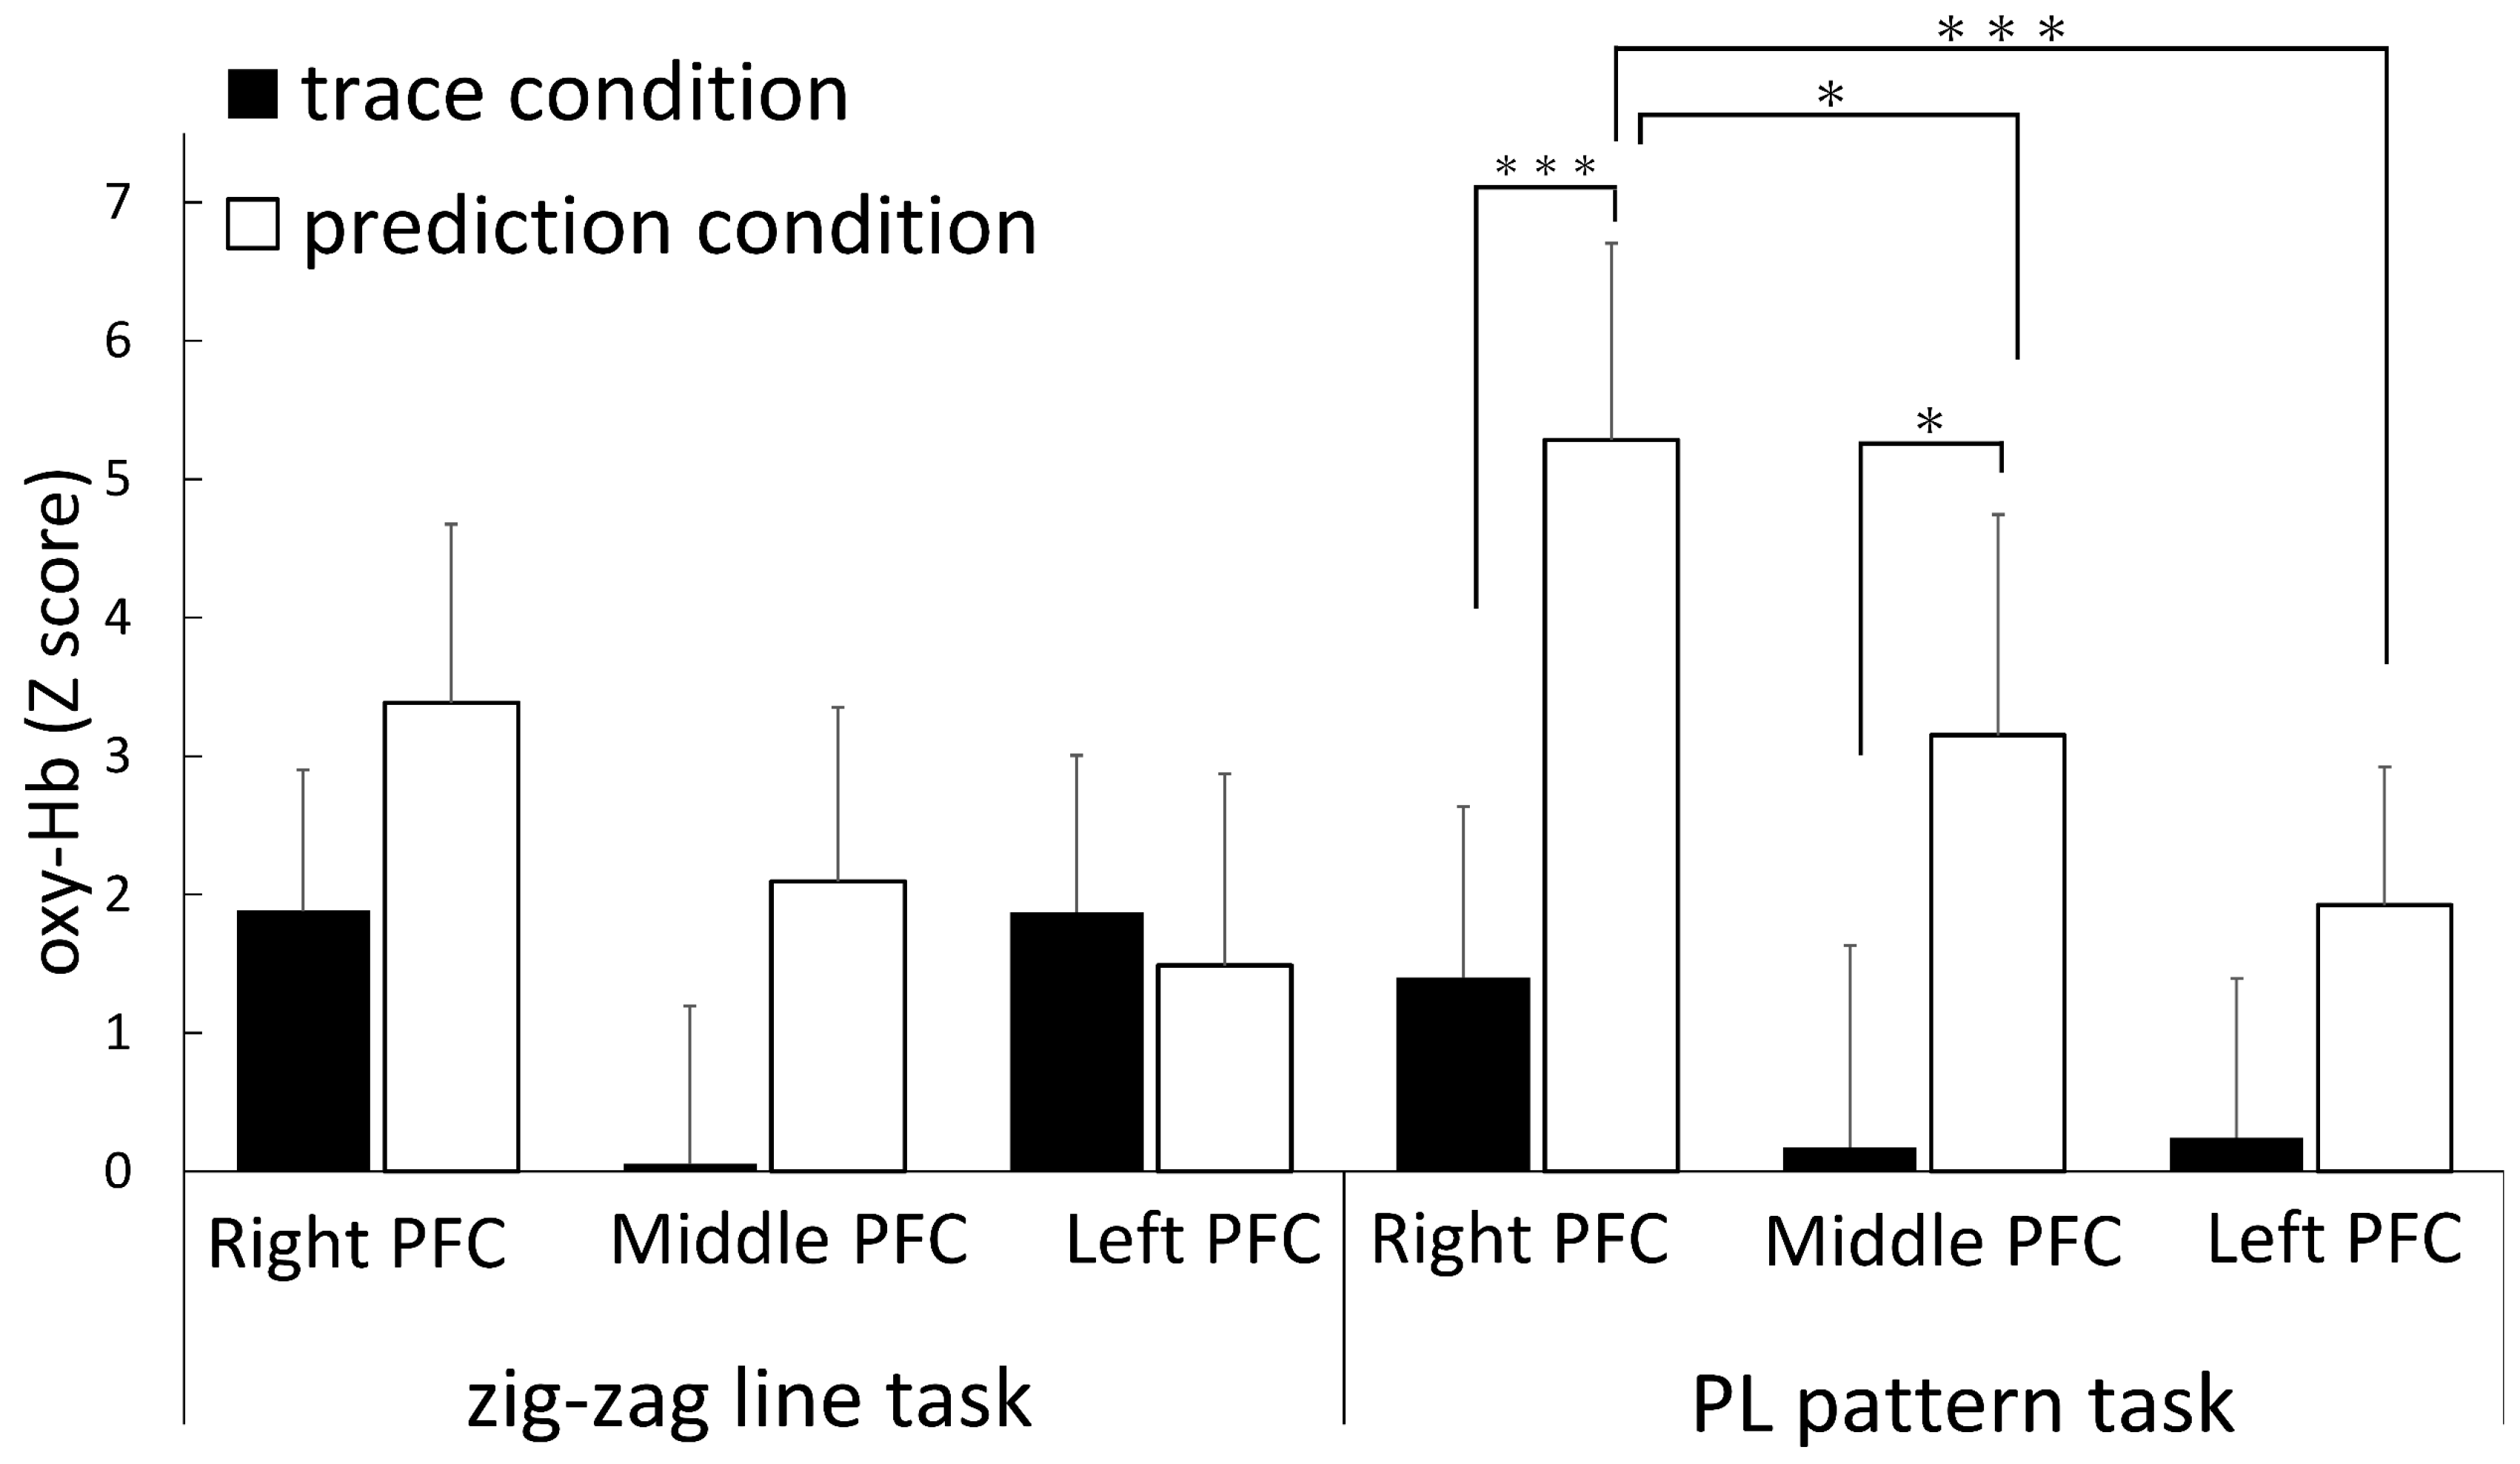
As an index of fluency, we measured the length of the lines that the participants could draw in 30 s (Figure 3). In the two-way ANOVA performed with the trace and prediction conditions for each of the two tasks (zig-zag line and PL pattern), no significant difference was observed regarding the main effect of the task (F (1, 32) = 3.312, p = 0.078, η2 = 0.003). However, the main effect of the condition was significant (F (1, 32) = 7.348, p = 0.012, η2 = 0.003), and a significant interaction was observed between task and condition (F (1, 32) = 20.55, p < 0.001, η2 = 0.004). Given that the interaction was significant, a simple main effect analysis was performed. No significant difference was observed between the zig-zag line and PL pattern tasks under the trace condition (F (1, 64) = 0.058, p = 0.081, η2 = 0.002). However, under the prediction condition, a significant difference was observed between the zig-zag line and PL pattern task, whereby the line drawn in the PL pattern task was significantly shorter (F (1, 64) = 12.580, p < 0.001, η2 = 0.493). No significant difference was observed in the zig-zag line task between the trace and prediction conditions (F (1, 64) = 0.073, p = 0.788, η2 = 0.002). A significant difference was observed in the PL pattern task between the trace and prediction conditions, whereby the PL pattern task was significantly shorter under the prediction condition (F (1, 64) = 22.800, p < 0.001, η2 = 0.503).
Moreover, we performed a t-test regarding the time taken to draw one cycle under the trace and prediction conditions for the zig-zag line task and the PL pattern task, respectively. Interestingly, there was no difference in the times between the two conditions in the zig-zag line task (t (32) = 0.278, p = 0.783, r = 0.953). In the PL pattern task, the time taken to draw one cycle was significantly longer under the prediction condition than under the trace condition (t (32) = 2.195, p = 0.036, r = 0.933).

3.2. fNIRS Results

Figure 4 shows the fNIRS waveforms in the two tasks (zig-zag line and PL pattern) and the two conditions (trace and prediction conditions). We observed enhanced oxy-Hb in the prediction condition compared with that in the trace condition. Under the prediction conditions for the PL pattern task, PFC activity appeared to be right-lateralized, and in the three-way ANOVA performed with the brain region (right PFC, middle PFC, and left PFC), task (zig-zag line and PL pattern task), and condition (trace condition and prediction condition) (Figure 5), no significant main effect of the task was observed (F (32, 1) = 0.116, p = 0.736, η2 < 0.001). However, significant main effects of the condition (F (32, 1) = 5.362, p = 0.027, η2 = 0.017) and brain region were observed (F (32, 1) = 3.308, p = 0.043, η2 = 0.010). No significant interaction was observed between the task and condition (F (32, 1) = 1.332, p = 0.257, η2 = 0.004) or between the task and brain region (F (64, 2) = 0.994, p = 0.376, η2 = 0.002). No significant interaction was observed between the condition and brain region (F (64, 2) = 2.855, p = 0.065, η2 = 0.004). Moreover, no significant three-way interaction was observed among the brain region, task, and condition (F (64, 2) = 0.452, p = 0.639, η2 < 0.001). Given that the main effect on the brain region was significant, a multiple comparison test was performed using Ryan’s methods. The oxy-Hb value in the right PFC was significantly higher than that in the middle PFC (p = 0.029) and left PFC (p = 0.003). No significant difference was observed in the oxy-Hb value between the left PFC and middle PFC (p = 0.986). Given the main effect of the condition, a multiple-comparison test was performed using Ryan’s method. The oxy-Hb value of the right PFC in the prediction condition was significantly higher than that in the trace condition (p = 0.005). The oxy-Hb value of the middle PFC in the prediction condition was significantly higher than that in the trace condition (p = 0.029).

3.3. Questionnaire Results

The results of the EFQ survey showed the following six subcategories: planning, absorption, efficacy, shifting, self-consciousness, and sustaining attention. The mean (standard deviation: SD) for each of the six subcategories was as follows: planning, 10.270 (3.732); absorption, 14.534 (3.799); efficacy, 9.237 (3.267); shifting, 11.845 (3.308); self-consciousness, 16.438 (3.448); sustaining attention, 11.127 (3.605). No significant correlation was observed between the EFQ score and brain activity. Therefore, the oxy-Hb values of the right PFC were classified into high and low groups according to the median values. A two-sided t-test was performed to compare the EFQ results between the high and low groups, and the relationship between PFC activity and executive function was investigated. A significant difference was observed only in the planning item among the six subcategories of planning, absorption, efficacy, shifting, self-consciousness, and sustaining attention in the questionnaire (planning: t (31) = −2.071, p = 0.047, r = 0.350; absorption: t (31) = 1.457, p = 0.155, r = 0.250; efficacy: t (31) = 0.642, p = 0.525, r = 0.110; shifting: t (31) = 0.414, p = 0.682, r = 0.070; self-consciousness: t (31) = −1.310, p = 0.200, r = 0.230; sustaining attention: t (31) = −0.551, p = 0.585, r = 0.100).
There was a significant correlation observed between the EFQ (self-consciousness) domain and line length (zig-zag trace: r = 0.546, p = 0.001; zig-zag prediction: r = 0.510, p = 0.002; PL trace: r = 0.475, p = 0.005; PL prediction: r = 0.492, p = 0.004).

4. Discussion

In this study, we measured brain activity during a drawing task and examined its relationship with the EFQ dimensions. The behavioral index, line length, was short, and the time to draw one cycle was protracted under the prediction condition of the PL pattern task. The behavioral performance was low; however, the activity in the right PFC was high. Higher PFC activity during a task denotes that the cognitive load of the task is equivalently substantial [33]. Under the prediction condition in the PL pattern task, the behavioral index was low, although brain activity was high, suggesting that the cognitive load might have been high. Right PFC activity (z-score) in the prediction condition was classified into high and low groups, and the relationship between right PFC activity and executive function was investigated. As a result, in the high PFC activity group, the EFQ score was high, related to the score of the planning subscale. Executive function can be considered a set of abilities required to guide behavior toward a goal [34]. This involves action initiation, goal setting and planning, performing objective actions, self-monitoring, self-regulation, intentional behavior, restraint, and flexibility [35]. In addition, Braver describes two modes of cognitive control: proactive and reactive. Proactive control relies on anticipating and preventing interference before it occurs, whereas reactive control relies on detecting and resolving interference after its onset [36]. Executive function is associated with brain activity in the PFC [37]. In the zig-zag line task, there was no difference in brain activity between the trace and prediction conditions. This suggests that the prediction condition of the zig-zag line task does not require executive function. In contrast, brain activity in the PL pattern task was higher in the prediction condition than in the trace condition, suggesting that executive functions were required. The prediction conditions of the PL pattern task continued while maintaining the goal-directed behavior. Therefore, it is possible that proactive control had an effect. Kotegawa et al. [10] demonstrated that image intensity influences right PFC activity in a study that compared imaginary walking with an actual walking exercise, suggesting that the PFC is involved in this imagery. In the prediction condition of the PL pattern task, the participants were required to imagine the next figure to be drawn. The prediction condition of the PL pattern task might have enhanced the activity of the right PFC, as it involves imagining the following figure before execution. In addition, studies using the Stroop task have demonstrated that the right PFC is associated with inhibitory control [11,13]. As the PL pattern task consisted of two sequences with different shapes, it is possible that, in the PL pattern task, attention was focused on different patterns while suppressing the repetition of the same pattern. These findings suggest that imaging and inhibitory control may be involved in the continuation of drawing, recruiting the right PFC.
Left PFC activity was lower than right PFC activity in the prediction condition of the PL pattern task. The left PFC is known to be associated with linguistic factors [7]. The lower activity in the left PFC was thought to be attributed to the use of a task that excluded language elements. Middle PFC activity was significantly higher in the prediction condition than in the trace condition of the PL pattern task. The middle PFC has been suggested to be associated with executive function switching [15]. In the PL pattern task of this study, the drawn figure and the next figure were different symbols. The reason for the difference in middle PFC activity between the conditions is that the activity of the middle PFC was higher under the prediction condition than under the trace condition because the drawing process continued while consciously switching symbols to be drawn under the prediction condition. We clarified the activity of the PFC when drawing sequences of signs without phonemes. As words are sequences of different symbols, our study may resemble PFC activity in writing that is not influenced by phonology.
In this study, right PFC activity increased when drawing complex patterns based on prediction, suggesting that high right PFC activity is associated with the planning component of the EFQ. We believe that the planning dimension of executive function is necessary when drawing different symbols consecutively, such as letters, and that the right PFC is a specific brain region related to planning. In this study, adult drawing activity, prefrontal activity, and executive function were examined. Using a PL pattern task without phonemes, the activity of the right PFC was found to increase, suggesting that inhibitory function and imagery may be necessary for drawing. Furthermore, the middle PFC activity in the trace and prediction conditions may reflect switching of executive function. To the best of our knowledge, this was the first study focusing on continuous drawing. In the future, we would like to conduct research on typically developing children and children who find it difficult to write and examine the factors that make drawing difficult.
A limitation of our study is the inability to consider the functional connectivity of brain activity. It has been clarified that various brain regions other than the PFC are involved in controlling writing [7]. As this study focused on brain activity using fNIRS, it was not possible to examine the functional connectivity of the brain, unlike in studies using magnetic resonance imaging. Additionally, we recognize that the relevance to executive function was limited to and primarily focused on its association with the questionnaire. In the future, we would like to examine the relationship between behavioral indicators and executive function and gain a deeper understanding of the underlying connections and implications for executive function in the context of our findings. However, we believe that it is very significant that we could record PFC activity during drawing and that a relationship with executive function was suggested.

5. Conclusions

This study investigated the relationship between drawing and brain activity. In the PL pattern task, the lines drawn under the prediction condition were significantly shorter; however, right PFC activity was increased. A significant difference was noted only in the score of the planning subscale of the EFQ. The PL pattern task required inhibitory control to prevent the repetition of the same figure. Furthermore, the prediction condition required drawing, whereas predictions were based on the memory of the hint. Thus, the executive function’s planning aspect may require inhibitory control and the involvement of the PFC. Therefore, it is suggested that drawing is associated with the planning ability involved in executive function, and planning ability is suggested to be associated with the right PFC.

Author Contributions

Conceptualization, A.M. and A.Y.; methodology, A.M. and A.Y.; software, J.S.; validation, J.S. and A.Y.; formal analysis, Y.U.; investigation, A.M.; resources, A.M.; data curation, A.M.; writing—original draft preparation, A.M. and A.Y.; writing—review and editing, A.M. and A.Y.; visualization, A.M. and J.S.; supervision, A.Y. and J.S.; project administration, A.Y. All authors have read and agreed to the published version of the manuscript.

Funding

This work was supported by JSPS KAKENHI Grant Numbers JP21H00891, JP23K17293, JP20K11892, JP22J12714, and JP23KJ2124.

Institutional Review Board Statement

All procedures followed were according to the ethical standards of the responsible committee on human experimentation (institutional and national) and with the Helsinki Declaration of 1964 and later versions. The study protocol was approved by the Ethics Review Committee (reception number: 45).

Informed Consent Statement

Written consent was obtained from the participants before measurement.

Data Availability Statement

The datasets generated and analyzed during the current study can be made available from the corresponding author upon reasonable request.

Conflicts of Interest

The authors declare no conflict of interest.

References

  1. Feder, K.P.; Majnemer, A. Handwriting development, competency, and intervention. Dev. Med. Child Neurol. 2007, 49, 312–317. [Google Scholar] [CrossRef] [PubMed]
  2. Yang, Y.; Tam, F.; Graham, S.J.; Sun, G.; Li, J.; Gu, C.; Tao, R.; Wang, N.; Bi, H.Y.; Zuo, Z. Men and women differ in the neural basis of handwriting. Hum. Brain Mapp. 2020, 41, 2642–2655. [Google Scholar] [CrossRef] [PubMed]
  3. Santangelo, T.; Graham, S. A comprehensive meta-analysis of handwriting instruction. Educ. Psychol. Rev. 2016, 28, 225–265. [Google Scholar] [CrossRef]
  4. Cartmill, L.; Rodger, S.; Ziviani, J. Handwriting of eight-year-old children with autistic spectrum disorder: An exploration. J. Occup. Ther. Sch. Early Int. 2009, 2, 103–118. [Google Scholar] [CrossRef]
  5. Amunts, J.; Camilleri, J.A.; Eickhoff, S.B.; Patil, K.R.; Heim, S.; von Polier, G.G.; Weis, S. Comprehensive verbal fluency features predict executive function performance. Sci. Rep. 2021, 11, 6929. [Google Scholar] [CrossRef]
  6. Jurado, M.B.; Rosselli, M. The elusive nature of executive functions: A review of our current understanding. Neuropsychol. Rev. 2007, 17, 213–233. [Google Scholar] [CrossRef]
  7. Planton, S.; Jucla, M.; Roux, F.E.; Démonet, J.F. The “handwriting brain”: A meta-analysis of neuroimaging studies of motor versus orthographic processes. Cortex 2013, 49, 2772–2787. [Google Scholar] [CrossRef]
  8. Miyake, A.; Friedman, N.P.; Emerson, M.J.; Witzki, A.H.; Howerter, A.; Wager, T.D. The unity and diversity of executive functions and their contributions to complex “Frontal Lobe” tasks: A latent variable analysis. Cognit. Psychol. 2000, 41, 49–100. [Google Scholar] [CrossRef]
  9. Anderson, P. Assessment and development of executive function (EF) during childhood. Child Neuropsychol. 2002, 8, 71–82. [Google Scholar] [CrossRef]
  10. Kotegawa, K.; Yasumura, A.; Teramoto, W. Activity in the prefrontal cortex during motor imagery of precision gait: An fNIRS study. Exp. Brain Res. 2020, 238, 221–228. [Google Scholar] [CrossRef]
  11. Yasumura, A.; Omori, M.; Fukuda, A.; Takahashi, J.; Yasumura, Y.; Nakagawa, E.; Koike, T.; Yamashita, Y.; Miyajima, T.; Koeda, T.; et al. Age-related differences in frontal lobe function in children with ADHD. Brain Dev. 2019, 41, 577–586. [Google Scholar] [CrossRef]
  12. Tsujimoto, S.; Genovesio, A.; Wise, S.P. Frontal pole cortex: Encoding ends at the end of the endbrain. Trends Cognit. Sci. 2011, 15, 169–176. [Google Scholar] [CrossRef] [PubMed]
  13. Yasumura, A.; Inagaki, M.; Hiraki, K. Relationship between neural activity and executive function: An NIRS study. ISRN Neurosci. 2014, 2014, 734952. [Google Scholar] [CrossRef] [PubMed]
  14. Yasumura, A.; Kokubo, N.; Yamamoto, H.; Yasumura, Y.; Nakagawa, E.; Kaga, M.; Hiraki, K.; Inagaki, M. Neurobehavioral and hemodynamic evaluation of Stroop and reverse Stroop interference in children with attention-deficit/hyperactivity disorder. Brain Dev. 2014, 36, 97–106. [Google Scholar] [CrossRef]
  15. Roelofs, K.; Bramson, B.; Toni, I. A neurocognitive theory of flexible emotion control: The role of the lateral frontal pole in emotion regulation. Ann. N. Y. Acad. Sci. 2023, 1525, 28–40. [Google Scholar] [CrossRef]
  16. Bonzano, L.; Bisio, A.; Pedullà, L.; Brichetto, G.; Bove, M. Right inferior parietal lobule activity is associated with handwriting spontaneous tempo. Front. Neurosci. 2021, 15, 656856. [Google Scholar] [CrossRef] [PubMed]
  17. Dui, L.G.; Lunardini, F.; Termine, C.; Matteucci, M.; Stucchi, N.A.; Borghese, N.A.; and Ferrante, S. A tablet app for handwriting skill screening at the preliteracy stage: Instrument validation study. JMIR Serious Games 2020, 8, e20126. [Google Scholar] [CrossRef] [PubMed]
  18. Nomm, S.; Toomela, A.; Kozhenkina, J.; Toomsoo, T. Quantitative analysis in the digital Luria’s alternating series tests. In Proceedings of the 14th International Conference on Control, Automation, Robotics and Vision (ICARCV), Phuket, Thailand, 13–15 November 2016. [Google Scholar]
  19. Rosenblum, S.; Ben-Simhon, H.A.; Meyer, S.; Gal, E. Predictors of handwriting performance among children with autism spectrum disorder. Res. Autism Spectr. Disord. 2019, 60, 16–24. [Google Scholar] [CrossRef]
  20. Luria, A.R. Higher Cortical Functions in Man; Springer Science & Business Media: New York, NY, USA, 1973; pp. 191–203. [Google Scholar]
  21. Tsuboi, A.; Muraki, S.; Iwasaki, S.; Yamane, S. Methodology and reliability of a simple-to-use upper extremity functional test: Ibaraki Prefectural University Finger Dexterity Test. J. Jpn. Phys. Ther. Assoc. 2009, 28, 80–90. (In Japanese) [Google Scholar]
  22. Shin, J.; Okuyama, T. Detection of alcohol intoxication via online handwritten signature verification. Pattern Recognit. Lett. 2014, 35, 101–104. [Google Scholar] [CrossRef]
  23. Kita, Y.; Gunji, A.; Inoue, Y.; Goto, T.; Sakihara, K.; Kaga, M.; Inagaki, M.; Hosokawa, T. Self-face recognition in children with autism spectrum disorders: A near-infrared spectroscopy study. Brain Dev. 2011, 33, 494–503. [Google Scholar] [CrossRef]
  24. Yano, K.; Shin, J.; Yasumura, A. Brain activity in the prefrontal cortex during cancelation tasks: Effects of the stimulus array. Behav. Brain Res. 2022, 422, 113744. [Google Scholar] [CrossRef] [PubMed]
  25. Chance, B.; Zhuang, Z.; UnAh, C.; Alter, C.; Lipton, L. Cognition-activated low-frequency modulation of light absorption in human brain. Proc. Natl. Acad. Sci. USA 1993, 90, 3770–3774. [Google Scholar] [CrossRef] [PubMed]
  26. Kocsis, L.; Herman, P.; Eke, A. The modified Beer-Lambert law revisited. Phys. Med. Biol. 2006, 51, N91–N98. [Google Scholar] [CrossRef] [PubMed]
  27. Cui, X.; Bray, S.; Reiss, A.L. Functional near infrared spectroscopy (NIRS) signal improvement based on negative correlation between oxygenated and deoxygenated hemoglobin dynamics. Neuroimage 2010, 49, 3039–3046. [Google Scholar] [CrossRef]
  28. Matsuda, G.; Hiraki, K. Sustained decrease in oxygenated hemoglobin during video games in the dorsal prefrontal cortex: A NIRS study of children. Neuroimage 2006, 29, 706–711. [Google Scholar] [CrossRef] [PubMed]
  29. Moriguchi, Y.; Hiraki, K. Neural origin of cognitive shifting in young children. Proc. Natl. Acad. Sci. USA 2009, 106, 6017–6021. [Google Scholar] [CrossRef]
  30. Shimada, S.; Hiraki, K. Infant’s brain responses to live and televised action. Neuroimage 2006, 32, 930–939. [Google Scholar] [CrossRef]
  31. Sekiguchi, R.; Yamada, N. Development of the executive functions questionnaire. Human science, the graduate course of Kansai University. Department. Bullet. Paper 2017, 8, 31–48. [Google Scholar]
  32. Ryan, T.A. Significance tests for multiple comparison of proportions, variances, and other statistics. Psychol Bull. 1960, 57, 318–328. [Google Scholar] [CrossRef]
  33. Dale, G.; Joessel, A.; Bavelier, D.; Green, C.S. A new look at the cognitive neuroscience of video game play. Ann. N. Y. Acad. Sci. 2020, 1464, 192–203. [Google Scholar] [CrossRef] [PubMed]
  34. Banich, M.T. Executive function: The search for an integrated account. Curr. Dir. Psychol. Sci. 2009, 18, 89–94. [Google Scholar] [CrossRef]
  35. Stuss, D.T. Functions of the frontal lobes: Relation to executive functions. J. Int. Neuropsychol. Soc. 2011, 17, 759–765. [Google Scholar] [CrossRef] [PubMed]
  36. Braver, T.S. The variable nature of cognitive control: A dual mechanisms framework. Trends Cognit. Sci. 2012, 16, 106–113. [Google Scholar] [CrossRef]
  37. Menon, V.; D’Esposito, M. The role of PFC networks in cognitive control and executive function. Neuropsychopharmacology 2022, 47, 90–103. [Google Scholar] [CrossRef] [PubMed]
Figure 1. Illustration of the two conditions and study procedure. The upper left panel corresponds to the trace condition of the zig-zag line task, and the upper right panel corresponds to the prediction condition of the zig-zag line task. The bottom left panel corresponds to the trace condition of the PL pattern task, and the bottom right panel corresponds to the prediction condition of the PL pattern task. Participants performed two tasks under both conditions. The order of performing the zig-zag line task and the PL pattern task was counterbalanced. Participants started with the trace condition to eliminate practice effects and memory effects. PL, periodic line.
Psych 05 00059 g001
Figure 2. Locations of the emitters, detectors, and channels. The cortical responses were obtained from 16 channels. The center of the head probe matrix was placed on Fpz (midpoint between Fp1 and Fp2) according to the international 10–10 system used in electroencephalography.
Psych 05 00059 g002
Figure 3. Average length of lines drawn on the pen tablet in different conditions. Error bars indicate standard errors, and the asterisk indicates significant differences (*** p < 0.001). Under the prediction condition, the line drawn in the PL pattern task was significantly shorter than those drawn in the trace condition of the PL pattern tasks and the prediction condition of the zig-zag pattern task. PL, periodic line.
Psych 05 00059 g003
Figure 4. The fNIRS waveforms of the right (R), middle (M), and left (L) PFC during the trace and prediction conditions. (a): Trace condition of the zig-zag line task. (b): Prediction condition of the zig-zag line task. (c): Trace condition of the PL pattern task. (d): Prediction condition of the PL pattern task. The oxy-Hb value of the right PFC increased under the prediction condition of the PL pattern task. fNIRS, functional near-infrared spectroscopy; PFC, prefrontal cortex; PL, periodic line; oxy-Hb, oxygenated hemoglobin.
Psych 05 00059 g004
Figure 5. The mean oxygenated hemoglobin values in the right, middle, and left PFC during the trace and prediction conditions (results of the three-way analysis of variance in task × condition × brain function). Error bars indicate the standard error. The asterisk indicates significant differences (* p < 0.05; *** p < 0.001). The activity of the right PFC was significantly higher during the prediction condition of the PL pattern task. PFC, prefrontal cortex; PL, periodic line.
Psych 05 00059 g005
Disclaimer/Publisher’s Note: The statements, opinions and data contained in all publications are solely those of the individual author(s) and contributor(s) and not of MDPI and/or the editor(s). MDPI and/or the editor(s) disclaim responsibility for any injury to people or property resulting from any ideas, methods, instructions or products referred to in the content.

