Next Article in Journal
Learning Engagement as a Moderator between Self-Efficacy, Math Anxiety, Problem-Solving Strategy, and Vector Problem-Solving Performance
Next Article in Special Issue
Scale Type Revisited: Some Misconceptions, Misinterpretations, and Recommendations
Previous Article in Journal
Emerging Nurse Manager’s Resilience and Their Empowering Behavior during COVID-19
Previous Article in Special Issue
Examining and Improving the Gender and Language DIF in the VERA 8 Tests
 
 
Please note that, as of 22 March 2024, Psych has been renamed to Psychology International and is now published here.
Article

A Failed Cross-Validation Study on the Relationship between LIWC Linguistic Indicators and Personality: Exemplifying the Lack of Generalizability of Exploratory Studies

by
José Ángel Martínez-Huertas
1,*,
José David Moreno
2,
Ricardo Olmos
3,
Alejandro Martínez-Mingo
3 and
Guillermo Jorge-Botana
4
1
Department of Methodology of Behavioral Sciences, Faculty of Psychology, Universidad Nacional de Educación a Distancia (UNED), 28040 Madrid, Spain
2
Department of Basic Psychology, Faculty of Psychology, Universidad Autónoma de Madrid (UAM), Calle Iván Pavlov, 6, Ciudad Universitaria de Cantoblanco, 28049 Madrid, Spain
3
Department of Social Psychology and Methodology, Faculty of Psychology, Universidad Autónoma de Madrid (UAM), Calle Iván Pavlov, 6, Ciudad Universitaria de Cantoblanco, 28049 Madrid, Spain
4
Department of Psychobiology and Methodology of Behavioral Sciences, Faculty of Psychology, Universidad Complutense de Madrid (UCM), Avda. de Séneca, 2, Ciudad Universitaria, 28040 Madrid, Spain
*
Author to whom correspondence should be addressed.
Psych 2022, 4(4), 803-815; https://doi.org/10.3390/psych4040059
Submission received: 5 September 2022 / Revised: 5 October 2022 / Accepted: 6 October 2022 / Published: 13 October 2022
(This article belongs to the Special Issue Feature Papers in Psychometrics and Educational Measurement)

Abstract

:
(1) Background: Previous meta-analytic research found small to moderate relationships between the Big Five personality traits and different linguistic computational indicators. However, previous studies included multiple linguistic indicators to predict personality from an exploratory framework. The aim of this study was to conduct a cross-validation study analyzing the relationships between language indicators and personality traits to test the generalizability of previous results; (2) Methods: 643 Spanish undergraduate students were tasked to write a self-description in 500 words (which was evaluated with the LIWC) and to answer a standardized Big Five questionnaire. Two different analytical approaches using multiple linear regression were followed: first, using the complete data and, second, by conducting different cross-validation studies; (3) Results: The results showed medium effect sizes in the first analytical approach. On the contrary, it was found that language and personality relationships were not generalizable in the cross-validation studies; (4) Conclusions: We concluded that moderate effect sizes could be obtained when the language and personality relationships were analyzed in single samples, but it was not possible to generalize the model estimates to other samples. Thus, previous exploratory results found on this line of research appear to be incompatible with a nomothetic approach.

1. Introduction

An emerging field of research in the psychology of language points towards the idea that there are personality characteristics that can be reflected in the language that people use. Improvements in statistical models and computational methods for language data are generating new opportunities to study this relationship between personality traits and linguistic computational indicators [1]. From this paradigm, language data is supposed to capture lower-level personality processes that are closely related to behavioral outcomes associated with personality traits. Any pattern in language (combination of cues) could be useful to infer personality (e.g., subject pronouns, vocabulary expansions, adjectives, topics, causative markers, sensorimotor terms, etc.). For this reason, there is a need for a hard formalization of utterances in term of their cues and optionally even powerful statistical methods to merge them in a predictive model. Computational models of language can be helpful for these purposes, and these language-based measures of personality processes have proved to show reliable properties and relevant links with different personality traits (e.g., [2,3,4]). Previous empirical studies and theoretical reviews show that the line of research focused on the study of the relationship between personality traits and linguistic computational indicators is very promising, see for example: [1,2,3,5,6,7,8,9]. From this mindset, evaluators generally use different types of computational linguistic models that have been trained with specific corpora to automatically assess written or transcript oral language. In the case of the Big Five personality traits (i.e., openness, conscientiousness, extraversion, agreeableness, and neuroticism; [10]), a recent metanalysis showed significant small to moderate combined estimates of correlations between computational indicators of language and the personality traits [7]. This previous result meant that the relationships between the Big Five personality traits and different linguistic computational indicators were small to moderate in recent publications. A major problem of much previous research is that, while researchers agree that good theories are necessary to develop psychological science, many empirical studies are published without a strong theoretical background (here, “exploratory” studies). For example, many papers consist of the prediction of one or more dependent variables by means of multiple covariates or independent variables without a strong hypothesis supporting the inclusion of the predictors in the model. Similarly, the problem with much previous research evaluating language and personality relationships is that they are “exploratory” studies, that is, they just included multiple indicators of language from an exploratory framework. In this respect, it is widely known that there are substantive problems in terms of replicability, robustness, and reproducibility in psychological science (e.g., [11,12]). Even when there is a recent metanalysis presenting medium to moderate effect sizes in this line of research [7], previous results could have been biased because, generally, they used an exploratory framework. For that reason, we advocate for the use of cross-validation techniques to gain evidence of the robustness (and later reproducibility) of the results of those empirical studies analyzing the relationship between linguistic indicators and personality that are “exploratory” (note that the term “exploratory” is used to define those empirical studies using multiple covariates or independent variables without a strong hypothesis supporting the inclusion of the predictors in the model. The same would apply to those statistical models that are predicting variables and are “exploratory” in their nature (note that this excludes, for example, other forms of exploratory models such exploratory factor analysis) in their nature.
In this study, we used the Linguistic Inquiry and Word Count (LIWC, e.g., [13,14]), which is a popular and well-known linguistic tool that has been used to study multiple psychological phenomena. In fact, it was one of the most popular tools in the primary studies of the previously mentioned metanalysis [7]. Thus, there is enough empirical evidence in the literature showing the links between personality traits and the LIWC indicators, supporting LIWC as a reliable tool to study language-based personality and psychological phenomena (see, for example, [15,16,17,18,19,20,21]). Following Tausczik and Pennebaker [22], measuring personality in participants through writing samples and spoken dialogue show that select LIWC categories correspond with Big Five personality traits. To take some examples, for both males and females, higher word counts and fewer large words predict extraversion [23]; LIWC categories showing complexity of language (e.g., articles, exclusive words, causal words, and negations) are less frequent in the writing of people who score high on extraversion [24]; people who score high on extraversion use more social words and are more positive and less negative in terms of emotion [24]. This evidence is related to traditional personality models, as, for example, models for extraversion would predict that extraverted people engage in more social interaction and also have a more positive response to that engagement. In addition, extraverted people would be less inhibited in their language production, leading also to a less complex language [22]. However, despite the empirical evidence, these descriptive tools, such as the LIWC, should not be interpreted using a nomothetic perspective if exploratory studies are conducted due to potential problems including replicability, robustness, and reproducibility. That is, researchers should use these linguistic indicators using an idiographic instead of a nomothetic approach in exploratory studies. To illustrate this, we used the indicators of the LIWC to predict the scores of the Big Five questionnaire in a sample of students that wrote a self-description in, approximately, 500 words. As it has been done in many previous studies, we used the indicators of the LIWC as predictors of personality traits from an exploratory approach, that is, we included all the LIWC indicators in the predictive models. Linear regression models were used to increase the interpretability of the results of this paper (please note that, while linear regression models are also considered predictive models, they are simpler than, for example, neural network models, e.g., [25], which could be overparametrized and show overfit in some scenarios).
In order to illustrate the relevance of cross-validation procedures in this specific line of research, we conducted two analytical approaches using the LIWC indicators as predictors and the Big Five questionnaire scores as dependent variables. Firstly, we analyzed the complete data set as researchers would traditionally do. In this set of results, we showed some examples of the findings that researchers would naturally obtain in this data set. Secondly, we conducted different cross-validation studies where the complete data set was randomly split in multiple training and validation data sets. This aimed to test if results were robust and generalizable to different subsamples of the same data set. Then, the objective of this cross-validation study was threefold: (1) to study the association that can be observed in different samples when the model is estimated in the same data, (2) to study the generalizability of the associations found between the LIWC indicators and the personality traits to other samples, and (3) to illustrate if the LIWC indicators were consistently selected as relevant predictors in different random subsamples and if their standardized effects are robust. Please note that the present study was conducted to analyze the relationship between LIWC indicators and personality in the Spanish language, but the general conclusions and recommendations about the use of cross-validation techniques should be independent of the idiosyncrasies of the study.

2. Materials and Methods

2.1. Participants

A total of 643 undergraduate students (their average age was 19.50 years, SD = 2.22; min = 18; max = 37; 13% males) volunteered and received extra course credits for their participation in the study. All these participants were studying a Psychology degree in Spain (33.60% were in the first year of the degree, 32.80% in the second year, 19.80% in the third year, and 13.80% in the fourth year). They had a high and fluent level of Spanish.

2.2. Instruments

Participants were tasked to write a self-description in, approximately, 500 words. They received the following instructions: “Write a profile of approximately 500 words for a new social network. Develop freely and in your own words the most precise and detailed definition about yourself. The more elaborate the writing, the more informative it will be for the people who read your profile. You can talk about your interests and motivations, the things you usually do throughout the week, or the activities in which you usually spend your free time”. The mean length of the answers was 363.37 words (SD = 153.03).
The Spanish version of the Big Five questionnaire [26] was used to evaluate personality traits. Appropriate reliability was found for the personality traits: openness (O; Cronbach’s α = 0.79; McDonald’s ω = 0.83), conscientiousness (C; α = 0.86; ω = 0.89), extraversion (E; α = 0.75; ω = 0.79), agreeableness (A; α = 0.82; ω = 0.85), and neuroticism (N; α = 0.90; ω = 0.92). The average score was computed for each of the personality traits.
The Spanish version of the LIWC (LIWC2015; [14]) was used to evaluate multiple linguistic indicators from the self-descriptions of the participants. An exhaustive description of the LIWC indicators can be found in its manual [13,14].

2.3. Procedure

Once all the participants were evaluated, three different data analysis strategies were followed. In both procedures, we used multiple linear regression models, where the personality traits were used as dependent variables and the LIWC variables were used as covariates or predictors. Concretely, all the LIWC indicators of the self-descriptions were introduced in each linear regression model for each personality trait, and then a linear equation was estimated to predict the personality traits. All the statistical analyses were performed using R software [27]. The multiple linear regression models were fitted using the R’s lm function, and stepwise model selection was conducted using the R’s stepAIC function of the MASS package [28], which is a standard procedure in empirical studies (e.g., [29]). In the first analytical approach, we fitted the model in the complete sample, which represents the substantive conclusions that might be reported in an empirical study without cross-validation. In the second analytical approach, we conducted a cross-validation study (hold-out method) by generating 1000 random samples of the complete data set (70% for training and 30% for validation in each random split). In this latter analysis, we evaluated the mean general performance (R/R2 measures) of the model in both the training and the validation data sets, the proportion of random samples where a representative LIWC measure (Word Count) was present, and the mean standardized estimated effect of that predictor. In the third analytical approach, an additional cross-validation study was conducted using the k-fold method with “lmStepAIC” from R’s caret package [30]. This was done to analyze if reducing the overfitting of the models to the training data set could improve their performance in the validation data sets. To do so, we generated 1000 random samples of the complete data set (70% for training and 30% for validation in each random split), but the training sets were also divided into k = 5 folds (number of resampling iterations) where a final model was obtained by weighting the model results in different training data subsets (reducing the dependency on a specific training data set). Please note that the models that were evaluated in the validation data sets were the result of the backwards stepwise selection in each of the training data sets in both cross-validation studies. Supplementary Materials present additional analyses that were carried out using only the women, as gender/sex was found to be a relevant variable in previous research (e.g., [7,31]).

3. Results

3.1. Analyzing the Complete Data Set

Table 1 presents the results of the performance of the multiple linear regression models using the complete data set. All the effect sizes were found to be relevant and larger than the one that could be expected according to the results of a recent metanalytic study [7], although they are in accordance with such previous results. Specifically, it is worth mentioning that neuroticism was the personality trait with a weaker relationship with the LIWC language indicators, while the other four personality traits showed similar relationships using the same language indicators.
Table 2 presents the covariates/predictors that were found to be relevant in the final multiple linear regression model resulting from the backward stepwise selection. These are the LIWC variables that presented larger relationships with each personality trait. For example, Word Count (the number of words of the participants’ self-description) presented a positive relationship with consciousness, agreeableness, and neuroticism. This would mean that people with larger scores in consciousness, agreeableness, and neuroticism tended to write larger answers. Of course, one researcher might ad hoc hypothesize that conscious people could tend to write larger answers due to their commitment to the task, that agreeable people could tend to do it for social desirability, and that neurotic people could write larger answers due to worrying about finishing the task adequately. On the contrary, such a researcher might not have the expectation of finding a relationship between the length of the answers and the openness and extraversion personality traits (note that this was just an illustration of plausible conclusions from this set of results regarding the LIWC variable Word Count). The results of an exploratory model might generate a lot of expectations and ad hoc explanations for researchers aiming to explain these model estimations. However, the robustness of these results should be tested to gather information about their potential replicability to other samples. Thus, further evidence from cross-validation techniques is needed to trust the conclusions of these exploratory models, as the results of the following sections of this paper demonstrate.

3.2. First Cross-Validation Study (Hold-Out Method)

To illustrate the relevance of cross-validation procedures in this line of research, we randomly split the sample in different training and validation data sets (70% of the original data set for training and 30% for validation in each random split) a total of 1000 times. This was done to see if previous results were robust and generalizable to different subsamples of the same data. Backwards stepwise selection was used in each of the estimated models of this section. In the first subsection, we analyzed the mean performance (R/R2) of the multiple linear regression models in the training data sets, that is, in those data sets where the models were fitted. This was done to study the association that can be observed in different samples when the model is estimated in the same data. In the second subsection, we analyzed the mean performance (R/R2) of the multiple linear regression models in the validation data sets, that is, in data sets where the models were not fitted. This was done to analyze the generalizability of the associations found between the LIWC indicators and the personality traits to other samples. In the third subsection, we analyzed the selection and mean standardized effect of a specific LIWC variable (Word Count) in the training data sets. This was done to illustrate if the LIWC variables are consistently selected as relevant predictors in different random subsamples and if their standardized effects are robust.

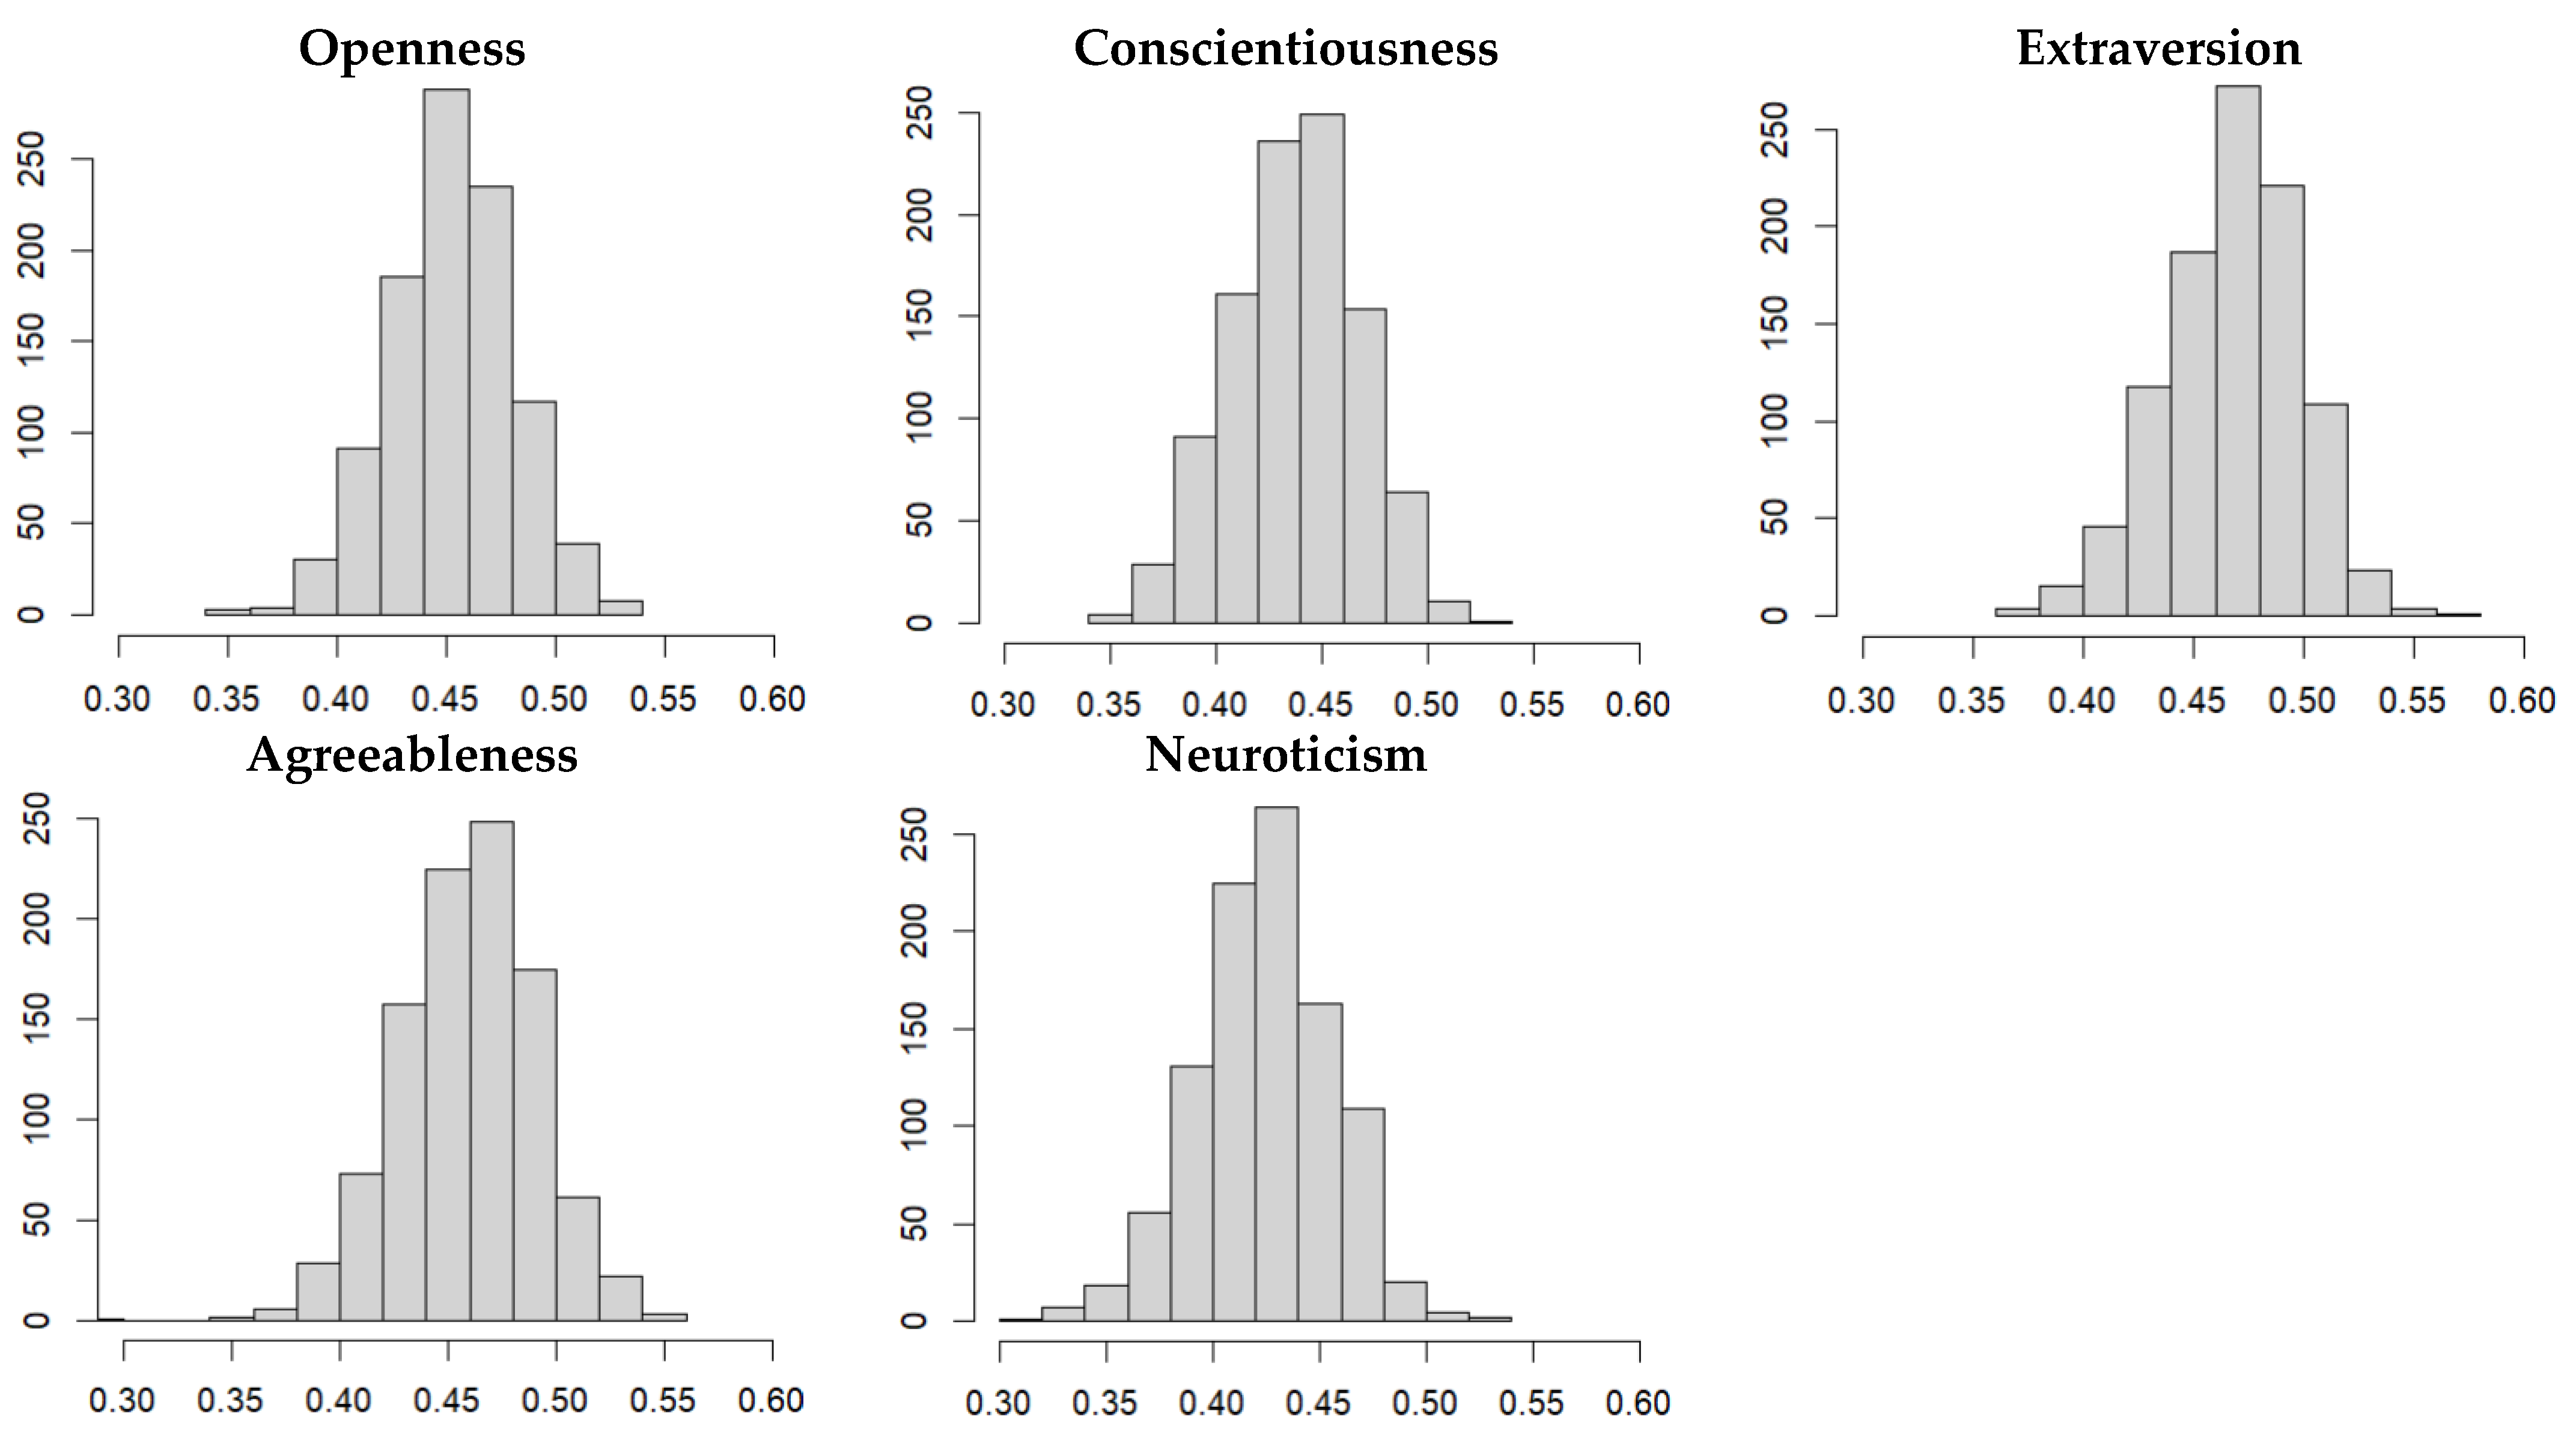
3.2.1. Distribution of Model Performances in the Training Data Sets

The mean performance (R/R2) of the multiple linear regression models was moderate and robust (that is, the distributions of model performances had small standard deviations). Given that both R and R2 measures are equivalent, we present here the results of the former measure to make them more comparable with previous results. A mean R measure of 0.45 (SD = 0.03, Mdn = 0.45, Min = 0.35, Max = 0.53) was found for openness, an R = 0.44 (SD = 0.03, Mdn = 0.44, Min = 0.35, Max = 0.52) for conscientiousness, an R = 0.47 (SD = 0.03, Mdn = 0.47, Min = 0.36, Max = 0.58) for extraversion, an R = 0.46 (SD = 0.03, Mdn = 0.46, Min = 0.30, Max = 0.54) for agreeableness, and an R = 0.42 (SD = 0.03, Mdn = 0.42, Min = 0.30, Max = 0.53) for neuroticism. Figure 1 presents the distribution of the performances of the multiple linear regression models (R measures) in the training data sets.

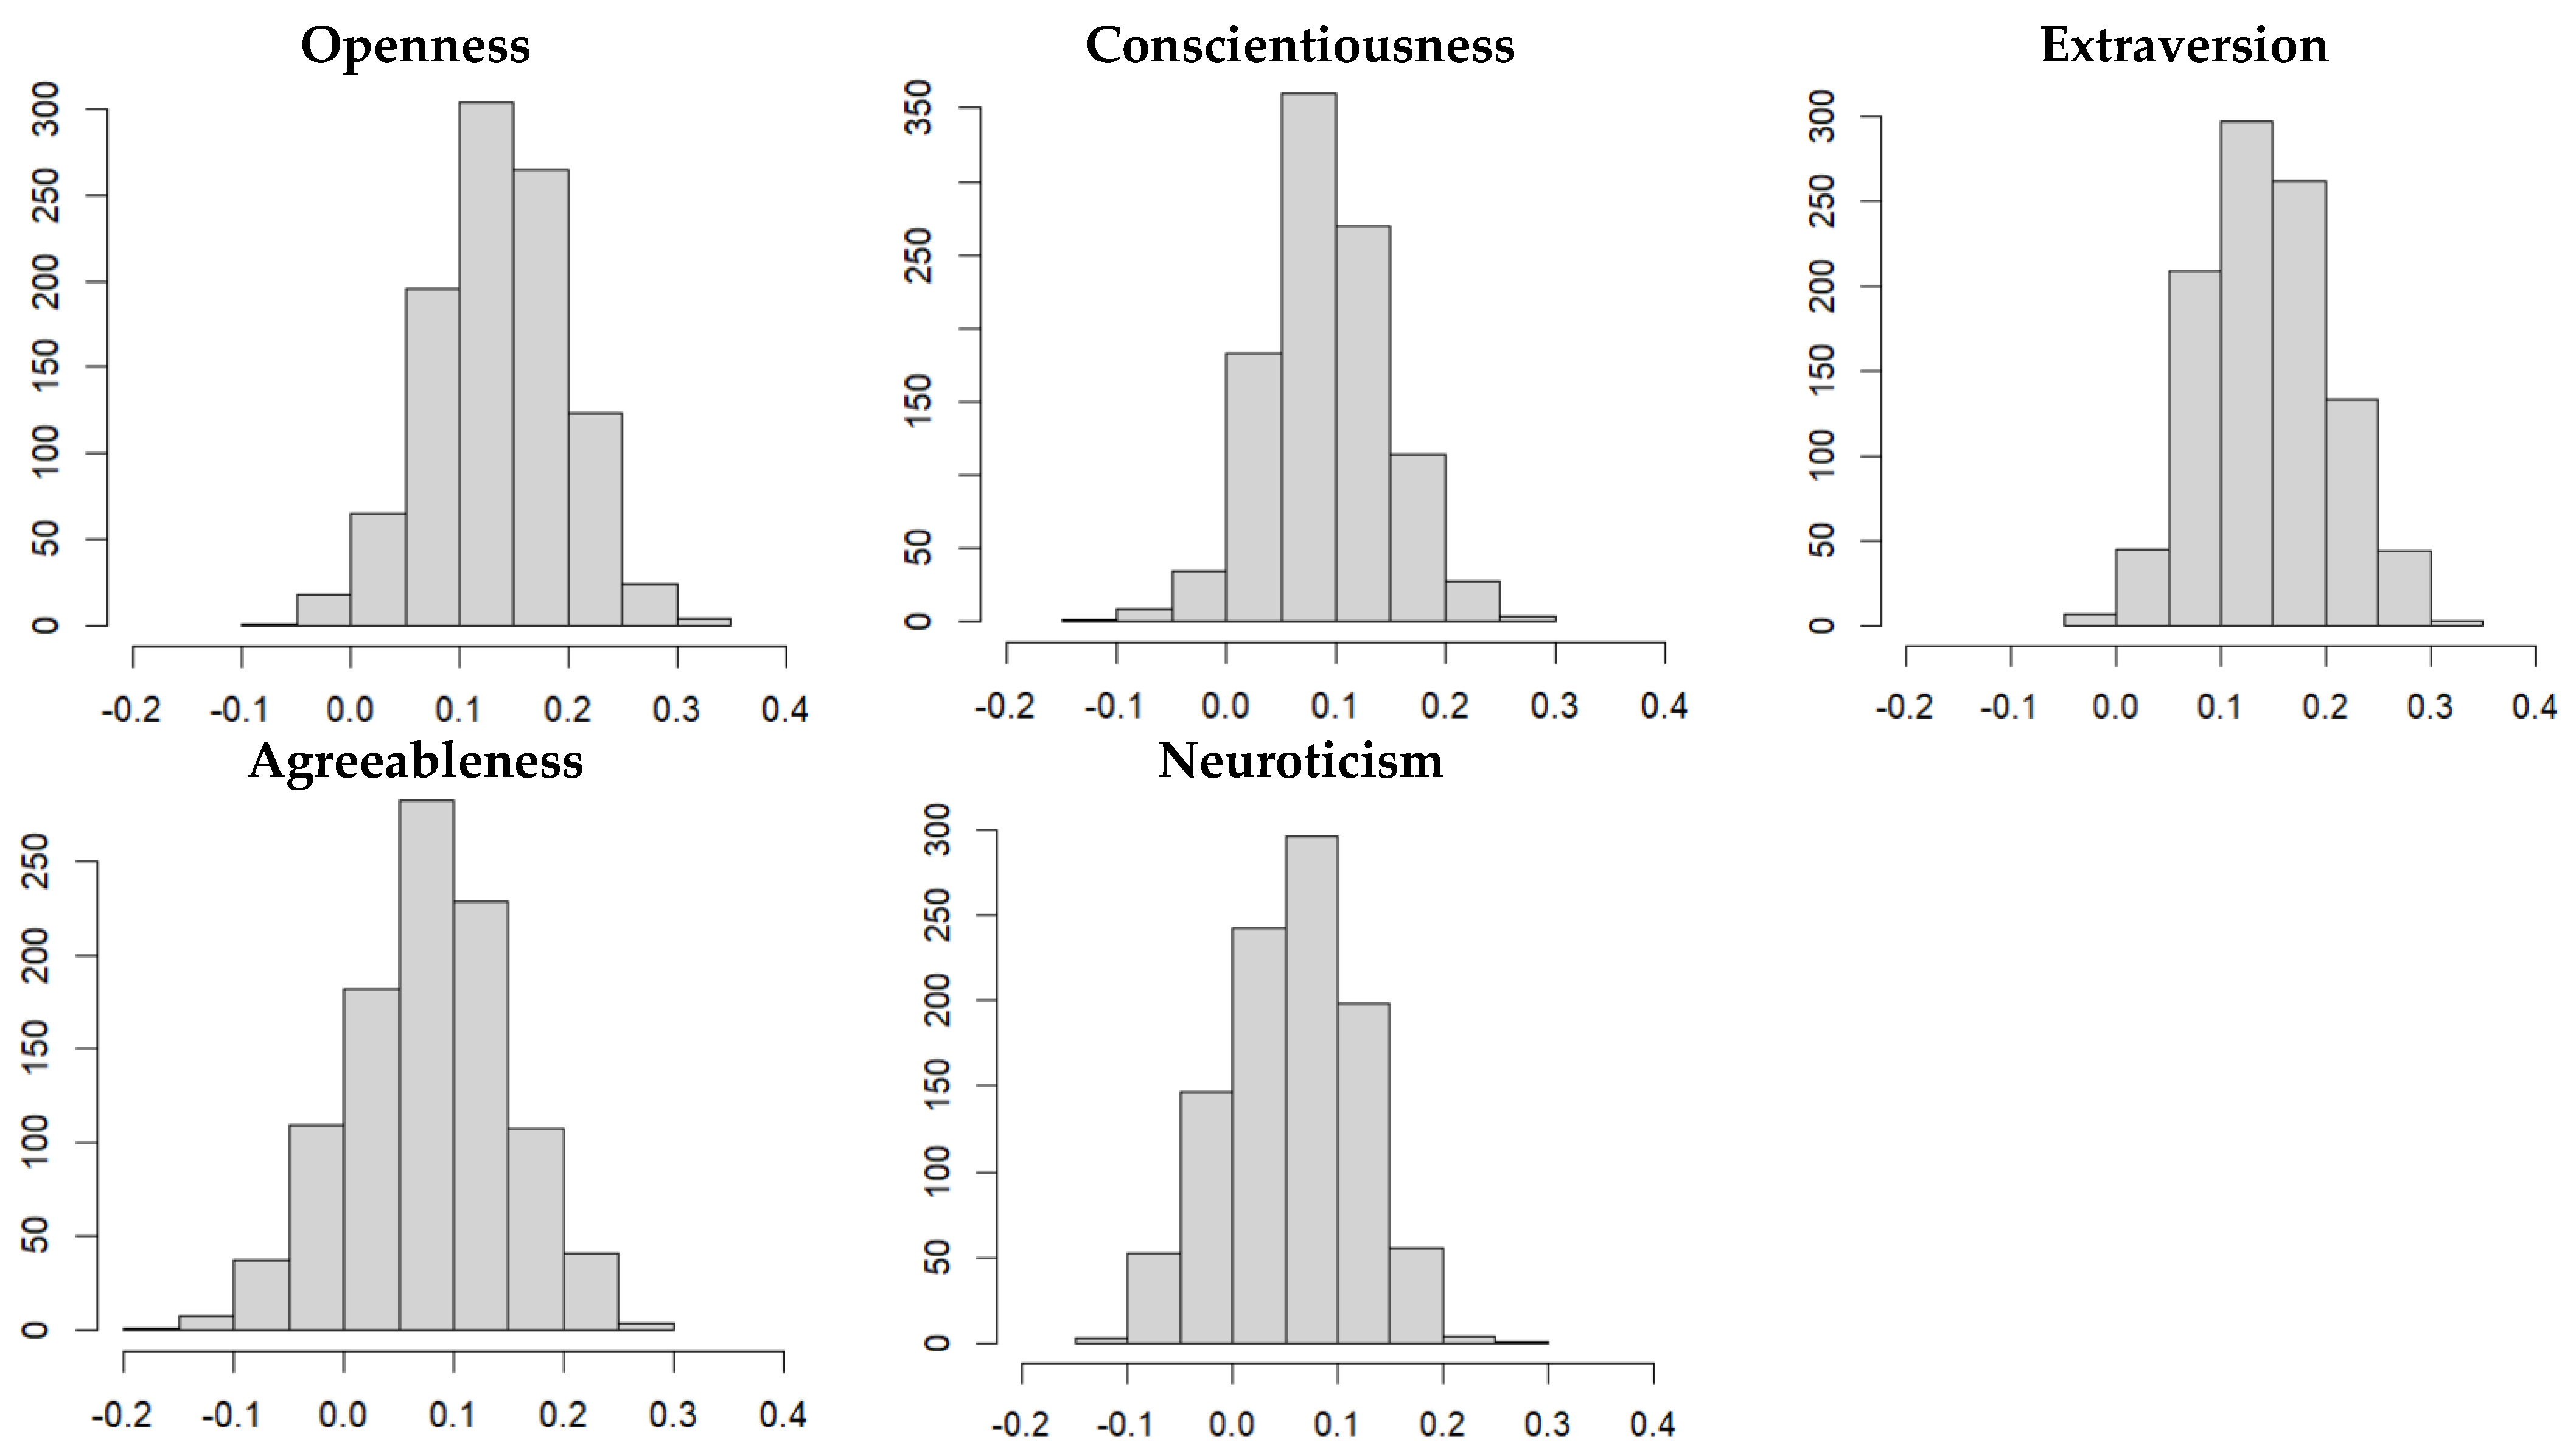
3.2.2. Distribution of Model Performances in the Validation Data Sets

Compared to previous results, the performance of the model in the validation data sets was low, presenting larger variability than the model performance in the training data sets due to the smaller size of the validation data sets. Again, we present here the results of the R measures to make them more comparable with previous results. A mean R measure of 0.14 (SD = 0.06, Mdn = 0.14, Min = −0.08, Max = 0.33) was found for openness, an R = 0.09 (SD = 0.06, Mdn = 0.09, Min = −0.12, Max = 0.26) for conscientiousness, an R = 0.14 (SD = 0.06, Mdn = 0.14, Min = −0.05, Max = 0.34) for extraversion, an R = 0.08 (SD = 0.07, Mdn = 0.08, Min = −0.19, Max = 0.27) for agreeableness, and an R = 0.06 (SD = 0.06, Mdn = 0.06, Min = −0.11, Max = 0.26) for neuroticism. Figure 2 presents the distribution of the performance of the multiple linear regression models (R measures) in the validation data sets. There are some trials where the model performance was similar to the expected effect size in this area of research (e.g., [7]), but the central tendency of the present results was nearly zero. Also, many trials presented negative and near-to-zero R measures. Thus, the estimated models were lacking in generalizability to other samples, which means that the results that are estimated in the training data sets could be overfitted or idiosyncratic to the data (please note that we are using relatively simple models such as multiple linear regression models) and their estimations cannot be generalizable to other samples.

3.2.3. Predictor Selection and Mean Standardized Effect of Word Count in the Training Data Sets

Previous results showed the mean performance of the models, but it is unclear if the effects of specific indicators remain robust among the different training data sets. In order to illustrate the robustness of the effects of predictors among different random subsamples, we analyzed the selection and the standardized effects of a specific LIWC indicator, the Word Count (i.e., the number of words of the self-description). As we saw in previous sections (3.1. Analyzing the Complete Data Set), this LIWC indicator was found to be a relevant predictor of three out of five personality traits. Specifically, the Word Count presented a positive relationship with consciousness, agreeableness, and neuroticism, in the complete data set (Section 3.1). In the backwards stepwise multiple linear regression results of the 1000 random subsamples of the cross-validation study, it was found that the Word Count was selected as a relevant predictor for consciousness 98.2% of the time and for agreeableness 88.4% of the time. Similarly, it was selected as a relevant predictor of extraversion only 10.1% of the time (please note that this LIWC indicator was not found to be relevant in Section 3.1). On the contrary, Word Count was only selected as a relevant predictor of neuroticism 52.2% of the time (it was found to be a relevant predictor in Section 3.1) and was selected for openness close to 35.3% of the time (although it was not found to be a relevant predictor in Section 3.1). These results mean that there were consistent relationships between Word Count and select personality traits among the random subsamples of the study (i.e., it showed a significant relationship with consciousness and agreeableness and a not-significant relationship with extraversion). On the contrary, it was also seen that its relationship with openness and neuroticism was not so clear and appeared to strongly depend on the selected subsample. Figure 3 presents the distribution of standardized effects (β) of Word Count in the training data sets for the five personality traits, with a focus on the interpretation of conscientiousness, agreeableness, and extraversion, for the sake of brevity. Two consistent relationships were found for Word Count (note that we analyzed the standardized effect of Word Count in those models that actually selected this predictor in the backwards stepwise selection): (1) the presence of an association with consciousness and agreeableness, and (2) the absence of an association with extraversion. In the former cases, the mean standardized effect in conscientiousness was 0.170 (SD = 0.040, Mdn = 0.169, Min = 0.078, Max = 0.331, N = 982), with it being 0.140 (SD = 0.036, Mdn = 0.136, Min = 0.074, Max = 0.267, N = 884) for agreeableness. In the latter case, the mean standardized effect in extraversion was 0.080 (SD = 0.057, Mdn = 0.094, Min = −0.100, Max = 0.153, N = 101) and its range contained zero. This would mean that select LIWC variables presented consistent relationships with select personality traits in different subsamples.

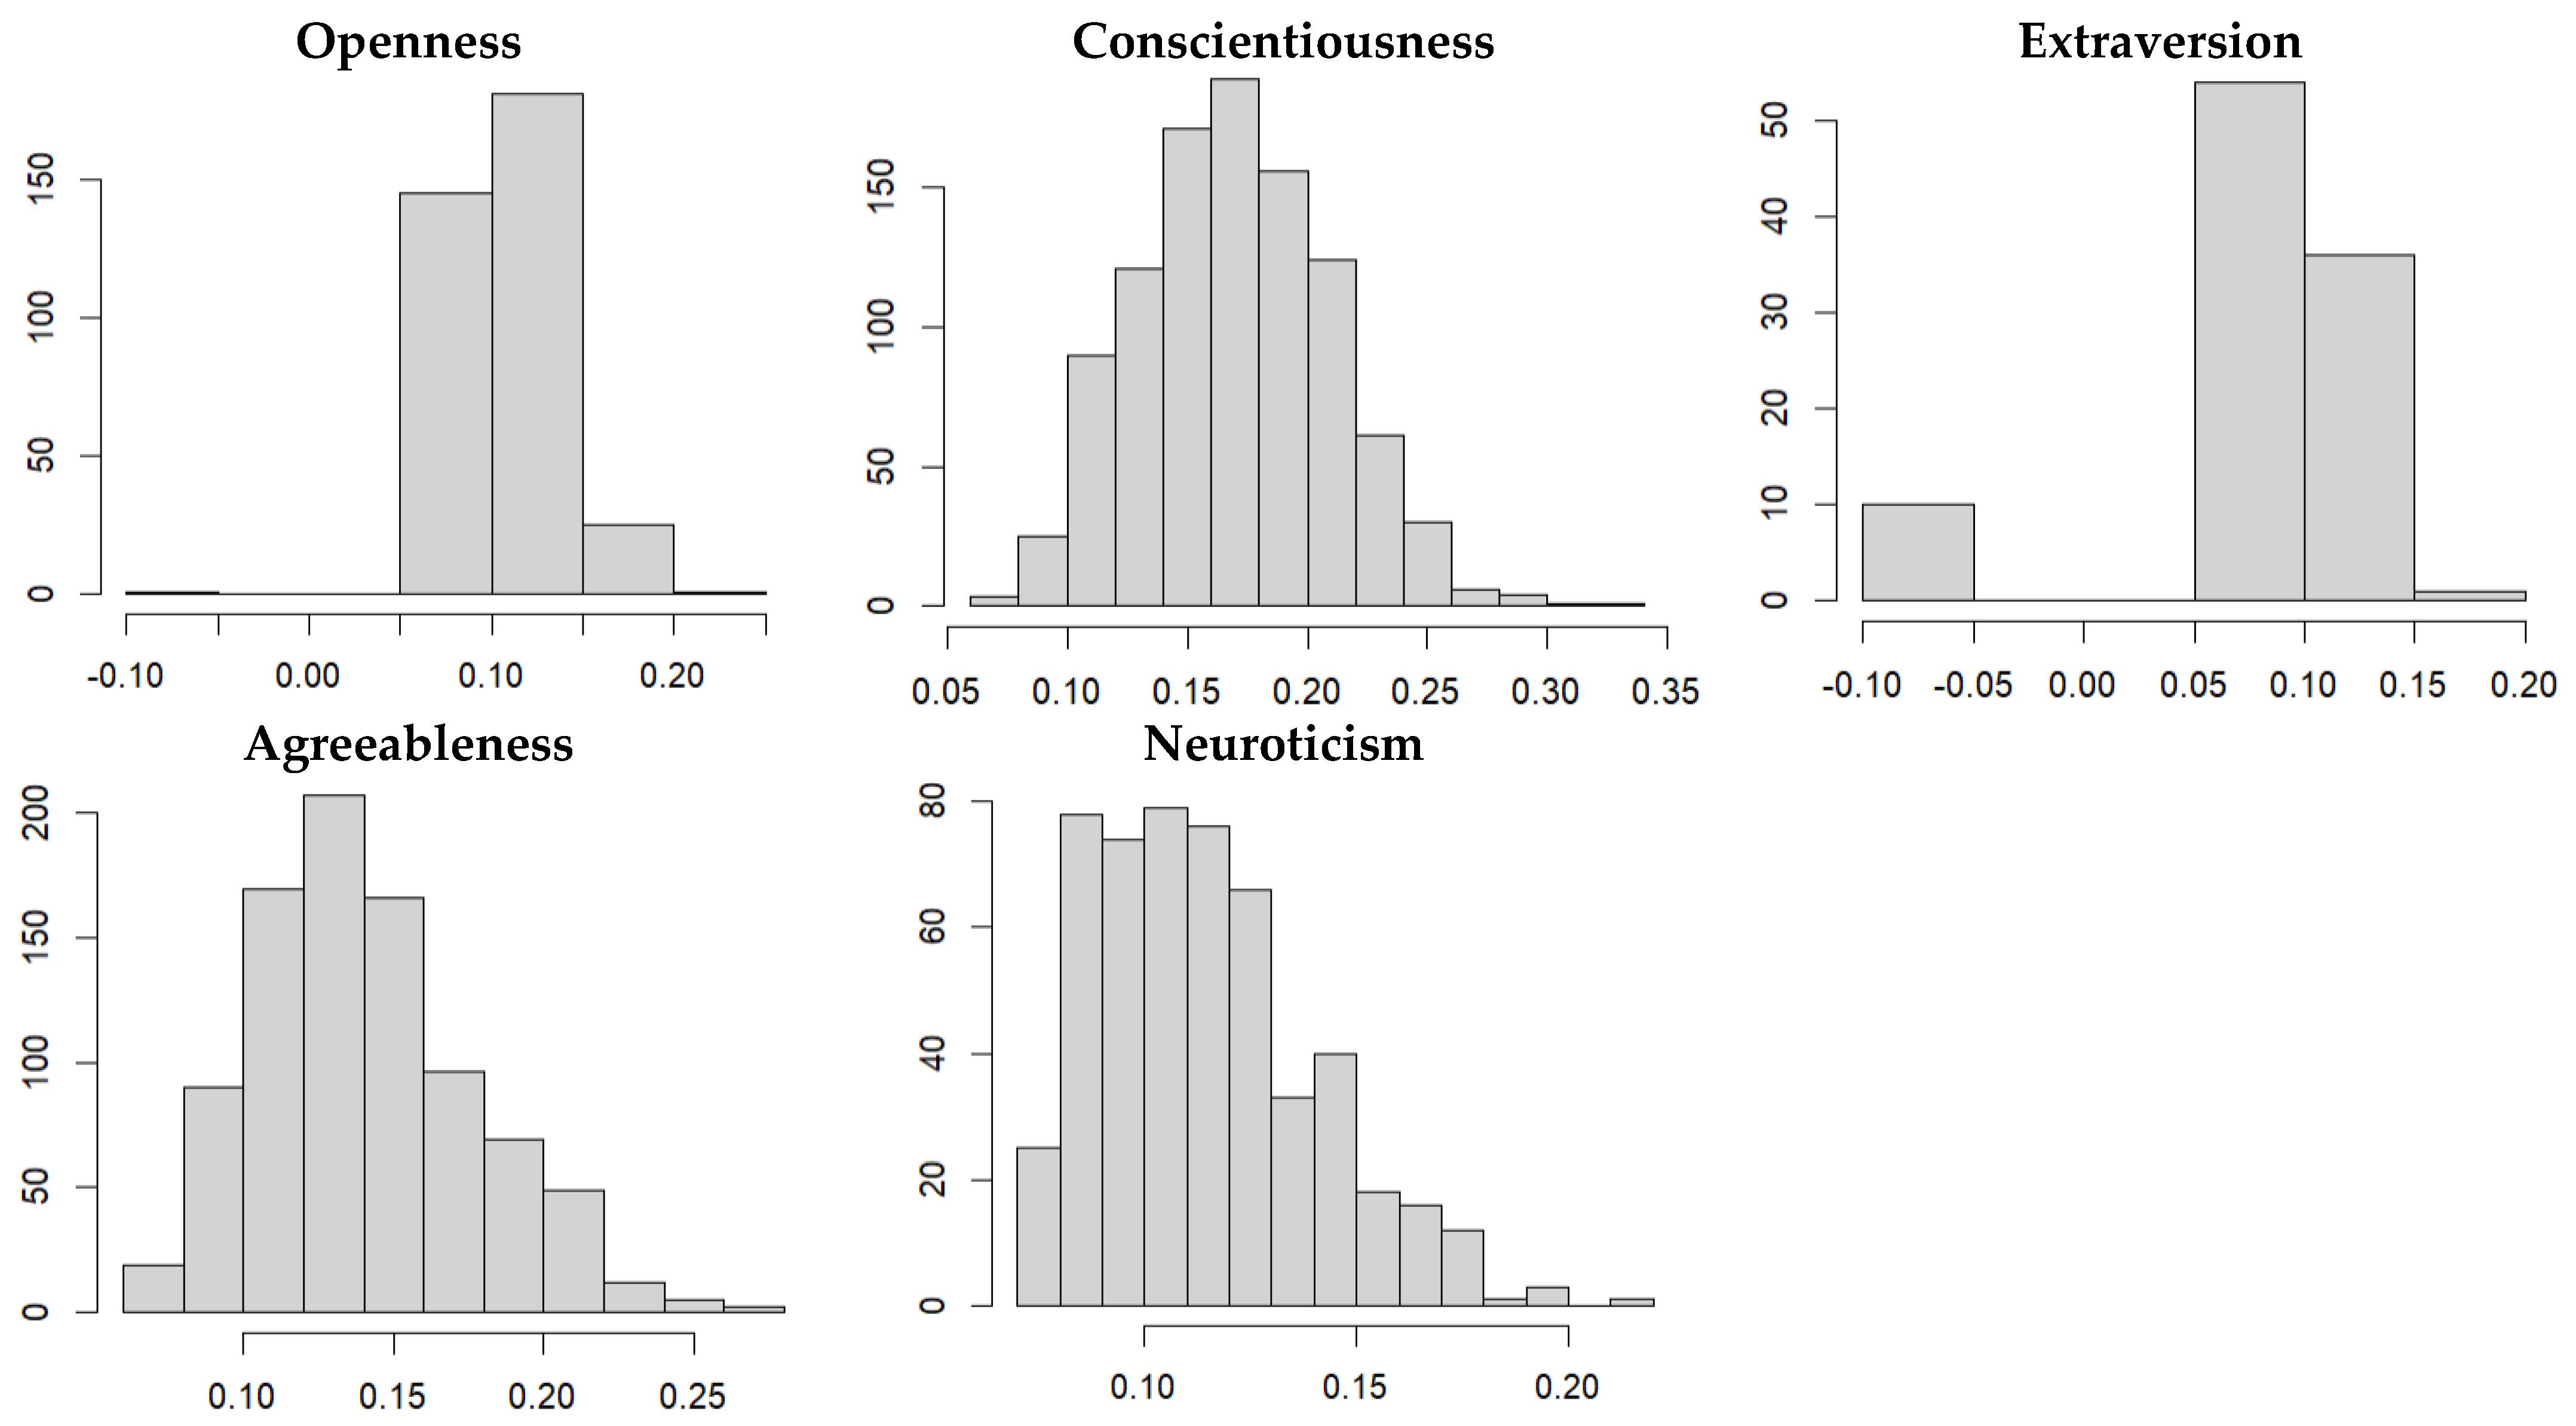
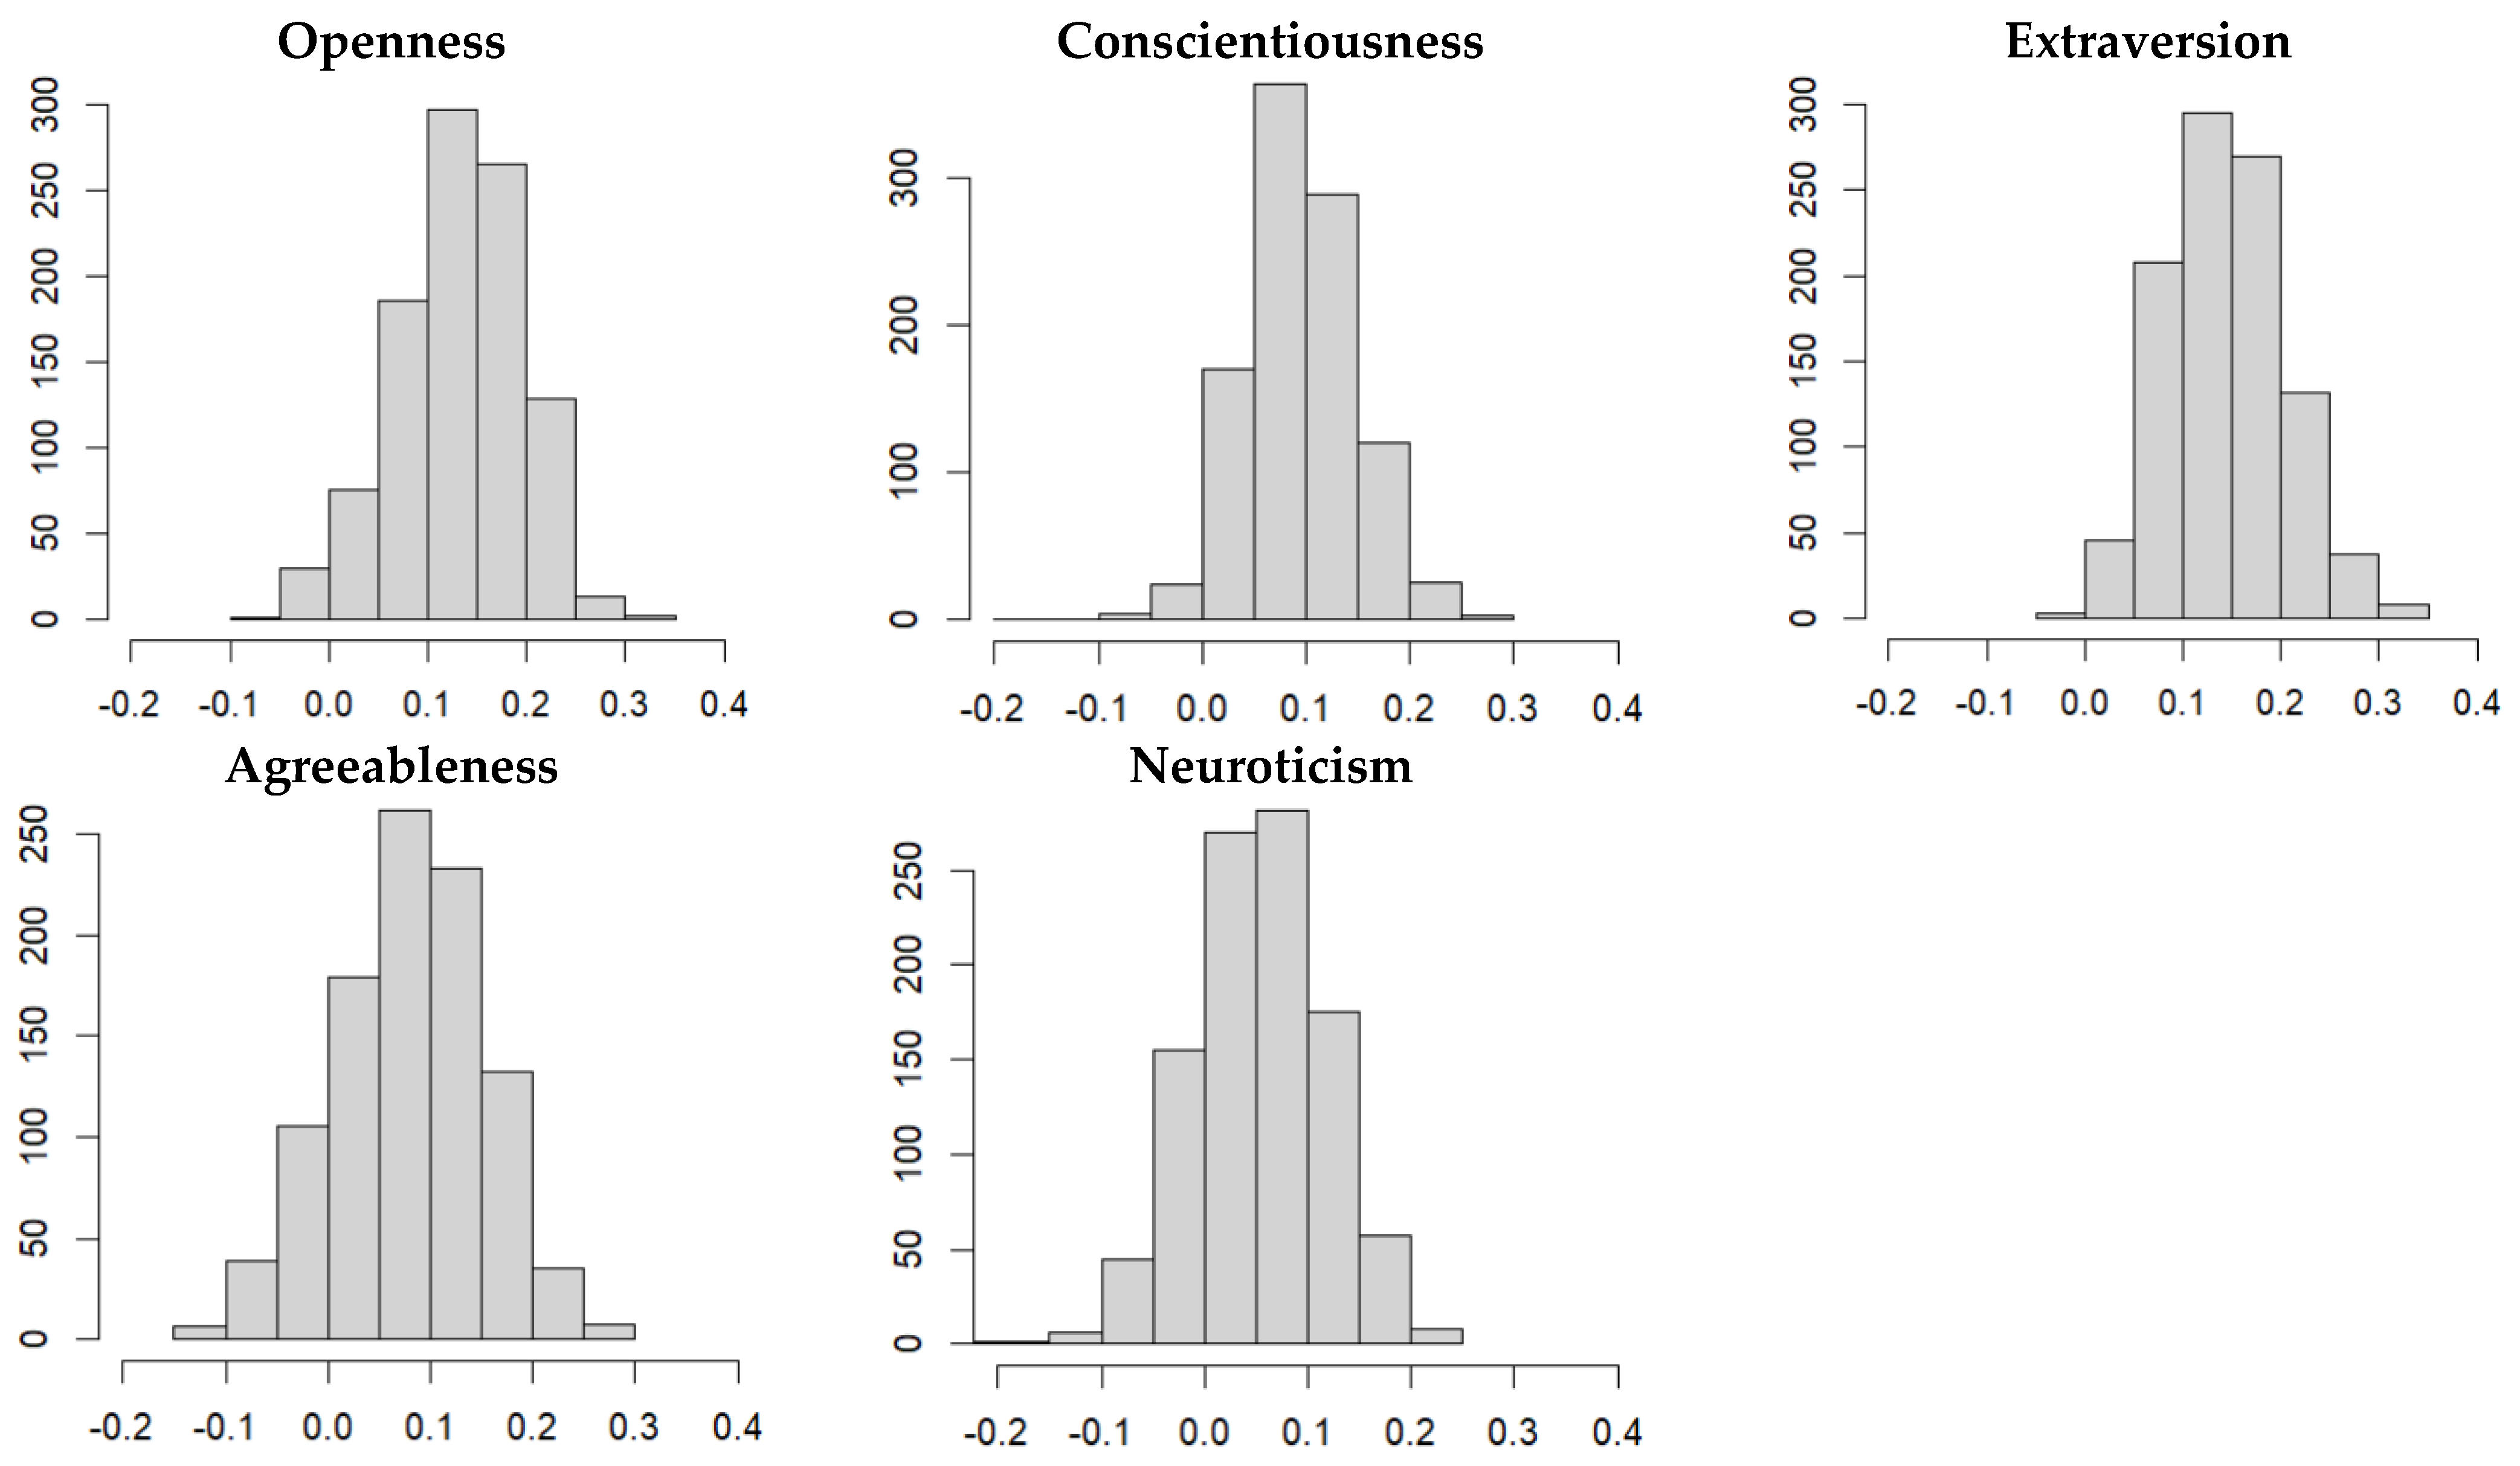
3.3. Second Cross-Validation Study (k-Fold Method)

To analyze if the lack of replicability found in the previous results was related to overfitting the models to the training data sets, an additional cross-validation study using the k-fold method was conducted. Again, we present the results of the R measures. A mean R measure of 0.13 (SD = 0.06, Mdn = 0.14, Min = −0.05, Max = 0.33) was found for openness, an R = 0.09 (SD = 0.05, Mdn = 0.09, Min = −0.17, Max = 0.26) for conscientiousness, an R = 0.14 (SD = 0.06, Mdn = 0.14, Min = −0.03, Max = 0.35) for extraversion, an R = 0.08 (SD = 0.07, Mdn = 0.08, Min = −0.15, Max = 0.29) for agreeableness, and an R = 0.05 (SD = 0.06, Mdn = 0.05, Min = −0.22, Max = 0.24) for neuroticism. Figure 4 presents the distribution of the performance of the multiple linear regression models (R measures) in the validation data sets. In this cross-validation study (using the k-fold method), a similar pattern of results was found whose central tendency was also nearly zero. This would mean that reducing the overfitting of the models to specific training data sets did not increase their performance in the validation data sets.

4. Discussion

The aim of the present study was to analyze the generalizability of the predictions of the Big Five questionnaire [9] using the linguistic indicators of the well-kwon LIWC [13,14] from self-descriptions in a sample of students. As it was done in many previous empirical studies, we used the indicators of the LIWC as predictors of the personality traits using an exploratory approach, that is, we included all the LIWC variables in the predictive models. The results of the present paper were clear: there were significant relationships between language and personality in specific samples (similar to the effect sizes found in previous metanalytic research, e.g., [7]), but our cross-validation study showed that the model estimates were not generalizable to other samples. In other words, it was not possible to generalize the language–personality relationships that were found in specific samples to the population nor to very similar samples. For example, the performance of models tested in different random subsamples of the same data set was very low, even when the original sample was relatively homogeneous (i.e., it was composed of young Spanish undergraduate students studying Psychology). In this respect, it is beyond doubt that the LIWC is an excellent tool to study language and psychological phenomena, but researchers could be using it inadequately in exploratory studies aiming to generalize their conclusions. In the following, we discuss different aspects of the results of the present study to improve future research.
Firstly, it was found that the generalizability of exploratory analysis could not be trustworthy, at least in this line of research. While we could find relevant substantive relationships between the linguistic indicators of the LIWC and the Big Five personality traits in the complete data set, the results were not generalizable to different random subsamples of the same data. Thus, the results that were estimated in the training data sets could be idiosyncratic to the data (Note that the k-fold cross-validation study, aiming to reduce the overfitting to a specific training data set, did not present relevant differences with the hold-out cross-validation study. The use of relatively simple models such as linear regression models to make the results more comprehensible is also noteworthy, but the same results could be expected in more complex predictive models. In fact, more complex models could be even more influenced by potential overfitting to the training data sets). In addition to using strategies that avoid overfitting the models to the data (i.e., strategies that protect against a high Type I Error rate), exploratory studies should serve to accumulate empirical knowledge and evidence about the phenomenon under study. For example, in the case of this line of research, it would be useless to carry out exploratory studies relating language properties to personality if the provisional results derived from these exploratory studies are not used as evidence in future studies. Only when significant and/or substantive effects are verified in new studies, with other samples and in different scenarios, the idiographic approach (particular to one study) could lead to a nomothetic perspective.
Secondly, we would like to endorse the use of cross-validation procedures in studies that are exploratory in their nature. It is necessary to conduct cross-validations to trust the empirical results of exploratory studies. In this paper, we saw that the Word Count had a consistent relationship with three out of five personality traits. That is, it was found it to be a consistent relevant predictor for consciousness and agreeableness in different random subsamples and to have a null relationship with extraversion. On the contrary, its relationship with openness and neuroticism was not clear because it depended on the selected random split. These findings were different to the conclusions that would be made using the complete data set. Thus, cross-validation procedures are useful to study the generalizability of both the general performance of the model and the effects of specific predictors.
Regarding the limitations of the present study, it is worth mentioning that we used multiple linear regression models to analyze the data. This decision was made to keep the results as simple as possible, but it is expected that a very similar pattern of results would have been found with more complex predictive models. Moreover, the effects of multiple linear regression models had the advantage of being more focused on the interpretability of the results than other predictive models. An additional limitation of this study was its sample size because, despite us using a large sample comparing to many primary studies of previous metanalytic studies [7], the results using much larger data sets could be different (on the contrary, see [31] an example of a large dataset whose effect size was around r = 0.30 in [7]). In this context, many other relevant variables could be considered in future research. For example, gender/sex has been found to be a relevant moderator variable in previous research [7,31], although the present study did not find relevant differences between the results of women and the results of the whole sample (probably due to the sample of this study being mainly composed by females). Other examples, such as socioeconomic status or educational level, which were very homogeneous in the sample of this study, could be relevant variables to be taken into account. Other interesting variables include verbal intelligence, a construct with relevant direct relationships with personality [32] and also with indirect relationships with other potential moderating variables [33,34,35]. Moreover, the present study was conducted in the Spanish language, and further research should try to analyze the generalizability of the results in different languages and cultures. This latter line of research about linguistic and cultural differences would go hand in hand with the proposal of starting research from idiographic perspectives aiming to later generate results from nomothetic approaches.
Finally, we would like to note that this is just an illustration in a specific line of research where it was easy to evaluate that the results were not generalizable to different subsamples of the same data set due to the transparency of the cross-validation study. However, the implications of this paper are very broad, as all empirical studies that are exploratory in their nature would present the same generalizability concerns. As we previously said, it is very common to see empirical studies predicting one or more dependent variables by multiple covariates or independent variables without a strong hypothesis supporting the inclusion of the predictors in the model. We recommend the use of cross-validation procedures to show the robustness (and later reproducibility) of the results if the tested models are exploratory and the authors pretend to follow a nomothetic approach. In this line, it is necessary to continue pursuing a more formal psychological science using computational or mathematical models to analyze the relationships between language and personality (for example, see the advantages of formal models in psychology here: [36,37]; which also strengthens theories, e.g., [38]). In this work, all the indicators included in the predictive models were taken from the LWIC tool, and the use of word embedding methods, whether frequency-based such as Latent Semantic Analysis [39,40] or prediction-based such as Word2Vec [41], have not been explored in determining possible predictive features for personality traits [e.g., see an exception of the use of Latent Semantic Analysis in 4]. Although this is an interesting future line of research, we must remain cautious and emphasize the need for robust cross-validation methods in the analysis of predictive indicators of personality traits. In light of this, we will approximate the phenomenon under study by means of vector space models using a confirmatory perspective focused on the validity of the linguistic indicators in future research (see a similar rationale in [42]).

Supplementary Materials

The following supporting information can be downloaded at: https://www.mdpi.com/article/10.3390/psych4040059/s1, Figure S1: Distribution of model performances (R measures) in the training data sets; Figure S2: Distribution of model performances (R measures) in the validation data sets.

Author Contributions

Writing—original draft preparation, J.Á.M.-H.; writing—review and editing, J.Á.M.-H., J.D.M., R.O., A.M.-M., G.J.-B. All authors have read and agreed to the published version of the manuscript.

Funding

J.Á.M.-H. would like to thank the Asociación Española de Metodología de las Ciencias del Comportamiento (AEMCCO) for their support to develop this research project by awarding him with the Grant AEMCCO-Julio Olea to young researchers in 2021.

Institutional Review Board Statement

The study was conducted in accordance with the Declaration of Helsinki, and approved by the Institutional Review Board (or Ethics Committee) of Universidad Autónoma de Madrid.

Informed Consent Statement

Informed consent was obtained from all subjects involved in the study.

Data Availability Statement

Data will be made available upon reasonable request by contacting the corresponding author.

Conflicts of Interest

The authors declare no conflict of interest.

References

  1. Boyd, R.L.; Pennebaker, J.W. Language-based personality: A new approach to personality in a digital world. Curr. Opin. Behav. Sci. 2017, 18, 63–68. [Google Scholar] [CrossRef] [Green Version]
  2. Boyd, R.L.; Pennebaker, J.W. Did Shakespeare write Double Falsehood? Identifying individuals by creating psychological signatures with text analysis. Psychol. Sci. 2015, 26, 570–582. [Google Scholar] [CrossRef] [PubMed] [Green Version]
  3. Fast, L.A.; Funder, D.C. Personality as manifest in word use: Correlations with self-report, acquaintance report, and behavior. J. Pers. Soc. Psychol. 2008, 94, 334–346. [Google Scholar] [CrossRef] [PubMed] [Green Version]
  4. Kwantes, P.J.; Derbentseva, N.; Lam, Q.; Vartanian, O.; Marmurek, H.H. Assessing the Big Five personality traits with latent semantic analysis. Pers. Indiv. Differ. 2016, 102, 229–233. [Google Scholar] [CrossRef]
  5. Boyd, R.L.; Schwartz, H.A. Natural Language Analysis and the Psychology of Verbal Behavior: The Past, Present, and Future States of the Field. J. Lang. Soc. Psychol. 2021, 40, 21–41. [Google Scholar] [CrossRef]
  6. Chung, C.K.; Pennebaker, J.W. What Do We Know When We LIWC a Person? Text Analysis As An Assessment Tool for Traits, Personal Concerns and life Stories. In The SAGE Handbook of Personality and Individual Differences: The Science of Personality and Individual Differences; Zeigler-Hill, V., Shackelford, T.K., Eds.; SAGE: London, UK, 2018; pp. 341–360. [Google Scholar] [CrossRef]
  7. Moreno, J.D.; Martínez-Huertas, J.Á.; Olmos, R.; Jorge-Botana, G.; Botella, J. Can personality traits be measured analyzing written language? A meta-analytic study on computational methods. Pers. Indiv. Differ. 2021, 177, 110818. [Google Scholar] [CrossRef]
  8. Hirsh, J.B.; Peterson, J.B. Personality and language use in self-narratives. J. Res. Pers. 2009, 43, 524–527. [Google Scholar] [CrossRef]
  9. Stachl, C.; Pargent, F.; Hilbert, S.; Harari, G.M.; Schoedel, R.; Vaid, S.; Gosling, S.D.; Bühner, M. Personality research and assessment in the era of machine learning. Eur. J. Personal. 2020, 34, 613–631. [Google Scholar] [CrossRef]
  10. McCrae, R.R.; Costa, P.T., Jr. The Five-Factor Theory of Personality. In Handbook of Personality: Theory and Research, 3rd ed.; John, O.P., Robins, R.W., Pervin, L.A., Eds.; Guilford Press: New York, NY, USA, 2008; pp. 159–181. [Google Scholar]
  11. Giner-Sorolla, R. From crisis of evidence to a “crisis” of relevance? Incentive-based answers for social psychology’s perennial relevance worries. Eur. Rev. Soc. Psychol. 2019, 30, 1–38. [Google Scholar] [CrossRef]
  12. Nosek, B.A.; Hardwicke, T.E.; Moshontz, H.; Allard, A.; Corker, K.S.; Dreber, A.; Vazire, S. Replicability, robustness, and reproducibility in psychological science. Annu. Rev. Psychol. 2022, 73, 719–748. [Google Scholar] [CrossRef]
  13. Pennebaker, J.W.; Francis, M.E.; Booth, R.J. Linguistic Inquiry and Word Count: LIWC 2001; Erlbaum: Mahwah, NJ, USA, 2001. [Google Scholar]
  14. Pennebaker, J.W.; Boyd, R.L.; Jordan, K.; Blackburn, K. The Development and Psychometric Properties of LIWC2015; The University of Texas at Austin: Austin, TX, USA, 2015. [Google Scholar]
  15. Farnadi, G.; Sitaraman, G.; Sushmita, S.; Celli, F.; Kosinski, M.; Stillwell, D.; De Cock, M. Computational per-sonality recognition in social media. User Model. User Adap. 2016, 26, 109–142. [Google Scholar] [CrossRef] [Green Version]
  16. Hawkins, I.I.; Raymond, C.; Boyd, R.L. Such stuff as dreams are made on: Dream language, LIWC norms, and personality correlates. Dreaming 2017, 27, 102–121. [Google Scholar] [CrossRef]
  17. Proyer, R.T.; Brauer, K. Exploring adult playfulness: Examining the accuracy of personality judgments at ze-ro-acquaintance and an LIWC analysis of textual information. J. Res. Pers. 2018, 73, 12–20. [Google Scholar] [CrossRef]
  18. Qiu, L.; Lin, H.; Ramsay, J.; Yang, F. You are what you tweet: Personality expression and perception on Twitter. J. Res. Pers. 2012, 46, 710–718. [Google Scholar] [CrossRef]
  19. Qiu, L.; Lu, J.; Ramsay, J.; Yang, S.; Qu, W.; Zhu, T. Personality expression in Chinese language use. Int. J. Psychol. 2017, 52, 463–472. [Google Scholar] [CrossRef] [PubMed]
  20. Holtgraves, T. Text messaging, personality, and the social context. J. Res. Pers. 2011, 45, 92–99. [Google Scholar] [CrossRef]
  21. Yarkoni, T. Personality in 100,000 words: A large-scale analysis of personality and word use among bloggers. J. Res. Pers. 2010, 44, 363–373. [Google Scholar] [CrossRef] [Green Version]
  22. Tausczik, Y.R.; Pennebaker, J.W. The psychological meaning of words: LIWC and computerized text analysis methods. J. Lang. Soc. Psychol. 2010, 29, 24–54. [Google Scholar] [CrossRef]
  23. Mehl, M.R.; Gosling, S.D.; Pennebaker, J.W. Personality in its natural habitat: Manifestations and implicit folk theories of personality in daily life. J. Pers. Soc. Psychol. 2006, 90, 862–877. [Google Scholar] [CrossRef]
  24. Pennebaker, J.W.; King, L.A. Linguistic styles: Language use as an individual difference. J. Pers. Soc. Psychol. 1999, 77, 1296–1312. [Google Scholar] [CrossRef]
  25. Martínez-Huertas, J.A.; Jorge-Botana, G.; Luzón, J.M.; Olmos, R. Redundancy, isomorphism and propagative mechanisms between emotional and amodal representations of words: A computational study. Mem. Cognition 2021, 49, 219–234. [Google Scholar] [CrossRef] [PubMed]
  26. Bermúdez, J. Cuestionario “Big Five”; TEA Ediciones: Madrid, Spain, 2001. [Google Scholar]
  27. R Core Team. R: A Language and Environment for Statistical Computing; R Foundation for Statistical Computing: Vienna, Austria, 2022. [Google Scholar]
  28. Venables, W.N.; Ripley, B.D. Modern Applied Statistics with S, 4th ed.; Springer: New York, NY, USA, 2002. [Google Scholar]
  29. Zhang, Z. Variable selection with stepwise and best subset approaches. Ann. Transl. Med. 2016, 4, 136. [Google Scholar] [CrossRef] [PubMed] [Green Version]
  30. Kuhn, M. Building Predictive Models in R Using the caret Package. J. Stat. Softw. 2008, 28, 1–26. [Google Scholar] [CrossRef] [Green Version]
  31. Schwartz, H.A.; Eichstaedt, J.C.; Kern, M.L.; Dziurzynski, L.; Ramones, S.M.; Agrawal, M.; Shah, A.; Kosinski, M.; Stillwell, D.; Ungar, L.H.; et al. Personality, gender, and age in the language of social media: The open-vocabulary approach. PLoS ONE 2013, 8, e73791. [Google Scholar] [CrossRef] [PubMed]
  32. Michels, M. General intelligence and the dark triad: A meta-analysis. J. Individ. Differ. 2022, 43, 35–46. [Google Scholar] [CrossRef]
  33. Bédard, M.A.; Le Corff, Y. Intelligence and personality: A replication and extension study of the association between intelligence and personality aspects. J. Individ. Differ. 2020, 41, 124. [Google Scholar] [CrossRef]
  34. DeYoung, C.G.; Quilty, L.C.; Peterson, J.B.; Gray, J.R. Openness to experience, intellect, and cognitive ability. J. Pers. Assess 2014, 96, 46–52. [Google Scholar] [CrossRef] [PubMed]
  35. Syzmanowicz, A.; Furnham, A. Gender differences in self-estimates of general, mathematical, spatial and verbal intelligence: Four meta analyses. Learn Individ. Differ. 2011, 21, 493–504. [Google Scholar] [CrossRef]
  36. Guest, O.; Martin, A.E. How computational modeling can force theory building in psychological science. Perspect. Psychol. Sci. 2021, 16, 789–802. [Google Scholar] [CrossRef]
  37. Smaldino, P.E. How to translate a verbal theory into a formal model. Soc. Psychol. 2020, 51, 207–218. [Google Scholar] [CrossRef]
  38. van Rooij, I.; Baggio, G. Theory before the test: How to build high-verisimilitude explanatory theories in psychological science. Perspect. Psychol. Sci. 2021, 16, 682–697. [Google Scholar] [CrossRef] [PubMed]
  39. Landauer, T.K.; Dumais, S. A solution to Plato’s problem: The Latent Semantic Analysis theory of the acquisition, induction, and representation of knowledge. Psychol. Rev. 1997, 104, 211–240. [Google Scholar] [CrossRef]
  40. Landauer, T.K.; McNamara, D.S.; Dennis, S.; Kintsch, W. The Handbook of Latent Semantic Analysis; Taylor & Francis: Mahwah, NJ, USA, 2007. [Google Scholar]
  41. Mikolov, T.; Sutskever, I.; Chen, K.; Corrado, G.S.; Dean, J. Distributed representations of words and phrases and their compositionality. Adv. Neural. Inf. Process. Syst. 2013, 26, 3111–3119. [Google Scholar]
  42. Martínez-Huertas, J.A.; Olmos, R.; Jorge-Botana, G.; León, J.A. Distilling vector space model scores for the assessment of constructed responses with bifactor Inbuilt Rubric method and latent variables. Behav. Res. Methods 2022, 1–23. [Google Scholar] [CrossRef]
Figure 1. Distribution of model performances (R measures) in the training data sets. x-axis ranges from 0.30 to 0.60.
Psych 04 00059 g001
Figure 2. Distribution of model performances (R measures) in the validation data sets. x-axis ranges from −0.20 to 0.40.
Psych 04 00059 g002
Figure 3. Distribution of standardized effects (β) of Word Count in the training data sets where the indicator was selected. Please note that the x-axis is different in these histograms. NOpennes = 353. NConscientiousness = 982. NExtraversion = 101. NAgreeableness = 884. NNeuroticism = 522.
Psych 04 00059 g003
Figure 4. Distribution of model performances (R measures) in the validation data sets. x-axis ranges from −0.20 to 0.40.
Psych 04 00059 g004
Table 1. Multiple linear regression model performances (R and R2) for each personality trait.
OCEAN
Full modelR (R2)0.452 (0.205)0.429 (0.184)0.459 (0.211)0.449 (0.202)0.422 (0.178)
Radj (Radj2)0.283 (0.080)0.237 (0.056)0.295 (0.087)0.276 (0.076)0.221 (0.049)
Backwards stepwise selectionR (R2)0.373 (0.139)0.357 (0.127)0.372 (0.138)0.370 (0.137)0.311 (0.097)
Radj (Radj2)0.342 (0.117)0.310 (0.096)0.345 (0.119)0.336 (0.113)0.279 (0.078)
Note. All LIWC indicators were included as covariates/predictors in the full model. Then, a backward stepwise selection was conducted to choose the most relevant predictors for each personality trait. Radj and R2adj were adjusted by the number of variables. O = openness. C = conscientiousness. E = extraversion. A = agreeableness. N = neuroticism.
Table 2. Unstandardized (and standardized) estimates of the covariates/predictors of multiple linear regression models for each personality trait.
EstimateOpennessConscientiousnessExtraversionAgreeablenessNeuroticism
Intercept0.656 ** (0.000)0.157 (0.000)0.364 ** (0.000)0.199 (0.000)0.570 ** (0.000)
Large words a0.006 ** (0.117)-0.006 ** (0.126)--
Function words b−0.008 ** (−0.173)----
Personal pronouns0.008 (0.085)0.012 ** (0.142)-0.038 ** (0.582)-
Impersonal pronouns0.025 ** (0.253)0.008 * (0.095)---
Past−0.021 (−0.078)---−0.022 * (−0.083)
Present−0.014 ** (−0.169)----
Conjunctions0.024 ** (0.221)----
Family−0.028 ** (−0.153)----
Humans−0.025 ** (−0.124)−0.016 * (−0.089)---
Exclamations−0.014 (−0.075)−0.017 * (−0.098)−0.018 * (−0.107)--
Feelings0.029 * (0.082)----
Biology0.061 * (0.411)----
Body−0.053 (−0.113)----
Health−0.055 * (−0.282)----
Eating−0.066 * (−0.252)----
Death0.090 * (0.086)---0.089 * (0.089)
Word count-0.000 ** (0.175)-0.000 ** (0.117)0.000 (0.077)
She/he-−0.014 ** (−0.119)-−0.044 ** (−0.478)-
Prepositions-0.007 * (0.106)---
Informal-0.052 ** (0.105)0.042 * (0.087)--
Friends-−0.022 (−0.070)---
Anger-0.039 * (0.091)0.066 ** (0.156)--
Insight-0.012 * (0.095)−0.014 * (−0.114)--
Inclusive words-0.011 ** (0.128)---
Perception-−0.011 (−0.071)---
Relativity-−0.025 * (−0.392)---
Movement-−0.022 (0.155)---
Space-0.022 (0.205)---
Time-0.023 * (0.215)---
Achievement-0.013 ** (0.109)0.010 * (0.082)-0.016 ** (0.124)
Pleasure-0.010 ** (0.213)---
Home -−0.026 * (−0.162)-−0.019 ** (−0.156)-
Commas-0.008 ** (0.112)---
Quotes-0.043 * (0.078)---
I (me)--0.006 (0.068)−0.040 ** (−0.550)−0.009 * (−0.089)
You--−0.026 (−0.077)--
Anxiety--−0.058 ** (−0.139)--
Cognitive processes c--0.007 ** (0.164)--
Tentativeness--−0.017 ** (−0.144)--
Seeing--−0.022 (−0.072)--
Religion--−0.068 (−0.064)--
Question marks--0.139 (0.065)--
Dictionary words---0.007 ** (0.222)-
Determinants---−0.005 (−0.077)-
Adverbs---−0.015 ** (−0.180)-
Quantifiers---−0.012 ** (−0.114)-
First person (verbs)---−0.010 ** (−0.109)-
Second person (verbs)---−0.080 ** (−0.154)-
Third person (verbs)---−0.025 * (−0.090)-
Formal---10.450 * (0.097)-
Sexual---0.053 ** (0.119)-
Assent---−0.025 (0.072)-
Colons---0.053 * (0.090)0.052 (0.065)
Exclamations---0.030 ** (0.109)-
Negative Emotions----−0.036 ** (−0.178)
Certainty----−0.014 * (−0.085)
Hearing----−0.039 ** (−0.121)
Work----−0.021 ** (−0.157)
Dashes----−0.085 * (−0.084)
Apostrophes----0.272 * (0.077)
Other punctuation----−0.070 * (−0.092)
Note. ** = p < 0.01. * = p < 0.05. a = words with more than six letters. b = total number of function words. c = total number of cognitive processes words.
Publisher’s Note: MDPI stays neutral with regard to jurisdictional claims in published maps and institutional affiliations.

