Review

Pure Hydrolysis of Polyamides: A Comparative Study

by
Mathis Mortensen Brette
1,
Allan Hjarbæk Holm
2,
Aleksey D. Drozdov
1 and
Jesper de Claville Christiansen
1,*
1
Department of Materials and Production, Aalborg University, Fibigerstræde 16, 9220 Aalborg, Denmark
2
Grundfos A/S (Danske Salgsselskab), Martin Bachs Vej 3, 8850 Bjerringbro, Denmark
*
Author to whom correspondence should be addressed.
Chemistry 2024, 6(1), 13-50; https://doi.org/10.3390/chemistry6010002
Submission received: 13 September 2023 / Revised: 27 November 2023 / Accepted: 28 November 2023 / Published: 20 December 2023
(This article belongs to the Topic Molecular Topology and Computation)

Abstract

:
Polyamides (PAs) undergo local environmental degradation, leading to a decline in their mechanical properties over time. PAs can experience various forms of degradation, such as thermal degradation, oxidation, hydrothermal oxidation, UV oxidation, and hydrolysis. In order to better comprehend the degradation process of PAs, it is crucial to understand each of these degradation mechanisms individually. While this review focuses on hydrolysis, the data from degrading similar PAs under pure thermal oxidation and/or hydrothermal oxidation are also collected to grasp more perspective. This review analyzes the available characterization data and evaluates the changes in molecular weight, crystallinity, chemical structure, and mechanical properties of PAs that have aged in oxygen-free water at high temperatures. The molecular weight and mechanical strength decrease as the crystallinity ratio rises over aging time. This development is occurring at a slower rate than degradation in pure thermal oxidation. By combining the data for the changes in mechanical properties with the ones for molecular weight and crystallinity, the point of embrittlement can be not only predicted, but also modeled. This prediction is also shown to be dependent on the fibers, additives, types of PA, pH, and more.

1. Introduction

Polyamides (PAs) are thermoplastic polymers thriving as household and engineering materials because of their high elasticity, mechanical strength, high melting point, chemical resistance to oil, and barrier properties against liquids and gases. These properties make them adequate not only as carpets, stockings, and clothing as fibers but also gears, pipelines, and automotive components as plastics. In society, they are commonly referred to as nylon [1,2,3,4]. In their applications, PAs are exposed to chemical aging, which negatively impacts their mechanical properties in the long term. When in contact with water or humidity for a long period of time, PAs can undergo hydrolysis. This causes a cut within the polymer chains, leading to a decrease in molecular weight over time [5,6].
While the degradation mechanism of PAs in water is seemingly straightforward from a chemical point of a view, when diving deeper, it can be found that a complex coupling of mechanisms occurs. Water reacts with the amide group and induces chain scission. This is the reverse polymerization reaction from the condensation of the acid and amine monomers. The presence of oxygen both in the air and dissolved in the aqueous solution is of great importance. This oxygen oxidizes the polymer, which not only further degrades it, but also introduces a whole new set of different chemical degradation pathways. Thermal oxidation starts with the abstraction of a hydrogen at the aliphatic carbon chain by oxygen radicals. The carbon atoms adjacent to the amide group turn become radical from the homolytic cleavage of their hydrogen [5,7,8,9,10]. This further leads the material to experience yellowing, discoloration, cross-linking, embrittlement, and so on. The thermal oxidation of PAs has been investigated in many articles over the years [9,11,12,13,14,15,16,17,18,19].
To this day, several reviews have been published concerning the degradation of PAs. In 1998, Thanki et al. [20] published a literature review on the thermal oxidation and photooxidation of PA66. A couple of years later, Shamey et al. [5] reviewed the types of degradation, the factors impacting them, and their means of characterization for PA66 in 2003. Finally, Venoor et al. [21] reviewed the physical and chemical interactions between PAs and water in 2020. In this review, the authors centered their attention on the transport of moisture within the polymer matrix, drying kinetics, and water dynamics, all while looking at some existing models. They also concluded by pointing out the need for better uses of instrumentation and control.
This issue of microplastic formation from PAs in the ocean lead to an increasing interest in understanding the formation of these secondary microplastics. Grasping the mechanism will also allow us to control the reverse polymerization possibility of this type of plastic for circular and recyclable PAs. The hydrolytic degradation of PAs in aqueous solution at high temperature has been researched extensively for the past decades [22,23,24,25,26,27,28,29,30,31,32,33,34,35,36,37,38,39,40,41,42,43,44,45,46]. Nevertheless, parts of the research on the matter assume that with an aging temperature above 50 C, hydrolysis is not simply dominant over oxidation, but renders oxidation entirely negligible [47]. The rest of the research simply disregards it. For the study of pure hydrolysis, the PA must be immersed in a carefully deoxygenated aging chamber. Several research articles do target pure hydrolysis as the sole mechanism of degradation; nevertheless, the more data gathered, the more confusing the overview. This lack of data compilation leaves room for a literature review focusing on this matter.
To achieve a full state-of-the-art comprehension of the pure hydrolysis of PAs, only papers explicitly stating that oxygen is removed from the aging chamber are reported here [1,8,48,49,50,51,52,53,54,55,56,57,58,59,60,61,62,63,64,65,66,67,68,69]. Several of the reported articles also aged their PAs under pure thermal oxidation and hydrothermal oxidation. These data are providing even further context to the degradation mechanism of PAs aged in deoxygenated water. They help placing hydrolysis contextually. This review focuses on the changes in molecular weight, crystallinity, chemical structure, and mechanical strength as individual chapters resulting from the pure hydrolysis of PA to draw out a state-of-the-art overview. Additionally, the impact of fibers, additives, pH, longer aliphatic chains in the PAs, correlation between molecular weight and crystallinity ratio, and the factor indicating embrittlement are discussed as well. This work is intended to help scientists grasp the full picture of the current research, which may assist them in either finding a research gap or comparing their own data to the current published literature without having to dive into dozens or even hundreds of papers.

2. Molecular Weight

2.1. Polyamide 6

PA6 has many intrinsic valuable properties such as high mechanical strength, high chemical resistance, low friction coefficient, and transparency. The polymer is not unaffected by water degradation due to the polarity of its amide bonds, which ultimately impacts its molecular weight overtime [70]. The molecular weight measurements presented here are all originating from gel permeation chromatography (GPC) measurements. Arhant et al. [52] immersed a 5 mm thick commercial PA6 containing a 60 wt% carbon fiber (C) reinforcement in water for up to 90 days with temperatures ranging from 100 C to 140 C. The changes in the number average molecular weight (M n ) of the polymer over time are shown in Figure 1. Starting at 26.2 kg/mol, M n quickly drops within the first days and slowly reaches an equilibrium over time. For an aging temperature of 120 C, M n decreased from 26.2 kg/mol to 15.5 kg/mol within the first 10 days of aging, until reaching an equilibrium at around 11.0 kg/mol after 28 days. Increasing the aging temperature has two separate effects on M n . Higher temperatures accelerate the decrease in M n during the early-stage hydrolysis as well as the lowering of M n at equilibrium. At 140 C, the equilibrium was reached after only 9 days with a M n of 8 kg/mol.
On top of the M n , the polydispersity index (PDI) or the distribution of molecular mass in a polymer was recorded as well. The PDI remained constant at 2.3 all throughout the process, indicating that pure hydrolysis is a random process occurring at all locations of the chains.
To investigate the coupling effect of hydrolysis and oxidation, Deshoulles et al. [48] aged their 0.25 mm thick neat PA6 material in dry hot air, deoxygenated water, and oxygenated water at 80 C for long periods of time. Their GPC data are presented in Figure 2. The starting M n was 52.3 kg/mol for all three degradation mechanisms. In deoxygenated water, M n reached 32.5 kg/mol after 700 days of aging. In dry hot air, M n reached 13.8 kg/mol after 630 days, making thermal oxidation a faster degradation process than pure hydrolysis at 80 C. And finally, when immersed in oxygenated hot water, M n fell drastically down to 13.5 kg/mol after merely 28 days, 80 times faster than pure hydrolysis. This underlines the importance of carefully removing oxygen from the aging chamber both in the solution and above it. The PDIs recorded for all three mechanisms are all dissimilar to one another. Similar to the previous data from Arhant et al. [52] as well as an earlier work from Deshoulles et al. [56], the PDI for pure hydrolysis at 80 C remained at 2.3 constantly. For thermal oxidation, the PDI rose from 2.3 to 2.9 after the 630 days of aging. The authors issued this phenomenon to the cross-linking taking place at the last stage of oxidation. The PDI rose to even higher values when both mechanisms were combined. A PDI of nearly 4.5 after the 28 days of aging was reported, indicating that the chain scission process occurs in a less random manner compared to pure hydrolysis.
To decouple both mechanisms further, a sample of neat PA6 was aged in dry hot air until molecular weight equilibrium, then placed in deoxygenated hot water. We note that the equilibrium reached when aged under oxidation and hydrolysis is different, as oxidation includes radical chemistry which leads not only to the formation of amines and carboxylic acids, but also cross-linking, bridging, and more. The results are shown in Figure 3. Both mechanisms were taking place at 100 C to accelerate the procedure. The M n decreased further even after the pre-oxidative treatment. This phenomenon is linked to the formation of imides during oxidation before chain scission, enhancing the likelihood of hydrolysis occurring from these chemical groups. This has been proven through Fourier-transform infrared (FTIR) spectroscopy. The infrared spectra are discussed further in Section 4.
When comparing the decrease in M n of PA6/C and neat PA6, one can notice the significantly slower drop in M n of the neat PA6 over time. At 80 C, the neat PA6 obtained a M n 32.4 kg/mol after 700 days of aging, compared to the PA6/C that reached a M n of 12.1 kg/mol after only 90 days of aging at 100 C; both reached equilibrium. The fibers were described by Arhant et al. [52] as being indifferent to both the effect of water and temperatures as high as 120 C. Hence, the contrast may originate solely from the small difference in aging temperature, pointing out that an exponentially higher degradation rate occurs with aging temperatures higher than 80 C for PA6. This indication is further supported by looking at an earlier work from Deshoulles et al. [56], where, again, neat PA6 with a thickness of 0.25 mm was aged in deoxygenated water, but at 120 C until equilibrium. Both trends are shown in Figure 4. The M n of both PA6s decreases to a similar value. Notably, a higher starting M n also seems to result in a faster degradation rate. In the case of glass fibers, the presence of reinforcement has been associated to a lower water absorption property due to the simple fact that less PA is present in the network when reinforced [26]. If the two PA6 were to start at similar M n , it is likely that the reinforced PA would degrade slower.
Another earlier work from Deshoulles et al. [55] aimed at determining a parameter able to track the embrittlement or, i.e., the ductile to brittle transition of PA6. Neat PA6 without additives was aged in deoxygenated water and dry hot air separated once again for up to almost 2 years with temperatures ranging from 80 C to 140 C. The samples had a thickness of 250 μ m and 75 μ m, respectively. The PDI recorded from aging through both pure hydrolysis and pure thermal oxidation remained equal to 2.5 ± 0.5. This high deviation created a large uncertainty, preventing a direct comparison to other PDI values from other sources. The changes in M n are shown in Figure 5 for both pure hydrolysis and Figure 6 for pure thermal oxidation.
Degrading PA6 in dry air led to a faster drop in M n than degrading it in deoxygenated water at high temperatures. For pure hydrolysis, M n reached 32.6 kg/mol after 520 days of aging at 80 C, and this value decreased exponentially to 6.7 kg/mol when rising the temperature from 80 C to 100 C for about the same aging time. This is in correlation with the previous statement that a significant effect is to be expected at the 80 C to 100 C temperature range. Increasing the temperature further led to a faster drop rate and a slight decrease in M n at equilibrium.

2.2. Polyamide 11

In addition to PA6, knowing the degradation behavior of PA11 in deoxygenated water has also been of great interest. This comes from one of its main applications as internal pressure sheath in offshore underwater flexible pipes where the concentration of oxygen is scarce [51]. PA11 harbors a high chemical resistance, with a working temperature ranging from −40 to 130 C. [71]. PA11 also undergoes hydrolysis like PA6 or PA66. The main difference lies behind PA11’s water affinity worsened by its longer carbon chain. Meyer et al. [68] aged an unplasticized, laboratory-made 3 mm thick neat PA11 in deoxygenated water at temperatures ranging from 90 C to 135 C with varying starting average molecular weight (M w ). The M w is another way of describing the molecular weight of polymers and is always greater than M n . Factoring the M n with the PDI provides M w . The variations of M w over time at 90 C and 135 C are displayed in Figure 7.
Regardless of the starting M w , all M w values tend towards an equilibrium. The accelerating effect is more than obvious when looking at the M w after around 65 days of aging for both 90 C and 135 C with 72 kg/mol as a similar starting M w . At 90 C, M w reached about 50 kg/mol, while at 135 C, this value reached 25 kg/mol. One can argue visually that the M w at equilibrium for 135 C tends towards 25 kg/mol, and for 90 C, this equilibrium appears to be at around 28 kg/mol. This would be in line with the previous statement regarding the effect of temperature on PA6 upon its M n . Another important information is the fact that all PA11s with a starting M w below the equilibrium have their M w rising towards it. This increase in M w is another sign of the reaction equilibrium between hydrolysis and condensation. M w below such equilibrium implies a higher concentration of primary amine and carboxylic acid end-groups in contrast to the concentration of amide groups in the polymer. Following the basic concept of the Le Châtelier’s principle, this shift induces an enhanced condensation rate of the end groups. Meyer et al. [68] also looked at the effect of pH by aging the same PA11 in acidic aqueous solution with a pH of 3 and 5 using hydrochloric acid. The lower the pH, the faster the hydrolysis rate, and the lower the M w . At pH 5, the equilibrium shifted from 25 kg/mol to around 22 kg/mol at 120 C. The effect of lower pH is said to protonate the amine end groups to a cation. This ties up the lone pair of electrons initially present on the nitrogen group, preventing the nucleophilic attack of the amine towards the carboxylic acid. This explains the lower condensation rate and the lower M w at equilibrium at lower pH.
Similar results were obtained from the work of Hocker et al. [59]. Samples of 0.3 mm thick PA11 plasticized with an unspecified amount of N-butylbenzenesulfonamide (BBSA) were aged with different amounts of graphene oxide (GO) as reinforcement at 100 C and 120 C for up to 4 months. Without any fibers, the M w reached around 24 kg/mol at equilibrium for both temperatures, and the higher aging temperature caused the expected accelerating effect reported several times previously. The increased aging temperature did not lower the M w significantly, probably due to the lower impact of hydrolysis on PA11 compared to PA6 and the small temperature difference of merely 10 C. At 100 C, the hydrolysis rate and condensation rate reached 2.8 × 10 2 and 5.0 × 10 5 day 1 . These rates increased to 12 × 10 2 and 23 × 10 5 day 1 for 120 C, according to the authors’ data. Additionally, 1 mg/g of GO in PA11 rose M w at equilibrium by 40% from the neat PA11 for both temperatures and reduced the hydrolysis rate by 1 × 10 2 day 1 at 100 C and 7.5 × 10 2 day 1 at 120 C. However, 5 mg/g resulted in the loss of that property from a poor nano-particle dispersion due to agglomeration of the GOs.
Jacques et al. [69] degraded their 3 mm thick 12 wt% BBSA plasticized samples with additional light and heat stabilizers in deoxygenated water for 450 days with temperature ranging from 90 to 140 C. The viscosity was also tracked using rheology. Only the full graph for the degradation at 140 C was provided from GPC. The M n at equilibrium was provided for the other aging temperature. For PA11, the PDI recorded during pure hydrolysis was always around 1.9, unlike the 2.3 from PA6. The hydrolysis rate rose from 0.42 × 10 4 kg · mol 1 × day 1 at 90 C to 24.1 × 10 4 kg · mol 1 · day 1 at 140 C. It was found that the rate of condensation was 1000 faster than hydrolysis when M n or M w were under equilibrium, and this increased exponentially as temperature decreased below 90 C. We note that this was calculated from the temperature domain of this study. The data from PA11 aged at 140 C were obtained from Jacques et al. [69], and the data from Hocker et al. [59] at 100 C, and 120 C are displayed in Figure 8 below. Figure 9 displays M n at equilibrium recorded from Jacques et al. [69] but converted to M w for easier comparison using their recorded average PDI of 1.9 at 80 C after aging.
The data from Jacques et al. [69] showed that at 140 C, the M w decreases fast as expected within the first days, but seems to reach a much higher M w at equilibrium than the two neat PA11 from Hocker et al. [59] at 100 C and 120 C. This was not discussed by the authors. Both PA11 contain plasticizers and additives but likely not in the same quantity. Jacques et al. [69] mentioned that the polymer contained an unspecified amount of heat and light stabilizer as opposed to the ones from Hocker et al. [59]. The decrease and subsequent increase in M w may arise from the extraction of such additives.
On top of that, the M w at equilibrium for 140 C calculated from their tables is lower than the measurements from their graph. The calculated 28.88 kg/mol was found with the assumption that the PDI would remain the same, regardless of the aging temperature. If one takes the direct M n at equilibrium and the M w at equilibrium from the graph, a PDI of about 2.3 is calculated. When looking at the data from Meyer et al. [68], this PDI seems to sit at a lower value, closer to 1.6.
Another paper experimenting on the degradation of PA11 in water worth mentioning looked at the changes in M n and M w over time and degradation mechanisms. There, Maïza et al. [57] aged their 1.5 mm to 2.0 mm thick PA11 in deoxygenated hot dry air and deoxygenated hot water. The data for both conditions did not differ much and, in them, hydrolysis resulted in a faster reduction in M w compared to thermal degradation. The authors detected the presence of free radicals formed during the extrusion via FTIR, showcasing the importance of carefully preventing the formation of free radicals from any parts of the experiments, not solely the aging process.
The effect of pH has been briefly mentioned before, but not extensively. When one thinks of reducing the pH of an aging chamber, hydrochloric acid [68,72] or sulfuric acid [73] are often used. An earlier work from Hocker et al. [61] investigated the possibility of using organic acids instead. The authors found that not only do organic acids degrade PAs faster than inorganic acids, but the weaker the organic acid, the faster the degradation. This was attempted with acetic, propanoic, and butanoic acid at a concentration of 1.05 × 10 2 M for all three on their 250 mm to 1 cm laboratory-made thick PA11 sample. For PA11 aged in water, M w at equilibrium reached 24.4 kg/mol and 26.9 kg/mol for 100 C and 120 C respectively. The higher M w is likely an exception occurring from the small temperature difference. The rate of hydrolysis, on the contrary, increased from 0.43 × 10 1 to 1.64 × 10 1 from the temperature increase, proving again that the main effect of temperature is acceleration. Another experiment from Hocker et al. [58] was designed to determine the ductile to brittle transition. In this attempt, they also aged two PA11 samples with a thickness of 2 ± 0.5 mm and 0.3 ± 0.02 mm in water, acetic acid, and butanoic acid at 120 C. As the data originate from the same research group and consist of the same experimental setup, the results are combined and depicted in Figure 10. At 120 C, the M w of neat PA11 at equilibrium reached 26.9, 20.0, 17.0, and 14.5 kg/mol when aged in water, acetic, propanoic, and butanoic acid solutions. Acids have two effects on degradation, a hydrolysis acceleration effect as well as an amine scavenging effect. The solubility of the acid in regard to the PA is the governing factor, not its pH.
This is well represented in Figure 11, where the variations of M w over time of plasticized PA11 aged in different acidic conditions are shown.
The M w of PA11 dropped faster and reached lower values when aged in acetic acid than hydrochloric acid, despite their similar pH. Plasticized PA11 resists well against the effect of degradation due to BBSA disrupting the hydrogen bonding matrix in PA11. The correlation between M w or M n and mechanical properties is investigated in Section 5.

3. Crystallinity

3.1. Polyamide 6

The data presented here are only obtained from differential scanning calorimetry (DSC) measurements. The second heating scans and crystallinity ratios (X c ) over different aging times of 5 mm thick PA6/C from Arhant et al. [52] are shown in Figure 12 and Figure 13, respectively. The X c from the original paper was calculated from a melting enthalpy of a 100% crystalline PA6 of 118 J/g, though this value must be similar for all papers to compare results. Hence, the X c is calculated from 240 J/g instead, which is the standard used by the rest of the sources in this section as well as another paper describing the crystallization behavior of carbon fiber-reinforced PA6 [74].
Looking at the thermograms, the shape of the scans is unaffected by the increasing aging time at 120 C. The X c , on the other hand, is affected drastically as the polymer ages and the temperature rises. At 140 C, the X c rises from 18.7% to 26.7% after only 9 days. This is significantly faster than aging the polymer at 100 C, rising the X c from 18.7% to 23.5% only after 90 days.
The rise in X c is the result of chemi-crystallization, a physical process in which the shorter polymer chains, resulting from chain scission, obtain higher mobility within the matrix. This allows them reorganization of themselves from a disordered amorphous phase into new crystallites. The authors also state that the carbon fibers are not impacting chemi-crystallization as they are known to only impact the crystallinity on the polymer melt. The increase in X c looks like the decrease in molecular weight, converging towards a maximum value. The activation energy calculated from the crystallinity ratio is found to be 113 kJ/mol.
The variations of X c of 0.25 mm thick neat PA6 at 80 C from Deshoulles et al. [48] when aged under thermal oxidation, pure hydrolysis, and hydrothermal oxidation are shown in Figure 14. The X c value rises from 20 to 29% after 620 days of thermal oxidation, 32% after 700 days of pure hydrolysis, and 30% after only 21 days of hydrothermal oxidation. The increase in X c is exponential within the first day, and to some extent the first few minutes of aging except for thermal oxidation where the increase is slightly more linear. This is attributed to the formation of a monoclinic crystalline α -phase in hot water, a process separate from chemi-crystallization. Crystallinity in semi-crystalline polymers like PAs is originating from the hydrogen bonds of their amide groups. As the number of hydrogen bonds increases, so does X c . Water rearranges these bonds by also creating additional hydrogen bonds within an amorphous matrix [26,75]. This results in a faster and stronger increase in X c despite a slower rate of degradation, as shown when comparing the data to thermal oxidation.
By using M n and X c , the concentration of chain scission in the amorphous phase can be calculated. This is performed to quantify the degradation at the macromolecular scale using the following formula: S a = 1 1 X c · ( 1 M n 1 M n 0 ) , where S a is the concentration of chain scission in the amorphous phase. These concentrations are displayed in Figure 15. The data are extracted from aging at 100 C. In a similar fashion as X c , S a increases exponentially within the first day of aging and slows towards a maximum value later. Here, pure hydrolysis is shown to have a lower S a than thermal oxidation, which is in accordance with the general agreement that thermal oxidation degrades PAs faster than pure hydrolysis.
Deshoulles et al. [48] also calculated S a for pure hydrolysis after 75 days of pre-oxidation. For that mechanism, S a is higher than pure hydrolysis and thermal oxidation but still lower than hydrothermal oxidation. The reason remains the same; oxidation products like imides enhance hydrolysis by presenting more lone pairs from the carbonyl group to be attacked by water molecules.
The fast increase in X c within the first day of aging due to hot water was also shown for PA6 from an earlier work published by Deshoulles et al. [56]. The second heating scans are depicted in Figure 16. For comparison, the variations in X c of PA6/C from Arhant et al. [52] and neat 0.25 mm thick PA6 from two publications of Deshoulles et al. [55,56] aged at 120 C are shown in Figure 17.
The thermograms clearly display the increase in melting enthalpy ( Δ H m ) when looking at the integral of the signal at around 220 C. It also seems like the already appearing second shoulder at 210 C is increasing in size. This is slightly similar to the second heating scans of PA6/C in Figure 12. In an interesting way, the second heating scans of PA6 denote two melting peaks for the unaged sample, like PA66. The first melting peak is said to be attributed to the thin lamellae formed from the cooling phase, whereas the second melting peak is formed from the melting of the thickened crystals during the heating phase [76].
The drastic increase in X c during the first minute of immersion has been issued to the formation of a monoclinic phase induced by hot water. To be more precise, Deshoulles et al. [55] described it as the transition from a β -amorphous to a monoclinic α -phase, based on their wide-angle X-ray scattering analysis. This is only possible in water as when applied to thermal oxidation under the same parameters, the same results are not shown [55,56,75,77]. This phase transition is likely directly linked to plasticization. After the rapid increase in X c from 20% to 35% for both neat PA6, X c keeps on slowly increasing to an average of 50% due to chemi-crystallization. Interestingly, the data are identical for both neat PA6 sources until the very last measurement, which is not further discussed in the original literature.
The X c of PA6/C started at lower values than neat PA6 and further increased in a linear fashion, as opposed to the drastic exponential rise from the neat PA6. One major difference is the large thickness of the PA6/C sample; it was 20 times thicker. This likely means that the matrix of PA6/C is not water saturated, creating a diffusion gradient which ultimately slows down the degradation process. Additionally, the effect of reinforcement in PAs upon hydrolysis has been shown to reduce water absorption [26]. The water content of PA6/C increased from 0% to 5% within the first day of aging, while the water content of neat unreinforced PA6 increased from 0% to nearly 12.5% after similar aging time. This confirms the previous statement.
Rising the aging temperature causes the X c to rise faster and to higher values, as seen with the data from Arhant et al. [52]. Similar setup for neat PA6 from Deshoulles et al. [55] was performed in both deoxygenated water and dry air. The corresponding data are presented in Figure 18 and Figure 19, respectively. Despite a slower degradation of PA6 under pure hydrolysis, the measured X c reached higher and faster values than that of degradation under thermal oxidation. At 80 C, X c appears to converge towards about 33% after 600 days of aging. However, at 140 C, X c rises to values higher than 60% after about 100 days of aging, and this value does not appear to reach an equilibrium. This is extremely interesting as this behavior is relatively dissimilar to the changes in molecular weight, where all trends converge towards a similar value regardless of the aging temperature.

3.2. Polyamide 11

According to Da cruz et al. [50], reinforcing 0.1 mm thick PA11 with 1.0, 2.5, and 5.0 wt% graphene nanoplatelets has a negligible effect upon the polymer’s crystallinity at the start. Regardless of the degree of reinforcement, X c remained at 17%, that is, without any aging occurring yet. The authors also investigated the nature of the crystalline structures, and found that PA11 has five crystalline phases: triclinic α , monoclinic β , with three pseudo-hexagonal, a γ , a δ , and a δ ′ form, all measured through X-ray diffraction (XRD) analysis.
The influence of graphene oxide (GO) on the changes in crystallinity of 0.3 mm plasticized PA11 immersed in deoxygenated water was also investigated by Hocker et al. [59]. X c for neat PA11 and reinforced PA11 with 1 and 5 mg/g of GO had a starting value of 25 ± 1% at first. Similar to the results obtained by da Cruz et al. [50], the presence of graphene reinforcement did not influence the starting X c . After 90 days of aging at 120 C, X c increased from 25.4% to 32.3% for neat PA11, 31.1% for 1 mg/g GO reinforced PA11, and 27.0% for 5 mg/g reinforcement. This shows that the GO does hinder hydrolysis. It prevents it by competing with the hydrogen bonds of amides from PA11 and water molecules. The presence of reinforcement also impacts the water uptake ability of the PA.
Domingos et al. [62], Romão et al. [1], and Da costa et al. [51] presented the second heating scans of their stabilized aged PA11 from their DSC measurements in their article. Each PA11 had a respective thickness of 5.5 mm, 5.5 mm, and 7 mm. For the sake of comparison, these are shown side by side, respectively, in Figure 20, Figure 21 and Figure 22.
The second heating scans of unaged PA11 for all three figures do not show the same two melting temperatures peak shown for unaged PA6 like in Figure 12 and Figure 16 or even PA66. This may be indicative of the fact that PA11 does not rearrange the lamellae crystals as well as PA6 and PA66 do, if at all [76].
When observing the thermogram of PA11 aged at 110 C for 50 days shown in Figure 20, a second melting temperature peak appears. This shoulder is the melting temperature of the newly formed oligomers from hydrolysis. This new melting peak is somewhat visible on PA11 aged in oilfield water at 120 C with a pH of 5.5 after 50 days in Figure 21, and visible too for PA11 aged in salted water at 120 C with a pH of 5.5 despite 109 days of aging in Figure 22.
The two melting temperatures shift to higher values as aging progresses, interpreted by the authors as the formation of different sized crystals dispersed and homogenized in PA11. We can notice this shift in melting temperatures for the other two thermograms. It also seems that the shift converges towards a similar value of 188 C for all three scans. One source does indicate the plasticizer loss to be a potential variable [51].
We note that Da costa et al. [51] aged their PA11 in two solutions, one being a salt mixture containing compounds found in offshore oil production, and one similar but with a concentration four times higher of acetate and propionate ions. They display the exact same second heating scans, but different first heating scan. The first heating scan presented a shoulder increasing drastically in height at 175 C after 71 days. This was assimilated to a crystal phase transition induced, also referred to as the Brill transition, which converts a triclinic α crystal phase into a metastable pseudo-hexagonal smectic δ phase. The thermally induced pseudo-hexagonal phase disappears in the second heating scans, and the newly formed shoulder is attributed to the presence of smaller crystals formed by hydrolysis and plasticizer loss. The main shoulder in the first heating scan is also seen in the second one as the main peak, demonstrating a more permanent change. This corresponds to the α crystalline phase, and is the signal used to monitor the changes in crystallinity.
A publication from Maïza et al. [57], in which they failed to prevent the formation of peroxides through oxidation on their PA11, also confirmed the interpretation proposed by Da costa et al. [51].
Using the authors’ Δ H m data, X c can be extracted for the aging experiment of PA11, as the authors do not display it themselves. However, Δ H m for the standard 100% crystalline PA11 remains disputed. Da Costa et al. [51], Maïza et al. [57], da Cruz et al. [50], and Olufsen et al. [54] used a Δ H m of around 226 J/g [78], which is in agreement with other sources [79,80,81], while Hocker et al. [58,59] used 189 J/g [82] in their articles. Some other literature work [83,84,85,86,87], irrelevant to the topic of pure hydrolysis of PAs, used a Δ H m of 206 J/g as reference. Based solely on the amount of sources, the most accurate value is likely between 206 J/g and 226 J/g. Using a different standard for assessing X c does not hinder the end result of one set of data. However, we have to remain careful and aware of that when cross-analyzing different X c data.
When 226 J/g as the standard Δ H m for a 100% crystalline PA11 was used, X c rose from 10% to 20% for both solutions after 109 days of aging at 120 C. We note that the authors accounted for the mass of plasticizer in their X c calculations. Using the same reference, Domingos et al. [62] had their X c rise from 14.6% to 19.5%, close to the data by Da costa et al. [51] yet showing dissimilar second heating scans.
The cooling scans of aged PAs also draw interesting information. The scans from Domingos et al. [62] and Romão et al. [1] are shown in Figure 23 and Figure 24, respectively. The displayed peaks represent the crystallization temperature (T c ) of PA11. T c values are different for both unaged PA11; however, after 50 days of aging, they both shift to a similar higher value, all while presenting a narrower signal. This is said to be yet again originating from the formation of lower molar mass oligomers from the amorphous phase migrating to the crystalline phase [1,62,88,89].
Hocker et al. [58] aged their two 2 ± 0.5 mm and 0.3 ± 0.02 mm thick PA11 samples with 12.5 wt% BBSA at 120 C in aqueous organic acid to determine the most suitable parameter to track the ductile to brittle transition, i.e. embrittlement. The changes in X c are depicted in Figure 25. For contrast, Domingos et al., [62] also measured the Δ H m of their aging PA11, hence the converted X c values are shown in Figure 25.
We can immediately notice the slower increase in X c for PA11 aged in water at 110 C and 120 C from Domingos et al. [62] compared with the one from Hocker et al. [58] aged in water at 120 C. The only contrast is the sample thickness being larger for the two PA11. The larger thickness causes an absorption gradient in the PA11 matrix, causing water to take a lot longer to diffuse through the entire sample, thereby causing a slower degradation rate portrayed by a slower rise in X c .
The slope of the increase in X c in the first stage of aging is steeper as the organic acid weakens or resembles the chemical structure of the polyamide in question. X c was calculated from the standard Δ H m of 226 J/g. For water, X c rose from 15.5% to about 35.8% after 240 days. This comparison cannot be made with the acid measurement as it was stopped long before. Acids have a catalysis and amine scavenging effect, proven by the molecular weight data. The catalysis effect can be seen here, though the amine scavenging effect cannot be determined as the plateau has not been reached for both acids. Nevertheless, the plateau for butanoic acid does seem to lay above the one of water. We note that like other DSC data, X c does not converge in a similar way as M n .
At 120 C, the plasticized PA11 from Hocker et al. [58] had its crystallinity rise from 15.5% to about 35.8% after 240 days. At the same temperature, PA6 from [55] rose from 20% to about 52% after 200 days of aging. While the BBSA present in PA11 reduced this percentage, we can notice how high of a value X c can reach. The longer aliphatic chain in PA11 ultimately results in a slower and weaker raise in X c when aging at the same temperature and time.

4. Chemical Analysis

4.1. Polyamide 6

As degradation occurs, the long polyamides chains are cut into shorter oligomers with amines and carboxylic acid end groups. Among the papers, Fourier transform infrared spectroscopy (FTIR) has been used several times to track the changes in chemical groups of the polymers. In a paper by Alam [67], 17 O nuclear magnetic resonance (NMR) was performed on PA66 to track quantitatively the amount of carboxylic acid groups formed as a function of degradation. This work, however, does not properly control the oxygen content of the aging salt solution, implying that the combination of hydrolysis and thermal oxidation was occurring. Despite that, Alam found that the carboxylic acid group rose in number as aging progressed.
FTIR can also be used for qualitative and quantitative analysis. By applying the same baseline for all specimen graphs and the correct internal reference, we can measure the integral of the band associated with an identified functional group and quantify it. As the Beer–Lambert law states, the radiation absorbance band of a functional group, or chromophore, is proportional to its concentration [90]. Deshoulles et al. [48] used FTIR on their PA6 samples, and the results are shown in Figure 26 for their samples aged in deoxygenated water.
At first glance, we can notice a lack of strong differences between spectra in Figure 26 despite 700 days of aging, displaying the difficulty of tracking the chemical changes occurring through the pure hydrolysis of nylon. For PA6 samples subjugated to pure hydrolysis, a decrease in the bands located at 3292, 1634, and 1538 cm 1 are seen. These correspond to secondary N–H stretch, C=O amide I and II, and are the result of the depletion of amide groups in the amorphous phase. Not only are some of the bands showing the absorption of a certain functional group, but the crystalline nature of these bands is also sometimes possible to determine. According to the authors, the band at 2926 cm 1 assigned to asymmetric C–H 2 amorphous decreases in intensity while the one at 2916 cm 1 assigned to asymmetric C–H 2 crystalline increases in intensity. This is also seen for the symmetric ones at 2869 and 2856 cm 1 . These, however, are relatively hard to see in the figure.
The rise of the signal assigned to hydrogen bonded symmetric O–H at around 3500 cm 1 is not discussed by the authors, but is likely due to some water molecules still present within the polymer matrix as the signal immediately rose from unaged to 90 days and remained at the same level even after 700 days. If it was the alcohol group present on the carboxylic acids, the signal would be not only stronger, but also closer to the C–H 2 signals [91]. We note that on the FTIR spectra of PA6 aged in hot dry air, this signal is not present.
As amides are broken into carboxylic acids and amine end groups, the carbonyl region assigned with the carboxylic acid group should rise in intensity. Figure 27, Figure 28 and Figure 29 display the 1800 to 1650 cm 1 IR region of PA6 samples aged in deoxygenated water, dry air, and oxygenated water at 80 C over time.
The amide IR signals lie at around 1630 and 1530 cm 1 and are seen in all three FTIR spectra in the article. A signal is detected at around 1730 cm 1 in samples aged in dry air and two new signals at 1760 and 1730 cm 1 for samples aged in oxygenated water, all while no signals are seen for samples aged in deoxygenated water even after 700 days of aging. Deshoulles et al. [48] assigned the signal at 1760 cm 1 to C=O of isolated carboxylic acids and 1730 cm 1 to C=O of imides. The formation of imides during oxidation of polyamides has been established before, notably by Gonçalves et al. [8]. Their work also included a full chemical pathway for PA66 degraded via hydrolysis and oxidation coupled together. They were able to detect the presence of imides formed at low temperatures ranging from 40 C to 80 C after only 160 hours of aging.
While the signal for imides is expected to not be present on the IR spectra of PA6 samples aged in deoxygenated water, the lack of signal from carboxylic acids is likely due to the extremely slow degradation rate of these samples. At 80 C, pure hydrolysis is drastically slower. As mentioned in Section 2, PA6 aged in oxygenated water at the same temperature degraded 80 times faster than the ones aged in deoxygenated water when tracking the M n . The M n and X c seen in Figure 2 from Section 2 and Figure 15 from Section 3 for that sample after 700 days are, respectively, high and low as opposed to other more degraded samples. In addition, equilibrium has not been reached, and probably neither was embrittlement as well. This is discussed in Section 5.3.
The authors also proved that the imide formed during thermal oxidation is easily hydrolyzed thereafter. Since hydrolysis starts at the carbon of the carbonyl group, due to its electropositive nature, the presence of two of them likely enhances the probability of occurrence. Nonetheless, when samples are left aging in hot dry air until equilibrium, and then left to age in hot deoxygenated water, the signal at 1730 cm 1 decreases, showcasing the consumption of the imide groups. The equilibrium reached in aging PAs in dry hot air is unique to thermal oxidation, and dissimilar to pure hydrolysis.

4.2. Polyamide 11

When comparing the FTIR spectra of PA11 and PA6, the main difference is the stronger C–H 2 signals in PA11 in relation to the other bands due to the longer aliphatic chain of the polymer. Hocker et al. [59] performed FTIR on their graphene oxide (GO)-reinforced PA11 aged in deoxygenated water and investigated the ways in which they would impact the chromophores of the polymer. The FTIR spectra of unaged and aged PA11 without reinforcement are shown in Figure 30.
According to the authors, no major changes are observed when comparing the two spectra, even though, as shown in Figure 8 from Section 2, equilibrium seems to have been reached after 120 days of aging. We could argue that the 1700 to 1760 cm 1 region is rougher for the samples aged than the ones unaged, indicating that either imides or carboxylic acids are formed. The formation of imides would be illogical as the oxygen content in the water was controlled during aging. This may be solely coming from carboxylic acid group formation.
As stated earlier, the ability of certain functional groups to absorb infrared radiation is affected by crystallinity originating from the hydrogen bonds. Here, Hocker et al. [59] measured the half-height peak width of the amide III N–H stretch signal at 3309 cm 1 , which corresponds to the distribution of hydrogen bonded strength of the amide bond. It was shown that the width decreased from 54 to 34 ± 2 cm after aging, indicating a narrower distribution of hydrogen bonded strengths and hence a higher overall crystallinity content [92].
The presence of GO as reinforcement in PA11 showed a stronger signal at 1155 cm 1 than neat PA11. As this peak is assigned to the N–H stretch and O=C–N deformation, this suggests that the GOs were interacting with the N-H of the amide. This inhibits chain mobility, thereby slowing the rise in crystallinity, and then the degradation of the polymer.
Maïza et al. [57] also used FTIR to detect any changes in functional groups of their PA11. While they did remove any oxygen in the aging vessel, they stipulate that peroxides were formed during extrusion of their sample, which they used FTIR to confirm. Peroxides are products of oxidation, as hot molecular oxygen abstracts a hydrogen from the alpha carbon of the polyamide, leaving an alkyl radical at said carbon. The overall FTIR spectra are identical to the ones seen in Figure 30, with the exception of the carbonyl region from 1700 to 1760 cm 1 . Figure 31 shows the changes occurring in that region over different aging conditions.
PA11 were aged in deoxygenated water and nitrogen gas (T) for up to 60 days. No new carbonyl groups were formed when aging PA11 without air nor water, as expected, since no oxidation or hydrolysis can occur. A signal does appear for samples aged in deoxygenated water after 60 days at around 1720 cm 1 , which is likely corresponding to the formation of imides as also seen for PA6 aged with oxygen in Figure 28 and Figure 29, thus proving the presence of oxidation products from the extrusion process. This example showcases the importance of controlling the oxygen environment of the PA during the entire time of the process.

5. Mechanical Properties

5.1. Polyamide 6

The fracture toughness of a 5 mm thick PA6/C immersed in hot deoxygenated water for up to 90 days was measured. The fracture tests were made from Arhant et al. [52] using an Instron testing with a load cell of 500 N at a speed of 1 mm/min. The samples were pre-cracked to only track the crack propagation. The fracture toughness, or critical strain energy release rate (G IC ), was determined empirically from the load and displacement of the material. For display, the stress–strain curves at 100 and 140 C are shown in Figure 32 and Figure 33. The changes in G IC over time and temperature are depicted in Figure 34.
Fracture toughness decreases over time and does so drastically faster with increasing temperature. This is in correlation with the variations of molecular weight and crystallinity seen in the previous sections. The reduction in ultimate stresses for these PAs samples also aligns with the data from Bergeret et al. [63], where the ultimate stress of their PA66/30% GF fell by about 50% after aging at 120 C for 200 hours (8.3 days).
Arhant et al. [53] also published, in the same year, another work regarding the aging of PA6/C in hot deoxygenated water. Using a similar methodology, the group focused on modeling fatigue crack growth behavior at various constant energy, or Δ G, as stated in their article. Figure 35 and Figure 36 show the Hartman–Shijve representation of the fatigue crack growth of 5 mm thick PA6/C aged at 100 C and 140 C, respectively.
Hydrolysis fastens the fatigue crack growth rate from 10 7 for unaged samples to 10 6 cm after 90 days at 100 C and from 10 7 to 10 4 cm for aging samples at 140 C at a set constant Δ G of 1000 J/m 2 . When plotting their sigmoidal curves following the Hartman–Shijve representation, Arhant et al. [53] also fit their experimental data with a model that displayed an average R 2 of 0.9. An Arrhenius plot was constructed based solely on the fatigue crack growth rate, and an activation energy of 102 kJ/mol was found. The effect of degradation on the PA6/C was also readily observable using scanning electron microscopy (SEM) on fracture surfaces.
The strain at break and maximum stress were measured for 0.25 mm thick neat unstabilized PA6 aged under both pure hydrolysis and thermal oxidation separately. The data from Deshoulles et al. [55] are shown in Figure 37 and Figure 38.
The strain at break decreases exponentially over time, and temperature rises from 300% to under 10% on average, while the maximum stress retains a plateau at around 70 MPa before significantly decreasing to 0 MPa for pure hydrolysis. At 80 C and 100 C, the decrease in strain at break is not as exponential as that for the higher temperatures. The drop seen in the maximal stress happens sooner for higher aging temperatures. For thermal oxidation, the strain at break and maximum stress reached similar values as those of pure hydrolysis, although in a shorter amount of time while at the same temperature and in a different context.
Similar behavior was measured from Bernstein et al. [65] when unreinforced PA66 was aged under a 100% humidity in argon or oxygen over time. The average tensile strength remaining of the PA66 straps was measured. This percentage dropped from 100% to 24% after 60 days when the sample was exposed to water vapor at a relative humidity of 100%, a temperature of 124 C, and under argon atmosphere. When oxygen was introduced, the average fell to 18% after merely 18 days. The enhanced combined effect of hydrolysis and oxidation was also recorded for PA66. Strangely, aging PA66 straps in oxidation alone resulted in a slower rate of degradation. The average tensile strength remaining fell from 100% to 22% after 395 days. This result does not align with the fact that oxidation leads to a faster degradation, which may indicate that their aging process under argon was contaminated with water.

5.2. Polyamide 11

Samples of 0.5 mm thick heat and light stabilized with 12.5 wt% N-butyl benzenesulfonamide (BBSA) plasticizer PA11 were aged under pure hydrolysis condition, and the tensile strength was measured over time. This was performed by Mazan et al. [60,93,94] to create a multiscale model that allows the prediction of the polymer’s mechanical properties and morphological parameters. The stress–strain curve is shown in Figure 39. For comparison, the tensile strength measurements from Maïza et al. [57], performed on a 1.5–2 mm thick PA11 containing BBSA and 0.8 wt% antioxidant under pure hydrolysis and anaerobic thermal aging conditions separately at 110 C and pH 4, are shown in Figure 40.
For both graphs, at constant temperature, the strain at break occurs at lower strain with increasing aging time. This is in accordance with Figure 37. The maximum stress also seems constant throughout the different aging time, indicating that perhaps the degradation stage that induced the drop seen in Figure 38 has not occurred yet.
The Young’s modulus also increases as aging happens. Not only that, but it increases fast from unaged to the first 10 days for both graphs. This rapid change is expected to originate from the early loss of plasticizer. Mazan et al. [60] used thermogravimetric analysis (TGA) to determine the extractable content of plasticizer in PA11. They found that this amount drops from 16% to 4–2% within the first 7 days depending on the temperature. It then stagnates into a plateau. The known big early drop in M w was also expected to decrease the tensile strength and modulus, but this was not seen. According to the authors, the loss of plasticizer is enough to hide the mechanical effect caused by the initial drop in M w . Indeed, both authors claim that the first yield stress originates from the plasticization of the crystals and sliding of chains in the amorphous phase, while the increased second yield stress is due to a destruction of such crystals, resulting in a higher degree of crystallinity within the PA11 matrix.
Lastly, both authors noted a change in the mechanical behavior between 30 and 60 days. In that range, a large increase in the first yield stress was seen, and Maïza et al. [57] attributed it to the high degree of crystallinity. As the crystals grow larger during aging, they require additional energy for breakage or, i.e., to reach the second yield stress.

5.3. Determination of Embrittlement

Polymer embrittlement is a property threshold in which a polymer transitions from harboring a ductile property to a brittle one. The fragmentation of these brittle polymers into secondary plastics in the ocean is also a result of such phenomenon, often caused by chemical aging [95]. The transition is complex and dependent on the nature of the polymer. Hence, many authors aim to determine the point of embrittlement to model the lifetime of their polymer of interest. This is not exclusive to pure hydrolysis.
Arhant et al. [52,53] used fracture toughness and crack propagation rate as the tracking mechanical property embrittlement of their PA6/C. This was achieved by observing the changes in M n against these mechanical parameters. Figure 41 and Figure 42 display the impact that low M n has on G IC and crack propagation rate, respectively.
The decrease in G IC under Mode I static loading began when M n = 18 kg/mol, regardless of temperature. According to the authors, this behavior was seen before in earlier work related to neat polypropylene [96]. This value is also close to that of other semi-crystalline polymers like PET or PA11. To Arhant et al. [52], this similarity proves the impact of fibers being negligible on degradation for the modeling of embrittlement. However, following the previous data presented in this review, reinforcement does play a role in water absorption. While reinforcement may not impact the point of embrittlement, it impacs the hydrolysis degradation rate. Finally, an Arrhenius plot of fracture toughness, mass loss, X c , and M n offered an activation energy of 105, 105, 113, and 115 kJ/mol with R 2 > 0.99, indicating that the same mechanism is impacting these four parameters.
A similar behavior was seen from the variations of crack propagation rate under Mode I fatigue loading conditions, though the linearity of the measurements stopped at around M n = 15 kg/mol instead. The authors described this new threshold to be more accurate than the one using fracture toughness under static loading. According to them, when the length of the polymer chain is higher than the threshold, a crack can be spanned and an additional increase in M n cannot be measured. That is to say, after 15 kg/mol, the entanglement network between polymer chains is no longer strong enough to hinder crack propagation. PA6/C is seemingly more sensitive to cyclic loading than quasi static, which is partially thought to origin from the polymer network being unraveled under such loading. Regardless of the aging temperature, hydrolysis fastened the crack propagation rate by a decade.
Work by Olufsen et al. [54] aimed at understanding the effect of loading conditions on embrittlement and highlighted their importance. In their study, PA11 with and without 6% BBSA was aged in pH 3 butanoic acid at 120 C for accelerated aging. Instead of GPC, they used a viscometer to measure the correct inherent viscosity (CIV) of the PA11 and performed tensile tests on them. The aimed CIV levels were predetermined from the literature to be 0.7 and 1.2 dL/g. The authors showed that experimental conditions such as temperature of tensile tests, nominal strain rate, notch radius, CIV levels aimed, and initial plasticizer content yielded different responses from the test specimens aged in deoxygenated hot water. Three types of responses were considered: brittle failure with no apparent plasticity, ductile failure at necking without cold drawing, and ductile failure after cold drawing. A change from ductile to brittle failure was possible with a constant CIV level and plasticizer content. From these parameters, the resulting secant modulus (E sec ), yield stress ( σ 20 ), hardening modulus (H), and failure strain ( ε f ) were tracked. The main conditions required from the experimental variables to express a high or low response parameter are shown in Table 1.
Overall, any parameters increasing the level of stress in the material specimens yielded a brittle failure response from the tensile tests. The authors also found that the nominal strain at failure may be the issue of cold drawing rather than the material’s degradation. Apart from these details, the paper did not investigate embrittlement further.
The core of the work from Deshoulles et al. [55] was the investigation of the origin of embrittlement. The correlation between strain at break and maximal stress against M n of neat PA6 is shown in Figure 43 for strain at break and Figure 44 for maximum stress together with other published data [97,98,99,100].
When the M n of PA6 drops due to chain scission, the strain at break and maximum stress display similar values regardless of the conditions. The strain at break decreases in a logarithmic way over M n , while the maximum stress remains at around 70 MPa before dropping drastically after around 15 kg/mol as written by the authors. This correlation proves that embrittlement can be tracked and estimated by solely tracking the M n of PA6 when degraded either through hydrolysis or oxidation.
Deshoulles et al. [55] linked the decrease in strain at break to the presence of tie molecules between amorphous and crystalline phases of the PA6 matrix. Following a probability equation based on the work from Huang and Brown [101], with some adjustments from Seguela [102], the theoretical probability of tie molecules can be calculated. A relatively scattered correlation with a R 2 of 0.661 was reached for hydrolysis and oxidation combined when plotting the strain at break with the probability of tie molecules present. As the probability lowers, so does the strain at break. The high scattering is said to originate from the complexity of measuring the strain at break of an aged PA6 sample. This correlation is not applicable for maximum stress; however, the average number of entanglements (q) based on the literature and gel permeation chromatography (GPC) data can be used instead. With this, the authors found that when q < 5, the maximum stress drops regardless of the degradation mechanisms. Hence, an average of five entanglements would, in this scenario, be one of the criteria threshold for embrittlement. Deshoulles et al. [55] also listed other works showcasing a similar value for other semi-crystalline polymers like PA11 and PET degraded through oxidation or hydrolysis [13,103].
Apart from M n , X c was also plotted against the two mechanical properties; the corresponding graphs are shown in Figure 45 and Figure 46.
At first, we can notice the X c of PA6 does not harbor the same mechanical properties depending on the degradation mechanisms. This was to be expected. As mentioned in the previous section, during hydrolysis, water forms hydrogen bonds with the PA6 matrix and induces plasticization, a physical process in which the polymer not only swells, but also increases in crystallinity. This is then followed by chemi-crystallization. The correlation between strain at break and X c remains linear, but only when separating the data from pure hydrolysis and oxidation. The drop in maximal stress is only observable for the samples aged in deoxygenated water. Embrittlement seems to happen when X c > 45%, as shown from both the strain at break and maximum stress. Tracking X c is hence only usable for PAs aged in deoxygenated hot water. Olufsen et al. [54] also indicated that crystallinity can be used as an indicator for embrittlement.
Deshoulles et al. [55] also tracked the amorphous layer thickness ( l a ). This parameter can be calculated using wide-angle x-ray spectroscopy (WAXS) and GPC data. l a is thus linked to the morphology of crystal phases and molecular weight. The data for l a are showing similar trends as the ones for M n . If l a < 5 nm, PA6 harbors a brittle behavior. The authors make the claim that the relationship between l a , M n and M w is also applicable as the PDI does not change during aging. However, this is only true for pure hydrolysis. As seen in Section 2, the PDI increases for samples aged in hot dry air. Regardless, their work shows clear indications that M n and l a can be used to track embrittlement for both hydrolysis and oxidation mechanisms. X c can also be used, although only for sample degraded via pure hydrolysis. M n correlates with the one found by Arhant et al. [53] from the crack propagation rate data.
The tensile strength of the PA11 aged by Costa et al. [51] in aqueous cooling fluids containing acetate and propionate ions with a pH of 5.5 was assessed. As expected, the strain at break decreased over time from around 350% to 25% after 109 days at 120 C in a relatively exponential way. The authors tracked the CIV as well and discovered that a plateau of 1.0 dL/g was reached after 40 days of aging, all while the strain at break kept decreasing after such aging time. A TGA measurement showed that the amount of plasticizer decreased similarly to the strain at break after reaching the CIV plateau aging time. This indicates that rather than shortening the length of the polymer chains, the PA11 matrix undergoes conformational changes due to the loss of plasticizer.
The already mentioned work from Hocker et al. [58] aimed at aging PA11 with different organic acid solutions to accelerate hydrolysis. In this way, they investigated the individual importance of using molecular weights and crystallinity. The authors used tensile test measurements and defined the polymer to harbor brittle behavior once the sample reached an ultimate strain of less than 100%. Their GPC and DSC data combined with their tensile tests results are shown in Figure 47 and Figure 48, respectively.
When looking at Figure 47, a M w of PA11 samples aged in water between 30 to 40 kg/mol corresponded to an ultimate strain of 100%, while the ones aged in butanoic acid and acetic acid did not reach embrittlement at that range and possessed an ultimate strain of about 350%. This is despite the fact that the samples aged in both solutions were in a more advanced degradation state than the ones for water. On the contrary, Figure 48 shows that the correlation between Δ H fus and ultimate strain follows a linear trend, regardless of the organic acid used. This means that crystallinity is a more accurate determinant of embrittlement than chain length. For this material, when Δ H fus > 67 J/g or X c > 35%, if Δ H fus = 189 J/g for 100% crystalline PA11, embrittlement is expected regardless of molecular weight. Using a Δ H fus of 226 J/g, this X c threshold was equal to 30%. This is either way lower in value than the 45% found for PA6. This perhaps means that PA6 can hold its ductile ability better than PA11 despite high crystallinity. The lower water absorption ability of PA11 and the presence of BBSA as plasticizer are both likely dropping the crystallinity of X c in value.
There are some side notes. The authors stipulate that embrittlement has its transition onset starting at around 55–60 J/g for butanoic acid, implying that the range is relatively large. However, this can be explained by the presence of small organic acid molecules, decreasing the Δ H fus at embrittlement. These molecules diffuse themselves into the matrix depending on concentration, temperature, and solubility. The presence of BBSA is known to disrupt and reduce crystallinity, which also impacts Δ H fus at embrittlement. Hocker et al. [58] speculated that the ultimate strain would decrease by about 20%.
Equilibrium was reached for M w due to recombination for PA11 aged in water after 50 days as seen in Figure 10. At that time, Δ H fus does not reach equilibrium, but rather rises from 67 to 81 J/g after 240 days of aging, showcased in Figure 25. This increase is originating from thermal annealing according to the authors.
The shortening of chain length seen from the reduction in M w and subsequent rise in chain mobility lead to chemi-crystallization which increased X c . In other words, the two parameters are inter-connected with one another, hence their similarity in behavior. However, according to Hocker et al. [58], for the determination of embrittlement, chain scission acts more as the enabler for the formation of hydrogen bonds. These hydrogen bonds are responsible for the brittle behavior of the material.

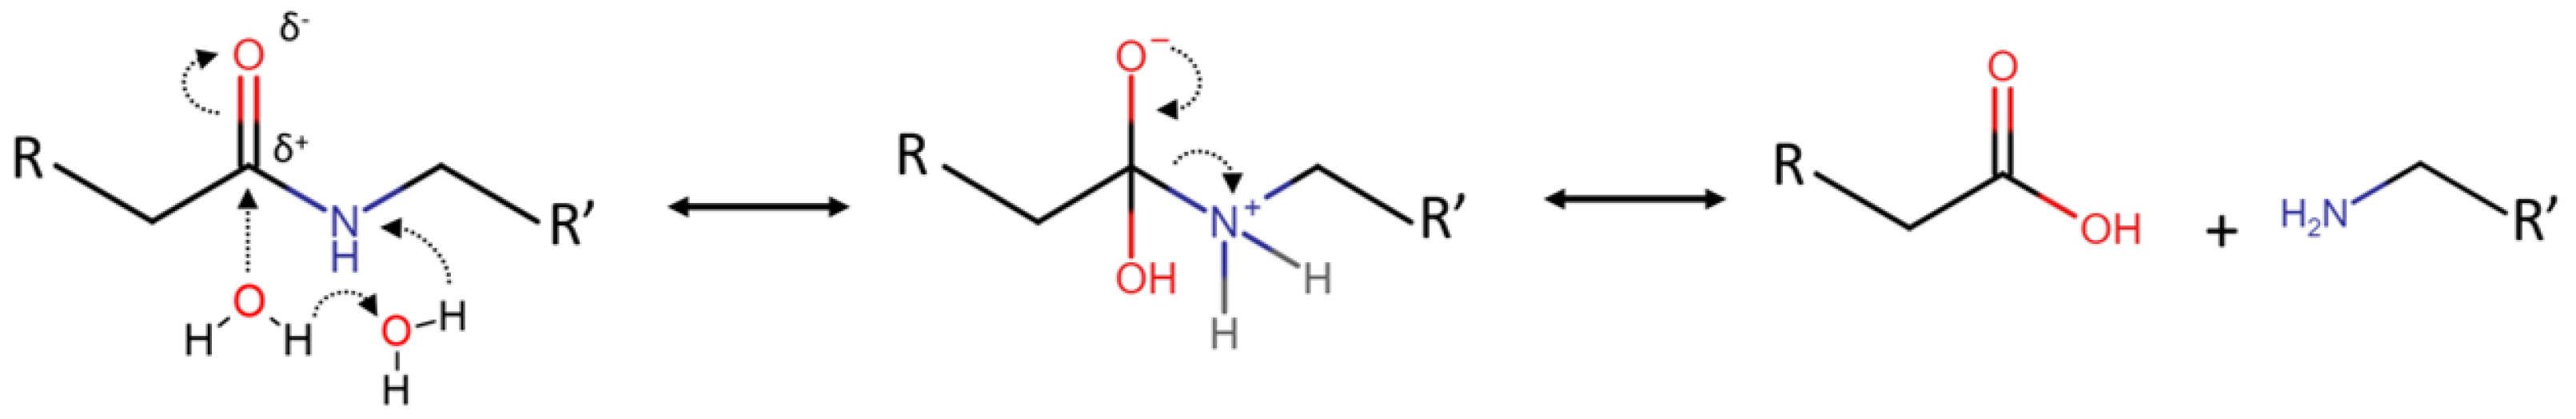
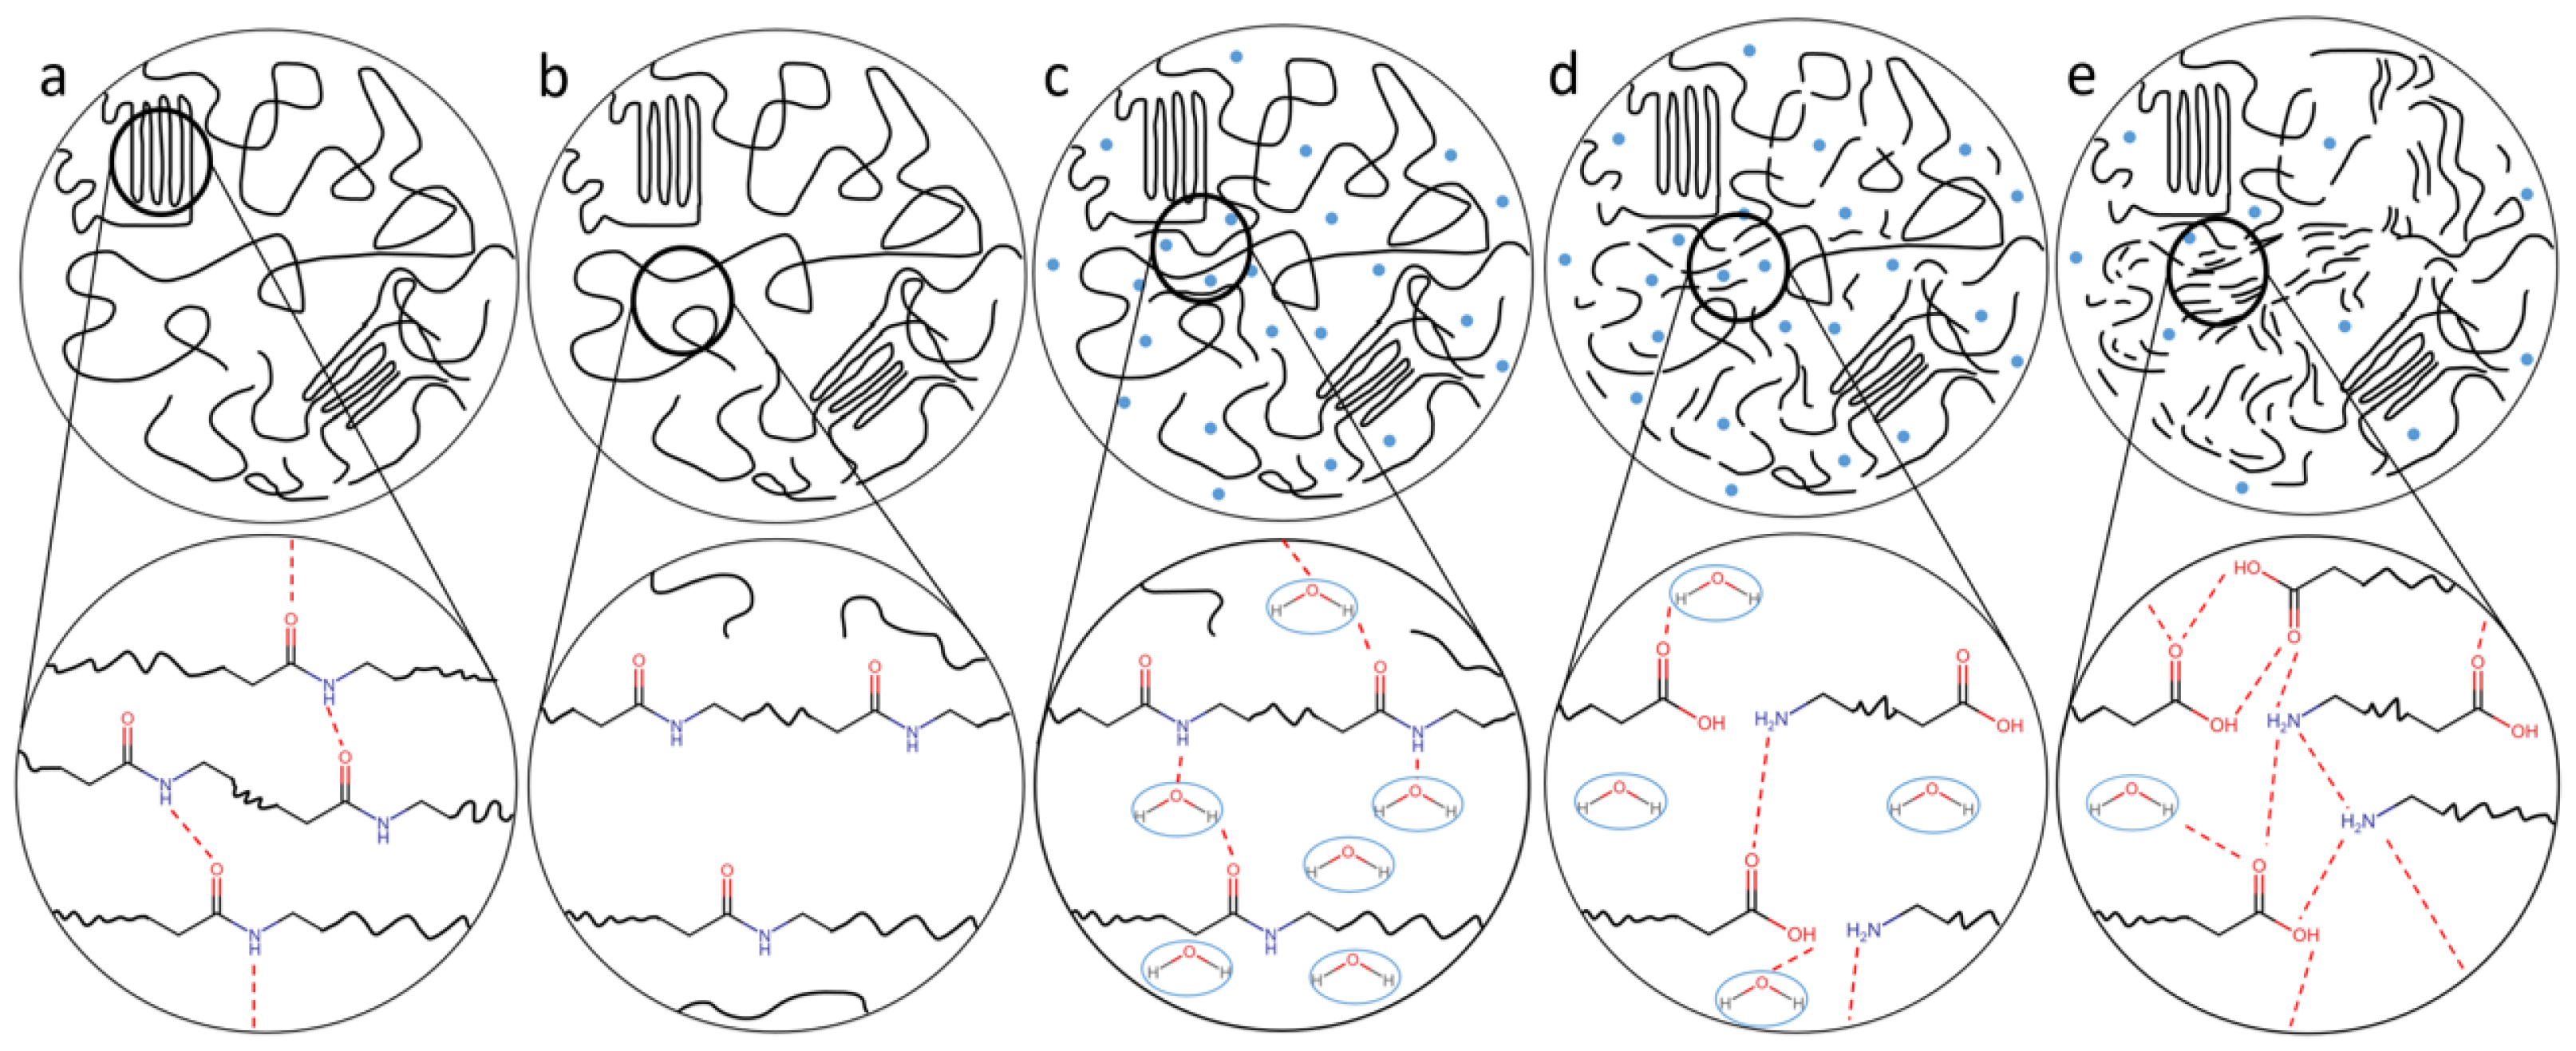
6. Mechanism Overview

Before immersion in water, the matrix of polyamide (PA) materials consists of long aliphatic chains containing amide groups in the middle as well as carboxylic acid and amine end groups, depending on the type of PA. These groups form hydrogen bonds with themselves, which makes up the α -crystalline structure of the polymer. Areas lacking such dipole–dipole interactions are β -amorphous.
Immediately after immersion, the polymer undergoes plasticization, resulting in a fast increase in crystallinity ratio, a decrease in molecular weight and mechanical strength. The water molecules diffuse through the matrix, swelling and expanding the material. The kinetics of diffusion are discussed in detail in the review written by Venoor et al. [21]. When the matrix is saturated with water, the water molecules start creating and inserting new hydrogen bonds between the polar groups of the amorphous areas of the polymer. This causes a transition from a β -amorphous to a monoclinic α -crystalline phase which is only possible when aging PAs in water. The presence of water induces water-assisted hydrolysis on the amide middle groups, provoking chain scissions randomly over the polymer chains. From a chemical point of view, two molecules of water react with the electropositive carbon of the amide carbonyl in a concerted way. Following the Grotthuss mechanism, a proton simultaneously jumps from the then-formed hydronium cation, leading to the formation of a primary amine and a carboxylic acid group [59]. The basic reaction mechanism is shown in Figure 49.
After plasticization, the material undergoes chemi-crystallization, a process in which the shorter polymer chains obtain higher mobility within the matrix which allows them reorganization into new crystallites. This is governed by the new hydrogen bonds formed between end groups and bound water. Ultimately, hydrolysis reaches chemical equilibrium where condensation rivals thermodynamically. This is shown by a stalemate in the rise of crystallinity, a decrease in molecular weight, and a decrease in mechanical strength over time. Depending on the conditions, it is likely that the PA transitioned from harboring a ductile mechanical property to a brittle one, i.e. reached embrittlement. At this point, the concentration of tie molecules between crystalline and amorphous phases as well as the number of entanglements reaches a critical threshold that results in a drastic drop in maximal stress of the material. For clarity, an illustration of changes occurring in the PA matrix over aging time is shown in Figure 50.

7. Conclusions and Perspective

To the best of our knowledge, most if not all the research relevant to the degradation understanding of polyamide (PA) under pure hydrolysis is compiled in this review. When aged in hot deoxygenated water, PA degrades through hydrolysis, decreasing its molecular weight, mechanical strength, and rising the crystallinity ratio in a logarithmic fashion over time. Increasing the temperature enhances this trend to reach the plateau faster, but can also further said plateau to reach more extreme levels. The kinetics of degradation and the changes in the molecular structure with PAs degraded under hydrolysis are also contrasted with those degraded under pure oxidation and hydrothermal oxidation. It is shown that both molecular weight and mechanical strength lessens the slowest when aging PA in deoxygenated water. The crystallinity ratio rises faster under pure hydrolysis than oxidation. The evidence of oxidation is also monitored using infrared spectroscopy by tracking the signals for imide groups.
The ductile to brittle transition or embrittlement is found to be traceable by crystallinity ratio. Molecular weight can also be used, but less so for the case of hydrolysis purely. An estimation on the molecular weight at the point of embrittlement is conducted in the cited work.
Analyzing each article also unravels gaps in the research. The question of embrittlement and which parameter to trust remains to be discussed and could be further researched by investigating the crystalline properties of PA6, PA66, and other PAs. Many factors impact the degradation of PAs in water, some more than others. Ultimately, if either crystallinity or molecular weight is found to be the most trustworthy parameter for other PAs, a model can be constructed along with all the factors listed in this review that impacts it. Models based on water absorption, water diffusion, kinetics, and more already exist, but often remain limited to the singular context in which they are made from. This review serves as a tool to glance at the work conducted on the matter and the many conclusions drawn from the data. The many graphs shown here can be used as reference for future novel research.

Author Contributions

Conceptualization, M.M.B. and J.d.C.C.; methodology, M.M.B.; validation, A.H.H.; investigation, M.M.B.; writing—original draft preparation, M.M.B.; writing—review and editing, A.H.H., A.D.D. and J.d.C.C.; visualization, M.M.B.; supervision, A.H.H., A.D.D. and J.d.C.C.; project administration, J.d.C.C.; funding acquisition, J.d.C.C. All authors have read and agreed to the published version of the manuscript.

Funding

This research was funded by Innovationsfonden (Innovation Fund Denmark), grant number 9091-00010B.

Data Availability Statement

Not applicable.

Conflicts of Interest

The authors declare no conflict of interest.

Abbreviations

The following abbreviations are used in this manuscript:
PAPolyamide
GPCGel permeation chromatography
CCarbon fiber
PDIPolydispersity index
FTIRFourier-transform infrared
BBSAN-butylbenzenesulfanomide
GOGraphene oxide
DSCDifferential scanning calorimetry
XRDX-ray diffraction
NMRNuclear magnetic resonance
SEMScanning electron microscopy
TGAThermogravimetric analysis
CIVCorrect inherent viscosity
WAXSWide-angle x-ray spectroscopy

References

  1. Romão, W.; Castro, E.R.; Filho, E.A.S.; Guimarães, R.; Silva, A.L.N.; Teixeira, S.; Paoli, M.; Sena, G.L. Ageing of polyamide 11 used in the manufacture of flexible piping. J. Appl. Polym. Sci. 2009, 114, 1777–1783. [Google Scholar] [CrossRef]
  2. El-Mazry, C.; Correc, O.; Colin, X. A new kinetic model for predicting polyamide 6-6 hydrolysis and its mechanical embrittlement. Polym. Degrad. Stab. 2012, 97, 1049–1059. [Google Scholar] [CrossRef]
  3. Shakiba, M.; Rezvani Ghomi, E.; Khosravi, F.; Jouybar, S.; Bigham, A.; Zare, M.; Abdouss, M.; Moaref, R.; Ramakrishna, S. Nylon—A material introduction and overview for biomedical applications. Polym. Adv. Technol. 2021, 32, 3368–3383. [Google Scholar] [CrossRef]
  4. Zhang, Y.; Wang, C.; Yi, Y.; Wang, W.; Yang, J. Synthesis and Properties of Polyamide 6 Random Copolymers Containing an Aromatic Imide Structure. Polymers 2023, 15, 2812. [Google Scholar] [CrossRef] [PubMed]
  5. Shamey, R.; Sinha, K. A review of degradation of nylon 6. 6 as a result of exposure to environmental conditions. Color. Technol. 2003, 33, 93–107. [Google Scholar] [CrossRef]
  6. Varghese, M.; Grinstaff, M.W. Beyond nylon 6: Polyamides via ring opening polymerization of designer lactam monomers for biomedical applications. Chem. Soc. Rev. 2022, 51, 8258–8275. [Google Scholar] [CrossRef]
  7. Grigg, M.N. Thermo-Oxidative Degradation of Polyamide 6. Ph.D. Thesis, School of Physical and Chemical Sciences Queensland University of Technology, Brisbane, Australia, 2006. [Google Scholar]
  8. Gonçalves, E.S.; Poulsen, L.; Ogilby, P.R. Mechanism of the temperature-dependent degradation of polyamide 66 films exposed to water. Polym. Degrad. Stab. 2007, 92, 1977–1985. [Google Scholar] [CrossRef]
  9. Holland, B.J.; Hay, J.N. Thermal degradation of nylon polymers. Polym. Int. 2000, 49, 943–948. [Google Scholar] [CrossRef]
  10. Ullah, I.; Gul, T.; Ali, M.; Khan, I.; Khan, W.; Asghar, H.; Saeed, K. Preparation, Analysis and UV-Accelerated Photocatalytic Degradation of Pesticide Over Mg Doped ZnO/Nylon 6,6/PMMA Ternary Blend. J. Inorg. Organomet. Polym. Mater. 2023, 33, 3441–3453. [Google Scholar] [CrossRef]
  11. Gröning, M.; Hakkarainen, M. Headspace solid-phase microextraction–a tool for new insights into the long-term thermo-oxidation mechanism of polyamide 6.6. J. Chromatogr. A 2001, 932, 1–11. [Google Scholar] [CrossRef]
  12. Vasanthan, N.; Murthy, N.; Bray, R. Investigation of Brill transition in nylon 6 and nylon 6,6 by infrared spectroscopy. Macromolecules 1998, 31, 8433–8435. [Google Scholar] [CrossRef]
  13. Okamba-Diogo, O.; Richaud, E.; Verdu, J.; Fernagut, F.; Guilment, J.; Fayolle, B. Molecular and macromolecular structure changes in polyamide 11 during thermal oxidation-Kinetic modeling. Polym. Degrad. Stab. 2014, 108, 123–132. [Google Scholar] [CrossRef]
  14. Krejsa, M.; Udipi, K.; Middleton, J. NMR Analysis of UV- and Heat-Aged Nylon-6,6. Macromolecules 1997, 30, 4695–4703. [Google Scholar] [CrossRef]
  15. Sanders, B.; Cant, E.; Amel, H.; Jenkins, M. The Effect of Physical Aging and Degradation on the Re-Use of Polyamide 12 in Powder Bed Fusion. Polymers 2022, 14, 2682. [Google Scholar] [CrossRef] [PubMed]
  16. Moore, R. The photochemical degradation of polyamides and related model N-alkylamides. Polymer 1963, 4, 493–513. [Google Scholar] [CrossRef]
  17. Levchik, S.; Weil, E.; Lewin, M. Thermal decomposition of aliphatic nylons. Polym. Int. 1999, 48, 532–557. [Google Scholar] [CrossRef]
  18. Mazry, C.E.; Hassine, M.B.; Correc, O.; Colin, X. Thermal oxidation kinetics of additive free polyamide 6-6. Polym. Degrad. Stab. 2013, 98, 22–36. [Google Scholar] [CrossRef]
  19. Forsström, D.; Terselius, B. Thermo oxidative stability of polyamide 6 films. I. Mechanical and chemical characterisation. Polym. Degrad. Stab. 2000, 67, 69–78. [Google Scholar] [CrossRef]
  20. Thanki, P.N.; Singh, R.P. Progress in the Area of Degradation and Stabilization of Nylon 66. J. Macromol. Sci.-Rev. in Macromol. Chem. Phys. 1998, 38, 595–614. [Google Scholar] [CrossRef]
  21. Venoor, V.; Park, J.H.; Kazmer, D.; Sobkowicz, M.J. Understanding the Effect of Water in Polyamides: A Review. Polym. Rev. 2021, 61, 598–645. [Google Scholar] [CrossRef]
  22. Lottier, S.; Tencé-Girault, S.; Gervat, L.; Saintier, N.; Miquelard-Garnier, G.; Fayolle, B. Effect of chemical ageing on fatigue life of short glass fiber-reinforced Polyamide 6,6. Polym. Degrad. Stab. 2023, 208, 110244. [Google Scholar] [CrossRef]
  23. He, X.; Xiao, B.; Cai, G.; Takahashi, J. Morphological, physicochemical, and flexural characterization of carbon fiber paper–reinforced polyamide 6 for long-term application in aqueous environments. J. Polym. Res. 2021, 28, 362. [Google Scholar] [CrossRef]
  24. Bäckström, E.; Odelius, K.; Hakkarainen, M. Microwave Assisted Selective Hydrolysis of Polyamides from Multicomponent Carpet Waste. Glob. Challenges 2021, 5, 2000119. [Google Scholar] [CrossRef]
  25. Harrass, K.; Mauer, S.; Tsekov, R. Resistance of glass fiber reinforced polyamide 6.6 materials to automotive cooling fluids: An analytical method for lifetime prediction. Polym. Int. 2021, 71, 724–733. [Google Scholar] [CrossRef]
  26. Zhang, C.; Liu, C.; Zhao, H.; Hu, W.; Liu, G.; Zhao, Y.; Dong, X.; Wang, K.; Zhang, J.; Li, X.; et al. Effect of nanoparticle and glass fiber on the hydrothermal aging of polyamide 6. J. Appl. Polym. Sci. 2020, 137, 49585. [Google Scholar] [CrossRef]
  27. Češarek, U.; Pahovnik, D.; Žagar, E. Chemical Recycling of Aliphatic Polyamides by Microwave-Assisted Hydrolysis for Efficient Monomer Recovery. ACS Sustain. Chem. Eng. 2020, 8, 16274–16282. [Google Scholar] [CrossRef]
  28. Lee, J.Y.; Kim, K.J. MEG Effects on Hydrolysis of Polyamide 66/Glass Fiber Composites and Mechanical Property Changes. Molecules 2019, 24, 755. [Google Scholar] [CrossRef]
  29. Sang, L.; Wang, C.; Wang, Y.; Hou, W. Effects of hydrothermal aging on moisture absorption and property prediction of short carbon fiber reinforced polyamide 6 composites. Compos. Part B Eng. 2018, 153, 306–314. [Google Scholar] [CrossRef]
  30. Li, R.; Ye, L.; Li, G. Long-Term Hydrothermal Aging Behavior and Aging Mechanism of Glass Fibre Reinforced Polyamide 6 Composites. J. Macromol. Sci. Part B 2018, 57, 67–82. [Google Scholar] [CrossRef]
  31. Ksouri, I.; Haddar, N. Long term ageing of polyamide 6 and polyamide 6 reinforced with 30% of glass fibers: Temperature effect. J. Polym. Res. 2018, 25, 153. [Google Scholar] [CrossRef]
  32. Geretschläger, K.J.; Wallner, G. Aging characteristics of glass fiber-reinforced polyamide in hot water and air. Polym. Compos. 2018, 39, 997–1005. [Google Scholar] [CrossRef]
  33. Wang, W.; Meng, L.; Leng, K.; Huang, Y. Hydrolysis of waste monomer casting nylon catalyzed by solid acids. Polym. Degrad. Stab. 2017, 136, 112–120. [Google Scholar] [CrossRef]
  34. Ksouri, I.; De Almeida, O.; Haddar, N. Long term ageing of polyamide 6 and polyamide 6 reinforced with 30% of glass fibers: Physicochemical, mechanical and morphological characterization. J. Polym. Res. 2017, 24, 133. [Google Scholar] [CrossRef]
  35. Arash, B.; Thijsse, B.J.; Pecenko, A.; Simone, A. Effect of water content on the thermal degradation of amorphous polyamide 6,6: A collective variable-driven hyperdynamics study. Polym. Degrad. Stab. 2017, 146, 260–266. [Google Scholar] [CrossRef]
  36. Gao, L.; Ye, L.; Li, G. Long-Term Hydrothermal Aging Behavior and Life-Time Prediction of Polyamide 6. J. Macromol. Sci. Part B 2015, 54, 239–252. [Google Scholar] [CrossRef]
  37. Cruz, C.; Belmonte, E.; Lux, A.; Monte, M.D.; Quaresimin, M. Multi-scale analysis of the ageing of a reinforced polyamide 66 in ethanol-based fuels. In Proceedings of the 20th International Conference on Composite Materials, Copenhagen, Denmark, 19–24 July 2015. [Google Scholar]
  38. Wang, W.; Meng, L.; Huang, Y. Hydrolytic degradation of monomer casting nylon in subcritical water. Polym. Degrad. Stab. 2014, 110, 312–317. [Google Scholar] [CrossRef]
  39. Haddar, N.; Ksouri, I.; Kallel, T.; Mnif, N. Effect of hygrothermal ageing on the monotonic and cyclic loading of glass fiber reinforced polyamide. Polym. Compos. 2014, 35, 501–508. [Google Scholar] [CrossRef]
  40. Launay, A.; Marco, Y.; Maitournam, H.; Raoult, I. Modelling the influence of temperature and relative humidity on the time-dependent mechanical behaviour of a short glass fibre reinforced polyamide. Mech. Mater. 2013, 56, 1–10. [Google Scholar] [CrossRef]
  41. Thomason, J.; Ali, J.; Anderson, J. The thermo-mechanical performance of glass-fibre reinforced polyamide 66 during glycol–water hydrolysis conditioning. Compos. Part Appl. Sci. Manuf. 2010, 41, 820–826. [Google Scholar] [CrossRef]
  42. Chen, J.; Liu, G.; Jin, L.; Ni, P.; Li, Z.; He, H.; Xu, Y.; Zhang, J.; Dong, J. Catalytic hydrolysis of waste nylon 6 to produce ϵ-caprolactam in sub-critical water. J. Anal. Appl. Pyrolysis 2010, 87, 50–55. [Google Scholar] [CrossRef]
  43. Bernstein, R.; Gillen, K.T. Nylon 6.6 accelerating aging studies: II. Long-term thermal-oxidative and hydrolysis results. Polym. Degrad. Stab. 2010, 95, 1471–1479. [Google Scholar] [CrossRef]
  44. Cribbs, D.; Ogale, A. Hydrolytic Degradation of Nylon 66 Pile Carpet Fibers. Text. Res. J. 2003, 95, 1471–1479. [Google Scholar] [CrossRef]
  45. Ishak, Z.A.M.; Berry, J.P. Hygrothermal aging studies of short carbon fiber reinforced nylon 6.6. J. Appl. Polym. Sci. 1994, 51, 2145–2155. [Google Scholar] [CrossRef]
  46. Hunt, D.G.; Darlington, M.W. Creep of nylon-6,6 during concurrent moisture changes. Polymer 1980, 21, 502–508. [Google Scholar] [CrossRef]
  47. Gac, P.Y.L.; Fayolle, B. Impact of fillers (short glass fibers and rubber) on the hydrolysis-induced embrittlement of polyamide 6.6. Compos. Part B-Eng. 2018, 153, 256–263. [Google Scholar] [CrossRef]
  48. Deshoulles, Q.; Le Gall, M.; Dreanno, C.; Arhant, M.; Priour, D.; Le Gac, P. Chemical coupling between oxidation and hydrolysis in polyamide 6-A key aspect in the understanding of microplastic formation. Polym. Degrad. Stab. 2022, 197, 109851. [Google Scholar] [CrossRef]
  49. Darzi, R.; Dubowski, Y.; Posmanik, R. Hydrothermal processing of polyethylene-terephthalate and nylon-6 mixture as a plastic waste upcycling treatment: A comprehensive multi-phase analysis. Waste Manag. 2022, 143, 223–231. [Google Scholar] [CrossRef]
  50. Da Cruz, B.d.S.M.; Tienne, L.G.P.; Gondim, F.F.; Candido, L.d.S.; Chaves, E.G.; Marques, M.d.F.V.; da Luz, F.S.; Monteiro, S.N. Graphene nanoplatelets reinforced Polyamide-11 nanocomposites thermal stability and aging for application in flexible pipelines. J. Mater. Res. Technol. 2022, 18, 1842–1854. [Google Scholar] [CrossRef]
  51. Costa, D.R.; Costa, M.F.; Grytten, F. Morphological changes of polyamide 11 through the corrected inherent viscosity plateau. J. Appl. Polym. Sci. 2022, 139, 52223. [Google Scholar] [CrossRef]
  52. Arhant, M.; Lolive, E.; Bonnemains, T.; Davies, P. A study of pure hydrolysis of carbon fibre reinforced polyamide 6 composites tested under mode I loading. Compos. Part A Appl. Sci. Manuf. 2021, 152, 106719. [Google Scholar] [CrossRef]
  53. Arhant, M.; Lolive, E.; Bonnemains, T.; Davies, P. Effect of aging on the fatigue crack growth properties of carbon-polyamide 6 thermoplastic composites using the multi ΔG-control method. Compos. Part A Appl. Sci. Manuf. 2022, 161, 107105. [Google Scholar] [CrossRef]
  54. Olufsen, S.N.; Nygård, P.; Teixeira Pais, C.I.; Perillo, G.; Hopperstad, O.S.; Clausen, A.H. Influence of loading conditions on the tensile response of degraded polyamide 11. Polymer 2021, 229, 123966. [Google Scholar] [CrossRef]
  55. Deshoulles, Q.; Gall, M.M.L.; Dreanno, C.; Arhant, M.; Stoclet, G.; Priour, D.; Gac, P.L. Origin of embrittlement in Polyamide 6 induced by chemical degradations: Mechanisms and governing factors. Polym. Degrad. Stab. 2021, 191, 109657. [Google Scholar] [CrossRef]
  56. Deshoulles, Q.; Gall, M.M.L.; Dreanno, C.; Arhant, M.; Priour, D.; Gac, P.Y.L. Modelling pure polyamide 6 hydrolysis: Influence of water content in the amorphous phase. Polym. Degrad. Stab. 2021, 183, 109435. [Google Scholar] [CrossRef]
  57. Maïza, S.; Lefebvre, X.; Brusselle-Dupend, N.; Klopffer, M.H.; Cangémi, L.; Castagnet, S.; Grandidier, J.C. Physicochemical and mechanical degradation of polyamide 11 induced by hydrolysis and thermal aging. J. Appl. Polym. Sci. 2019, 136, 47628. [Google Scholar] [CrossRef]
  58. Hocker, S.J.; Kim, W.T.; Schniepp, H.C.; Kranbuehl, D.E. Polymer crystallinity and the ductile to brittle transition. Polymer 2018, 158, 72–76. [Google Scholar] [CrossRef]
  59. Hocker, S.J.; Hudson-Smith, N.V.; Smith, P.T.; Komatsu, C.H.; Dickinson, L.R.; Schniepp, H.C.; Kranbuehl, D.E. Graphene oxide reduces the hydrolytic degradation in polyamide-11. Polymer 2017, 126, 248–258. [Google Scholar] [CrossRef]
  60. Mazan, T.; Berggren, R.; Jørgensen, J.K.; Echtermeyer, A. Aging of polyamide 11. Part 1: Evaluating degradation by thermal, mechanical, and viscometric analysis. J. Appl. Polym. Sci. 2015, 132, 41971. [Google Scholar] [CrossRef]
  61. Hocker, S.; Rhudy, A.K.; Ginsburg, G.; Kranbuehl, D.E. Polyamide hydrolysis accelerated by small weak organic acids. Polymer 2014, 55, 5057–5064. [Google Scholar] [CrossRef]
  62. Domingos, E.; Pereira, T.; Filgueiras, P.; Bueno, M.; Castro, E.R.; Guimarães, R.; Sena, G.L.; Rocha, W.F.; Romão, W. Monitoring the polyamide 11 degradation by thermal properties and X-ray fluorescence spectrometry allied to chemometric methods. X-ray Spectrom. 2013, 42, 79–86. [Google Scholar] [CrossRef]
  63. Bergeret, A.; Ferry, L.; Ienny, P. Influence of the fibre/matrix interface on ageing mechanisms of glass fibre reinforced thermoplastic composites (PA-6,6, PET, PBT) in a hygrothermal environment. Polym. Degrad. Stab. 2009, 94, 1315–1324. [Google Scholar] [CrossRef]
  64. Iwaya, T.; Sasaki, M.; Goto, M. Kinetic analysis for hydrothermal depolymerization of nylon 6. Polym. Degrad. Stab. 2006, 91, 1989–1995. [Google Scholar] [CrossRef]
  65. Bernstein, R.; Derzon, D.K.; Gillen, K.T. Nylon 6.6 accelerated aging studies: Thermal–oxidative degradation and its interaction with hydrolysis. Polym. Degrad. Stab. 2005, 88, 480–488. [Google Scholar] [CrossRef]
  66. Merdas, I.; Thominette, F.; Verdu, J. Hydrolytic ageing of polyamide 11—effect of carbon dioxide on polyamide 11 hydrolysis. Polym. Degrad. Stab. 2003, 79, 419–425. [Google Scholar] [CrossRef]
  67. Alam, T.M. Solution 17O NMR study of thermal hydrolysis in nylon 6,6. Polymer 2003, 44, 6531–6536. [Google Scholar] [CrossRef]
  68. Meyer, A.; Jones, N.; Lin, Y.; Kranbuehl, D.E. Characterizing and Modeling the Hydrolysis of Polyamide-11 in a pH 7 Water Environment. Macromolecules 2002, 44, 6531–6536. [Google Scholar] [CrossRef]
  69. Jacques, B.; Werth, M.; Merdas, I.; Thominette, F.; Verdu, J. Hydrolytic ageing of polyamide 11. 1. Hydrolysis kinetics in water. Polymer 2002, 43, 6439–6447. [Google Scholar] [CrossRef]
  70. Esmizadeh, E.; Vahidifar, A.; Shojaie, S.; Naderi, G.; Kalaei, M.R.; Mekonnen, T.H. Tailoring the properties of PA6 into high-performance thermoplastic elastomer: Simultaneous reinforcement and impact property modification. Mater. Today Commun. 2021, 26, 102027. [Google Scholar] [CrossRef]
  71. Latko-Durałek, P.; Kolbuk, D.; Kozera, R.; Boczkowska, A. Microstructural Characterization and Mechanical Properties of PA11 Nanocomposite Fibers. J. Mater. Eng. Perform. 2015, 25, 68–75. [Google Scholar] [CrossRef]
  72. Chaupart, N.; Serpe, G.; Verdu, J. Molecular weight distribution and mass changes during polyamide hydrolysis. Polymer 1998, 39, 1375–1380. [Google Scholar] [CrossRef]
  73. Abastari; Sakai, T.; Sembokuya, H.; Kubouchi, M.; Tsuda, K. Study on permeation behavior and chemical degradation of PA66 in acid solution. Polym. Degrad. Stab. 2007, 39, 1375–1380. [Google Scholar] [CrossRef]
  74. Liang, J.; Xu, Y.; Wei, Z.; Song, P.; Chen, G.; Zhang, W. Mechanical properties, crystallization and melting behaviors of carbon fiber-reinforced PA6 composites. J. Therm. Anal. Calorim. 2014, 115, 209–218. [Google Scholar] [CrossRef]
  75. Gianchandani, J.; Spruiell, J.E.; Clark, E.S. Polymorphism and orientation development in melt spinning, drawing, and annealing of nylon-6 filaments. J. Appl. Polym. Sci. 1982, 27, 3527–3551. [Google Scholar] [CrossRef]
  76. Li, L.; Li, C.Y.; Ni, C.; Rong, L.; Hsiao, B. Structure and crystallization behavior of Nylon 66/multi-walled carbon nanotube nanocomposites at low carbon nanotube contents. Polymer 2007, 48, 3452–3460. [Google Scholar] [CrossRef]
  77. Gurato, G.; Fichera, A.; Grandi, F.Z.; Zannetti, R.; Canal, P. Crystallinity and polymorphism of 6-polyamide. Die Makromol. Chem. 1974, 175, 953–975. [Google Scholar] [CrossRef]
  78. Inoue, M. Studies on crystallization of high polymers by differential thermal analysis. J. Polym. Sci. Part A Gen. Pap. 1963, 1, 2697–2709. [Google Scholar] [CrossRef]
  79. Panaitescu, D.M.; Frone, A.N.; Nicolae, C. Micro- and nano-mechanical characterization of polyamide 11 and its composites containing cellulose nanofibers. Eur. Polym. J. 2013, 49, 3857–3866. [Google Scholar] [CrossRef]
  80. Roguet, E.; Tencé-Girault, S.; Castagnet, S.; Grandidier, J.; Hochstetter, G. Micromechanisms involved in the atypical tensile behavior observed in polyamide 11 at high temperature. J. Polym. Sci. Part Polym. Phys. 2007, 45, 3046–3059. [Google Scholar] [CrossRef]
  81. Pepin, J.; Miri, V.; Lefebvre, J.M. New Insights into the Brill Transition in Polyamide 11 and Polyamide 6. Macromolecules 2016, 49, 564–573. [Google Scholar] [CrossRef]
  82. Zhang, Q.; Mo, Z.; Liu, S.; Zhang, H. Influence of Annealing on Structure of Nylon 11. Macromolecules 2000, 33, 5999–6005. [Google Scholar] [CrossRef]
  83. Ram, F.; Radhakrishnan, S.; Ambone, T.; Shanmuganathan, K. Highly Flexible Mechanical Energy Harvester Based on Nylon 11 Ferroelectric Nanocomposites. ACS Appl. Polym. Mater. 2019, 1, 1998–2005. [Google Scholar] [CrossRef]
  84. Dhanalakshmi, M.; Jog, J.P. Preparation and characterization of electrospun fibers of Nylon 11. Express Polym. Lett. 2008, 2, 540–545. [Google Scholar] [CrossRef]
  85. Fernandez, J.O.; Swallowe, G.M.; Lee, S.F. Crystallization of Nylon 11 under compressive high strain rates. J. Appl. Polym. Sci. 2001, 80, 2031–2038. [Google Scholar] [CrossRef]
  86. Benobeidallah, B.; Benhamida, A.; Dorigato, A.; Sola, A.; Messori, M.; Pegoretti, A. Structure and Properties of Polyamide 11 Nanocomposites Filled with Fibrous Palygorskite Clay. J. Renew. Mater. 2019, 7, 89–102. [Google Scholar] [CrossRef]
  87. Mago, G.; Kalyon, D.M.; Fisher, F.T. Nanocomposites of polyamide-11 and carbon nanostructures: Development of microstructure and ultimate properties following solution processing. J. Polym. Sci. Part B Polym. Phys. 2011, 49, 1311–1321. [Google Scholar] [CrossRef]
  88. Romão, W.; Franco, M.F.; Corilo, Y.E.; Eberlin, M.N.; Spinacé, M.A.; De Paoli, M.A. Poly (ethylene terephthalate) thermo-mechanical and thermo-oxidative degradation mechanisms. Polym. Degrad. Stab. 2009, 94, 1849–1859. [Google Scholar] [CrossRef]
  89. Romão, W.; Franco, M.F.; Bueno, M.I.M.; De Paoli, M.A. Distinguishing between virgin and post-consumption bottle-grade poly (ethylene terephthalate) using thermal properties. Polym. Test. 2010, 29, 879–885. [Google Scholar] [CrossRef]
  90. Wypych, G. 3-Mechanisms of UV Stabilization. In Handbook of UV Degradation and Stabilization, 2nd ed.; ChemTec Publishing: Toronto, ON, Canada, 2015; pp. 37–65. [Google Scholar] [CrossRef]
  91. Socrates, G. Infrared and Raman Characteristic Group Frequencies: Tables and Charts, 3rd ed.; Wiley: Hoboken, NJ, USA, 2001. [Google Scholar]
  92. Skrovanek, D.J.; Painter, P.C.; Coleman, M.M. Hydrogen bonding in polymers. 2. Infrared temperature studies of nylon 11. Macromolecules 1986, 19, 699–705. [Google Scholar] [CrossRef]
  93. Mazan, T.; Jørgensen, J.K.; Echtermeyer, A. Aging of polyamide 11. Part 2: General multiscale model of the hydrolytic degradation applied to predict the morphology evolution. J. Appl. Polym. Sci. 2015, 132, 42630. [Google Scholar] [CrossRef]
  94. Mazan, T.; Jørgensen, J.K.; Echtermeyer, A. Aging of polyamide 11. Part 3: Multiscale model predicting the mechanical properties after hydrolytic degradation. J. Appl. Polym. Sci. 2015, 132, 42792. [Google Scholar] [CrossRef]
  95. Andrady, A.L. The plastic in microplastics: A review. Mar. Pollut. Bull. 2017, 119, 12–22. [Google Scholar] [CrossRef]
  96. Greco, R.; Ragosta, G. Isotactic polypropylenes of different molecular characteristics: Influence of crystallization conditions and annealing on the fracture behaviour. J. Mater. Sci. 1988, 23, 4171–4180. [Google Scholar] [CrossRef]
  97. Bessell, T.J.; Hull, D.; Shortall, J.B. The effect of polymerization conditions and crystallinity on the mechanical properties and fracture of spherulitic nylon 6. J. Mater. Sci. 1975, 10, 1127–1136. [Google Scholar] [CrossRef]
  98. Fornes, T.; Yoon, P.; Keskkula, H.; Paul, D. Nylon 6 nanocomposites: The effect of matrix molecular weight. Polymer 2001, 42, 09929–09940. [Google Scholar] [CrossRef]
  99. Steeman, P.; Nijenhuis, A. The effect of random branching on the balance between flow and mechanical properties of polyamide-6. Polymer 2010, 51, 2700–2707. [Google Scholar] [CrossRef]
  100. Millot, C.; Séguéla, R.; Lame, O.; Fillot, L.A.; Rochas, C.; Sotta, P. Tensile Deformation of Bulk Polyamide 6 in the Preyield Strain Range. Micro–Macro Strain Relationships via in Situ SAXS and WAXS. Macromolecules 2017, 50, 1541–1553. [Google Scholar] [CrossRef]
  101. Huang, Y.L.; Brown, N. Dependence of slow crack growth in polyethylene on butyl branch density: Morphology and theory. J. Polym. Sci. Part B Polym. Phys. 1991, 29, 129–137. [Google Scholar] [CrossRef]
  102. Seguela, R. Critical review of the molecular topology of semicrystalline polymers: The origin and assessment of intercrystalline tie molecules and chain entanglements. J. Polym. Sci. Part B Polym. Phys. 2005, 43, 1729–1748. [Google Scholar] [CrossRef]
  103. Arhant, M.; Gall, M.L.; Gac, P.Y.L.; Davies, P. Impact of hydrolytic degradation on mechanical properties of PET-Towards an understanding of microplastics formation. Polym. Degrad. Stab. 2019, 161, 175–182. [Google Scholar] [CrossRef]
Figure 1. Changes in M n of PA6/C over time at 100, 120, 130, and 140 C when immersed in water. Data from [52].
Chemistry 06 00002 g001
Figure 2. Changes in M n of neat PA6 over time and degradation mechanisms at 80 C. Data from [48].
Chemistry 06 00002 g002
Figure 3. Changes in M n of neat PA6 over time with a pre-oxidative stage at 100 C. Data from [48].
Chemistry 06 00002 g003
Figure 4. Changes in M n for neat PA6, and PA6/C at 120 C for up to 200 and 28 days, respectively. Data from [52,56].
Chemistry 06 00002 g004
Figure 5. Changes in M n for neat PA6 without additives in deoxygenated water with varying temperatures. The dotted lines are here for illustrations and does not represent a mathematical fitting. Each reaction temperature has a shape and symbol respectively. The see-through plot in the background corresponds to the data for oxidation. Data from [55].
Chemistry 06 00002 g005
Figure 6. Changes in M n for neat PA6 without additives in dry hot air with varying temperatures. The dotted lines are here for illustrations and does not represent a mathematical fitting. Each reaction temperature has a shape and symbol respectively. The see-through plot in the background corresponds to the data for hydrolysis. Data from [55].
Chemistry 06 00002 g006
Figure 7. Changes in M w for neat PA11 at 90 C and 135 C for up to 260 days. Data from [68].
Chemistry 06 00002 g007
Figure 8. Changes in M w for plasticized PA11 aged at 100 C, 120 C, and 140 C. Data from [59,69].
Chemistry 06 00002 g008
Figure 9. Series of reached M w at equilibrium from aged PA11 at varying temperatures. Data from [69].
Chemistry 06 00002 g009
Figure 10. Variations of M w for PA11 in different acidic conditions at 120 C. Data combined from both works of Hocker et al. [58,61].
Chemistry 06 00002 g010
Figure 11. Variations of M w for stabilized PA11 in different acidic conditions at 100 C. Data from the second work of Hocker et al. [58].
Chemistry 06 00002 g011
Figure 12. Second heating scans of PA6/C as a function of time at 120 C. Data from [52].
Chemistry 06 00002 g012
Figure 13. Variations in X c of PA6/C as a function of time and temperature. Data from [52].
Chemistry 06 00002 g013
Figure 14. Changes in X c of neat PA6 over time and the three different degradation mechanisms investigated at 80 C with a starting X c of 20%. Data from [48].
Chemistry 06 00002 g014
Figure 15. Concentration of chain scission in the amorphous phase of neat PA6 over time and degradation mechanisms at 100 C. Data from [48].
Chemistry 06 00002 g015
Figure 16. Second heating scans of neat PA6 with varying aging time at 120 C. Data from [56].
Chemistry 06 00002 g016
Figure 17. Variations of X c for PA6/C and neat PA6 over time at 120 C. Data from [52,55,56].
Chemistry 06 00002 g017
Figure 18. Variations of X c for neat PA6 over time at different temperature under pure hydrolysis condition. The dotted lines are here for illustrations and does not represent a mathematical fitting. Each reaction temperature has a shape and symbol respectively. The see-through plot in the background corresponds to the data for oxidation. Data from [55].
Chemistry 06 00002 g018
Figure 19. Variations of X c for neat PA6 over time at different temperature under thermal oxidation condition. The dotted lines are here for illustrations and does not represent a mathematical fitting. Each reaction temperature has a shape and symbol respectively. The see-through plot in the background corresponds to the data for hydrolysis. Data from [55].
Chemistry 06 00002 g019
Figure 20. Second heating scans of PA11 aged in water at 110 C at pH 7.0. Data from [62].
Chemistry 06 00002 g020
Figure 21. Second heating scans of PA11 aged in oilfield water at 120 C at pH 5.5. Data from [1].
Chemistry 06 00002 g021
Figure 22. Second heating scans of PA11 aged in salted water at 120 C at pH 5.5. Data from [51].
Chemistry 06 00002 g022
Figure 23. Cooling scans of PA11 aged in water at 110 C at pH 7.0. Data from [62].
Chemistry 06 00002 g023
Figure 24. Cooling scans of PA11 aged in oilfield water at 120 C at pH 5.5. Data from [1].
Chemistry 06 00002 g024
Figure 25. Variations of X c for plasticized PA11 over time at 120 C with different organic acids, along with another plasticized PA11 aged in water at 120 C and 110 C. Data for water, acetic, and butanoic acid from [58] and for water at 110 and 120 C from [62].
Chemistry 06 00002 g025
Figure 26. Infrared spectra of PA6 aged in deoxygenated hot water at 80 C over time. Data from [48]. We note that, as the spectra were stacked on top of each other, the data extraction was trivial, and some minor negligible variations may be present.
Chemistry 06 00002 g026
Figure 27. Infrared carbonyl region of PA6 aged in pure water at 80 C. Data from [48].
Chemistry 06 00002 g027
Figure 28. Infrared carbonyl region of PA6 aged in dry air at 80 C. Data from [48].
Chemistry 06 00002 g028
Figure 29. Infrared carbonyl region of PA6 aged in oxygenated water at 80 C. Data from [48].
Chemistry 06 00002 g029
Figure 30. Infrared spectra of PA11 aged in deoxygenated hot water at 120 C for 120 days. The signals of interest are labelled. Data from [59].
Chemistry 06 00002 g030
Figure 31. Infrared carbonyl region of PA6 aged in deoxygenated water and nitrogen gas (T) at 110 C and pH 4. Data from [57].
Chemistry 06 00002 g031
Figure 32. Stress–strain curves of PA6/C aged at 100 C over time. Adapted with permission from ref. [52]. Copyright © 2021 Elsevier Ltd.
Chemistry 06 00002 g032
Figure 33. Stress-strain curves of PA6/C aged at 140 C over time. Adapted with permission from ref. [52]. Copyright © 2021 Elsevier Ltd.
Chemistry 06 00002 g033
Figure 34. Changes in G IC of PA6/C over time and temperature. Adapted with permission from ref. [52]. Copyright © 2021 Elsevier Ltd.
Chemistry 06 00002 g034
Figure 35. Plot of fatigue crack growth rate against Δ G over time at 100 C with model fit. Data from [53].
Chemistry 06 00002 g035
Figure 36. Plot of fatigue crack growth rate against Δ G over time at 140 C with model fit. Data from [53].
Chemistry 06 00002 g036
Figure 37. Strain at break of PA6 under pure hydrolysis or thermal oxidation over time and temperature. Data from [55].
Chemistry 06 00002 g037
Figure 38. Maximum stress of PA6 under pure hydrolysis or thermal oxidation over time and temperature. Data from [55].
Chemistry 06 00002 g038
Figure 39. The stress–strain curve of PA11 under pure hydrolysis over time at 120 C. The unit of strain is unspecified. Data from [60].
Chemistry 06 00002 g039
Figure 40. The stress–strain curve of PA11 under pure hydrolysis and anaerobic thermal (T) aging over time at 110 C. Data from [57].
Chemistry 06 00002 g040
Figure 41. Fracture toughness of PA6/C aged at varying temperature against M n with trendline. Adapted with permission from ref. [52]. Copyright © 2021 Elsevier Ltd.
Chemistry 06 00002 g041
Figure 42. Crack propagation rate of PA6/C aged at varying temperature against M n with trendline. Adapted with permission from ref. [53]. Copyright © 2022 Elsevier Ltd.
Chemistry 06 00002 g042
Figure 43. Strain at break against M n under pure hydrolysis and oxidation with linear correlation for neat PA6. Adapted with permission from ref. [55]. Copyright © 2021 Elsevier Ltd.
Chemistry 06 00002 g043
Figure 44. Maximum stress against M n under pure hydrolysis and oxidation for neat PA6. The dotted line showcases the M n at which the maximum stress drops. Data from [55], the triangle, square, diamond, and circle symbols are from the following sources respectively [97,98,100].
Chemistry 06 00002 g044
Figure 45. Strain at break against X c under pure hydrolysis and oxidation condition with linear correlation for neat PA6. Adapted with permission from ref. [55]. Copyright © 2021 Elsevier Ltd.
Chemistry 06 00002 g045
Figure 46. Maximum stress against X c under pure hydrolysis and oxidation condition for neat PA6. Adapted with permission from ref. [55]. Copyright © 2021 Elsevier Ltd.
Chemistry 06 00002 g046
Figure 47. Correlation between ultimate strain and M w of PA11 aged in water and organic acids. Adapted with permission from ref. [58]. Copyright © 2018 Elsevier Ltd.
Chemistry 06 00002 g047
Figure 48. Correlation between ultimate strain and melting enthalpy ( Δ H fus ) of PA11 aged in water and organic acids. Adapted with permission from ref. [58], Copyright © 2018 Elsevier Ltd.
Chemistry 06 00002 g048
Figure 49. Reaction mechanism of water-assisted hydrolysis of amide groups.
Chemistry 06 00002 g049
Figure 50. Illustration of the changes occurring within the PA matrix when aging in deoxygenated water. (a) Crystalline phase before immersion in water, (b) amorphous region before immersion, (c) plasticization with free and hydrogen bound water, (d) chain scission due to hydrolysis, (e) chemi-crystallization. The blue circles and red dotted lines represent water molecules and hydrogen bonds.
Chemistry 06 00002 g050
Table 1. The principal effects of experimental variable upon the physical response parameters from tensile testing of PA11. The gray background represents a lack of data/correlation. Data from [54].
TemperatureStrain RateNotch RadiusCIVPlasticizer
High E sec LowHigh--Low
High σ 20 -HighHighLowLow
Low H-HighHigh--
Low ε f ---Low-
Disclaimer/Publisher’s Note: The statements, opinions and data contained in all publications are solely those of the individual author(s) and contributor(s) and not of MDPI and/or the editor(s). MDPI and/or the editor(s) disclaim responsibility for any injury to people or property resulting from any ideas, methods, instructions or products referred to in the content.

