

Blue-Emitting 2D- and 3D-Zinc Coordination Polymers Based on Schiff-Base Amino Acid Ligands

 , , and
Abstract
:
1. Introduction
2. Materials and Methods
2.1. Characterization
2.2. X-ray Diffraction
3. Results and Discussion
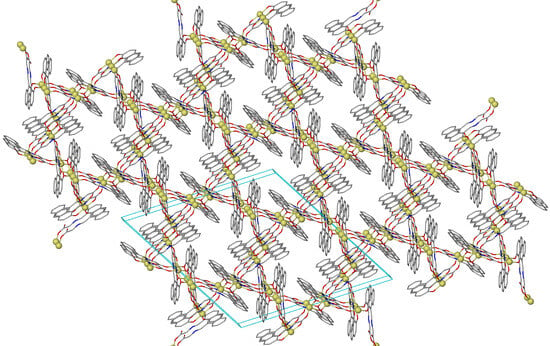
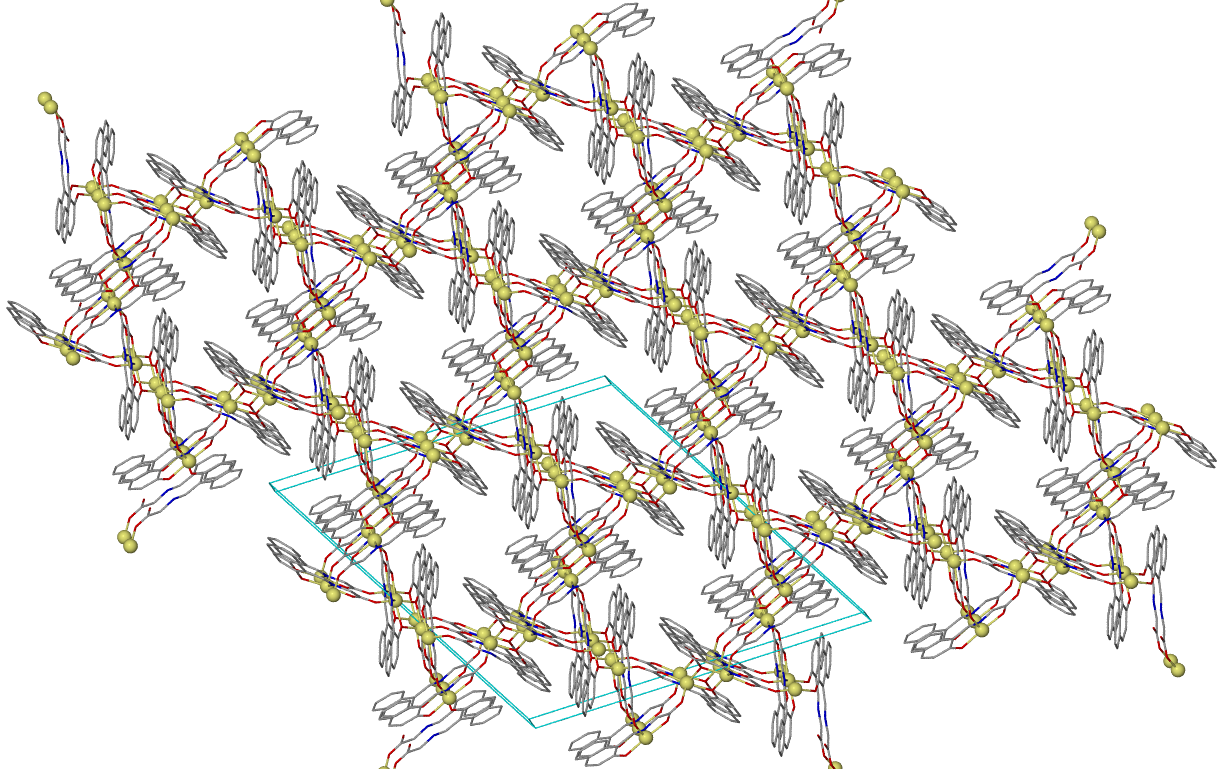
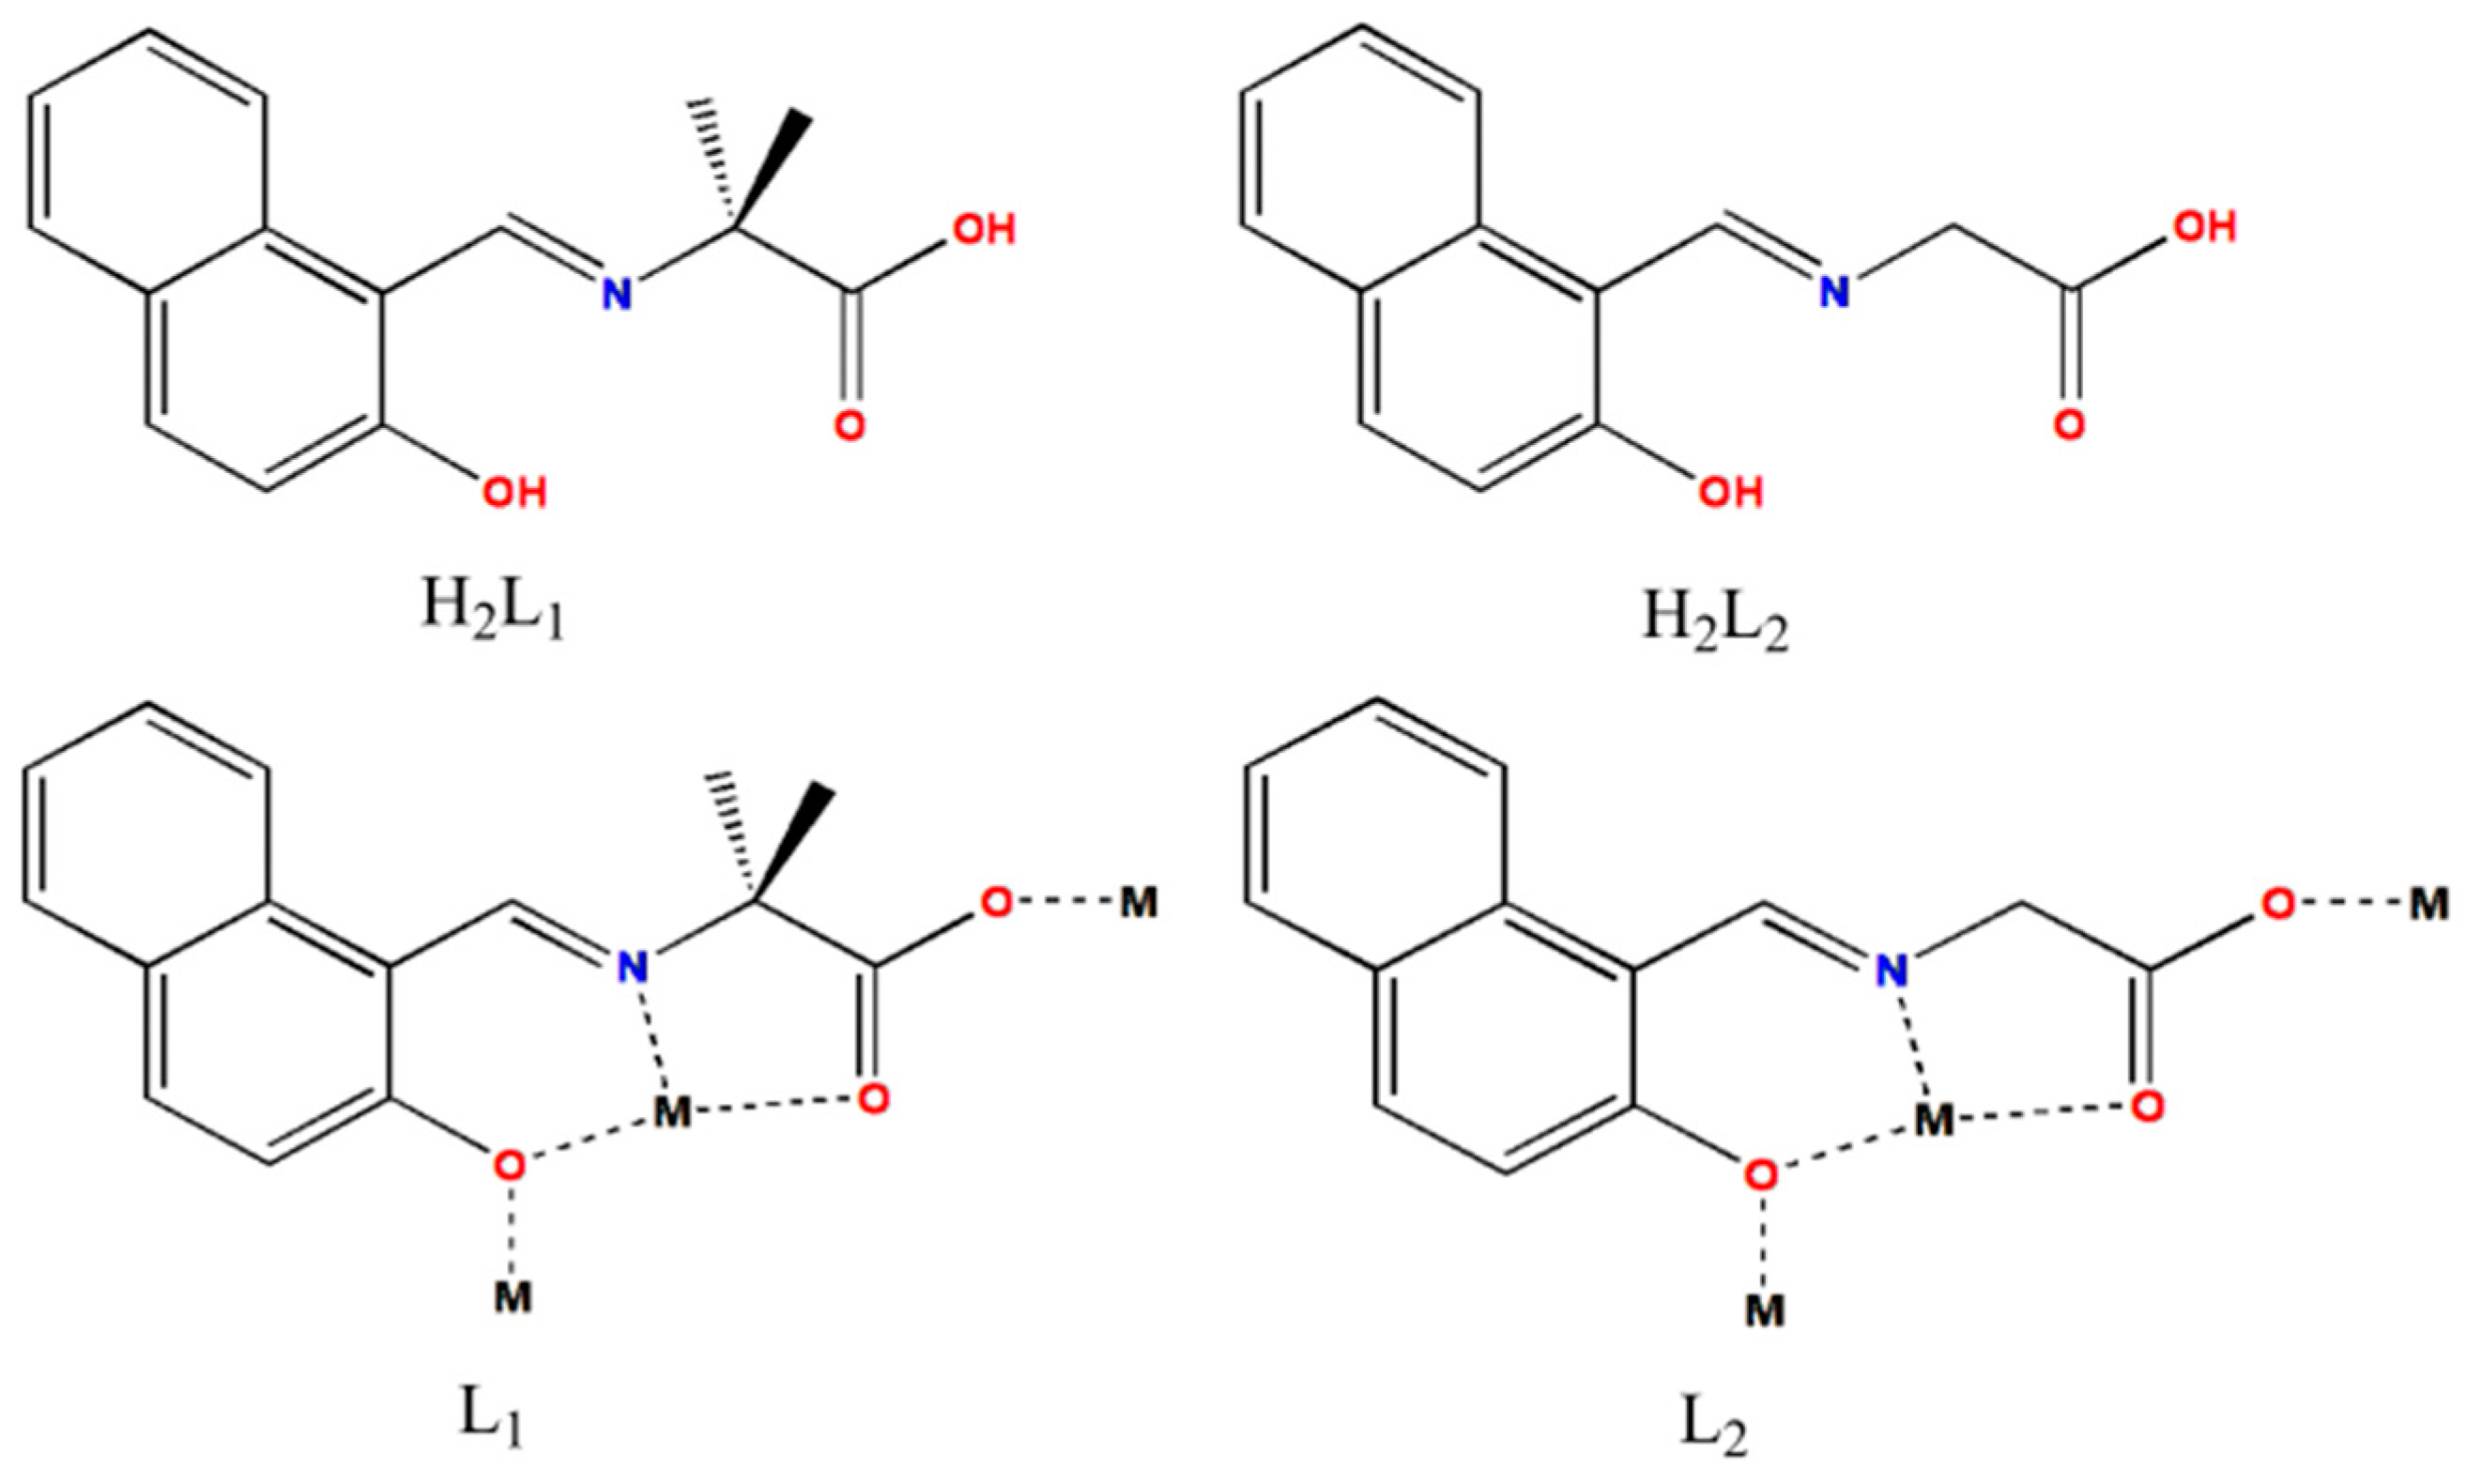
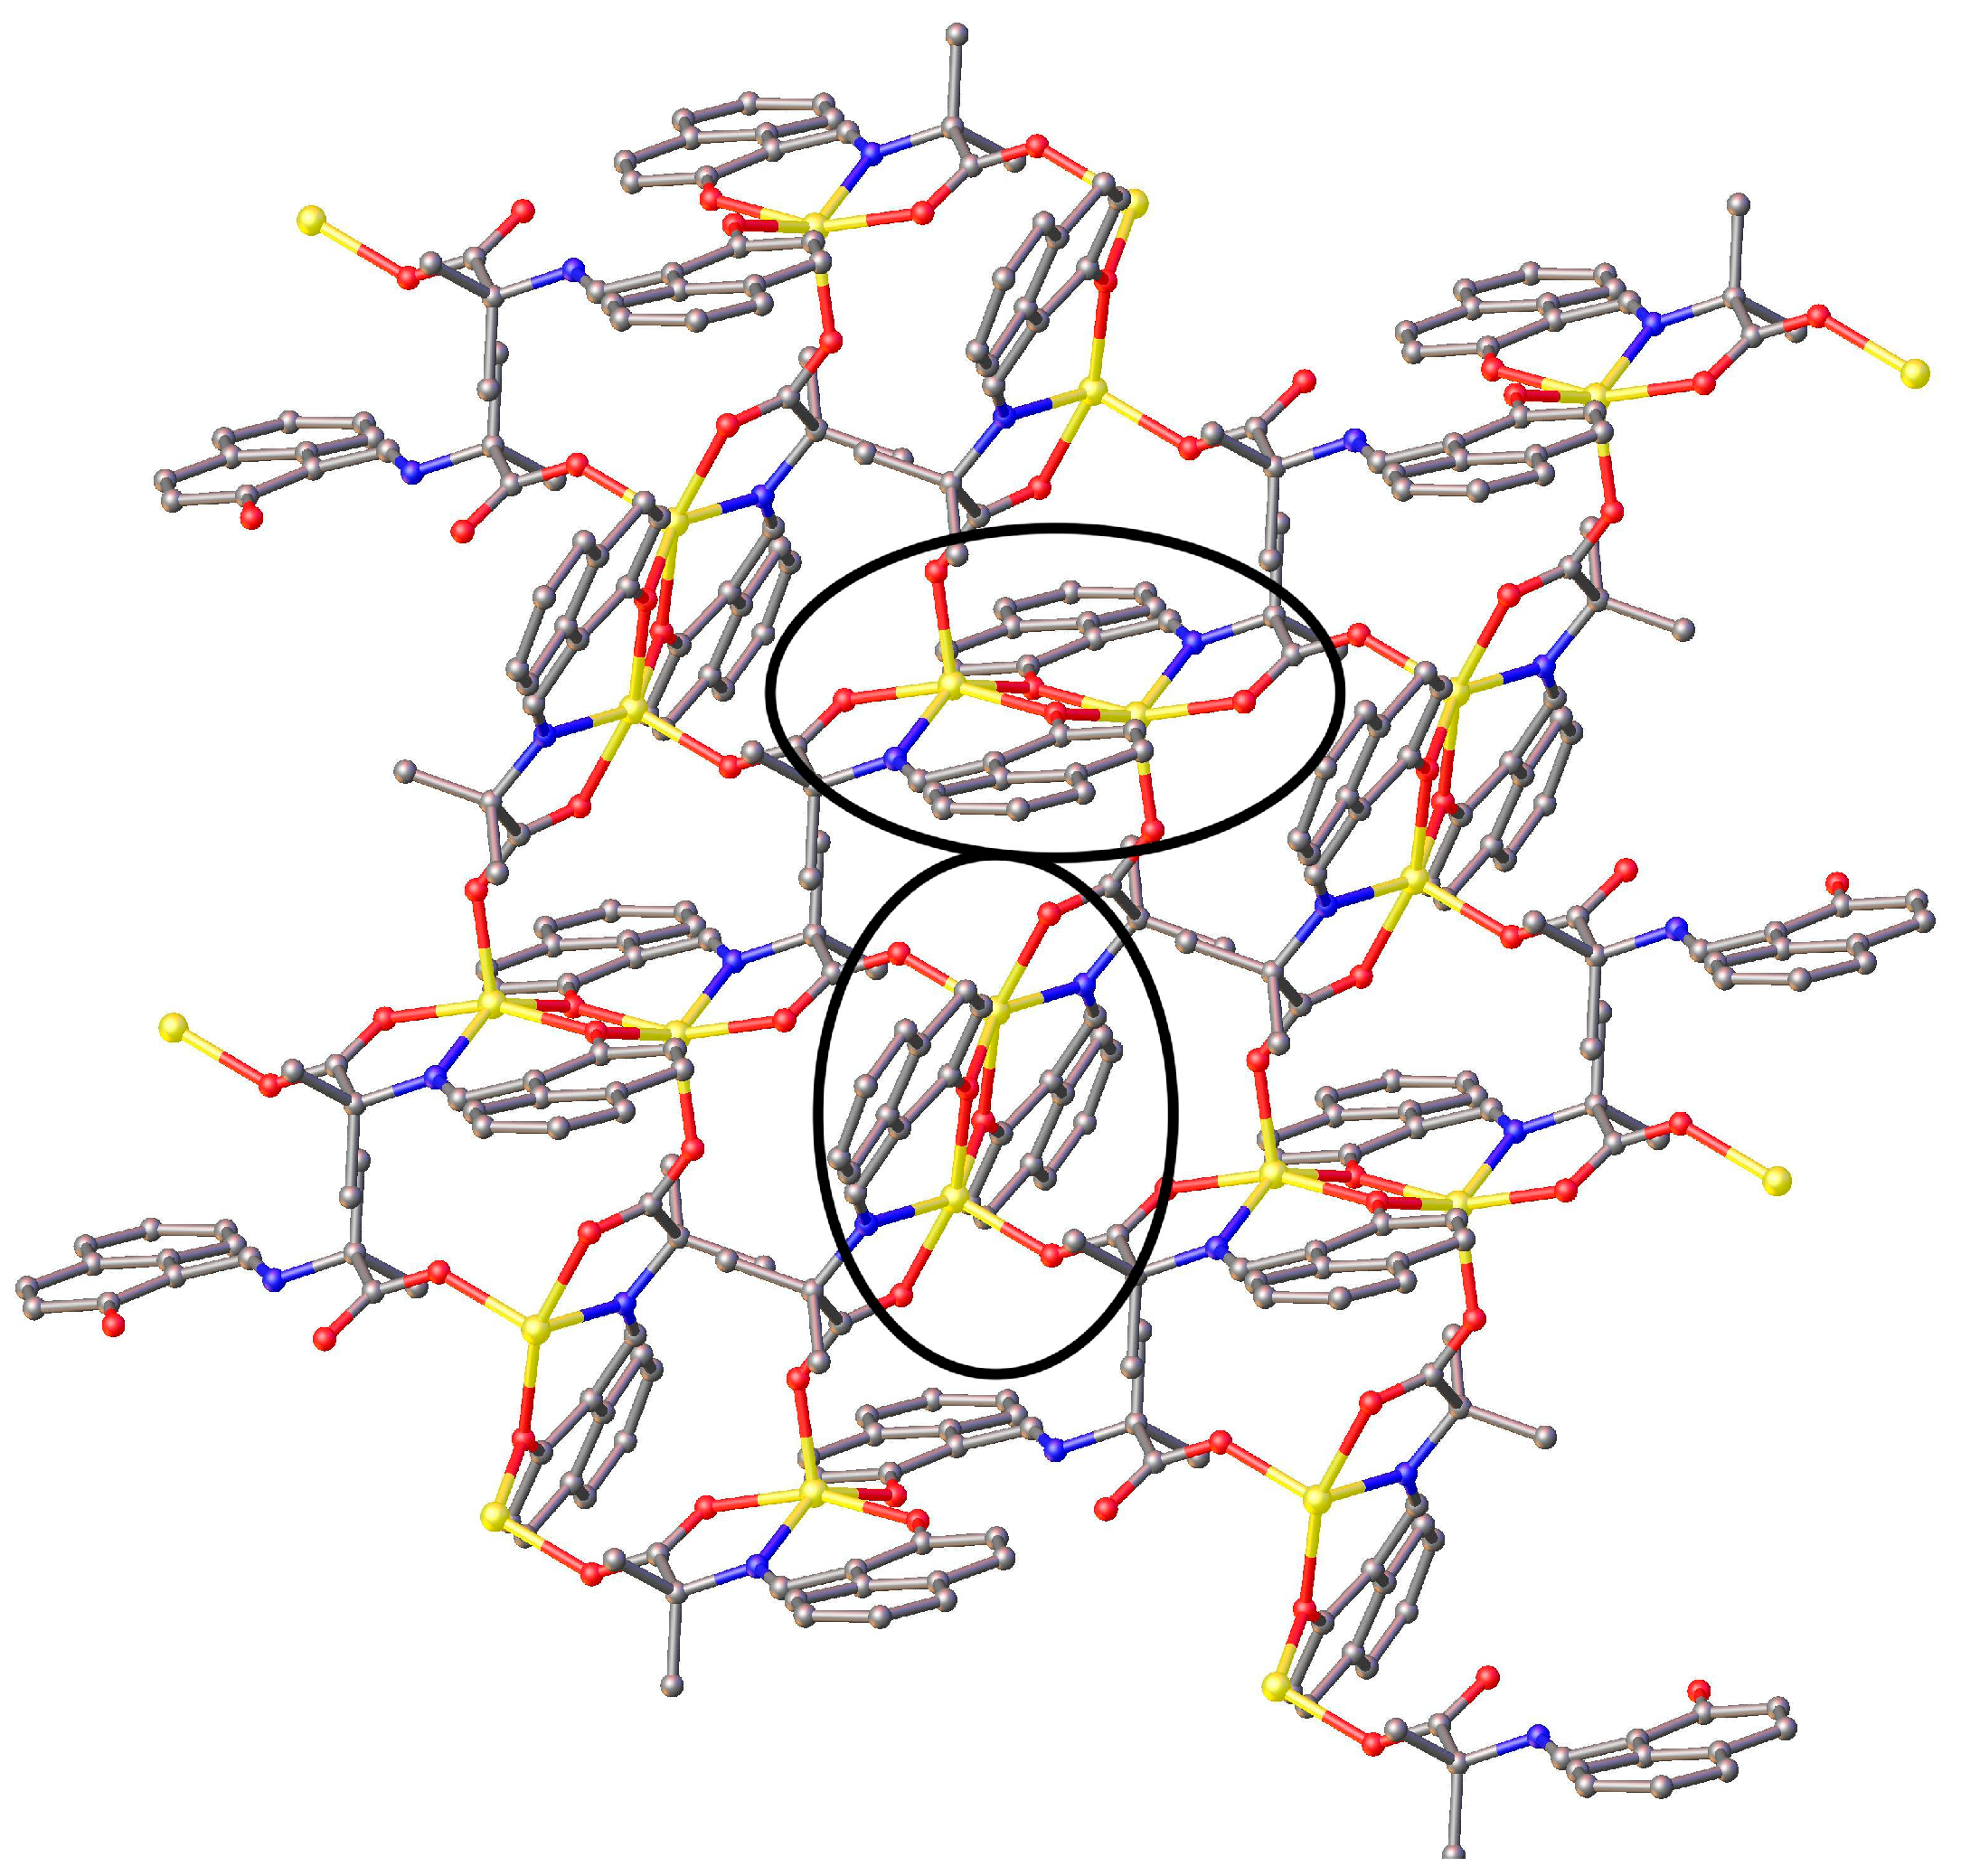
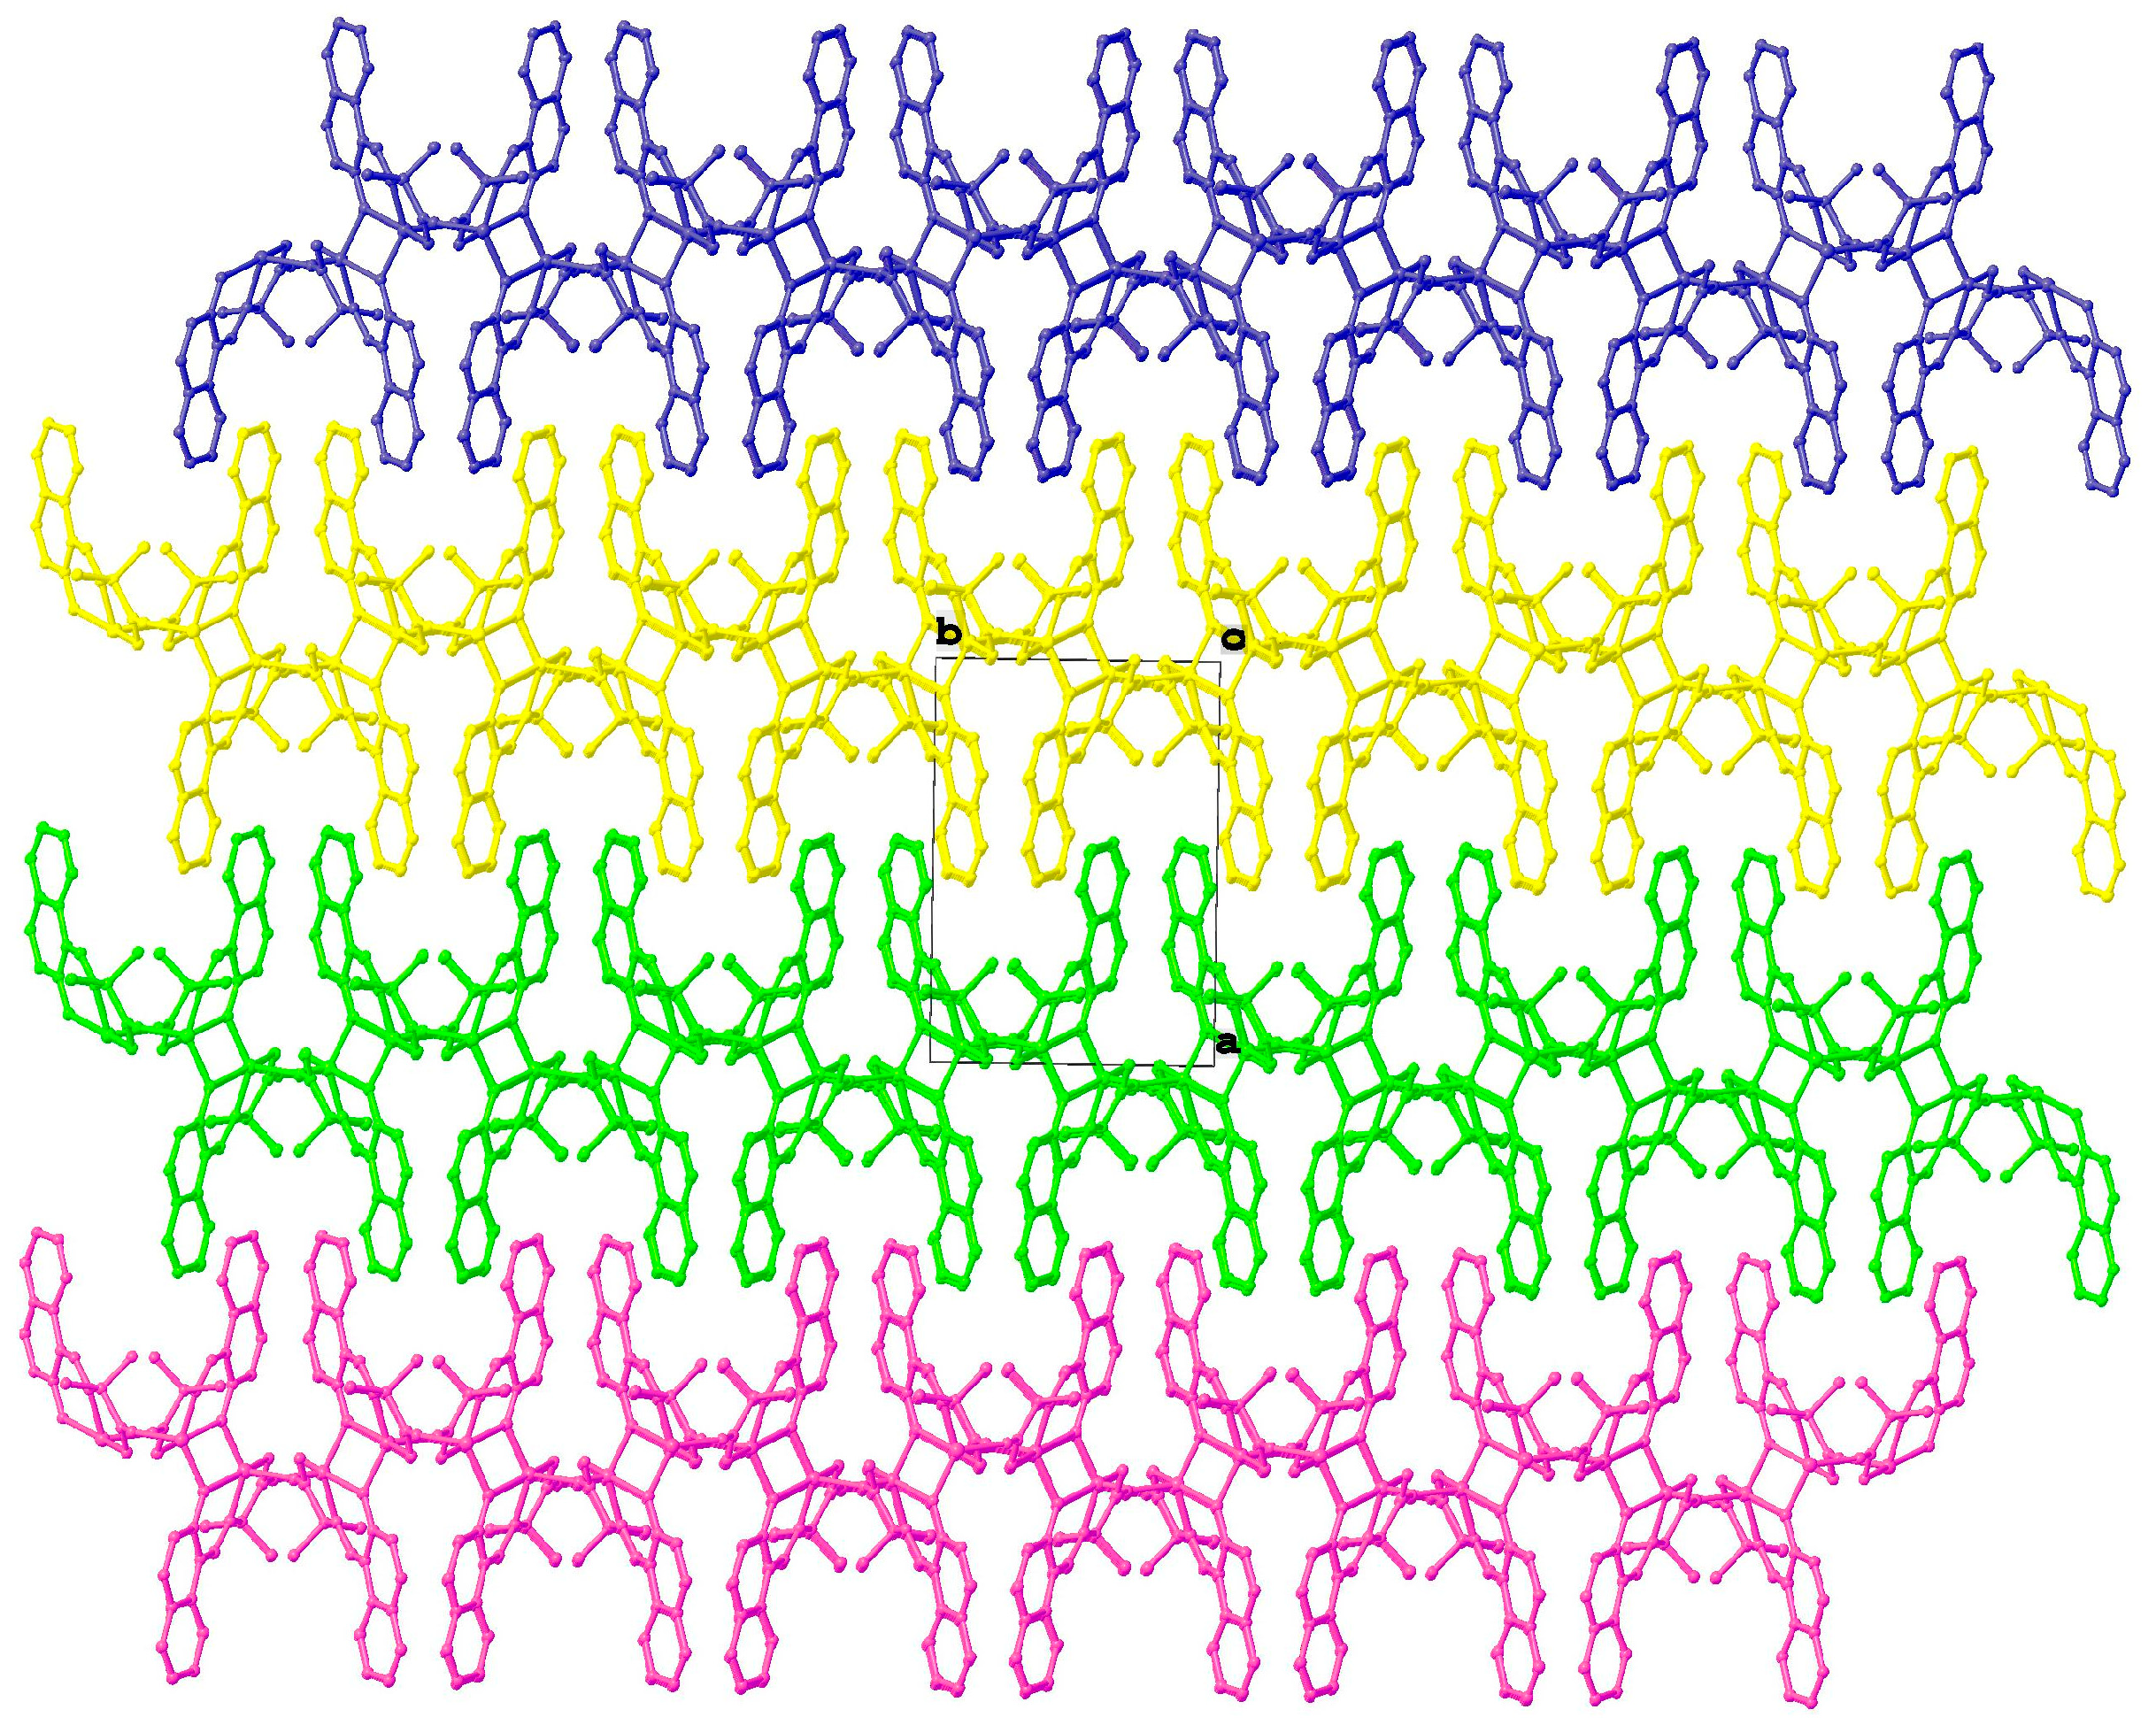
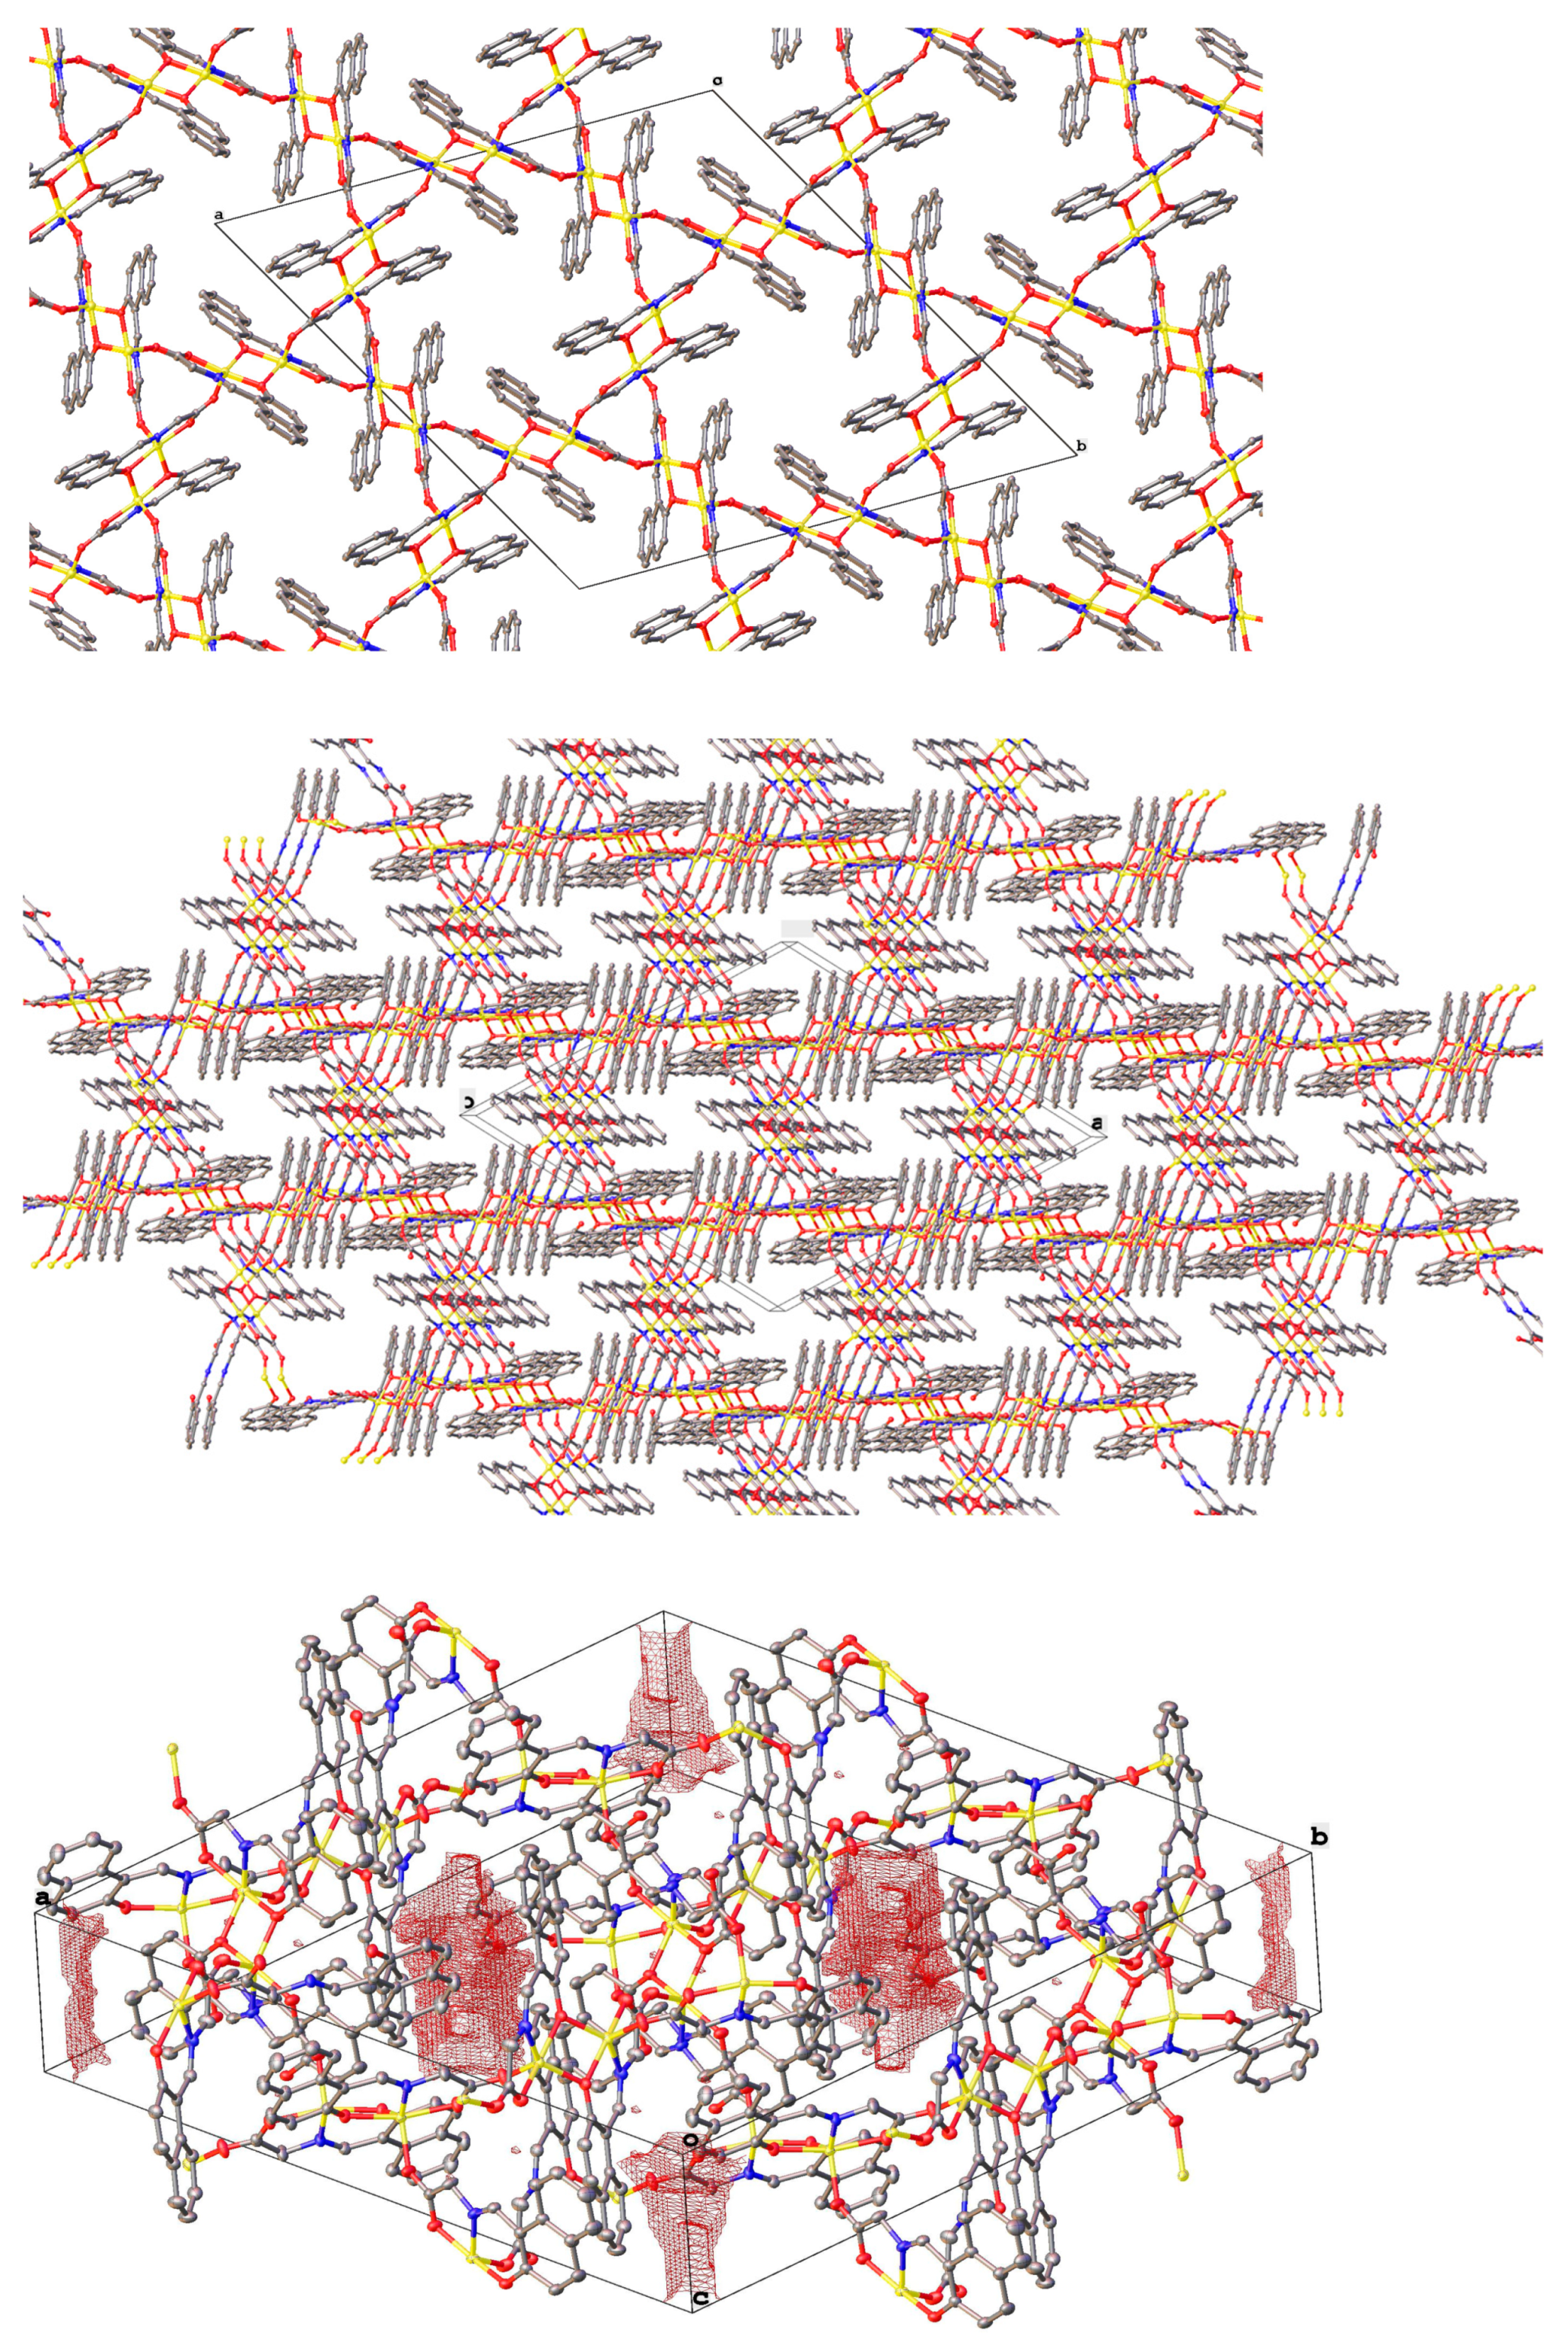
3.1. Synthesis and Crystal Structures
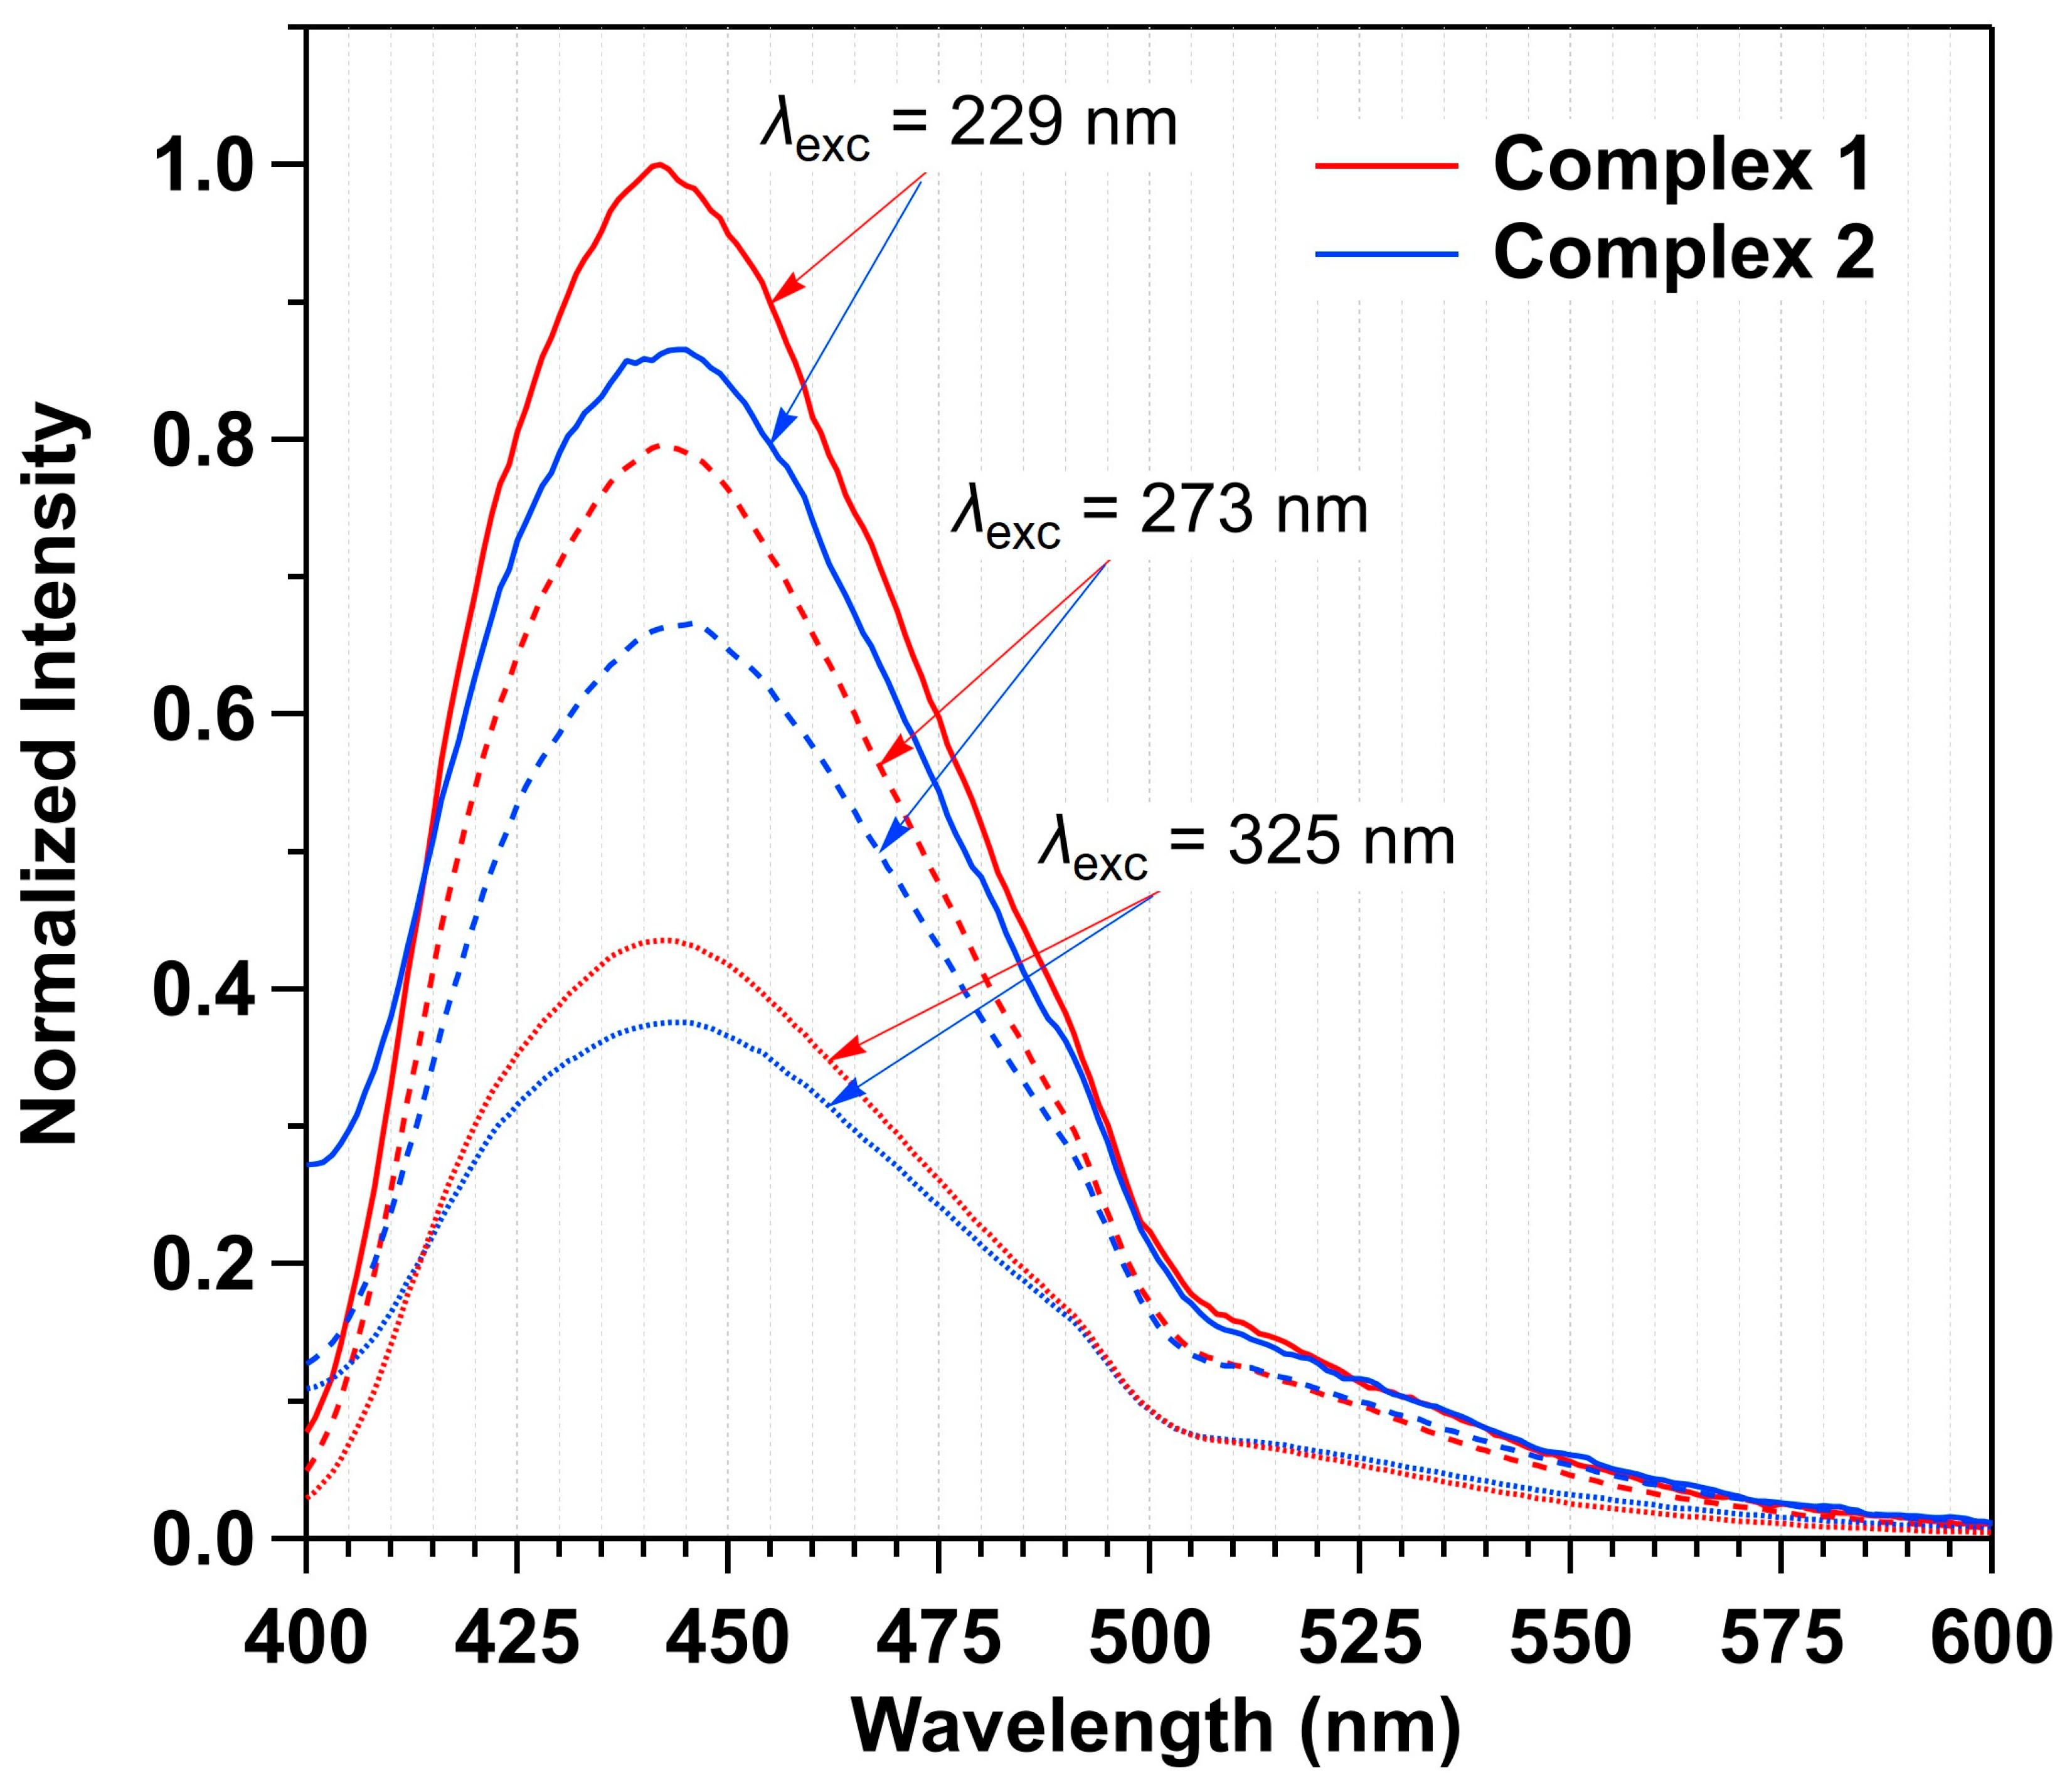
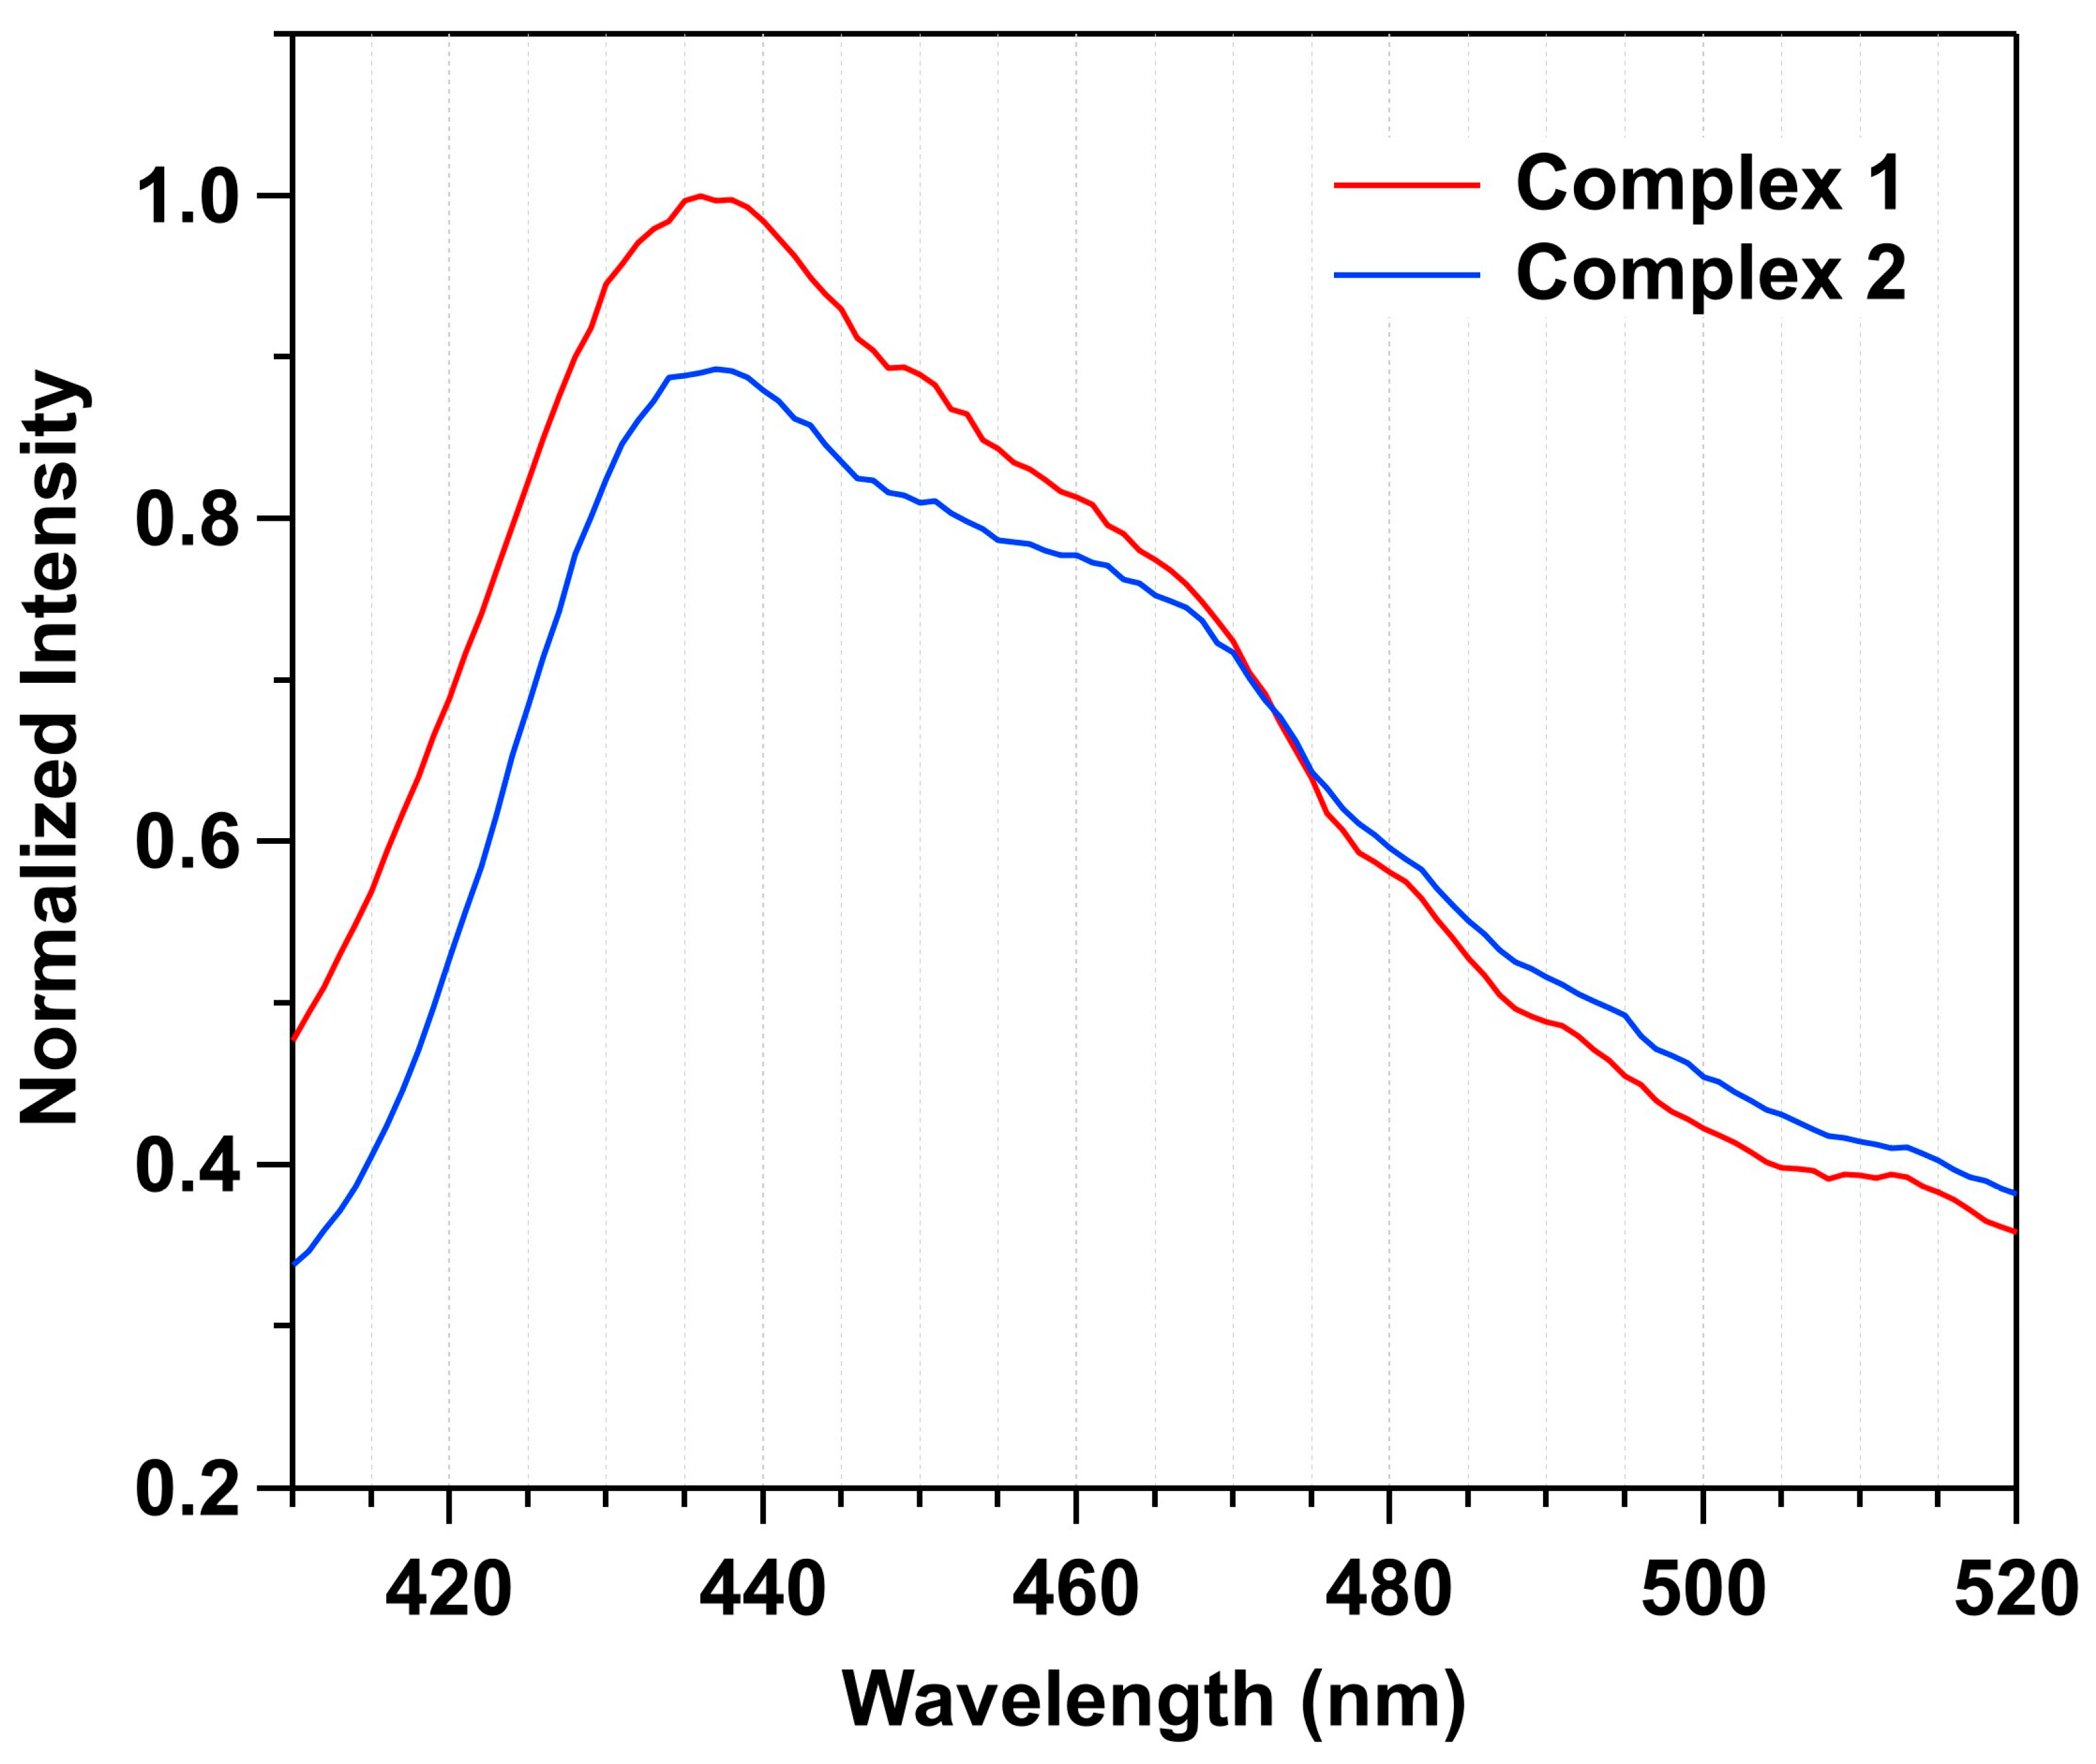
3.2. Optical Properties
4. Conclusions
Supplementary Materials
Author Contributions
Funding
Data Availability Statement
Acknowledgments
Conflicts of Interest
References
- Hoskins, B.F.; Robson, R. Infinite Polymeric Frameworks Consisting of Three Dimensionally Linked Rod-like Segments. J. Am. Chem. Soc. 1989, 111, 5962–5964. [Google Scholar] [CrossRef]
- Zhou, H.-C.; Long, J.R.; Yaghi, O.M. Introduction to Metal–Organic Frameworks. Chem. Rev. 2012, 112, 673–674. [Google Scholar] [CrossRef] [PubMed]
- Stock, N.; Biswas, S. Synthesis of Metal-Organic Frameworks (MOFs): Routes to Various MOF Topologies, Morphologies, and Composites. Chem. Rev. 2012, 112, 933–969. [Google Scholar] [CrossRef] [PubMed]
- Howarth, A.J.; Liu, Y.; Li, P.; Li, Z.; Wang, T.C.; Hupp, J.T.; Farha, O.K. Chemical, Thermal and Mechanical Stabilities of Metal–Organic Frameworks. Nat. Rev. Mater. 2016, 1, 15018. [Google Scholar] [CrossRef]
- Saeb, M.R.; Rabiee, N.; Mozafari, M.; Mostafavi, E. Metal-Organic Frameworks (MOFs)-Based Nanomaterials for Drug Delivery. Materials 2021, 14, 3652. [Google Scholar] [CrossRef]
- Zou, D.; Yu, L.; Sun, Q.; Hui, Y.; Tengjisi; Liu, Y.; Yang, G.; Wibowo, D.; Zhao, C.-X. A General Approach for Biomimetic Mineralization of MOF Particles Using Biomolecules. Colloids Surf. B Biointerfaces 2020, 193, 111108. [Google Scholar] [CrossRef]
- Li, H.; Li, L.; Lin, R.-B.; Zhou, W.; Zhang, Z.; Xiang, S.; Chen, B. Porous Metal-Organic Frameworks for Gas Storage and Separation: Status and Challenges. EnergyChem 2019, 1, 100006. [Google Scholar] [CrossRef]
- Dhakshinamoorthy, A.; Li, Z.; Garcia, H. Catalysis and Photocatalysis by Metal Organic Frameworks. Chem. Soc. Rev. 2018, 47, 8134–8172. [Google Scholar] [CrossRef]
- Sohrabi, H.; Ghasemzadeh, S.; Ghoreishi, Z.; Majidi, M.R.; Yoon, Y.; Dizge, N.; Khataee, A. Metal-Organic Frameworks (MOF)-Based Sensors for Detection of Toxic Gases: A Review of Current Status and Future Prospects. Mater. Chem. Phys. 2023, 299, 127512. [Google Scholar] [CrossRef]
- Thorarinsdottir, A.E.; Harris, T.D. Metal–Organic Framework Magnets. Chem. Rev. 2020, 120, 8716–8789. [Google Scholar] [CrossRef]
- Yang, J.; Yang, Y. Metal–Organic Frameworks for Biomedical Applications. Small 2020, 16, 1906846. [Google Scholar] [CrossRef]
- Torresi, S.; Famulari, A.; Martί-Rujas, J. Kinetically Controlled Fast Crystallization of M12L8 Poly-[n]-catenanes Using the 2,4,6-Tris(4-pyridyl)benzene Ligand and ZnCl2 in an Aromatic Environment. J. Am. Chem. Soc. 2020, 142, 9537–9543. [Google Scholar] [CrossRef]
- Martí-Rujas, J.; Elli, S.; Famulari, A. Kinetic trapping of 2,4,6-tris(4-pyridyl)benzene and ZnI2 into M12L8 poly-[n]-catenanes using solution and solid-state processes. Sci. Rep. 2023, 13, 5605. [Google Scholar] [CrossRef] [PubMed]
- Moghadam, P.Z.; Li, A.; Wiggin, S.B.; Tao, A.; Maloney, A.G.P.; Wood, P.A.; Ward, S.C.; Fairen-Jimenez, D. Development of a Cambridge Structural Database Subset: A Collection of Metal–Organic Frameworks for Past, Present, and Future. Chem. Mater. 2017, 29, 2618–2625. [Google Scholar] [CrossRef] [Green Version]
- Brugger, J. Zinc. In Encyclopedia of Geochemistry; White, W.M., Ed.; Springer International Publishing: Cham, Switzerland, 2016; pp. 1–4. ISBN 9783319391939. [Google Scholar]
- Dumur, F.; Beouch, L.; Tehfe, M.-A.; Contal, E.; Lepeltier, M.; Wantz, G.; Graff, B.; Goubard, F.; Mayer, C.R.; Lalevée, J.; et al. Low-Cost Zinc Complexes for White Organic Light-Emitting Devices. Thin Solid Film. 2014, 564, 351–360. [Google Scholar] [CrossRef]
- Safdar Ali, R.; Meng, H.; Li, Z. Zinc-Based Metal-Organic Frameworks in Drug Delivery, Cell Imaging, and Sensing. Molecules 2021, 27, 100. [Google Scholar] [CrossRef] [PubMed]
- Bahrani, S.; Hashemi, S.A.; Mousavi, S.M.; Azhdari, R. Zinc-Based Metal–Organic Frameworks as Nontoxic and Biodegradable Platforms for Biomedical Applications: Review Study. Drug Metab. Rev. 2019, 51, 356–377. [Google Scholar] [CrossRef]
- McKinlay, A.C.; Morris, R.E.; Horcajada, P.; Férey, G.; Gref, R.; Couvreur, P.; Serre, C. BioMOFs: Metal-Organic Frameworks for Biological and Medical Applications. Angew. Chem. Int. Ed. 2010, 49, 6260–6266. [Google Scholar] [CrossRef] [PubMed]
- Dou, Z.; Yu, J.; Cui, Y.; Yang, Y.; Wang, Z.; Yang, D.; Qian, G. Luminescent Metal–Organic Framework Films As Highly Sensitive and Fast-Response Oxygen Sensors. J. Am. Chem. Soc. 2014, 136, 5527–5530. [Google Scholar] [CrossRef]
- Martί-Rujas, J.; Elli, S.; Sacchetti, A.; Castiglione, F. Mechanochemical synthesis of mechanical bonds in M12L8 poly-[n]-catenanes. Dalton Trans. 2022, 51, 53–58. [Google Scholar] [CrossRef]
- Blackman, A.G.; Schenk, E.B.; Jelley, R.E.; Krenske, E.H.; Gahan, L.R. Five-Coordinate Transition Metal Complexes and the Value of τ5: Observations and Caveats. Dalton Trans. 2020, 49, 14798–14806. [Google Scholar] [CrossRef] [PubMed]
- Lakowicz, J.R. Principles of Fluorescence Spectroscopy, 2nd ed.; Kluwer Academic/Plenum Publishers: New York, NY, USA, 1999; ISBN 0-306-46093-9. [Google Scholar]


| 1 | 2 | |
|---|---|---|
| Empirical formula | C15H13NO3Zn | C13.33H10.33NO3.33Zn |
| Formula weight | 320.63 | 303.17 |
| Temperature/K | 210 | 210 |
| Crystal system | Moniclinic | Trigonal |
| Space group | P21/c | R-3 |
| a/Å | 14.5062 (3) | 26.7293 (3) |
| b/Å | 9.6958 (2) | 26.7293 (3) |
| c/Å | 9.7987 (2) | 8.5248 (2) |
| α/° | ||
| β/° | 107.697 (1) | |
| γ/° | 120 | |
| Volume/Å3 | 1312.96 (5) | 5274.61 (17) |
| Z | 4 | 18 |
| ρcalc g/cm3 | 1.622 | 1.718 |
| μ/mm−1 | 2.660 | 2.962 |
| F(000) | 656.0 | 2771.0 |
| Crystal size/mm3 | 0.32 × 0.30 × 0.24 | 0.28 × 0.22 × 0.20 |
| Radiation | CuKα (λ = 1.54178) | CuKα (λ = 1.54178) |
| 2Θ range for data collection/° | 11.148 to 139.594 | 6.614 to 139.834 |
| Index ranges | −17 ≤ h ≤ 17,−11 ≤ k ≤ 11,−11 ≤ l ≤ 11 | −31 ≤ h ≤ 32,−31 ≤ k ≤ 20,−10 ≤ l ≤ 10 |
| Reflections collected | 14,311 | 7111 |
| Independent reflections | 2464 | 2214 |
| Data/restraints/parameters | 2464/0/183 | 2214/0/163 |
| Goodness-of-fit on F2 | 1.062 | 1.051 |
| Final R indexes (I ≥ 2σ (I)) | R1 = 0.0219, wR2 = 0.0580 | R1 = 0.0243, wR2 = 0.0603 |
| Final R indexes (all data) | R1 = 0.0233, wR2 = 0.0592 | R1 = 0.0278, wR2 = 0.0626 |
| Largest diff. peak/hole/e Å−3 | 0.31/−0.26 | 0.27/−0.30 |
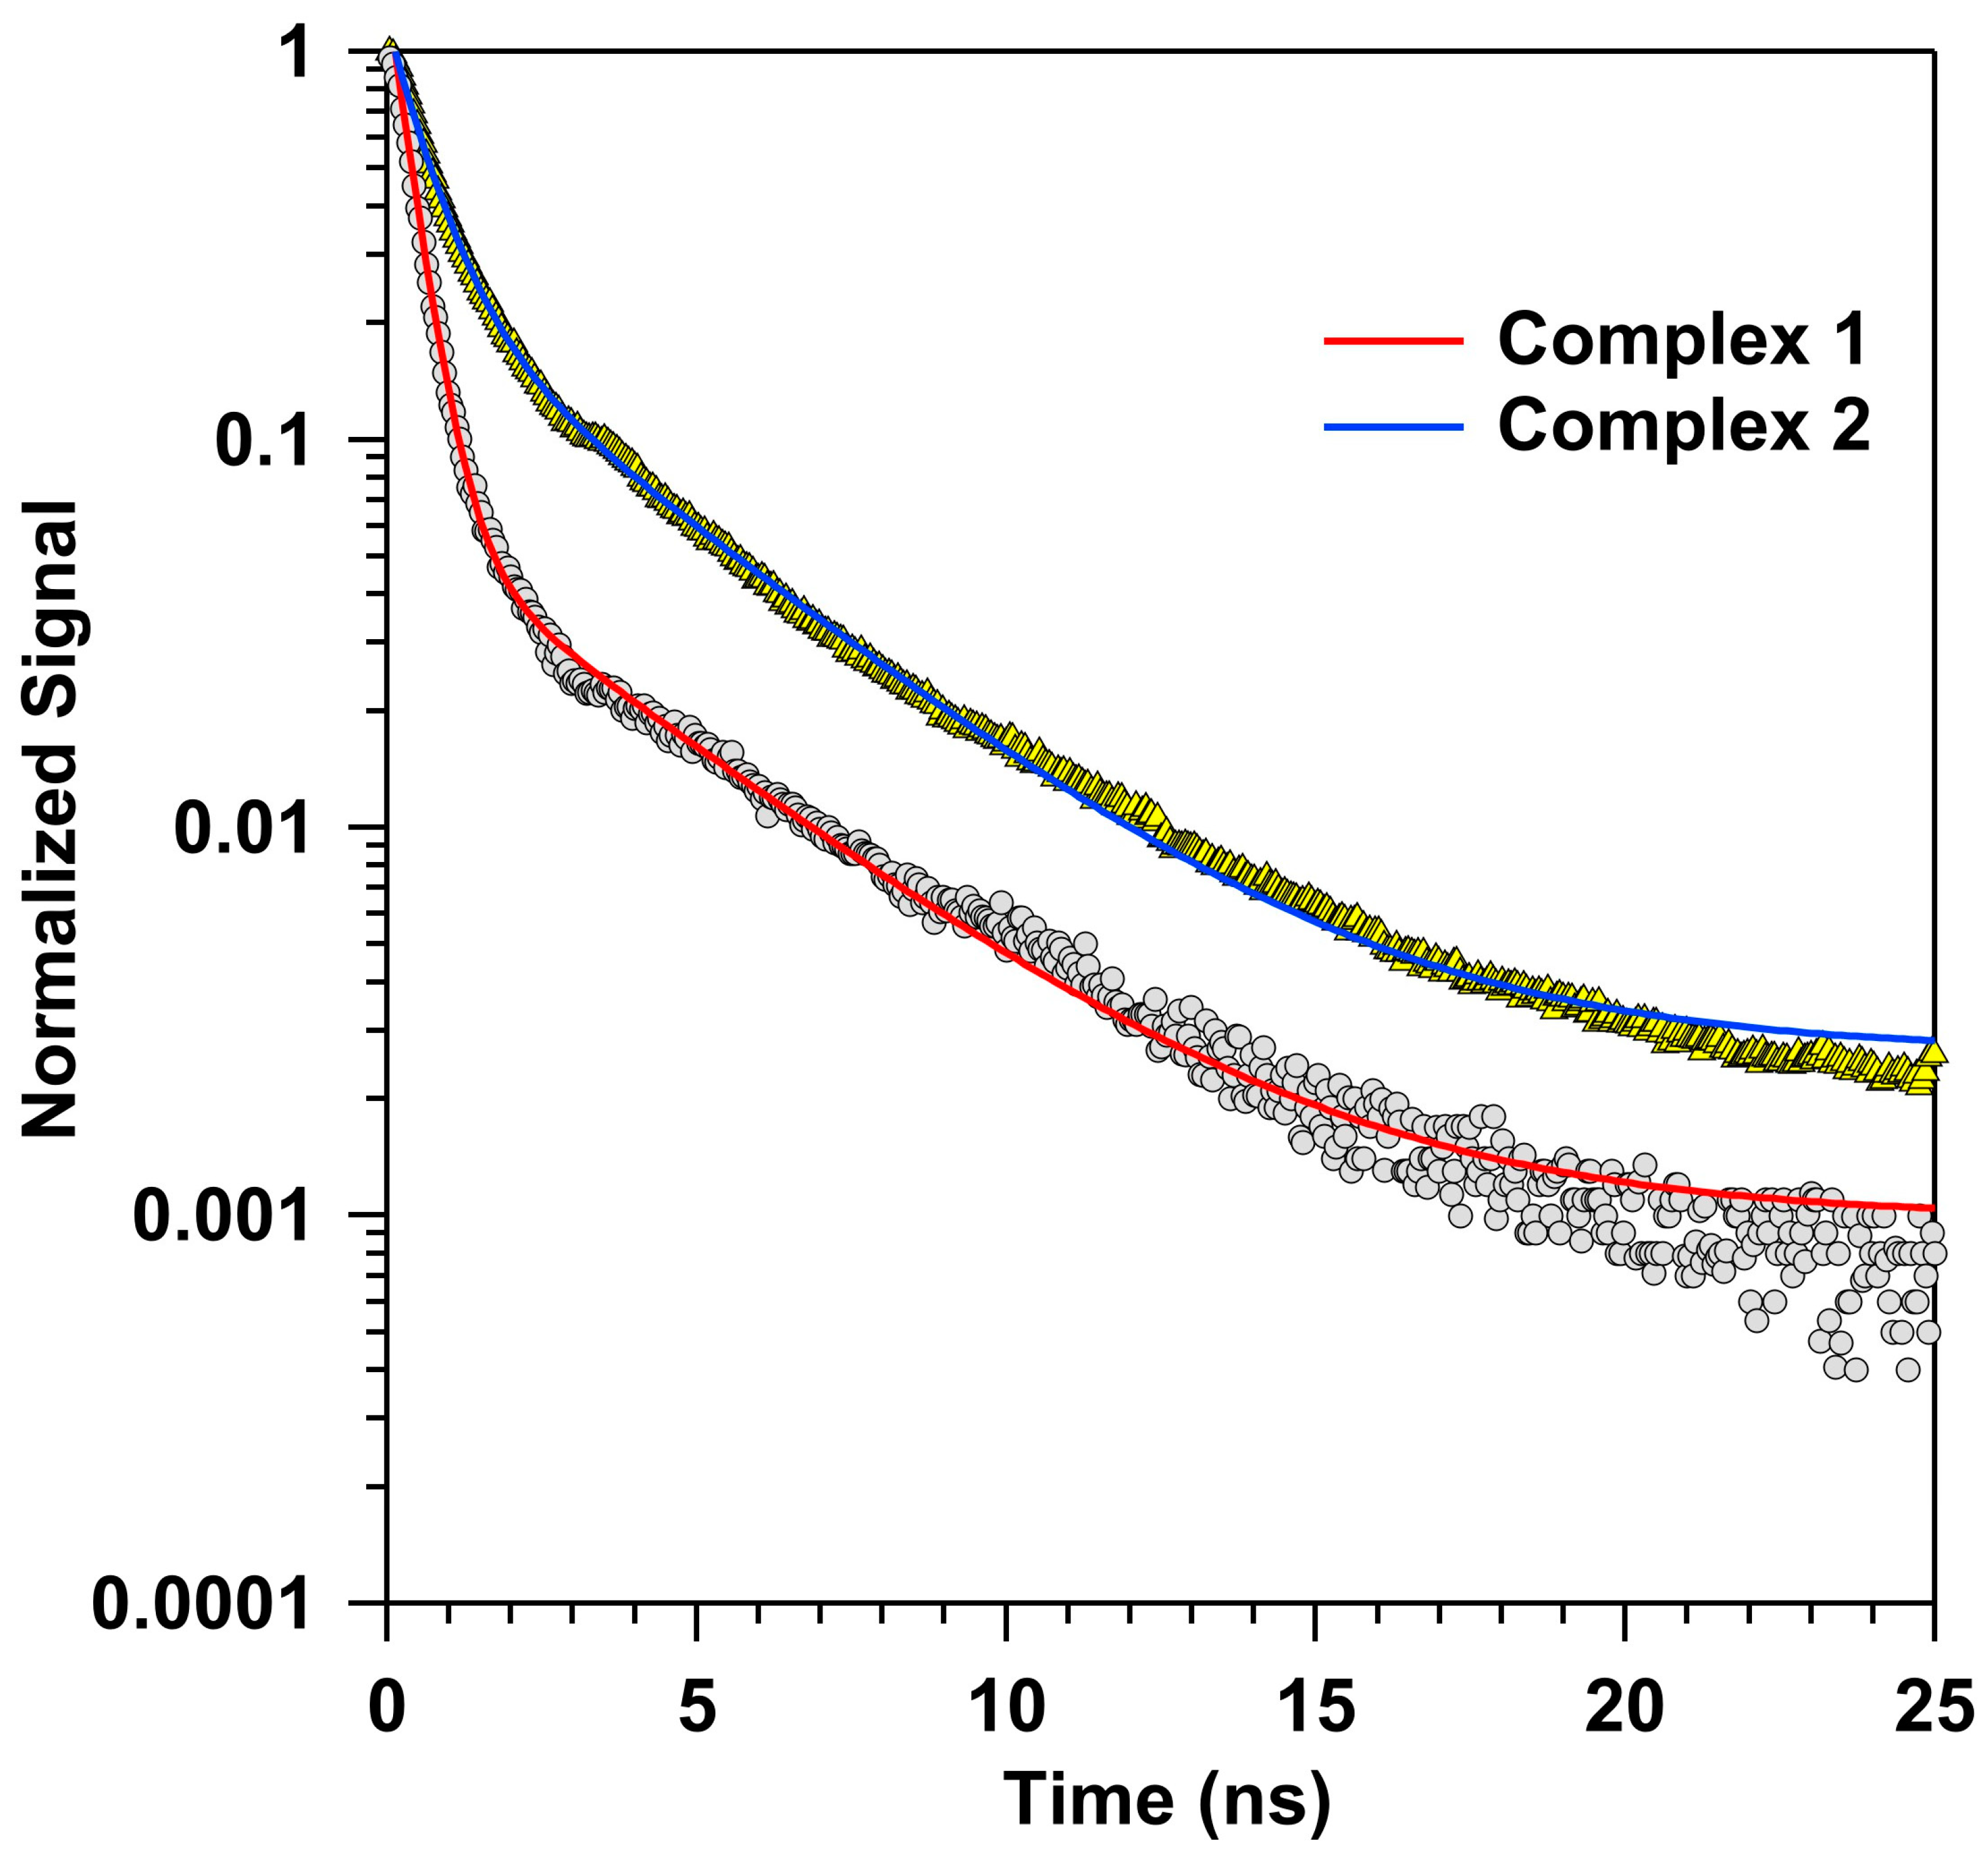
| Complexes | a1 | τ1 (ns) | a2 | τ2 (ns) | τav (ns) |
|---|---|---|---|---|---|
| 1 | 0.904 | 0.36 | 0.096 | 3.59 | 2.02 |
| 2 | 0.747 | 0.62 | 0.253 | 3.42 | 2.45 |
Disclaimer/Publisher’s Note: The statements, opinions and data contained in all publications are solely those of the individual author(s) and contributor(s) and not of MDPI and/or the editor(s). MDPI and/or the editor(s) disclaim responsibility for any injury to people or property resulting from any ideas, methods, instructions or products referred to in the content. |
© 2023 by the authors. Licensee MDPI, Basel, Switzerland. This article is an open access article distributed under the terms and conditions of the Creative Commons Attribution (CC BY) license (https://creativecommons.org/licenses/by/4.0/).
Share and Cite
Karakousi, R.; Tsami, P.A.; Spanoudaki, M.-A.I.; Dalgarno, S.J.; Papadimitriou, V.C.; Milios, C.J. Blue-Emitting 2D- and 3D-Zinc Coordination Polymers Based on Schiff-Base Amino Acid Ligands. Chemistry 2023, 5, 1770-1780. https://doi.org/10.3390/chemistry5030121
Karakousi R, Tsami PA, Spanoudaki M-AI, Dalgarno SJ, Papadimitriou VC, Milios CJ. Blue-Emitting 2D- and 3D-Zinc Coordination Polymers Based on Schiff-Base Amino Acid Ligands. Chemistry. 2023; 5(3):1770-1780. https://doi.org/10.3390/chemistry5030121
Chicago/Turabian StyleKarakousi, Rodavgi, Pinelopi A. Tsami, Maria-Areti I. Spanoudaki, Scott J. Dalgarno, Vassileios C. Papadimitriou, and Constantinos J. Milios. 2023. "Blue-Emitting 2D- and 3D-Zinc Coordination Polymers Based on Schiff-Base Amino Acid Ligands" Chemistry 5, no. 3: 1770-1780. https://doi.org/10.3390/chemistry5030121