

Single-Ion Magnetism in a Three-Dimensional Thiocyanate-Bridged Dysprosium(III) Framework

 , , and
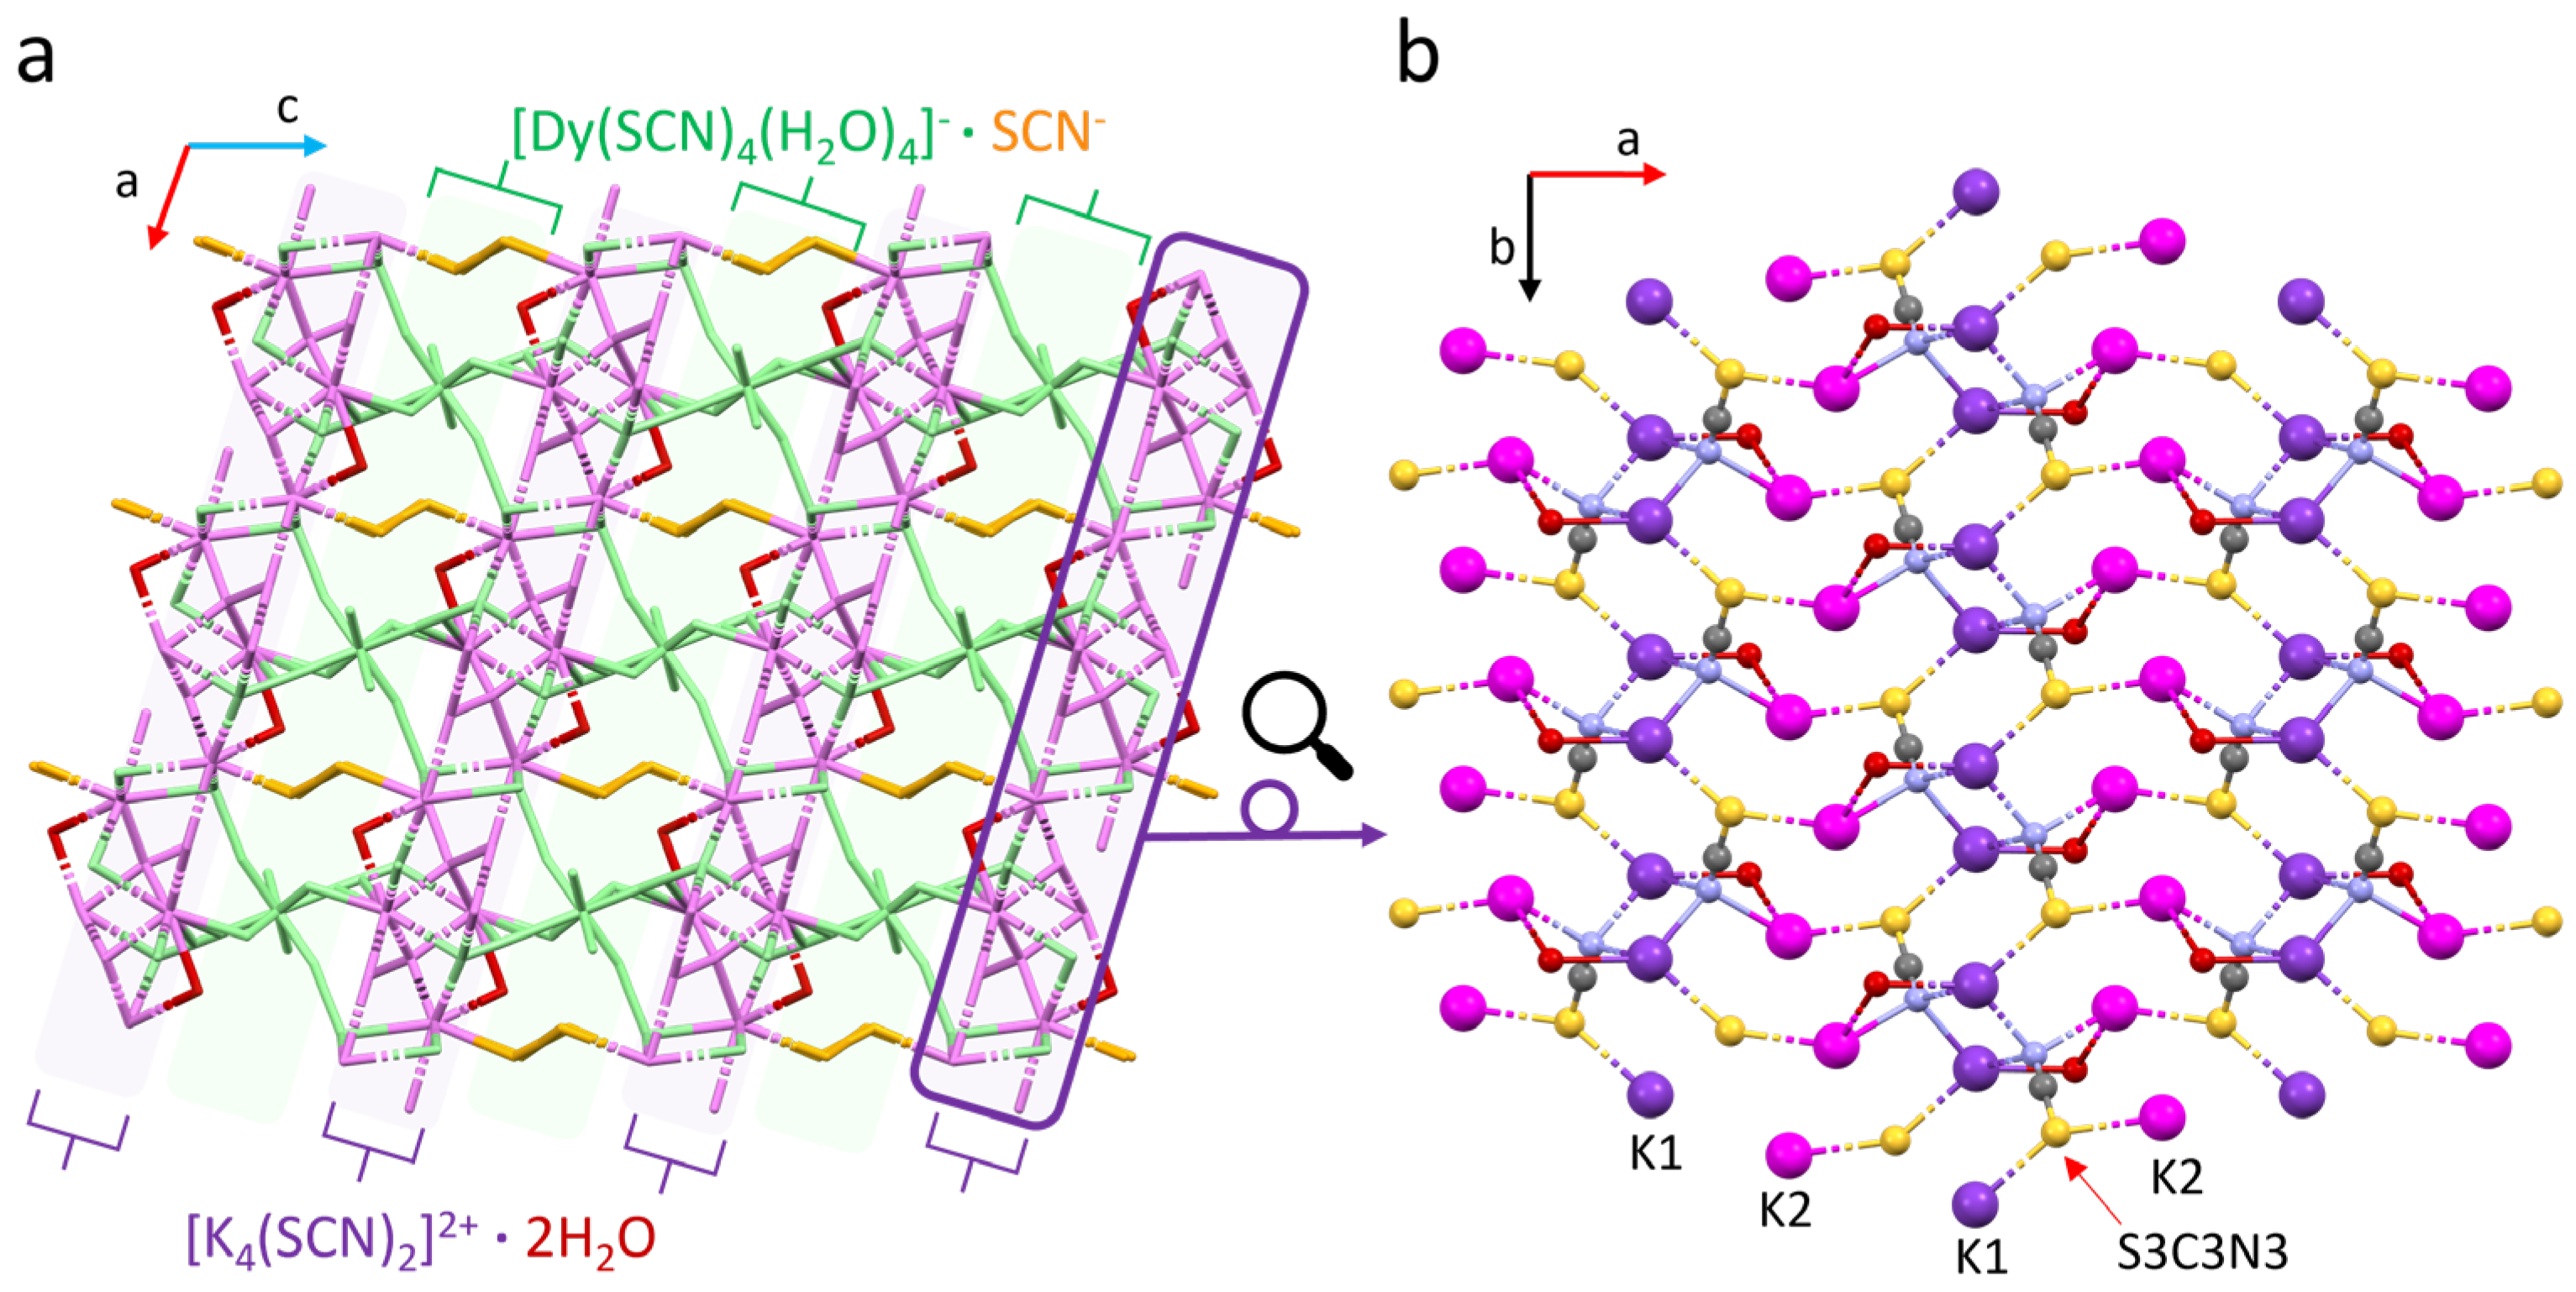
Abstract
:1. Introduction
2. Materials and Methods
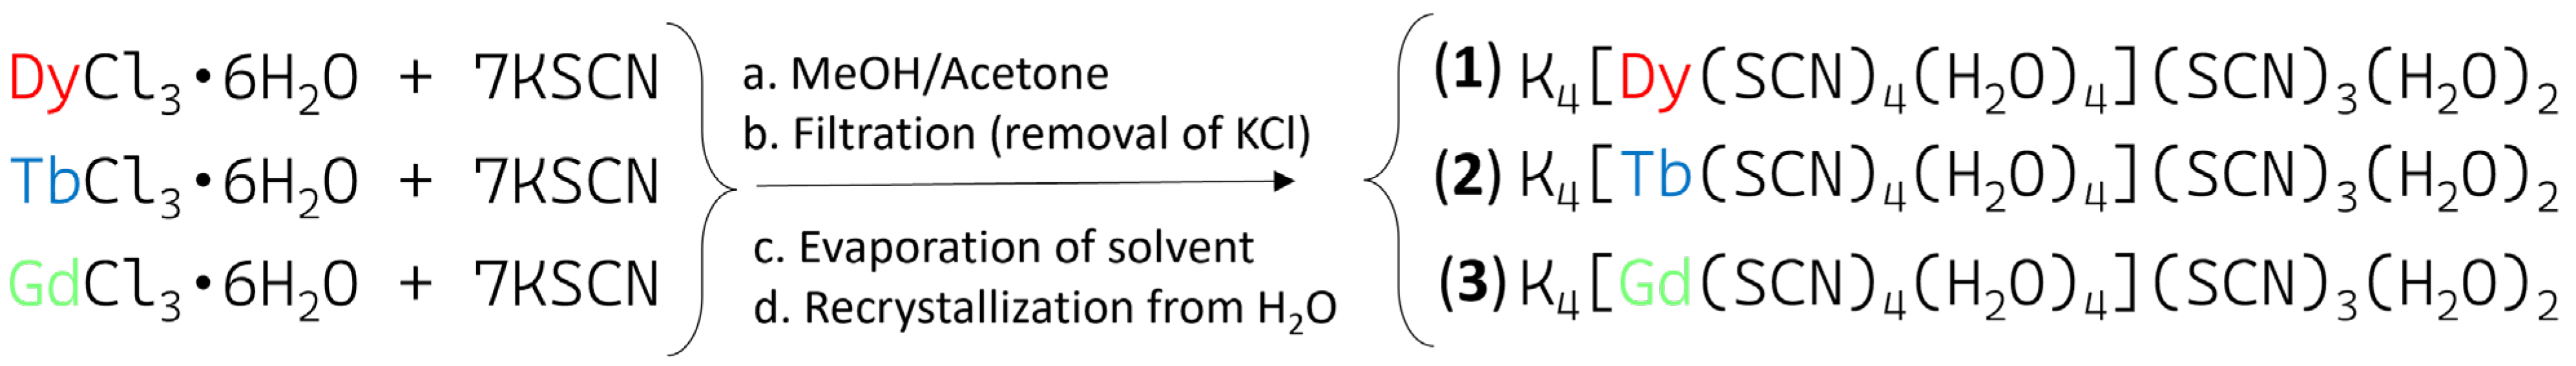
2.1. Synthesis
2.2. Physical Measurements
3. Results
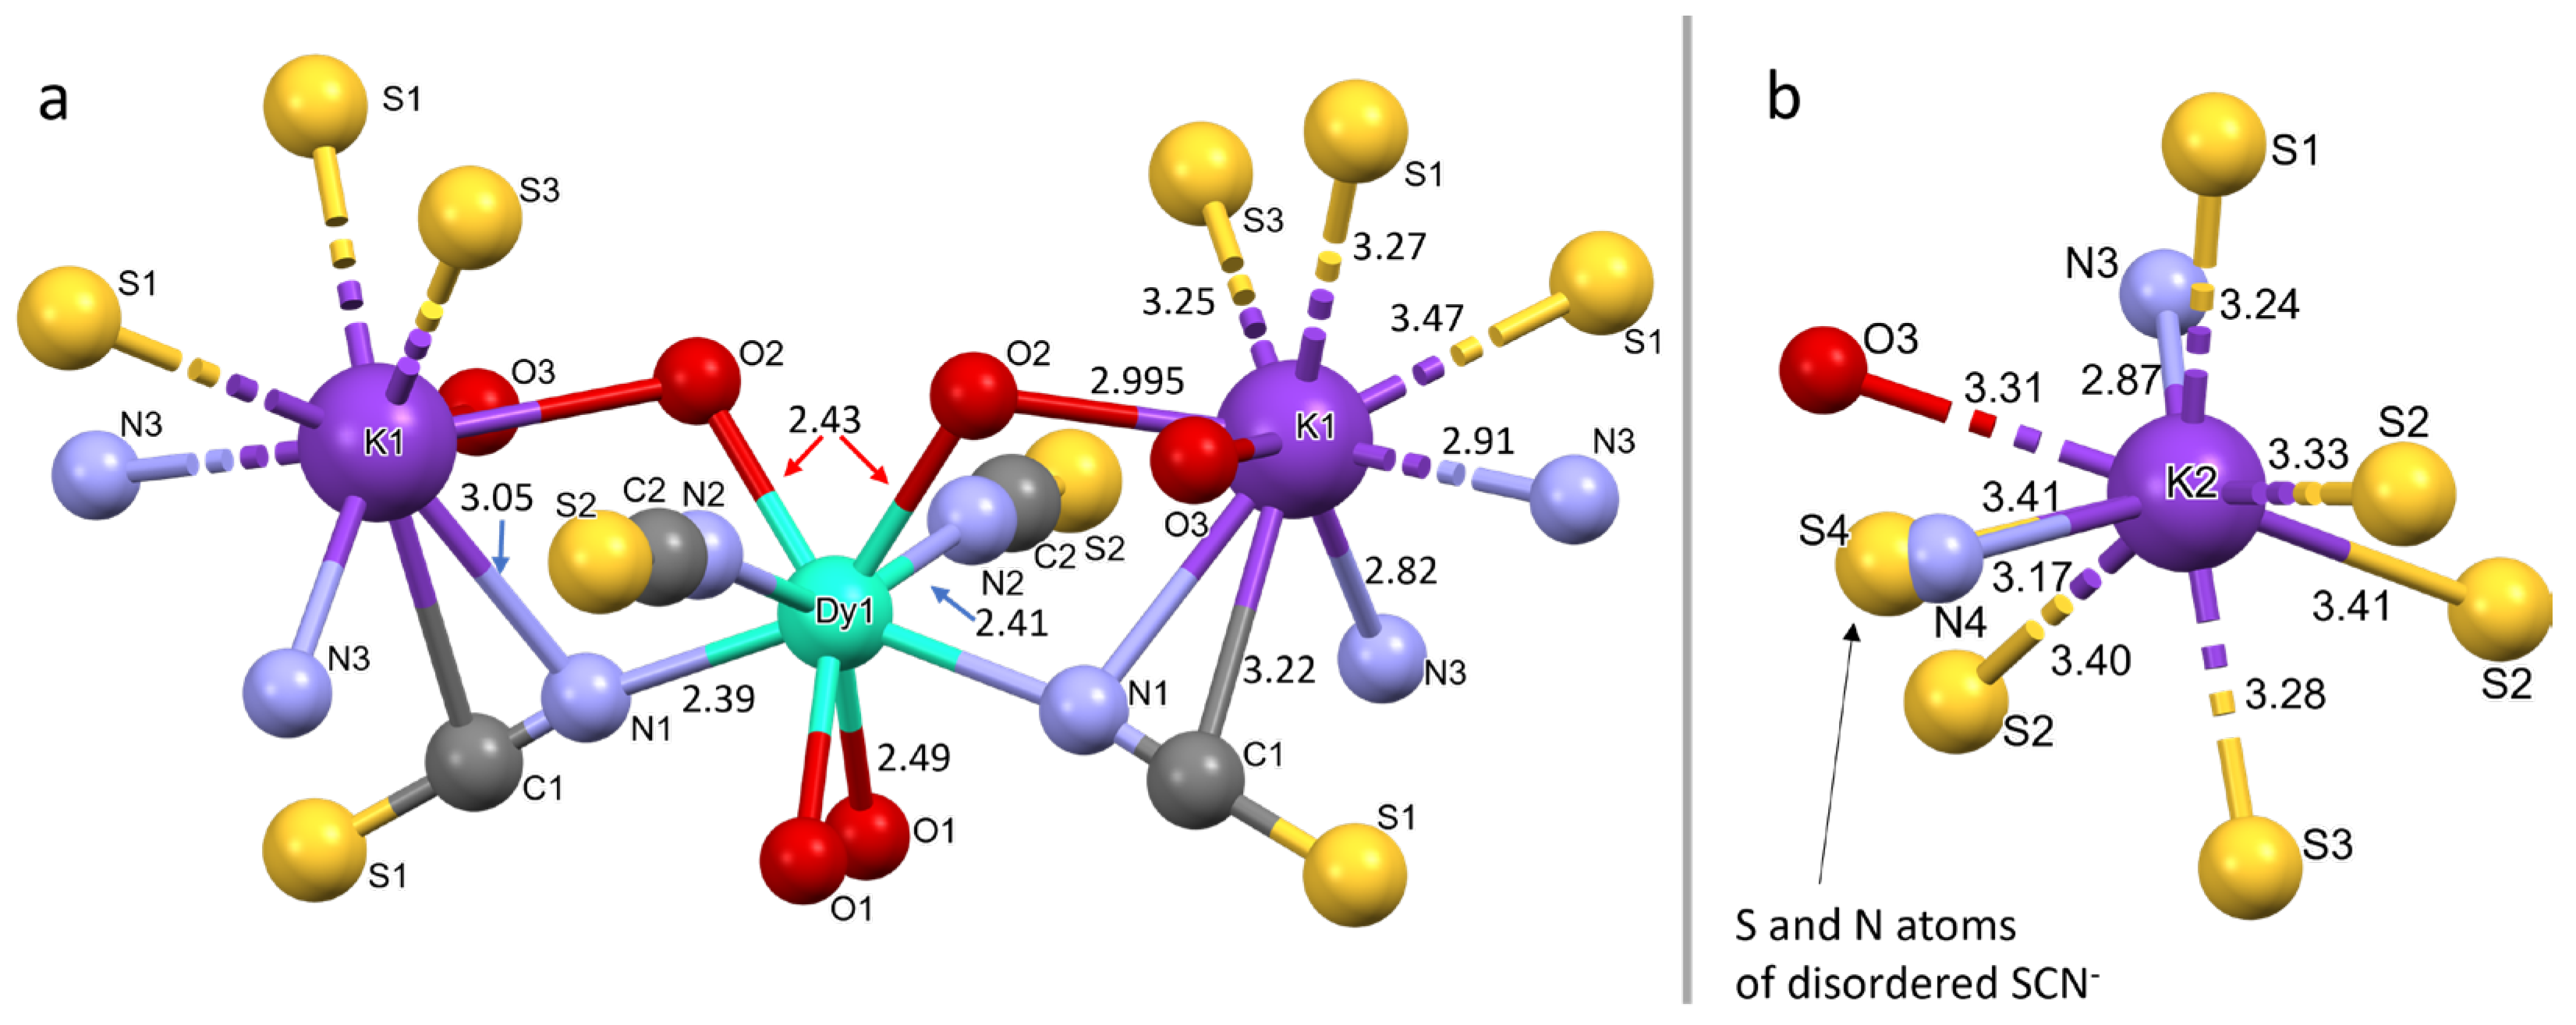
3.1. Crystal Structures
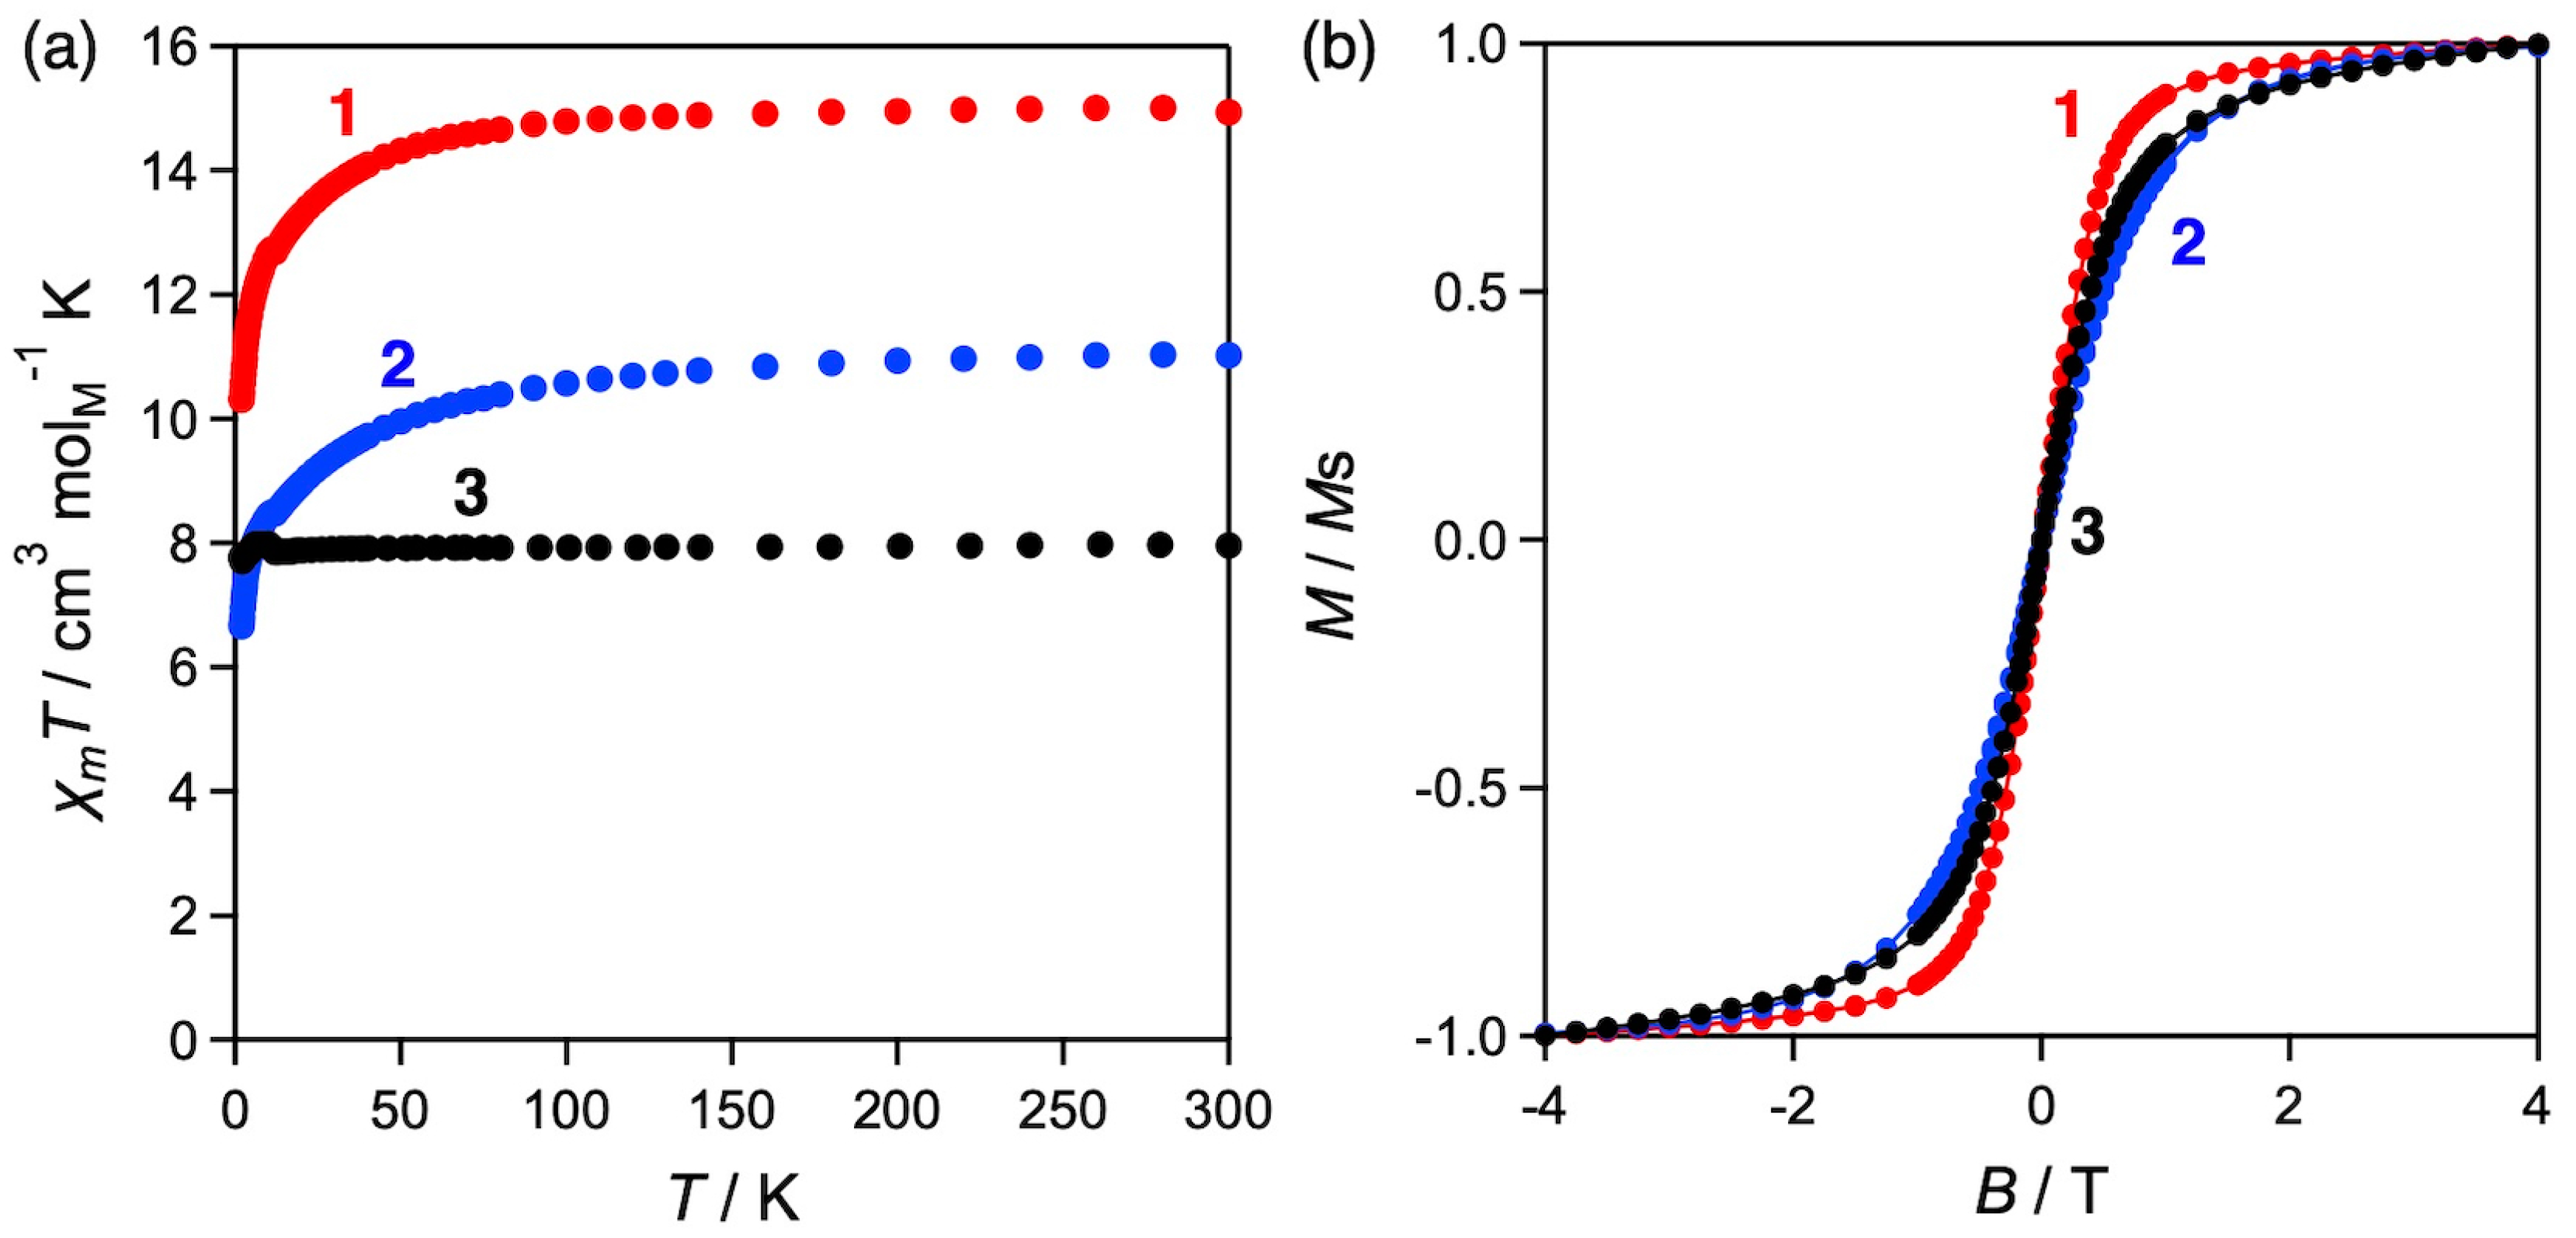
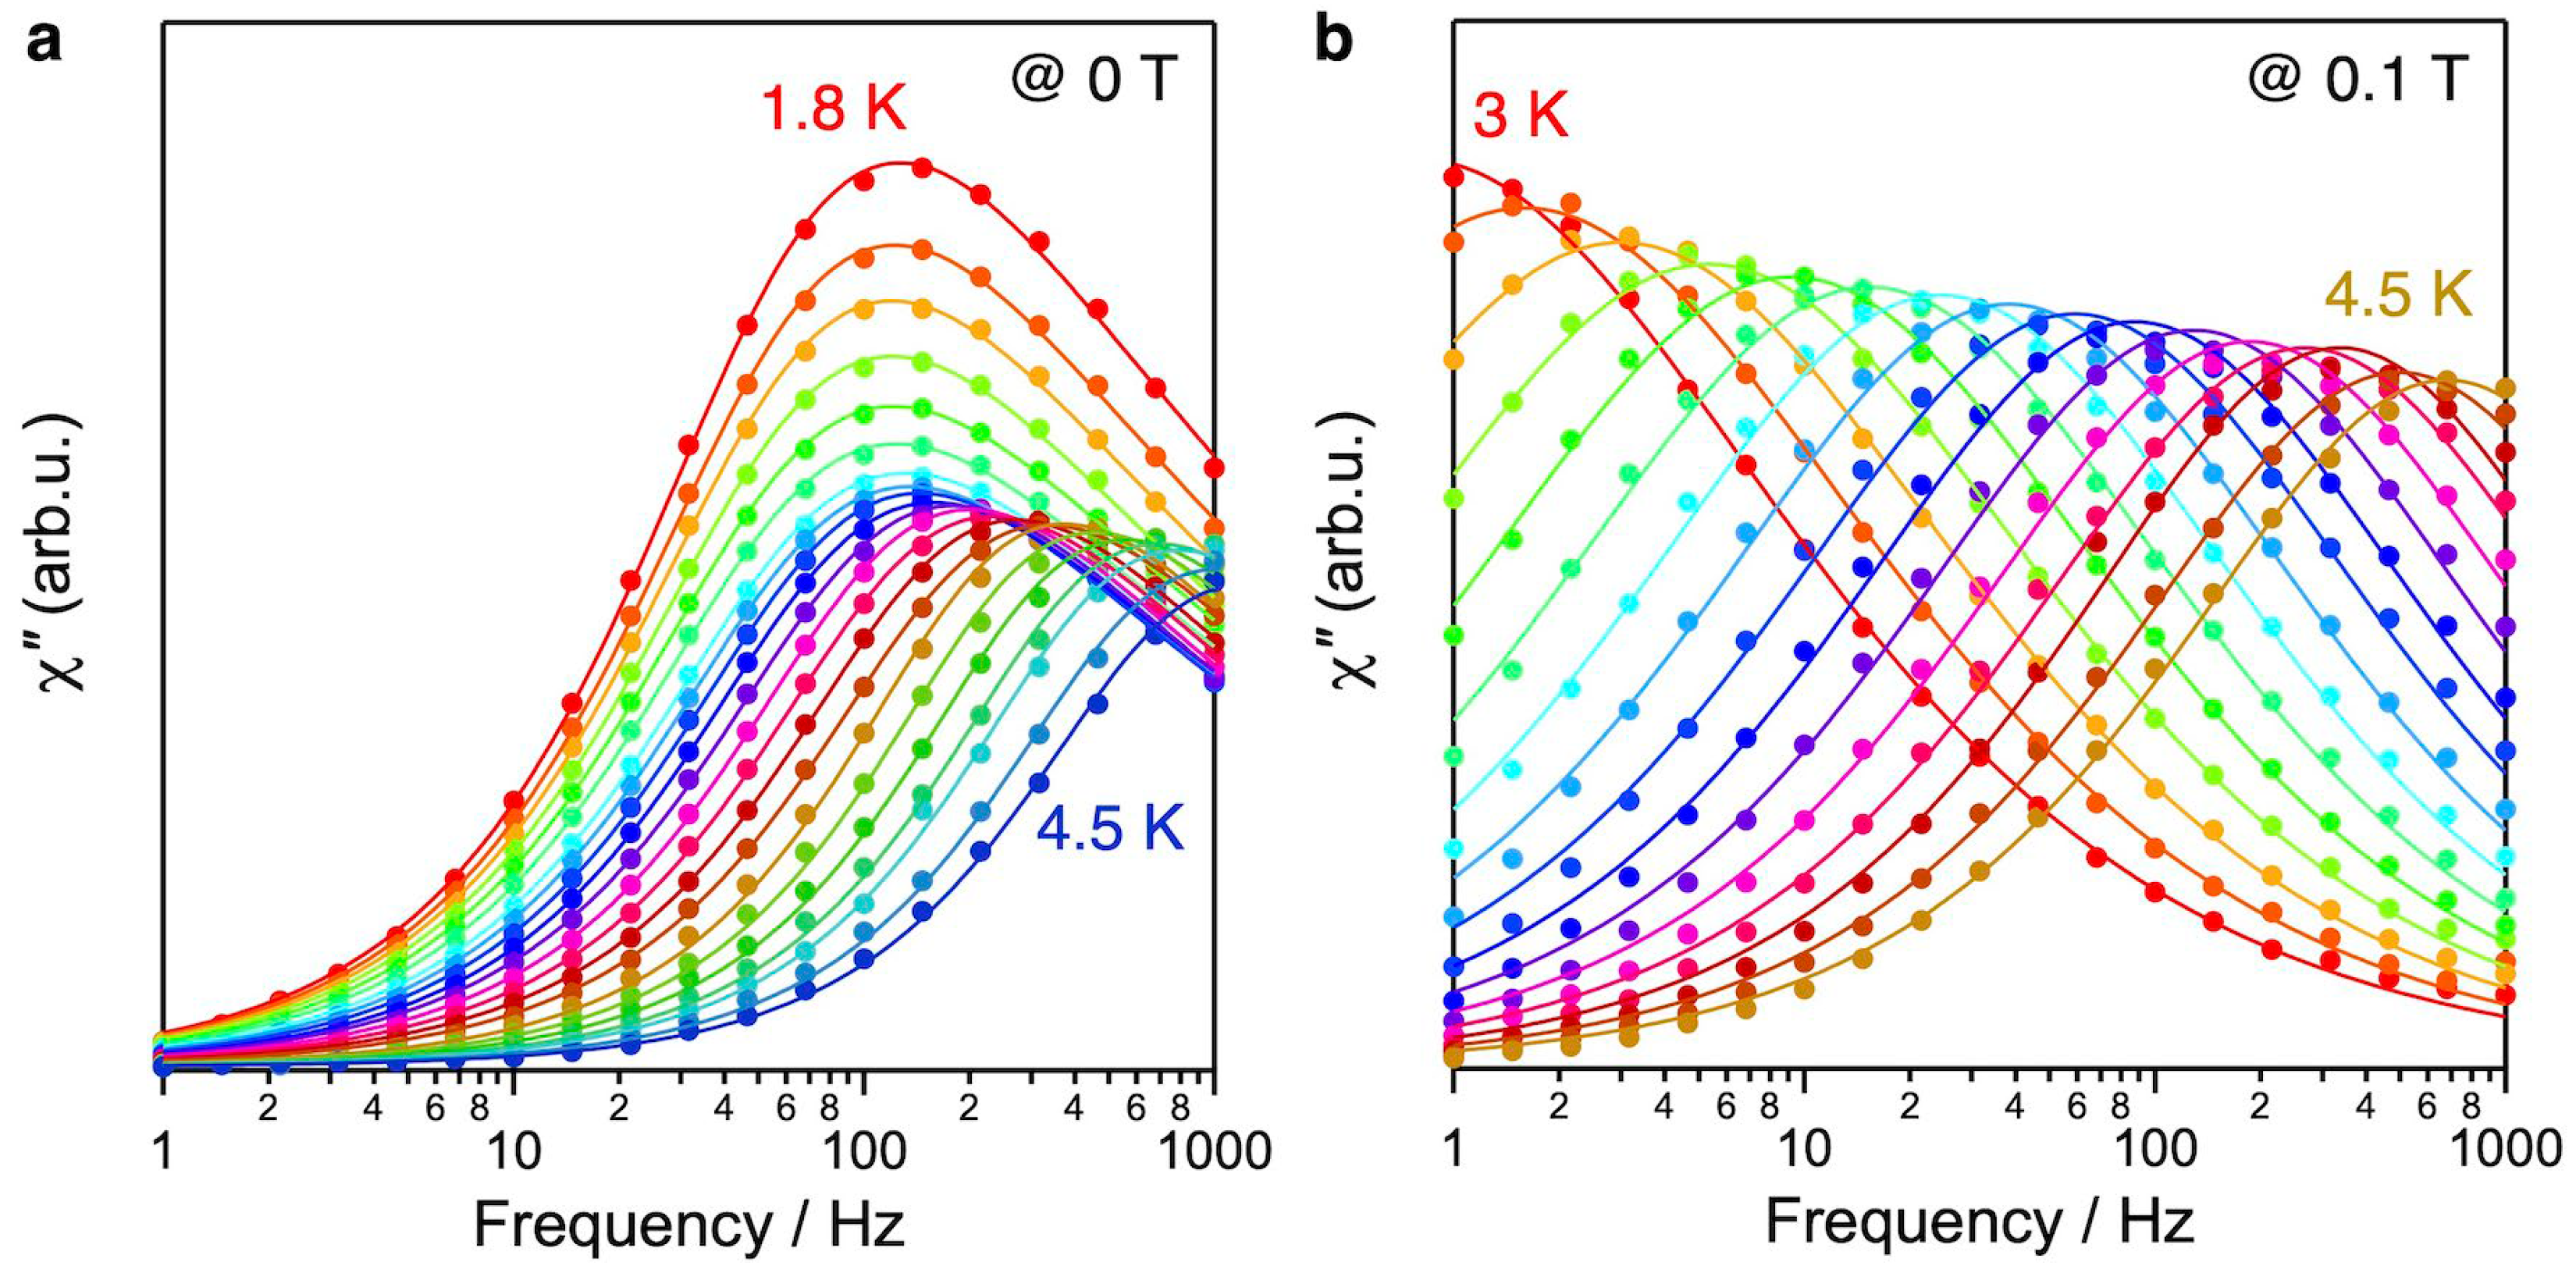
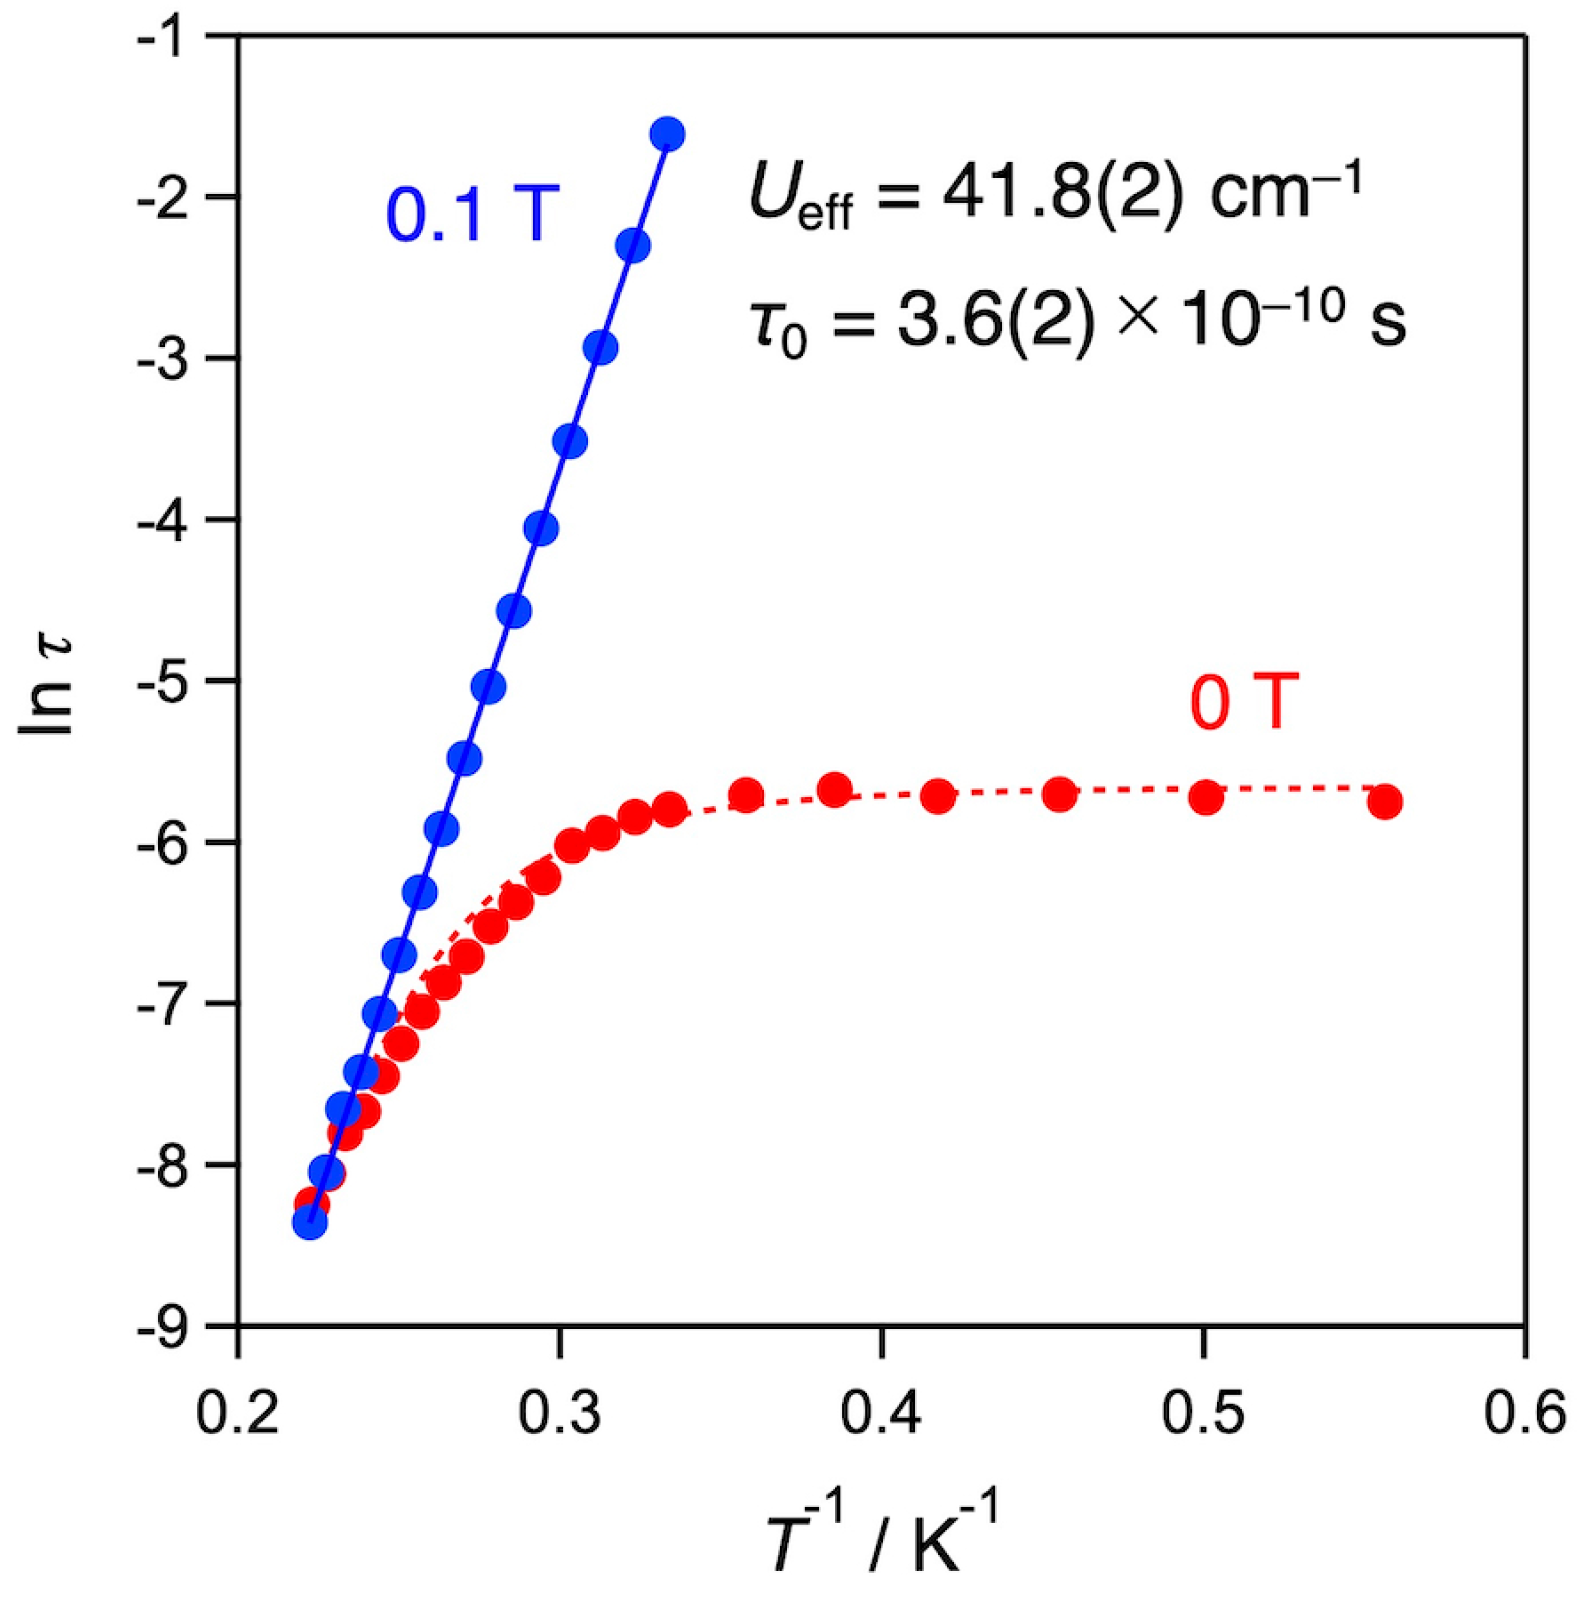
3.2. Magnetic Properties
4. Conclusions
Supplementary Materials
Author Contributions
Funding
Data Availability Statement
Acknowledgments
Conflicts of Interest
References
- Sessoli, R.; Gatteschi, D.; Caneschi, A.; Novak, M. Magnetic bistability in a metal-ion cluster. Nature 1993, 365, 141–143. [Google Scholar] [CrossRef]
- Gatteschi, D.; Sessoli, R. Quantum tunneling of magnetization and related phenomena in molecular materials. Angew. Chem. Int. Ed. 2003, 42, 268–297. [Google Scholar] [CrossRef]
- Woodruff, D.N.; Winpenny, R.E.; Layfield, R.A. Lanthanide single-molecule magnets. Chem. Rev. 2013, 113, 5110–5148. [Google Scholar] [CrossRef] [PubMed]
- Yamashita, M. Next generation multifunctional nano-science of advanced metal complexes with quantum effect and nonlinearity. Bull. Chem. Soc. Jpn. 2021, 94, 209–264. [Google Scholar] [CrossRef]
- Zhang, P.; Guo, Y.-N.; Tang, J. Recent advances in dysprosium-based single molecule magnets: Structural overview and synthetic strategies. Coord. Chem. Rev. 2013, 257, 1728–1763. [Google Scholar] [CrossRef]
- Liu, C.-M.; Zhang, D.-Q.; Zhu, D.-B. A 3D MOF constructed from dysprosium (III) oxalate and capping ligands: Ferromagnetic coupling and field-induced two-step magnetic relaxation. Chem. Commun. 2016, 52, 4804–4807. [Google Scholar] [CrossRef]
- Chen, M.; Sañudo, E.C.; Jimenez, E.; Fang, S.-M.; Liu, C.-S.; Du, M. Lanthanide–organic coordination frameworks showing new 5-connected network topology and 3D ordered array of single-molecular magnet behavior in the Dy case. Inorg. Chem. 2014, 53, 6708–6714. [Google Scholar] [CrossRef] [PubMed]
- Yi, X.; Calvez, G.; Daiguebonne, C.; Guillou, O.; Bernot, K. Rational organization of lanthanide-based SMM dimers into three-dimensional networks. Inorg. Chem. 2015, 54, 5213–5219. [Google Scholar] [CrossRef]
- Huang, H.; Gao, W.; Zhang, X.-M.; Zhou, A.-M.; Liu, J.-P. 3D Ln III-MOFs: Displaying slow magnetic relaxation and highly sensitive luminescence sensing of alkylamines. CrystEngComm 2019, 21, 694–702. [Google Scholar] [CrossRef]
- Hu, F.-L.; Jiang, F.-L.; Zheng, J.; Wu, M.-Y.; Pang, J.-D.; Hong, M.-C. Magnetic properties of 3D heptanuclear lanthanide frameworks supported by mixed ligands. Inorg. Chem. 2015, 54, 6081–6083. [Google Scholar] [CrossRef]
- Savard, D.; Lin, P.-H.; Burchell, T.J.; Korobkov, I.; Wernsdorfer, W.; Clérac, R.; Murugesu, M. Two-dimensional networks of lanthanide cubane-shaped dumbbells. Inorg. Chem. 2009, 48, 11748–11754. [Google Scholar] [CrossRef]
- Yin, D.-D.; Chen, Q.; Meng, Y.-S.; Sun, H.-L.; Zhang, Y.-Q.; Gao, S. Slow magnetic relaxation in a novel carboxylate/oxalate/hydroxyl bridged dysprosium layer. Chem. Sci. 2015, 6, 3095–3101. [Google Scholar] [CrossRef] [PubMed]
- Zhou, Q.; Yang, F.; Xin, B.; Zeng, G.; Zhou, X.; Liu, K.; Ma, D.; Li, G.; Shi, Z.; Feng, S. Reversible switching of slow magnetic relaxation in a classic lanthanide metal–organic framework system. Chem. Commun. 2013, 49, 8244–8246. [Google Scholar] [CrossRef] [PubMed]
- Zhang, X.; Vieru, V.; Feng, X.; Liu, J.L.; Zhang, Z.; Na, B.; Shi, W.; Wang, B.W.; Powell, A.K.; Chibotaru, L.F. Influence of Guest Exchange on the Magnetization Dynamics of Dilanthanide Single-Molecule-Magnet Nodes within a Metal-Organic Framework. Angew. Chem. Int. Ed. 2015, 54, 9861–9865. [Google Scholar] [CrossRef]
- Motokawa, N.; Matsunaga, S.; Takaishi, S.; Miyasaka, H.; Yamashita, M.; Dunbar, K.R. Reversible magnetism between an antiferromagnet and a ferromagnet related to solvation/desolvation in a robust layered [Ru2]2TCNQ charge-transfer system. J. Am. Chem. Soc. 2010, 132, 11943–11951. [Google Scholar] [CrossRef]
- Cheng, X.-N.; Zhang, W.-X.; Chen, X.-M. Single crystal-to-single crystal transformation from ferromagnetic discrete molecules to a spin-canting antiferromagnetic layer. J. Am. Chem. Soc. 2007, 129, 15738–15739. [Google Scholar] [CrossRef]
- Espallargas, G.M.; Coronado, E. Magnetic functionalities in MOFs: From the framework to the pore. Chem. Soc. Rev. 2018, 47, 533–557. [Google Scholar] [CrossRef]
- Ishikawa, N.; Sugita, M.; Wernsdorfer, W. Nuclear spin driven quantum tunneling of magnetization in a new lanthanide single-molecule magnet: Bis (phthalocyaninato) holmium anion. J. Am. Chem. Soc. 2005, 127, 3650–3651. [Google Scholar] [CrossRef] [PubMed]
- Cui, Y.; Chen, B.; Qian, G. Lanthanide metal-organic frameworks for luminescent sensing and light-emitting applications. Coord. Chem. Rev. 2014, 273, 76–86. [Google Scholar] [CrossRef]
- Nagarkar, S.S.; Kurasho, H.; Duong, N.T.; Nishiyama, Y.; Kitagawa, S.; Horike, S. Crystal melting and glass formation in copper thiocyanate based coordination polymers. Chem. Commun. 2019, 55, 5455–5458. [Google Scholar] [CrossRef]
- Jin, F.; Zhou, H.-P.; Wang, X.-C.; Hu, Z.-J.; Wu, J.-Y.; Tian, Y.-P.; Jiang, M.-H. Synthesis, structures and photoluminescence of thiocyanate bridged metal-organic polymers containing functional imidazole ligand. Polyhedron 2007, 26, 1338–1346. [Google Scholar] [CrossRef]
- Abedi, M.; Mahmoudi, G.; Kirillov, A.M.; Kaminsky, W. Self-Assembled 3D heterometallic Zn (II)/K (I) metal–organic framework with the fluorite topology. Polyhedron 2018, 142, 110–114. [Google Scholar] [CrossRef]
- Etaiw, S.E.-d.H.; El-bendary, M.M.; Fouda, A.E.-A.S.; Maher, M.M. A new metal-organic framework based on cadmium thiocyanate and 6-methylequinoline as corrosion inhibitor for copper in 1 M HCl solution. Prot. Met. Phys. Chem. Surf. 2017, 53, 937–949. [Google Scholar] [CrossRef]
- Lozano-Rodriguez, M.; Copping, R.; Petit, S.; Solari, P.; Guilbaud, P.; de Leon, J.M.; Den Auwer, C. Crystal structure versus solution for two new lutetium thiocyanato complexes. N. J. Chem. 2011, 35, 2755–2765. [Google Scholar] [CrossRef]
- Altomare, A.; Burla, M.C.; Camalli, M.; Cascarano, G.L.; Giacovazzo, C.; Guagliardi, A.; Moliterni, A.G.; Polidori, G.; Spagna, R. SIR97: A new tool for crystal structure determination and refinement. J. Appl. Crystallogr. 1999, 32, 115–119. [Google Scholar] [CrossRef]
- Farrugia, L.J. WinGX and ORTEP for Windows: An update. J. Appl. Crystallogr. 2012, 45, 849–854. [Google Scholar] [CrossRef]
- Sheldrick, G.M. Crystal structure refinement with SHELXL. Acta Crystallogr. Sect. C Struct. Chem. 2015, 71, 3–8. [Google Scholar] [CrossRef] [PubMed]
- Pinsky, M.; Avnir, D. Continuous symmetry measures. 5. The classical polyhedra. Inorg. Chem. 1998, 37, 5575–5582. [Google Scholar] [CrossRef]
- Casanova, D.; Cirera, J.; Llunell, M.; Alemany, P.; Avnir, D.; Alvarez, S. Minimal distortion pathways in polyhe-dral rearrangements. J. Am. Chem. Soc. 2004, 126, 1755–1763. [Google Scholar] [CrossRef]
- Cirera, J.; Ruiz, E.; Alvarez, S. Shape and Spin State in Four-Coordinate Transition-Metal Complexes: The Case of the d6 Configuration. Chem.—Eur. J. 2006, 12, 3162–3167. [Google Scholar] [CrossRef] [PubMed]
- Ney, A.; Kammermeier, T.; Ney, V.; Ollefs, K.; Ye, S. Limitations of measuring small magnetic signals of samples deposited on a diamagnetic substrate. J. Magn. Magn. Mater. 2008, 320, 3341–3346. [Google Scholar] [CrossRef]
- Handzlik, G.; Magott, M.; Arczyński, M.; Sheveleva, A.M.; Tuna, F.; Sarewicz, M.; Osyczka, A.; Rams, M.; Vieru, V.; Chibotaru, L.F. Magnetization dynamics and coherent spin manipulation of a propeller Gd (III) complex with the smallest helicene ligand. J. Phys. Chem. Lett. 2020, 11, 1508–1515. [Google Scholar] [CrossRef] [PubMed]
- Topping, C.; Blundell, S. AC susceptibility as a probe of low-frequency magnetic dynamics. J. Phys. Condens. Matter 2018, 31, 013001. [Google Scholar] [CrossRef] [PubMed]
- Liu, C.-M.; Xiong, J.; Zhang, D.-Q.; Wang, B.-W.; Zhu, D.-B. Multiple thermal magnetic relaxation in a two-dimensional ferromagnetic dysprosium (III) metal–organic framework. RSC Adv. 2015, 5, 104854–104861. [Google Scholar] [CrossRef]
- Borah, A.; Murugavel, R. Magnetic relaxation in single-ion magnets formed by less-studied lanthanide ions Ce (III), Nd (III), Gd (III), Ho (III), Tm (II/III) and Yb (III). Coord. Chem. Rev. 2022, 453, 214288. [Google Scholar] [CrossRef]
- Feltham, H.L.; Brooker, S. Review of purely 4f and mixed-metal nd-4f single-molecule magnets containing only one lanthanide ion. Coord. Chem. Rev. 2014, 276, 1–33. [Google Scholar] [CrossRef]
- Seki, T.; Chiang, K.-Y.; Yu, C.-C.; Yu, X.; Okuno, M.; Hunger, J.; Nagata, Y.; Bonn, M. The bending mode of water: A powerful probe for hydrogen bond structure of aqueous systems. J. Phys. Chem. Lett. 2020, 11, 8459–8469. [Google Scholar] [CrossRef]


Disclaimer/Publisher’s Note: The statements, opinions and data contained in all publications are solely those of the individual author(s) and contributor(s) and not of MDPI and/or the editor(s). MDPI and/or the editor(s) disclaim responsibility for any injury to people or property resulting from any ideas, methods, instructions or products referred to in the content. |
© 2023 by the authors. Licensee MDPI, Basel, Switzerland. This article is an open access article distributed under the terms and conditions of the Creative Commons Attribution (CC BY) license (https://creativecommons.org/licenses/by/4.0/).
Share and Cite
Wan, Q.; Arczyński, M.; Wakizaka, M.; Gupta, S.; Funakoshi, N.; Yamashita, M. Single-Ion Magnetism in a Three-Dimensional Thiocyanate-Bridged Dysprosium(III) Framework. Chemistry 2023, 5, 987-995. https://doi.org/10.3390/chemistry5020067
Wan Q, Arczyński M, Wakizaka M, Gupta S, Funakoshi N, Yamashita M. Single-Ion Magnetism in a Three-Dimensional Thiocyanate-Bridged Dysprosium(III) Framework. Chemistry. 2023; 5(2):987-995. https://doi.org/10.3390/chemistry5020067
Chicago/Turabian StyleWan, Qingyun, Mirosław Arczyński, Masanori Wakizaka, Shraddha Gupta, Nobuto Funakoshi, and Masahiro Yamashita. 2023. "Single-Ion Magnetism in a Three-Dimensional Thiocyanate-Bridged Dysprosium(III) Framework" Chemistry 5, no. 2: 987-995. https://doi.org/10.3390/chemistry5020067