Article

pH-Responsive Color Indicator of Saffron (Crocus sativus L.) Anthocyanin-Activated Salep Mucilage Edible Film for Real-Time Monitoring of Fish Fillet Freshness

1
Transfer Phenomena Laboratory (TPL), Department of Food Science, Technology and Engineering, College of Agriculture and Natural Resources, University of Tehran, Karaj 7787131587, Iran
2
Department of Food Science and Engineering, Islamic Azad University, Science and Research Branch, Tehran 1477893855, Iran
3
Department of Nursing, University of Social Welfare and Rehabilitation Sciences, Tehran 1985713871, Iran
4
Functional Food Research Core, College of Agriculture and Natural Resources, University of Tehran, Karaj 7787131587, Iran
*
Author to whom correspondence should be addressed.
Chemistry 2022, 4(4), 1360-1381; https://doi.org/10.3390/chemistry4040089
Submission received: 3 September 2022 / Revised: 7 October 2022 / Accepted: 9 October 2022 / Published: 20 October 2022
(This article belongs to the Section Food Science)

Abstract

:

Highlights

  • Salep mucilage and SAAs were used to develop a halochromic indicator.
  • A casting method was used to produce intelligent salep mucilage edible films.
  • The incorporation of anthocyanin affected surface morphology, and the physicochemical, barrier, and mechanical properties of salep mucilage edible indicator films.
  • The intelligent indicator films underwent a visible color change to discriminate between fresh, consumable, and spoiled rainbow trout fillets.

Abstract

Researchers have been focusing increasingly on preparing innovative packaging films made from renewable and biodegradable materials in recent years. This research set out to fabricate and analyze pH-sensitive edible films based on salep mucilage combined with anthocyanin from saffron (Crocus sativus L.) (SAAs). A casting technique was developed with varying concentrations of SAAs (0, 2.5, 5, 7.5, and 10%v/v) pH-sensitive edible films. The surface morphology, physicochemical, barrier, and mechanical properties, as well as the pH sensitivity of films, were investigated. The results showed SAAs increased thickness, water solubility, moisture content, and oxygen permeability (O2P) up to 199.03 µm, 63.71%, 14.13%, and 47.73 (cm3 µm m−2 day−1 kPa−1), respectively, of the pH-sensitive salep mucilage edible indicator films. As expected, the SAAs concentration from 0% to 10%v/v decreased tensile strength, transparency, and contact angle to 11.94 MPa, 14.27%, and 54.02°, respectively. Although achieving the highest elongation at the break (108%) and the lowest water vapor permeability (WVP) (1.39 g s−1 m−1 Pa−1 × 10⁻¹¹), the pH-sensitive edible indicator film containing 5 %v/v of SAAs showed the best results. An investigation of pH sensitivity revealed that the solution’s pH variation altered the SAAs color. When the pH was raised from 3 to 11, the SAAs’ color shifted from pink to brown. The SAAs-halochromic salep mucilage edible indicator film was employed as a label in an experiment to track the degradation of fish fillets stored at 4 °C, revealing that the halochromic indicator changed color from yellow to brown as the fish was stored. Our findings show that SAAs-loaded salep mucilage indicator films help monitor real-time food deterioration.

1. Introduction

The development of bio-based intelligent packaging with the potential to provide information about the food’s state (such as freshness) is attracting much attention [1]. In reality, intelligent packaging may be defined as a substance with a part that can track the freshness of the food it contains or the conditions under which it is carried and stored. It may result in better protecting of food from spoilage, increase its storage life, and act as a shield against the factors causing food spoilage [2]. Since changes in pH reflect a food’s freshness and spoilage process, the pH indicator is the most popular of all packaging indicators. Since the colorimetric indication is inextricably linked to the pH indicator, it is of paramount importance [3]. There has been prior research on colorimetric indicators representing qualitative information via color alterations by natural plant dyes, including anthocyanin. In this regard, Alizadeh-Sani et al. (2021) developed pH-responsive color indicator films based on methylcellulose/chitosan nanofibers and barberry anthocyanins for real-time monitoring of meat freshness [4]. Abedi-Firoozjah et al. (2022) investigated the application of red cabbage anthocyanins as pH-sensitive pigments in smart food packaging and sensors [5]. Amaregouda et al. (2022) fabricated an intelligent/active films based on chitosan/polyvinyl alcohol matrices containing Jacaranda cuspidifolia anthocyanin for real-time monitoring of fish freshness [6]. Shakouri et al. (2022) developed an active and intelligent colorimetric biopolymer indicator based on anthocyanin-loaded gelatin-basil seed gum films [7]. This phenomenon is because of anthocyanin’s pH-dependent color reaction. As a member of the polyphenolic family of chemicals known as flavonoids, water-soluble anthocyanin is responsible for various colors in plants, from red to blue [4].
Furthermore, anthocyanin has several physiological benefits, such as antioxidant, anti-inflammatory, anti-cancer, antibacterial, and neuroprotective capabilities [8]. The pH of an environment causes anthocyanins to alter their color. Since pH variations are often linked to spoiling, anthocyanin-rich packaging is used as intelligent pH indicators to illustrate specific color changes and track perishability [9]. Recent interest in the health benefits of natural chemicals has led to the discovery of natural pH-detecting dyes, which show promise for the future of intelligent packaging because of their lack of toxicity, ease of production, and lack of contamination [10].
Saffron (Crocus Sativus L.), grown primarily in Iran and accounting for more than 90% of total saffron production worldwide, has cyanic-colored flowers with anthocyanins as the main colorant [11]. The saffron flower’s petals account for a significant portion of the plant’s dry weight, suggesting that these may be valuable agricultural waste and a source of natural anthocyanins. The saffron flower has been the subject of many studies due to its potential as a biological and cancer treatment agent [12].
The principal antioxidant chemicals in petals, such as flavonoids, anthocyanins, and flavonols, are responsible for these functional qualities [13]. Various organs of saffron contain kaempferol, astragalin, helichrysosid, kaempferol-3- glycopyranosyl (1-2)-6 acetylglucopyranoside, kaempferol-3-glucopyranosyl(1-2)-glucopyranoside, miricetin, quercetin, delphinidin, petunidin, and delphinidin [14]. Given that the petals account for more than half of a saffron flower’s total weight and those vast quantities of saffron flowers are returned to nature each year in Iran after the stigmas are harvested, the anthocyanins in saffron’s petal extract could be used as a natural resource of colorants in food products [15].
An edible film is defined as a thin coating that may be applied and acts as a barrier to scent, moisture, and oxygen and is made from hydrocolloids, lipids, or a combination of the two (composites). Researchers are particularly interested in polysaccharides because of their ubiquity, high film formation quality, and low gas permeability [16]. Based on these observations, it is clear that salep has promising properties for preparing edible films with several uses [17]. The flour, called salep, is made by grinding up orchid tubers, contains 12% humidity, 5% protein, 2.7% starch, and 2.4% ash, and is abundant in glucomannan (16–55%). Salep glucomannan is comprised of glucose and mannose in a 1:3.8 ratio, with a linear (or very slightly branched) chain and hexopyranose groups bonded by β-(1→4) linkages [18]. Salep is a dietary and pharmaceutical substance because of its polymeric structure, aphrodisiac effect, and other medical properties [19].
Thus, the present study aimed to create saffron anthocyanin-loaded intelligence indicator films based on salep mucilage. The colorimetric indicator was utilized to track the spoiling of rainbow trout fillet based on its pH-color responsiveness, optical, mechanical, barrier properties, antioxidant, and antibacterial activity.

2. Materials and Methods

2.1. Materials

Saffron petals were collected from Mashhad, Iran. The palmate tuber salep (Figure 1) was acquired from Sanandaj, Iran. 2, 2′-azinobis-(3-ethylbanzthiazo-line-6-sulfonate) (ABTS), 2, 2-diphenyl-1-picrylhydrazyl (DPPH), and Folin-Ciocalteu were purchased from Sigma-Aldrich (St. Louis, MO, USA). Glycerol was obtained by ACROS (Loughborough, UK) and used as a softener. All the other solvents and chemicals used in this research were of analytical grade. Fish farms provide fresh rainbow trout (Oncorhynchus mykiss) fillets in Karaj, Iran.

2.2. Extraction of Anthocyanin

Saffron petals were dried at room temperature after the stigma was removed, and then crushed dried petals were sieved (40 meshes) and stored in dark vials at 4 °C. The anthocyanin extraction was performed using the procedure described by Khazaei et al. (2016) with slight modifications [13]. Powdered saffron petals were combined with citric acid-acidified distilled water:ethanol (75:25 v/v), at a ratio of 1:20 (w/v), for 24 h before being centrifuged for 10 min at 5000× g to remove any remaining solids. After the solvent was evaporated from the extract using a rotary evaporator (IKA, Staufen, Germany) set at 37 °C, the resulting filtrate was kept in the dark container in the refrigerator. For this experiment, we used a UV/Visible Spectrophotometer (Spectrum, Grosshansdorf, Germany) to examine the color shifts in SAAs solution over a range of pH levels, measuring from 400 to 800 nm.

2.3. Preparation of Indicator Films

The salep mucilage edible control films were prepared using our previous method [20]. Initially, yellow-white salep powder was obtained from palmate tuber salep after washing for 15 min with distilled water, drying at 40 °C in the oven for 24 h at atmospheric pressure, and milling. Then, the salep powder was immersed in distilled water with a mixer (IKA, Staufen, Germany) at 25 °C for 1 h. The mixture was homogenized at 10,000× g for 5 min using a homogenizer (IKA, Staufen, Germany); a centrifuge at 3000× g for 10 min solutions was filtered. Film solution was prepared by slowly dissolving 2% (w/v) mucilage, and glycerol as a plasticizer in 25% (w/w) based on salep mucilage weight, which was prepared under constant stirring (500 rpm) at 25 ± 2 °C for 1 h. Different concentrations of SAAs (0, 2.5, 5, 7.5 and 10%v/v based on solution volume) were then added. Using a 2 N NaOH solution, the mixture was adjusted to pH 7.0 and stirred for 20 min. The mixture was then sonicated for 5 min at 100 W using a high-intensity ultrasonic probe (Topsonics, Tehran, Iran) to improve dissolution. After that, the film-forming solution was poured into onto plastic Petri dishes, dried at 35 °C for 24 h, and then conditioned at 25 °C-53% R.H. (by placing a saturated magnesium nitrate solution), at which point the control and antibacterial bionanocomposite films (Figure 1) were ready for use.

2.4. Color Parameters and pH Sensitivity

The sensitivity of the salep mucilage edible indicator films to changes in pH was determined by preparing 20 × 20 mm diameter discs of the films and then immersing them in solutions with different pH values (3, 5, 7, 9, and 11) prepared using NaOH and HCl solutions. Color parameters of the indicator films were taken digitally, and their colors were evaluated using an instrumental colorimeter (Minolta, Japan) after being calibrated against a white plate. Using the color coordinates L* or lightness (black = 0 to white = 100), a* (greenness = −60 to redness = +60) and b* (blueness = −60 to yellowness = +60), the following equations are used to calculate the total color difference (ΔE) (Equation (1)), whitish (WI) (Equation (2)), and yellowness (YI) (Equation (3)) indices of samples, respectively [21]:
Δ E = ( L L ) 2 + ( a a ) 2 + ( b b ) 2
WI = 100 ( 100 L ) 2 + a 2 + b 2
YI = 142.86 × b / L

2.5. Physical Properties

2.5.1. Film Thickness

The thickness of the edible indicator films made from salep mucilage was measured using a digital micrometer (Mitutoyo, Kanagawa, Japan) by selecting ten random sites with a resolution of 0.001 mm.

2.5.2. Moisture Content (MC)

Salep mucilage edible indicator films were conditioned at room temperature at 53% R.H. for 24 h before their MC was measured. Before being dried at 110 °C for 24 h, the indicator films were weighed and placed in a pre-weighed aluminum capsule. The following Equation (4) was then used to calculate MC:
MC   ( % ) = ( W i W d / W i ) × 100  
Here, Wi is the initial sample weight, and Wd is the dried sample weight.

2.5.3. Water Solubility (W.S.)

To calculate the water solubility of the salep mucilage edible indicator films, the films (3 × 3 cm2) were dried for 24 h at 110 °C. After the indicator films were weighed to establish their dry weight, they were submerged in 40 mL of water and agitated for 24 h at room temperature. Separated and dried at 110 °C, the ultimate weights of insoluble indicator films were then determined. The following Equation (5) was then used to determine their W.S.:
W . S .   ( % ) = ( W i W f / W i ) × 100
Here, Wi is the initial sample weight, and Wf is the insoluble sample weight [18].

2.5.4. Transparency

The transparency value of the salep mucilage edible indicator films was measured by using a UV/Visible Spectrophotometer and calculated from the following Equation (6) according to ASTM D1746 standard method [22] and calculated as:
T 600 = ( log T % / L ) × 100  
where T600 is the transparency value at 600 nm, T% is the transmittance percentage at 600 nm, and L is the edible indicator film thickness (mm). All measurements of color properties were done in three replications.

2.5.5. Wettability

The contact angle (C.A.) was measured using the sessile drop technique to establish the wettability of salep mucilage edible indicator films. An optical goniometer (Kruss, Hamburg, Germany) was used to determine the contact angle between the surfaces of the produced films and water. To do this, we placed a droplet of distilled water (4 μL) on the indicator films and measured the droplet’s angle.

2.6. Permeability Properties

2.6.1. Water Vapor Permeability (WVP)

The Salep mucilage edible indicator films’ WVP was measured using a tweaked version of ASTM E96-95′s procedure [23]. Before testing, the films were conditioned in a laboratory for 24 h at an ambient temperature and 53% R.H. As a result, we may derive the WVP (g m˗1 s˗1 pa˗1) using Equation (7):
WVP = ( Δ w × X ) / ( t × A × Δ p )  
Here, Δw is the weight change of the glass cell containing the water (g), X is the average indicator films thickness (m), t is the time (s), A is the area of the exposed indicator films (m2), and Δp is the water vapor pressure difference across the two sides of the indicator films (1489.8 Pa).

2.6.2. Oxygen Permeability (O2P)

The O2P of the salep mucilage edible indicator films was measured at 25 °C and 53% R.H. using a gas permeability tester (Brugger, Munich, Germany) according to the standard ASTM D3985. Accordingly, the oxygen permeability is calculated as follows (Equation (8)):
O 2 P = ( OTR × Δ X ) / Δ p
where O2P is oxygen permeability (cm3 µm m−2 day−1 kPa−1), OTR is oxygen transmission rate (cm3 m−2 day−1), X is the film thickness (µm), and Δp is the oxygen partial pressure difference across the film (101 kPa) [24].

2.7. Mechanical Properties

A texture analyzer (Testometric, Rochdale, UK) was used to determine the tensile strength (T.S.) and elongation at break (EAB) of salep mucilage edible indicator films according to the standard method of ASTM D882 [25]. Before testing, the films were previously conditioned (53% R.H. at 25 °C for 48 h). Rectangular (10 × 100 mm) strips of samples were tested at a crosshead speed of 0.5 mm/s.

2.8. Morphology

2.8.1. Scanning Electron Microscopy (SEM)

Scanning electron microscopy (Philips XL30, Eindhoven, The Netherlands) was used to assess the effects of the salep mucilage edible indicator films’ microstructure (surface and cross-section). The indicator films were broken in liquid nitrogen, then fixed on an aluminum stub using adhesive tape and spluttered with gold using a sputter coater (Balzers, Liechtenstein) before visualization. The observation was conducted at 15 kV acceleration potential.

2.8.2. Atomic Force Microscopy (AFM)

Samples were examined by tapping mode AFM (Nanoscope IIIa Multimode, Santa Barbara, CA, USA) equipped with an E-type scanner. The rectangular silicon cantilever was employed with a nominal spring constant of 5–100 N/m and nominal resonance frequencies of 10–320 kHz. The samples were attached to mica surfaces and examined in the air at 25 °C with 65% relative humidity. The NanoScope software is employed for all AFM image processing.

2.9. Antioxidant Properties

Initially, the extracted indicator film solution was prepared for analysis by adding 50 mg of each salep mucilage edible indicator film into 10 mL of distilled water and mixing for 2 h, followed by 5 min of centrifugation at 4000× g. The supernatant was then collected using three different in vitro methods to test the antioxidant activity.

2.9.1. Total Phenolic Content

The total phenolic content (TPC) of Salep mucilage edible indicator films was measured using the Folin-Ciocalteu method, as reported by Jridi et al. (2019), with minor changes [26]. An aliquot of 2 mL of Folin-Ciocalteu reagent (10%v/v) was added to 0.5 mL of film extract or SAAs and stored in the dark for 3 min. Then, 2.5 mL of sodium carbonate solution (7.5 %w/v) was added to the mixture and kept in the dark at 25 °C. Finally, the absorbance of the sample was measured by UV/Visible Spectrophotometer at 765 nm. A standard curve (0–100 μg/mL) was plotted using gallic acid as a standard. The total phenolic content was then reported as mg of gallic acid (GAE), equivalent to 100 g of sample.

2.9.2. Total Anthocyanin Content

The pH-differential method was used to measure the total anthocyanins content (TAC) of SAAs and salep mucilage edible indicator films, as reported by Sutharut et al. (2012), with minor changes [27]. The absorbance of each dilution at 510 and 700 nm against a blank cell filled with distilled water was measured. Absorbance readings are done against water blanks. The absorbance of the diluted sample (A) was calculated as follows:
A = ( A 510 A 700 ) p H   1 ( A 510 A 700 ) p H   4.5      
The monomeric anthocyanin pigment concentration in the original sample was calculated as follows:
Monomeric   anthocyanin   ( mg / L ) = ( A × MW × DF × V × 1000 ) / ( ε × W × L )  
where A is the absorbance, M.W. is the molecular weight of cyanidin-3-glucosode (449.2 g/mol), D.F. is the dilution factor, V is the solvent volume (mL), ε is the molar absorptivity (26,900 L.mol−1.cm−1), W is sample weight (mg), and L is the cell path length (1 cm).

2.9.3. Total Flavonoid Content

The procedure described by Habibi et al. (2015) was pursued to determine total flavonoid content (TFC) [28]. The absorbance was measured at 415 nm. Different concentrations of quercetin (QUE) were used in plotting the standard calibration curve. The TFC was expressed as mg QUE/100 g.

2.9.4. ABTS Radical Scavenging Activity

ABTS+ radical scavenging activity of salep mucilage edible indicator films was evaluated according to the method described by Müller et al. (2011). The absorbance was measured at 734 nm. The ABTS radical scavenging activity was then calculated using the following expression:
A B T S   r a d i c a l   s c a v e n g i n g   a c t i v i t y   ( % ) = ( A c A s / A c ) × 100
Here, AC is the absorbance of the control at 734 nm, and AS is the absorbance of the sample at 734 nm [29].

2.9.5. DPPH Radical Scavenging Assay

The DPPH radical scavenging of salep mucilage edible indicator films was evaluated according to Lin et al. (2012) method. The absorbance was read at 517 nm. The DPPH radical scavenging was then calculated according to the following Equation (12):
D P P H   r a d i c a l   s c a v e n g i n g   ( % ) = ( 1 ( A s / A C ) ) × 100
Here, AC is the absorbance of the control, and AS is the absorbance of the sample [30].

2.9.6. Reducing Power Assay

The reducing power test was based on the ability of salep mucilage edible indicator films to reduce ferric ions, which was determined according to the method described by Samotyja (2019) [31]. The absorbance was recorded at 700 nm using a UV/Visible Spectrophotometer.

2.9.7. Ferric Reducing Antioxidant Power

With due attention to the TPTZ method described by Tongnuanchan et al. (2012), using Trolox as a standard of the calibration curve, the FRAP of the salep mucilage edible indicator films was performed. The ferrous tripyridyltriazine complex was measured by reading the absorbance at 593 nm. The activity was calculated after sample blank subtraction and was expressed as µmol Trolox equivalent (TRE)/g [32].

2.10. Antibacterial Properties

Escherichia coli O157:H7 (PTCC No. 1330) and Staphylococcus aureus (PTCC No. 1431) were used as model food spoilage or pathogenic microorganisms. The bacteria were incubated overnight at 37 °C on Brain Heart Infusion (BHI) broth. The antibacterial activity of the salep mucilage edible indicator films was then determined using the agar disc diffusion assay, according to the method described by Ekrami et al. (2022), with some modifications. Suspensions of the microorganisms (1–5 × 10⁸ CFU/mL) were placed on the surfaces of the BHI agar plates. Measurements of the dimensions of the inhibition zones were used to establish the antibacterial efficacy of the different microbial strains. For this experiment, 6 mm diameter disks of films were cut and sterilized by UV irradiation for 30 s, then placed on an MHA inoculated agar, and incubated at 37 °C for 18 h [33].

2.11. Evaluation of Fish Freshness

2.11.1. Preparation of Samples

Fresh fish was chopped into strips after removing the intestines, head, skin, tail, and scale, and 15 g were immediately put into Petri dishes. The Petri plates were kept in a refrigerator at 4 °C after the salep mucilage edible indicator films with 5%v/v SAAs were put in the headspace. A digital camera was used to record the color shift of the indicator films.

2.11.2. pH Measurement

The pH values were determined according to Li et al. (2013). During the time intervals, pH values of fish samples were checked after vigorous homogenization (IKA, Staufen, Germany; with 12,000 rpm) of 10 g of sample in 90 mL distilled water by a digital pH meter (IKA, Staufen, Germany) [34].

2.11.3. Determination of TVB-N

The TVB-N level in the fish sample was determined using the technique developed by Zhai et al. (2017). A homogenizer was used to grind 10 g of the fish sample with 100 mL of distilled water. The homogenate was then filtered using filter paper. The filtrate was mixed with 5 mL of 1% magnesium oxide solution (1 g/L) in the reaction chamber. Distilled water was utilized as a blank control to replace the fish filtrate. Following the completion of the reaction, the boric acid solution was titrated with 0.01 M hydrochloric acid solution until the color changed to blue-violet. The TVB-N level was determined using the following Equation (13):
X = ( ( V 1 V 2 ) × C × 14 / m × 0.05 ) × 100
where X is the TVB-N of the fish sample (mg/100 g); V1 is the volume of hydrochloric acid consumed by the sample (mL); V2 is the volume of hydrochloric acid consumed in the blank (mL); C is the concentration of hydrochloric acid (M); m is the sample quality (g) [35].

2.11.4. Microbial Analysis

The fish sample’s total viable count (TVC) was determined using a modified Jiang et al. (2020) technique. In summary, 10 g of each fish sample was first finely chopped and grounded. Subsequently, it was transferred into 90 mL sterilized 0.90% saline solution and homogenized (IKA, Staufen, Germany; with 12,000 rpm) for 2 min. Then, for microbial counting, 1 mL of each dilution was mixed with plate count agar (Merck, Darmstadt, Germany) in Petri dishes and incubated at 37 °C for 48 h. Total viable counts (TVC) were calculated by counting the number of colony-forming units [36].

2.12. Statistical Analysis

Data analysis was performed using SPSS v18 (SPSS Inc., Chicago, IL, USA). One-way analysis of variance (ANOVA) and Duncan’s test at a 95% confidence level (p < 0.05) were used to determine the significant difference between the averages of treatments. Three replications were used in the experiments.

3. Results and Discussion

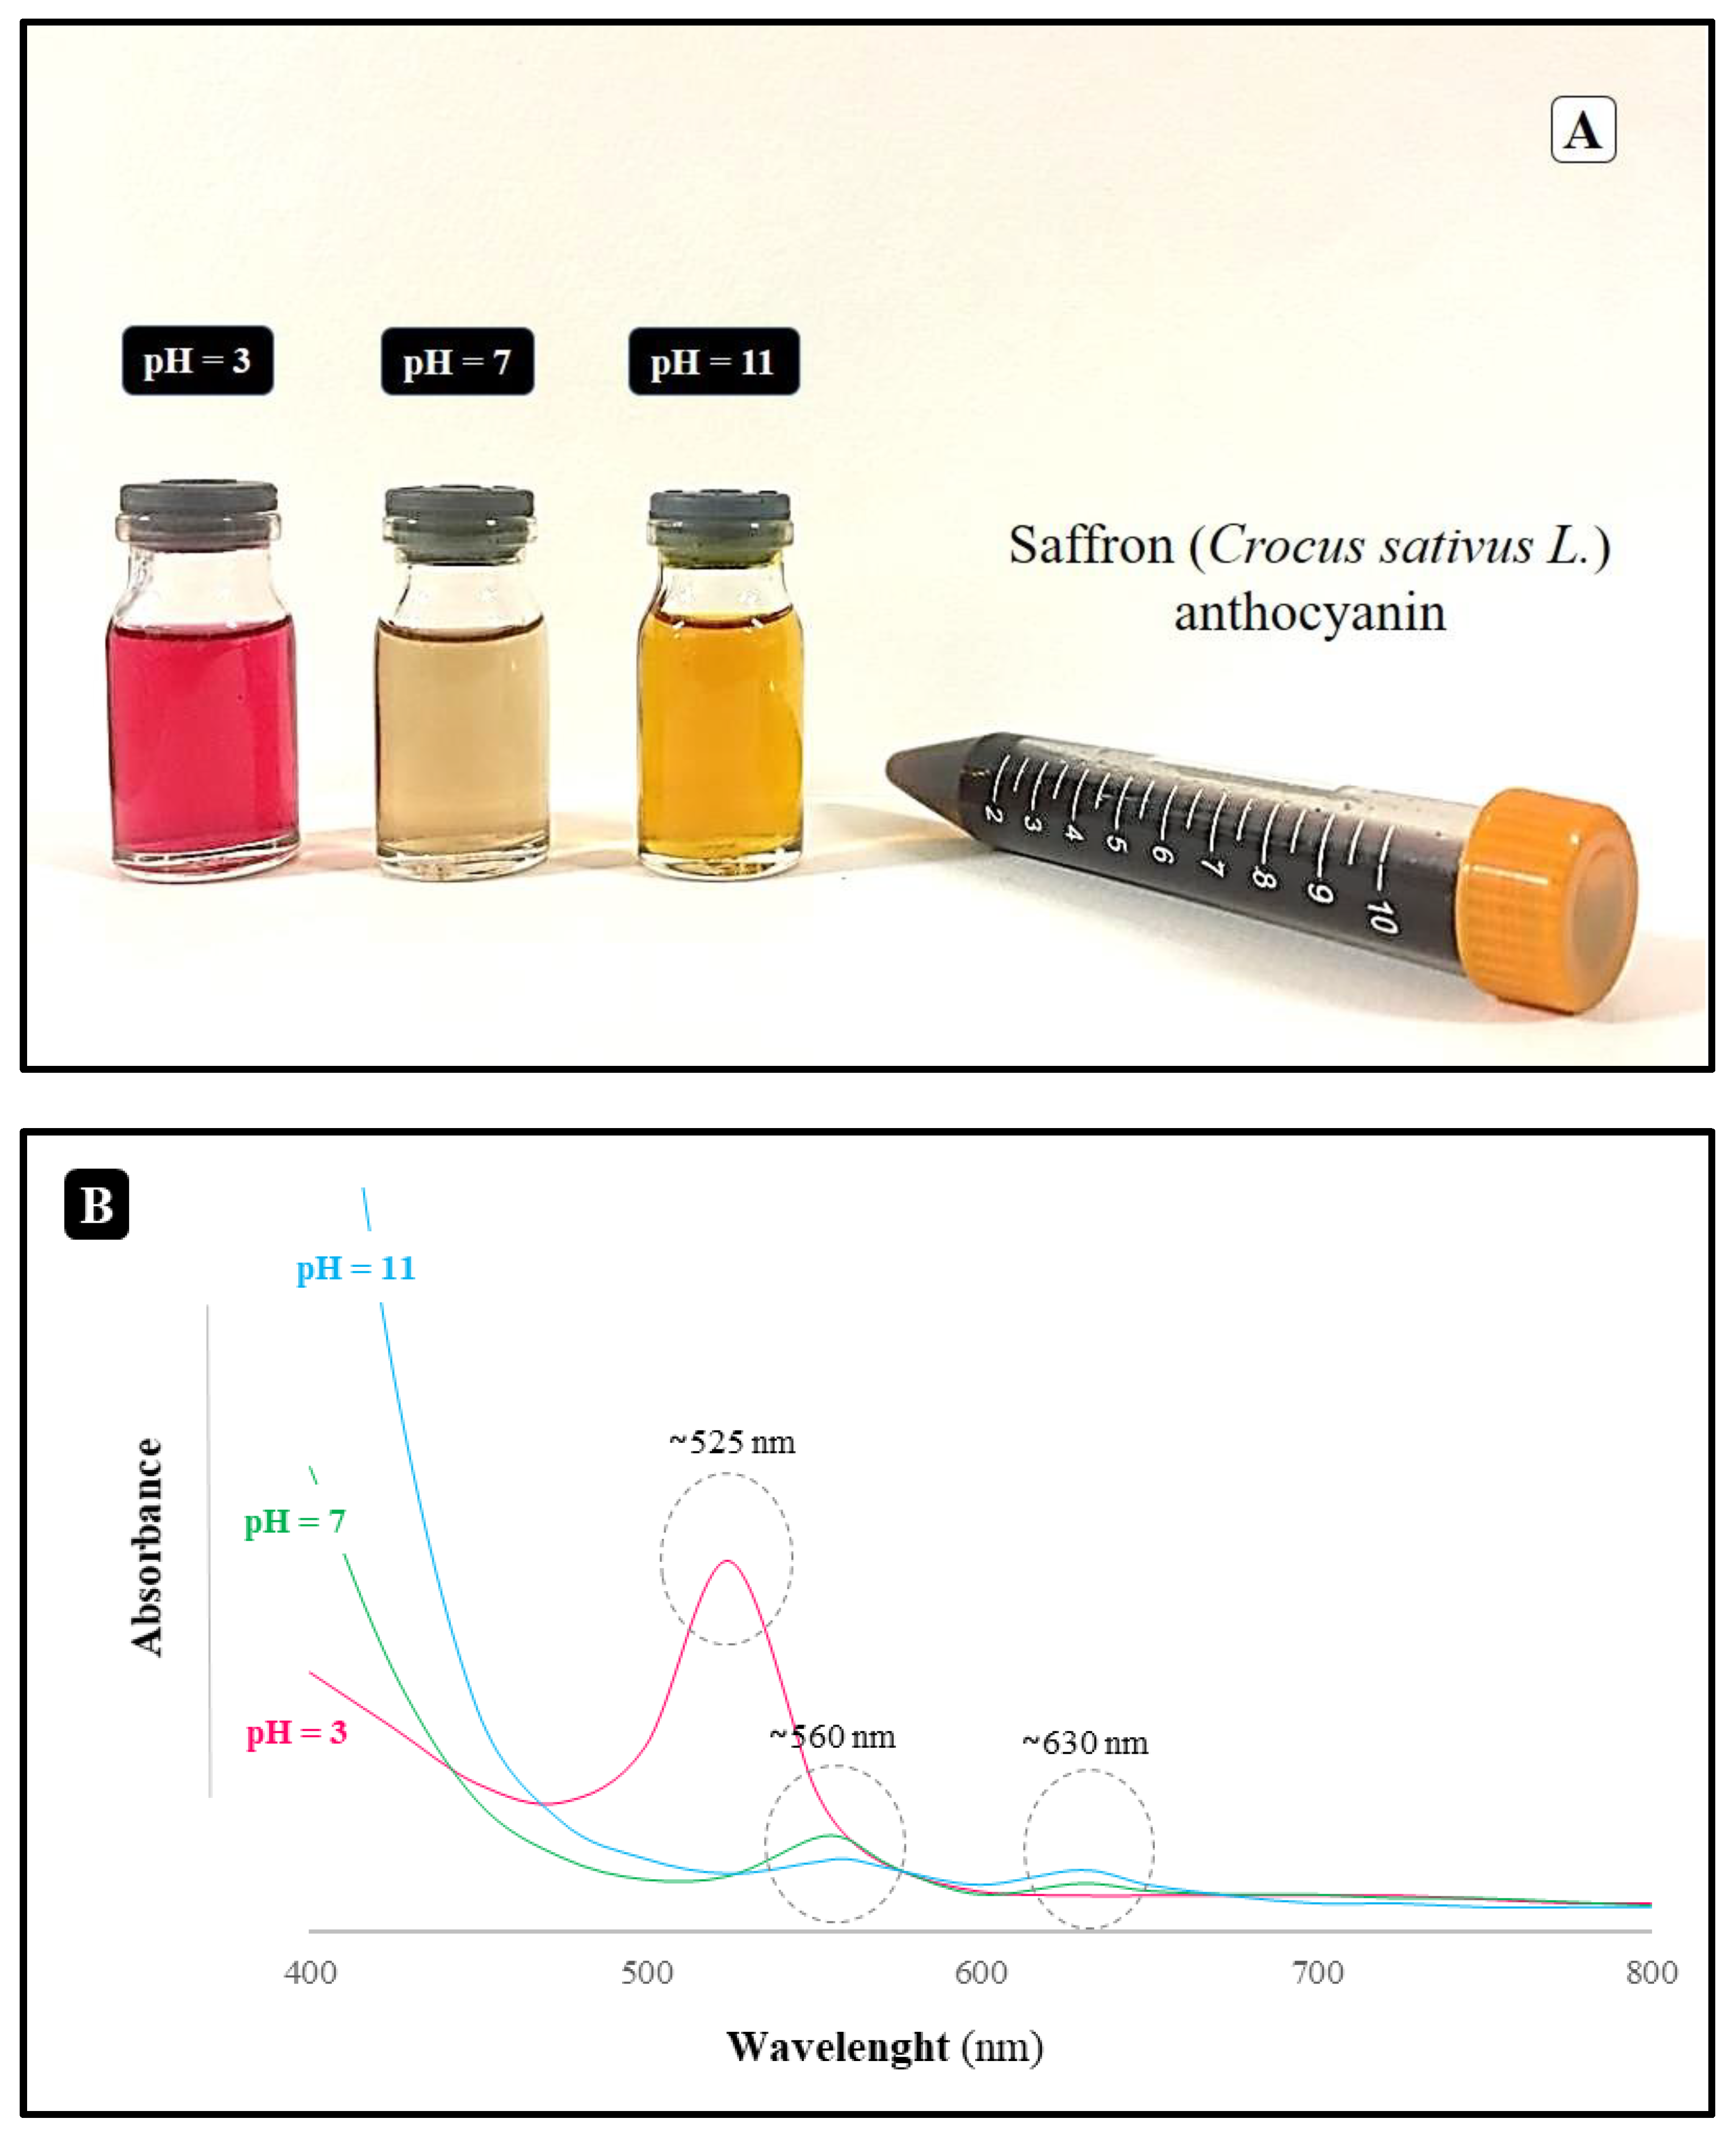
3.1. Analysis of pH Dependence of Anthocyanin Color

Our goal was to leverage the fact that anthocyanin’s color varies with pH to track changes in the qualities associated with pre-packaged fish fillets. Because of this, we monitored the UV/Visible absorption color change of SAAs solutions throughout a wide pH range (Figure 2A). As the pH was adjusted from acidic to alkaline, the solutions went from red to yellow, and many other hues appeared at intermediate pH levels. Different anthocyanin molecules undergo structural alterations at different pH levels, resulting in different colors: flavylium cation (pH 3), carbinol pseudo-base (pH 4–5), quinonoidal anhydro-base (pH 6–8), and chalcone (pH > 10) [37]. The anthocyanin solutions’ maximum absorption peak strength and wavelength were pH-dependent (Figure 2B). At a pH of 3, the absorbance peaked at 525 nm, but when the pH was raised, the peak weakened. When the pH was adjusted to pH = 7, a new peak appeared at 560 nm, and the intensity and location of this peak grew when the pH was increased. This is a hallmark property of anthocyanins (Luchese, Abdalla, Spada, and Tessaro, 2018). When the pH was increased to pH = 11, the strength of this peak decreased, and a new, faint peak emerged at 630 nm. It has already been shown that variations in the molecular species present account for the shifts in absorbance spectra and color seen in saffron anthocyanin solutions.
We intended to use the pH dependence of the color of anthocyanin to detect changes in the quality attributes of packaged fish fillets. For this reason, the change in the UV/Visible absorption color of SAAs solutions was measured over a range of pH values (Figure 2A). The color of the solutions changed from red to yellow as the pH was changed from acidic to alkaline conditions, with several different colors being formed at intermediate pH values: These color changes are due to pH-induced structural transformations of the anthocyanin molecules: flavylium cation (pH < 3); carbinol pseudo-base (pH 4–5); quinonoidal anhydro-base (pH 6–8); and chalcone (pH > 10). The intensity and wavelength of the maximum absorption peak of the anthocyanin solutions depended on pH (Figure 2B). Under highly acidic conditions (pH = 3), a strong absorbance peak was observed around ~525 nm, whose height decreased as the pH was increased. A new peak formed around ~560 nm, whose intensity and position increased as the pH was raised to pH = 7, a characteristic feature of anthocyanins (Luchese, Abdalla, Spada, and Tessaro, 2018). The intensity of this peak diminished when the pH was raised further to pH = 11, and a new weak peak appeared at ~630 nm. As mentioned earlier, the change in absorbance spectra and color of the saffron anthocyanin solutions can be attributed to changes in the molecular species present. Similar findings have been reported for anthocyanins isolated from the black plum peel [37] and blueberry [38].

3.2. Physical Properties

According to Table 1, after adding SAAs, the indicator film thickness rose substantially (p < 0.05). Polyphenols have many hydroxyl groups that bind to mucilage molecules through hydrogen bonding. As a result, the number of internal polymer interactions is reduced, leading to a more open biopolymer network and thicker structures. When biopolymer films were reinforced with either grapefruit seed extract or grapefruit extract, other studies observed comparable results [39] of apple peel extract [40], which are both rich in polyphenols.
The impact of SAAs concentration on the moisture content of the films was also measured (Table 1). The SAAs-loaded indicator films had lower moisture content than the control films. SAAs includes hydrophilic substances such as anthocyanins, other phenolic compounds, carotenoids, lipids, and minerals [41]. The increase in moisture content of the films may have been due to the impact of one or more of these constituents on film properties. Some of the components in the SAAs may have displaced water molecules from the films or interfered with cross-linking of the biopolymer network in the film, thereby decreasing its ability to absorb water molecules [42]. Other researchers reported that the moisture content of gelatin-whey protein films decreased after incorporating an orange peel extract, attributed to increased film hydrophobicity, and reducing water absorption [43].
Water solubility was lowest for the control sample (Table 1). The films’ water solubility increased as the SAAs concentration rose. Subsequently, SAAs addition increased the films’ water solubility due to the presence of hydrophilic elements in the extracts, which facilitate their dissolving in water [40]. Other researchers have reported that incorporating anthocyanin in cassava starch film decreased their water-solubility [44].
Films’ opacity was boosted by using SAAs (Table 1). Two causes contribute to this outcome. The neutral pH conditions employed to create the SAAs films allowed the pigments inside them to show through, coloring the films a light brown and enhancing their light absorption (Figure 1). As a second result, hydrophobic chemicals in SAAs created light-scattering colloidal particles in film [21].
The incorporation of SAAs, as shown by a larger contact angle, increased the films’ solubility in water (Table 1). The wettability of the film surfaces was determined by measuring the contact angle between the drop and the surface. Surfaces of films are considered hydrophilic when their contact angles are less than 90° and hydrophobic when they are more than 90°. The comparatively high polarity of the functional groups on the salep mucilage molecules explains why the lack of SAAs resulted in hydrophilic (~72°) control films. When observing the wettability by measuring the contact angle of SAAs-incorporated salep mucilage edible indicator films, we found that all are hydrophilic, with a contact angle lower than 90°. Indicator films with the greatest concentration of SAAs had the highest hydrophilic surface. One theory is that the increased connection with the SAAs makes the hydrophilic groups on the film surface more accessible, hence increasing the number of polar sites that may form a hydrogen bond with the water droplet [44]. The extracts’ polar molecules attached to the biopolymer molecules’ surfaces are responsible for the increased hydrophilicity of the resulting films [45].
The hydrophilic nature of anthocyanins might be the main reason for enhancing the hydrophilic properties of indicator films [26]. Similar behavior in indicator films was reported by Moghadam et al. (2021) for pH-sensitive edible films based on mung bean protein enriched with Echium amoenum anthocyanins [46] and Zhang et al. (2019) for multifunctional food packaging films based on chitosan, TiO2 nanoparticles, and anthocyanin-rich black plum peel extract [37].

3.3. Permeability Properties

The water vapor permeability of the salep mucilage edible indicator films was also investigated (Figure 3A). The WVP of the indicator films incorporated with low SAAs concentration (2.5 and 5%v/v) was slightly decreased from 2.43 to 1.62 and 1.39 × 10⁻¹¹ (g s−1 m−1 Pa−1), respectively, but at higher SAAs concentrations (7.5 and 10%v/v), the permeability increases up to 7.30 × 10⁻¹¹ (g s−1 m−1 Pa−1) due to the destruction of the film structure and the increase of pores. WVP is affected by factors such as the hydrophilic-hydrophobic ratio of film components and the hygroscopic nature of the anthocyanins utilized [47]. Therefore, adding hydrophilic bioactive compounds such as anthocyanins improves the film’s hydrophilicity and structural complexity, leading to lower water resistance [48]. In confirmation of the effect of anthocyanins on WVP, in the other study, Acevedo-Fani et al. (2015) found that the WVP of sodium alginate edible films decreased with the incorporation of thyme, lemongrass, and sage oil.
The O2P of the salep control film was 30.53 ± 0.85 (cm3 µm m−2 day−1 kPa−1) (Figure 3A). The films and hydrophilic coatings (polysaccharides or proteins) usually have an excellent barrier effect on oxygen transference [49]. Probably because of the even distribution of the hydrophilic section in the film’s structure, this attribute is considerably (p > 0.05) impacted by the addition of SAAs to the salep mucilage edible films. A similar study on the O2P of QSM edible films containing 1% thyme essential oil also showed no significant differences when any essential oil was incorporated into the films [50]. The oxygen permeability values of the salep edible film increased from 31.02 to 47.73 (cm3 µm m−2 d−1 kPa−1) as higher amounts of SAAs were included. Larger pores can explain this outcome by increasing the non-polar phase in the polymer network [51]. This increase in film porosity may have been due to a weakening of the attractive interactions between the biopolymer molecules in the presence of the SAAs. Similar results were obtained by Rojas-Grau et al. (2007) in alginate–apple puree edible films and by Atares et al. (2011) in hydroxy-propyl-methylcellulose films [52].

3.4. Mechanical Properties

To determine the exact effect of anthocyanin addition on the mechanical characteristics of salep mucilage edible indicator films, the concentration of SAAs was compared to the tensile strength and elongation at the break (Figure 3B). Even though the tensile strength of the indicator films dropped from 19.1 to 11.9 MPa, the elongation at the break increased from 82% to 95% and 108%, respectively, when incorporating low SAAs concentrations (2.5 and 5%v/v), while at higher SAAs concentrations (7.5 and 10%v/v), the elongation at the break decreased to 64% and 41% due to the destruction of the film structure and the increase of pores. The mechanical properties shifted primarily due to the effect of chemicals in the SAAs on the cross-linking of the biopolymers in the films. Anthocyanins, for instance, have several hydroxyl groups that may form hydrogen bonds with gelatin, lowering the number of cross-links between the gelatin molecules. This means the films may be stretched farther before breaking but require less effort. A similar decrease in tensile strength and increase in elongation at break has been reported by other researchers when essential oils, stearic acid, and palmitic acid were incorporated into gelatin films [53]. It is worth noting that the films also contained glycerol, a food-grade plasticizer that enhances the mobility of polymer chains and so reduces tensile strength; therefore, anthocyanin can replace it to some extent.

3.5. Antioxidant Activity

The TPC, TAC, TFC, DPPH, Reducing Power, FRAP, and ABTS scavenging of the dried saffron petal were found to be 1354.8 mg GAE/100 g, 80.1 mg CGE/100 g, 192.8 mg QUE/100 g, 80.3%, 0.78 (Abs 700 nm), 3.65 µmol TRE/g, and 53.6%, respectively. Ahmadian-Kouchaksaraie and Niazmand (2017) reported total phenolic content (1423 mg/100 g), total flavonoid content (180 mg/100 g), total anthocyanin content (103.4 mg/100 g), 2, 2-diphenyl-1-picrylhydrazyl free radical-scavenging activity (74.5%) and ferric reducing/antioxidant power value (3.9 mM) at optimized conditions of supercritical carbon dioxide extraction of petal saffron flowers [54].
Carbohydrates, alkaloids, flavonoids, glycosides, bibenzyl derivatives, alkaloids, and terpenoids have all been identified as major constituents in orchid chemistry. Further, when the SAAs content was raised from 0% to 10%, the films’ TPC and TAC rose, respectively (Table 2). Phenolic compounds, flavonoids, and anthocyanins are likely the biologically active components of the saffron petal and have been associated with the health benefits in humans and animals. The antioxidant and antimicrobial properties of saffron have been noticed in recent years. The beneficial effects of phenolic compounds have been attributed to their antioxidant activity [55]. This effect can be attributed to the presence of a high level of phenolic groups in the structure of the anthocyanin molecules. It should be noted that the antioxidant activity of this natural compound was lower than that of BHT. Even so, it still had good antioxidant activity [56].
The antioxidant activity of the films was evaluated by measuring their ability to quench DPPH and ABTS free radicals and their reducing power (Table 2). The antioxidant activity of extract components such as anthocyanins were shown to be dose-dependently linked to the increase in all three oxidation markers when the SAAs content was increased (p < 0.05). Studies have shown that including anthocyanins from Saffron petal extract into biopolymer films increases their antioxidant activity [57,58].

3.6. Antibacterial Properties

Testing the films’ efficacy against both Gram-positive (Staphylococcus aureus) and Gram-negative (Escherichia coli) bacterial strains helped establish the films’ antibacterial activity (Table 2). Because the control film could not inhibit the growth of either strain of bacteria, it became clear that Salep mucilage lacked any antimicrobial qualities. Indeed, these biopolymers probably served as nutrition for the bacteria that prompted their development. In contrast, SAAs-containing films inhibited the growth of both bacteria in a dose-dependent manner, with greater efficacy against Staphylococcus aureus. According to other studies, SPE-loaded Konjac glucomannan films extended the shelf life of fresh-cut cucumbers, which researchers attributed to the SAAs antibacterial capabilities [57].
SAAs seem to have bactericidal effects due to highly antimicrobial chemicals such as safranal and crocin. As a result of variations in their cell wall composition and architecture, SAAs-loaded indicator films were more efficient against Gram-positive than Gram-negative bacteria. Unlike Gram-negative bacteria, which have a phospholipid bilayer with connected lipopolysaccharides, Gram-positive bacteria have a thick outer coating of peptidoglycan [21]. As a result, the ability of bioactive components in the SAAs to penetrate the cells and interact with their key constituents is different for the two kinds of bacteria.

3.7. Color Parameters and pH Sensitivity

Films prepared with edible indicators made from salep mucilage, both with and without SAAs, were pliable and came off the casting plates with little effort. The films’ clarity, homogeneity, and appearance of fractures were reduced when the SAAs content was increased. The absence of dyes gave the control film a clear, colorless appearance. At a neutral pH, the SAAs-loaded indicator films were visibly opaque and looked yellowish-green from the presence of natural pigments. These films’ color change in response to different buffer solutions’ pH levels and demonstrates their sensitivity to pH (Figure 1). As the pH was raised from 3 to 13, the indicator films went from red to yellow. These color changes are brought on by alterations in the molecular structure and absorption characteristics of anthocyanin molecules, which are triggered by variations in pH [56]. Similar results have been reported for anthocyanins extracted from roselle [35] and red cabbage under acidic conditions (pH 3) [59].
Higher levels of anthocyanin led to more selective absorption of light wavelengths, which resulted in higher b* values for the films. When the films’ pH was adjusted to lower or higher levels, their lightness (L*) was drastically reduced. Because of the selective absorption of light waves, the * values of the films dramatically increased when the pH was altered to lower or higher. As a result, more incident light was reflected in the detector from the films at pH = 7. The measured color coordinates calculated the films’ total color difference (ΔE), whitish (WI), and yellowness. According to Tassanawat et al. (2007), a ΔE greater than five implies a color change perceptible by the human eye, which is essential for developing colorimetric sensors for packaging materials [60]. As shown in Figure 4, the ΔE values for the higher pigment concentrations in the current investigation were more than five, indicating that the SAAs-loaded indicator films may be employed as pH-sensitive indicators in novel packaging materials. However, the degree to which this is possible depends on how much the meal’s pH changes due to a shift in food quality.

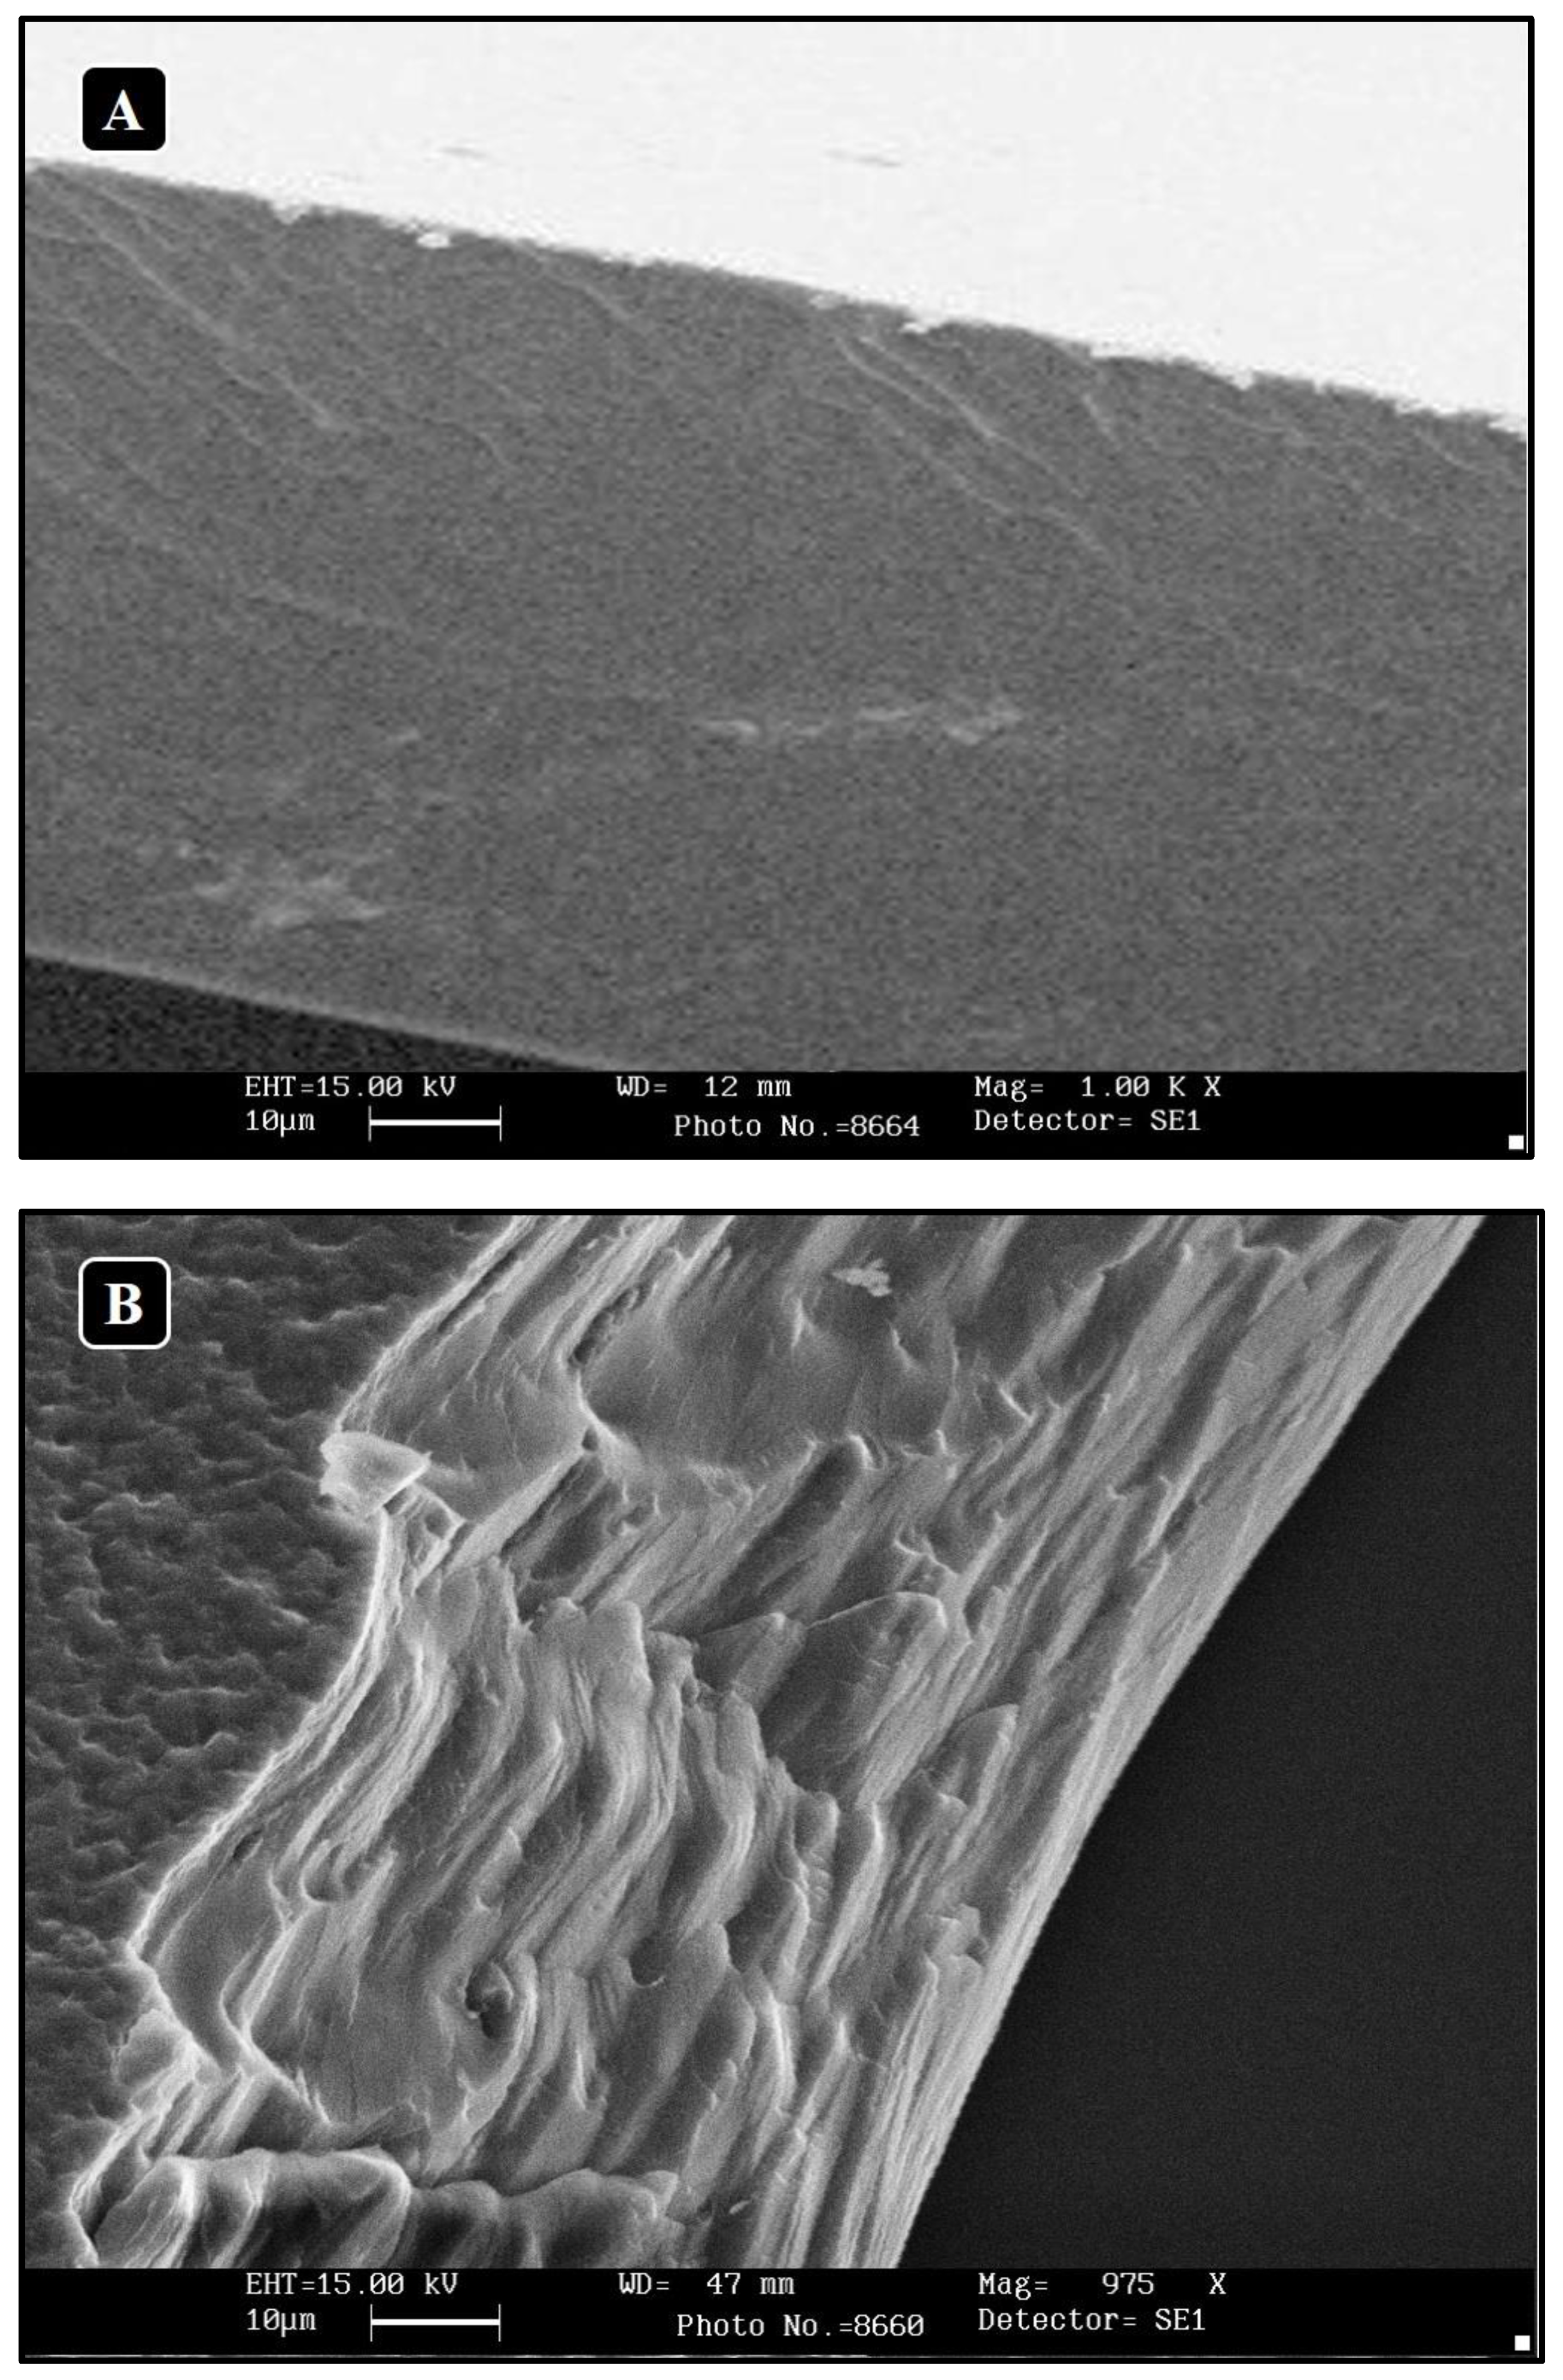
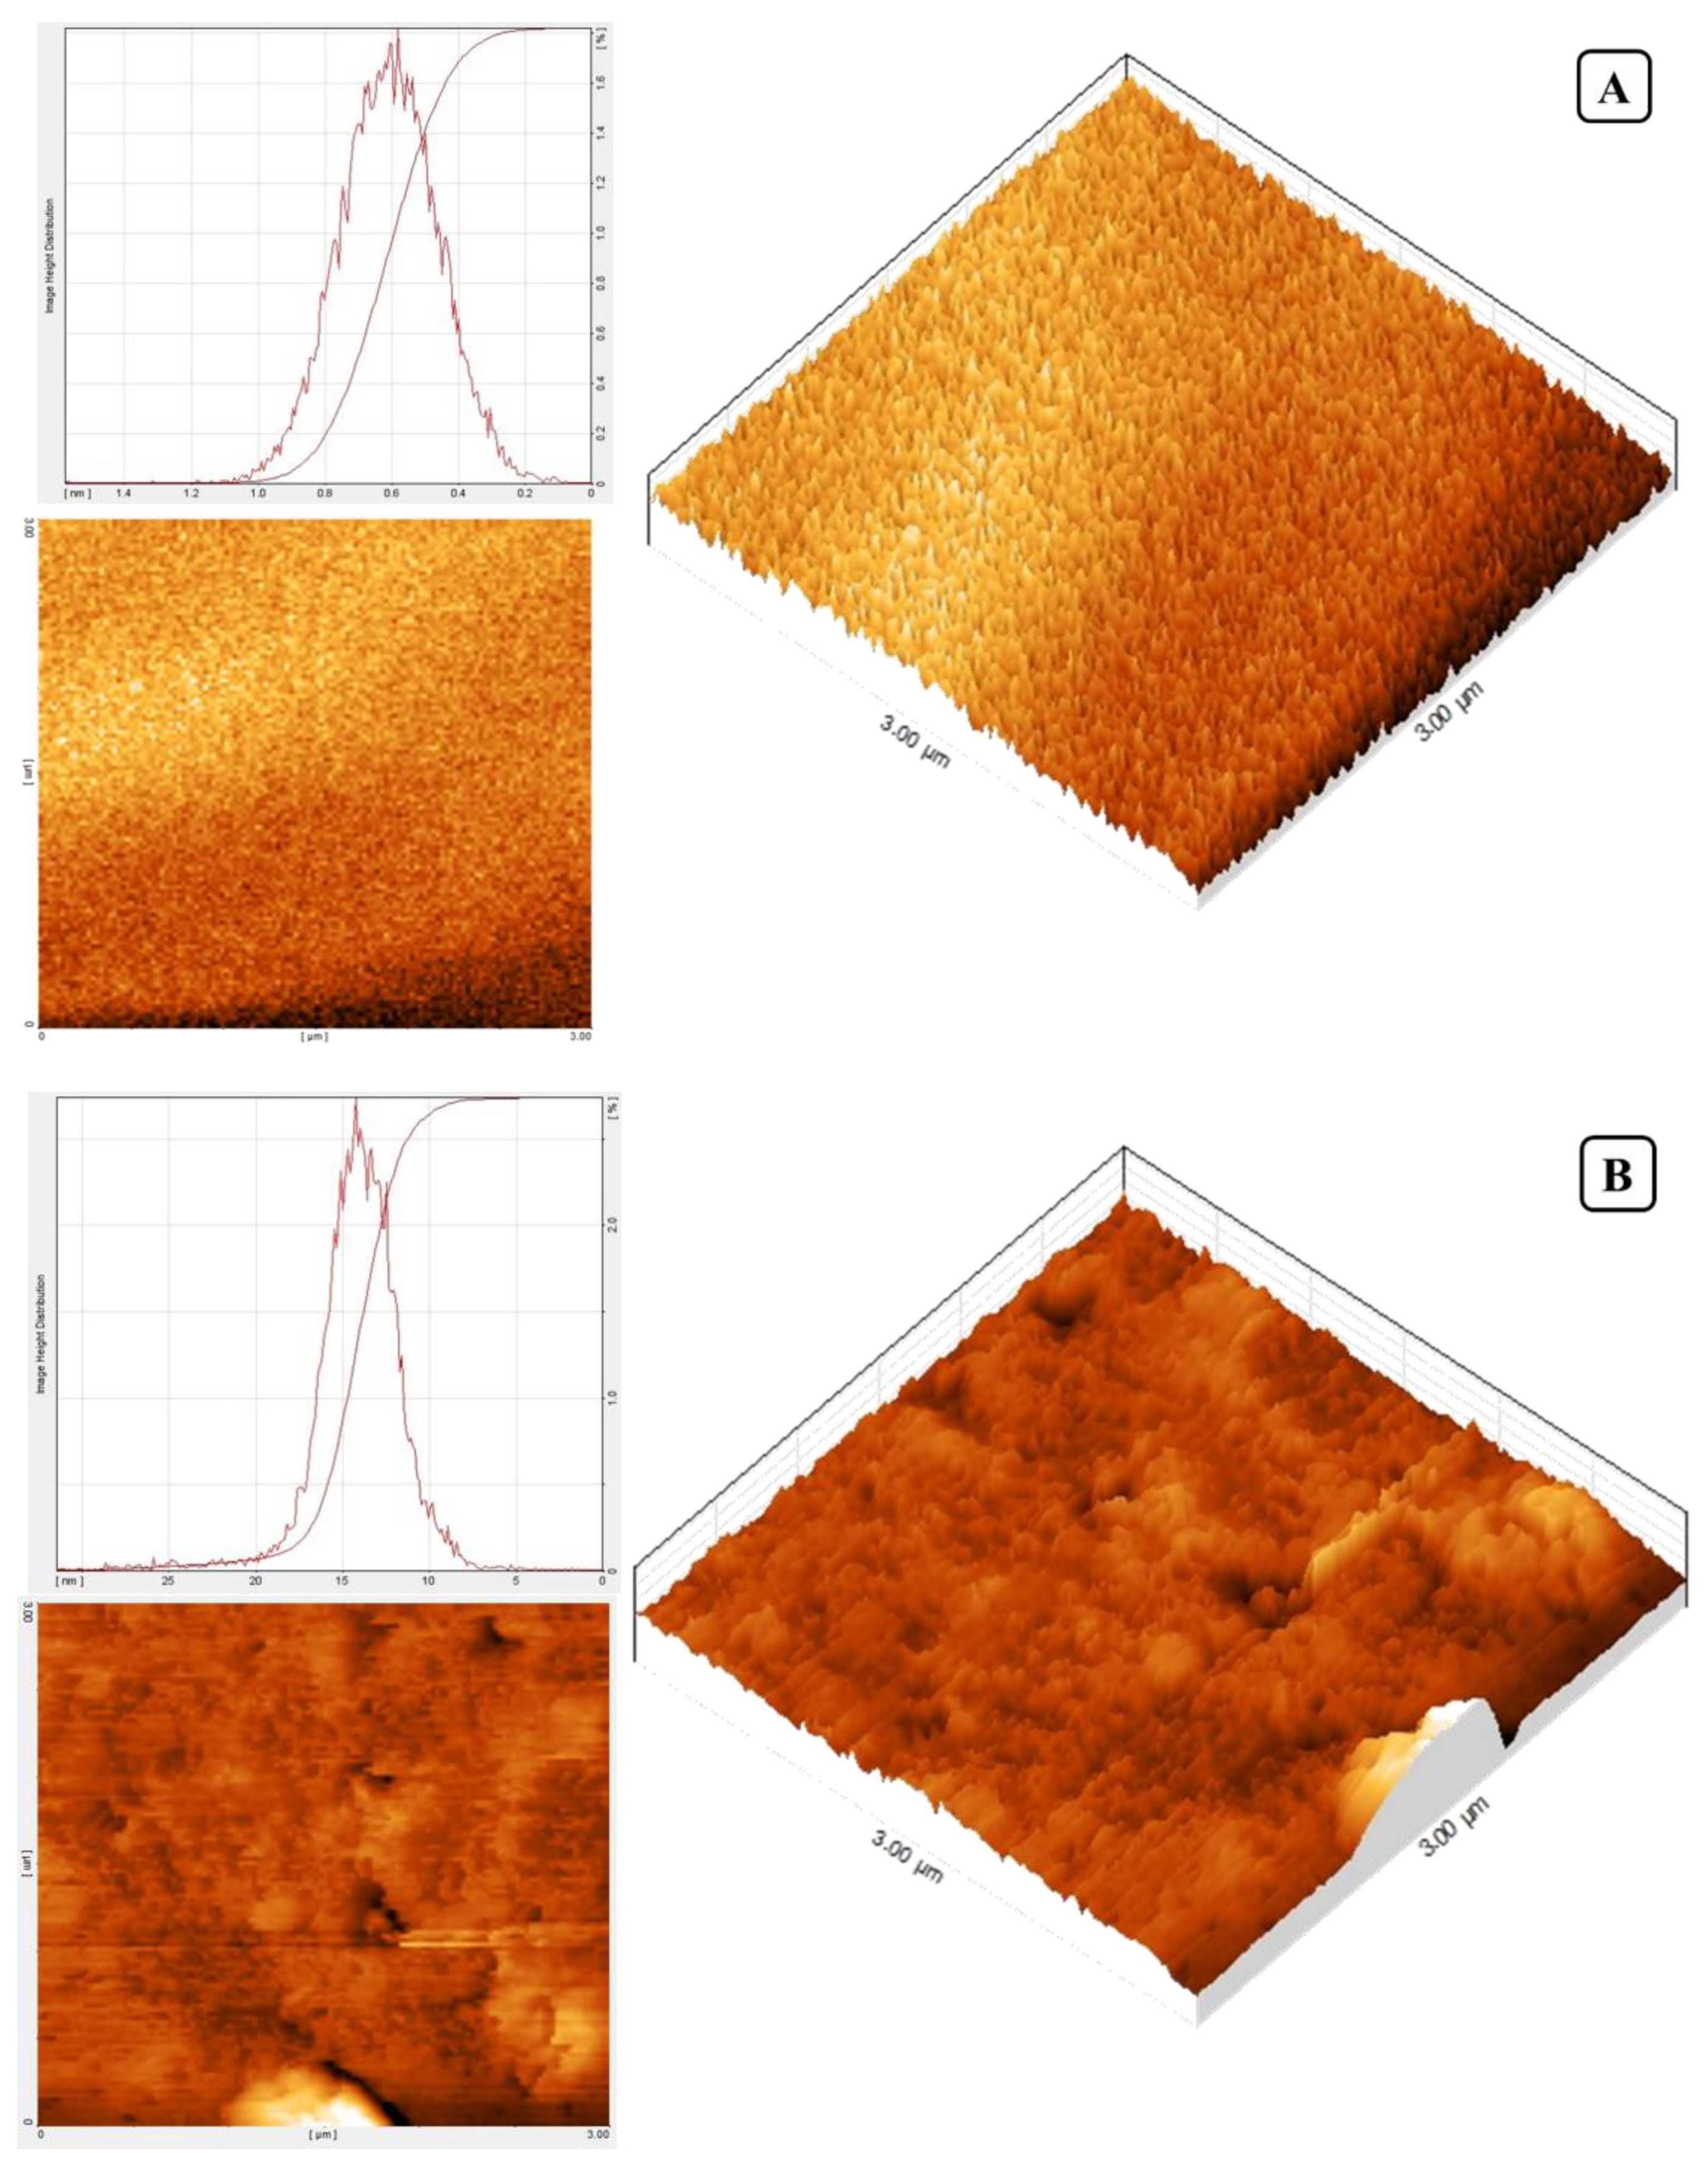
3.8. Film Microstructure

In order to learn about the films’ microstructure, SEM (Figure 5) and AFM (Figure 6) were used to observe their surfaces and cross-sections. For the most part, the morphologies of the control films seemed uniform and smooth. The presence of insoluble particulate matter in the extracts, such as hydrophilic compounds or fibrous plant tissue fragments, was responsible for the minor heterogeneities seen on the film surfaces and in the cross-sections after the integration of SAAs. Therefore, the more heterogeneous microstructure of the films following SAAs addition may account for the observed rise in WVP. Similar changes in microstructure were reported when pomegranate peel extracts were incorporated into fish gelatin films, which was attributed to insoluble dietary fibers [61].
Similarly, small heterogeneities in films have been reported when apple peel extract was added to chitosan films [40]. The films’ cross-sections revealed that, despite a few tiny particles, they mainly comprised a homogenous, dense network. Attractive intermolecular forces, including van der Waals, hydrogen bonds, hydrophilic attraction, and electrostatic interactions, bound these biopolymer molecules together to form a network [62].

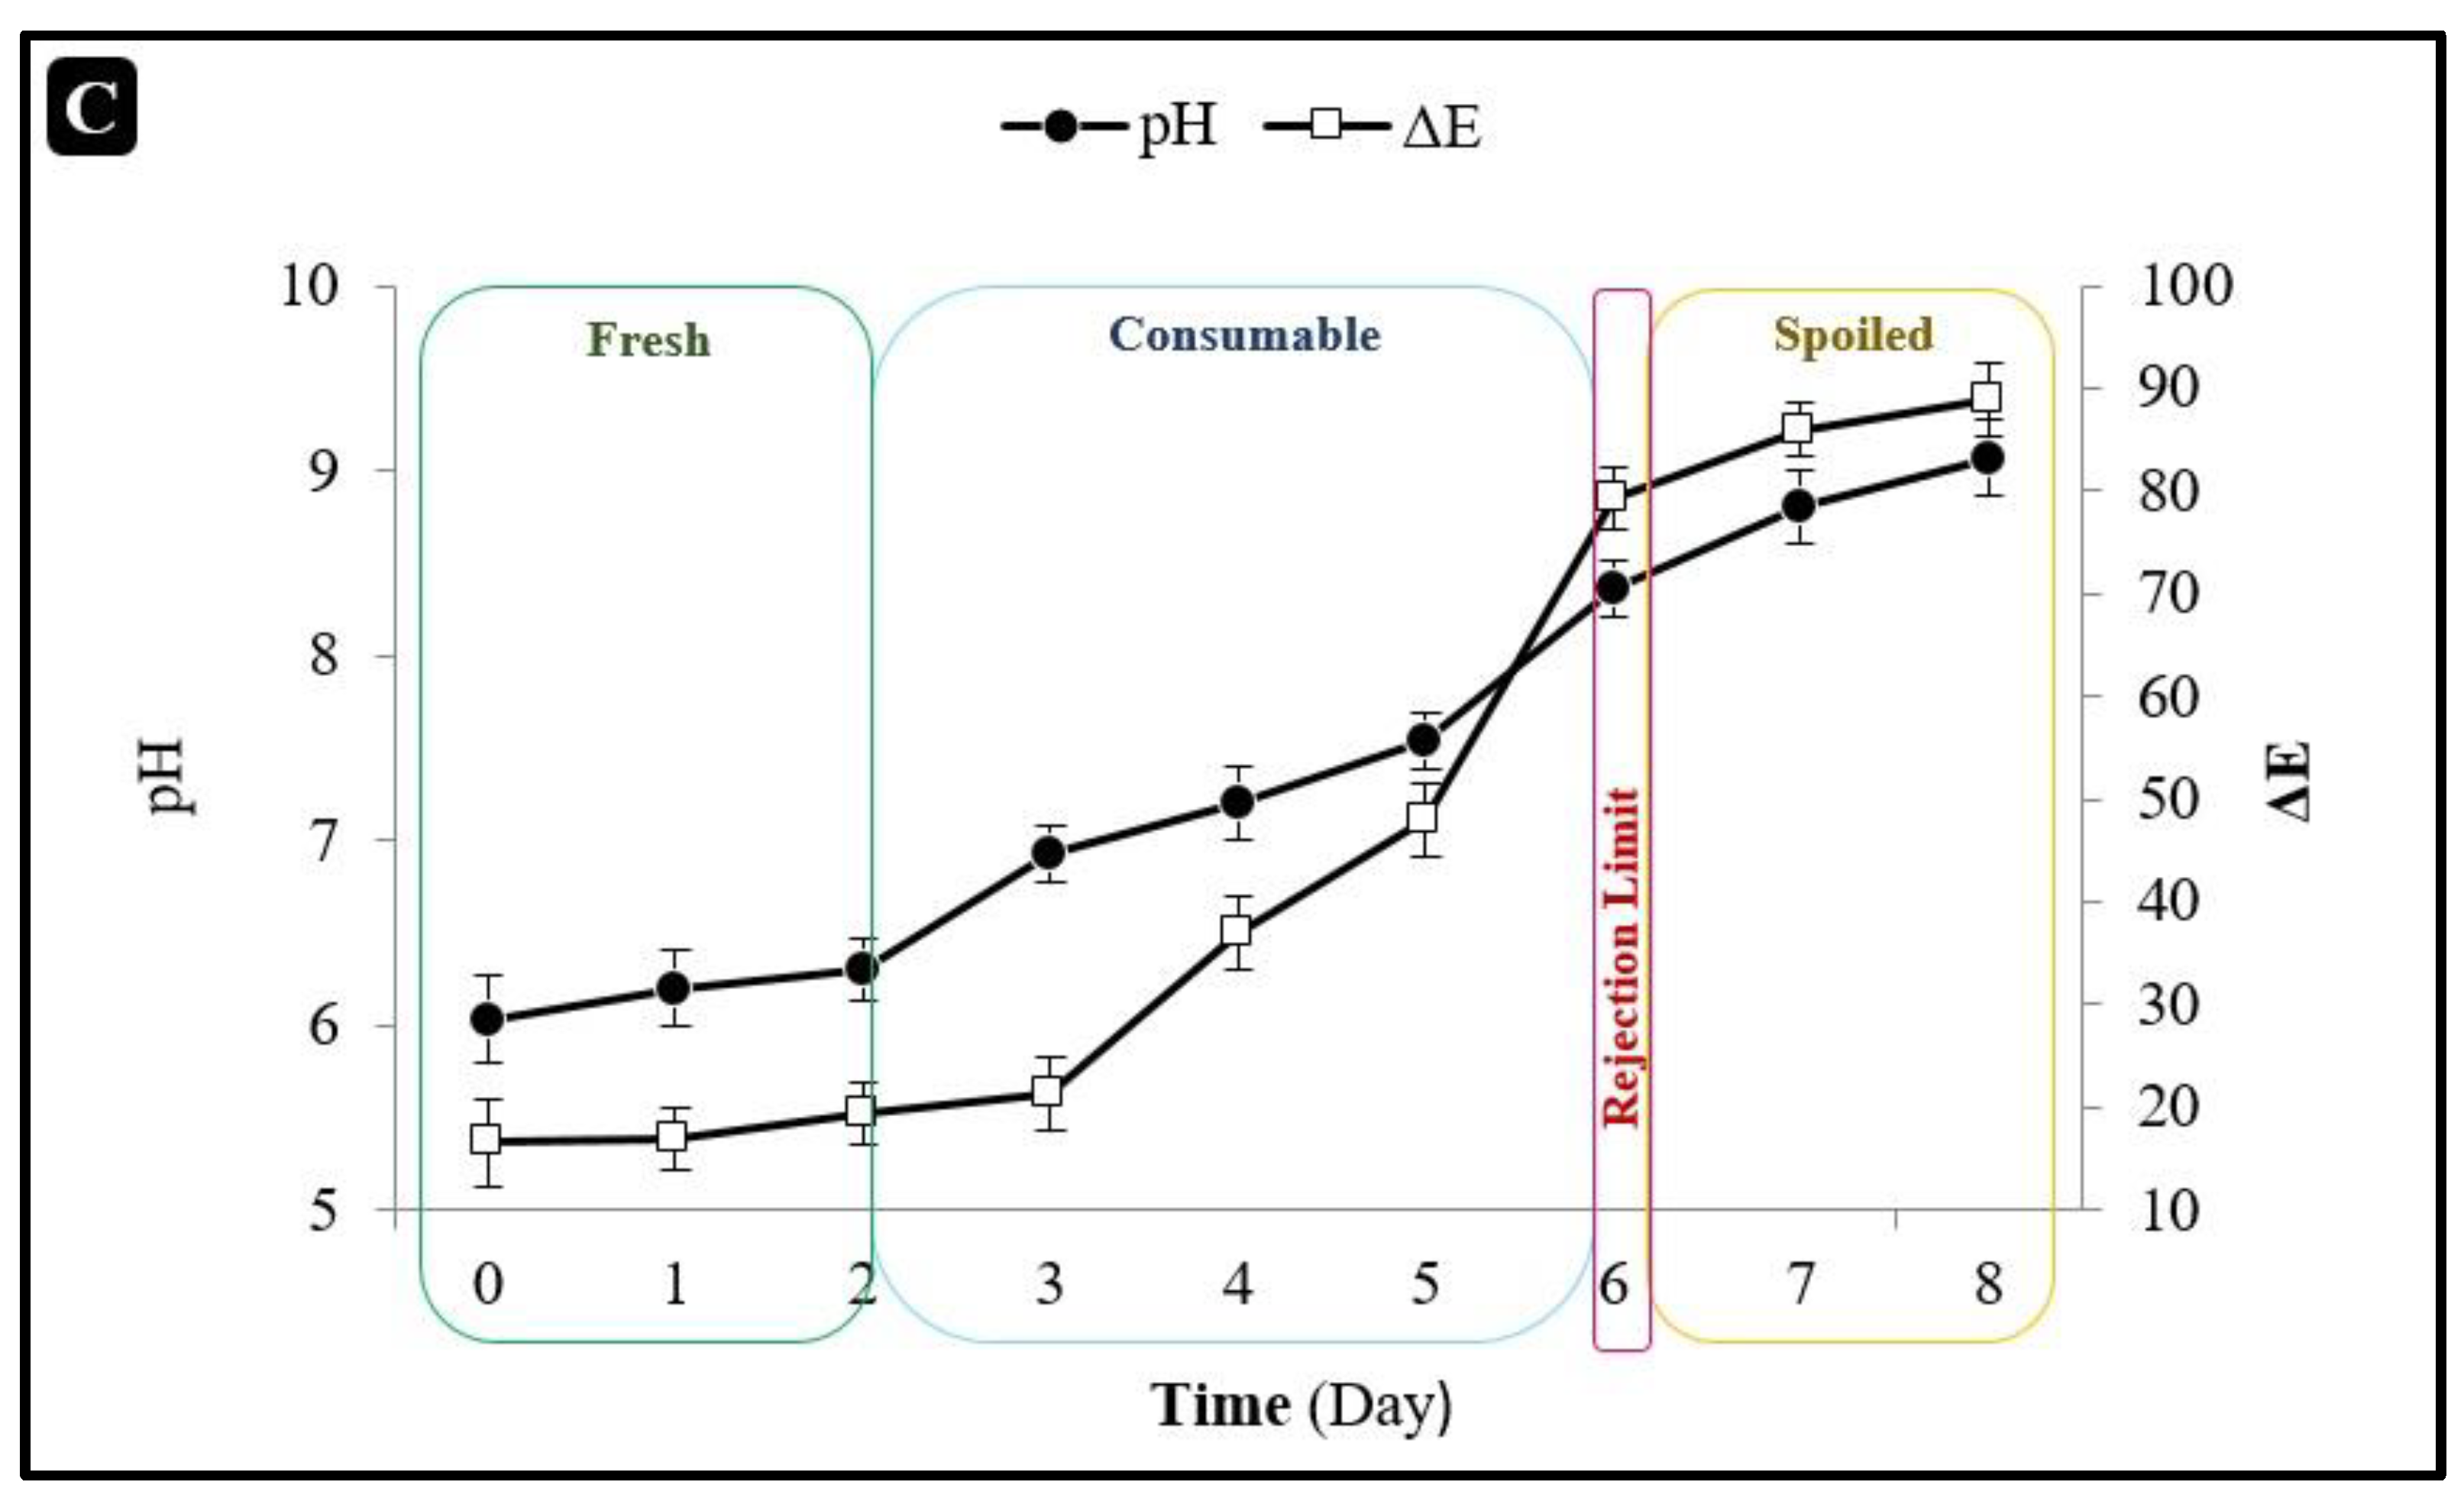
3.9. Assessment of Fish Freshness Using Salep Mucilage Edible Indicator Films

Finally, we conducted a proof-of-concept experiment to see if our SAAs-loaded salep mucilage edible indicator films could be used to preserve and detect the freshness of a model meat product (rainbow trout fillet) (Figure 7A). To summarize, meat and seafood spoilage is characterized by increased pH and the formation of nitrogen-based volatile compounds (such as ammonia and amines) due to protein decompositions, typically caused by enzymes and microorganisms [63]. Thus, our halochromic intelligent films, which may change color in reaction to changes in pH or ammonia levels, might be employed as an indicator/innovative packaging material of meat quality [64].
Salep mucilage edible indicator films containing 5%v/v SAAs are used with the freshness indicators pH, TVB-N, and TVC to calculate the time a portion of food will lose quality in the fridge (Figure 7B). Following 8 days in the fridge (4 °C), the TVB-N concentration in fresh fish rose from 5.13 mg/100 g to 36.20 mg/100 g. (Figure 7B). According to prior studies, the TVB-N rejection limit for freshwater fish is 20 mg/100 g [36,65]. On the sixth day of refrigerated storage, the TVB-N levels were similarly over the threshold (20.30 mg/100 g).
In contrast, TVC has a shelf-life limit of 7 logs CFU/g for fresh fish samples [66]. To a lesser extent than later on in storage, some spoilage microorganisms are present early on. The accumulation of scents, tastes, colors, and textures that develop during storage and other metabolites might cause sensory rejection. After 6 days at 4 °C, the TVC of fresh fish in our assays rose to 7.67 log CFU/g (Figure 7B). The results show that the TVB-N and TVC thresholds are reached simultaneously, as the microbial population increases, and hence simultaneously. Others have discovered and documented this same phenomenon before. Figure 7C displays the observed pH shifts and ΔE of the colorimetric labels while storing fish. After 6 days at 4 °C, the pH and ΔE E colors had shifted from yellow to brown, respectively, while the indicator remained orange for the remaining days, showing no discernible color change to the naked eye. The pH-sensitive index, ΔE, maintained a constant value across the range of pH stability in fish.

4. Conclusions

Saffron petal extract has shown to be a valuable addition to salep mucilage edible indicator films. Microscopy examination (SEM and AFM) revealed that adding SAAs to the films brought about slight variations in appearance, although other properties (optical, mechanical, barrier, and other physicochemical) were more affected. Furthermore, halochromic intelligent films had high antioxidant properties and antibacterial effects against common foodborne pathogens. Moreover, the prepared halochromic intelligent films exhibited potential applications for monitoring the freshness of the fish fillets. Overall, the results suggest that pH-sensitive edible films based on salep mucilage- activated with anthocyanin from saffron could be used as intelligence indicator films for quality assurance and to extend the shelf life of packed seafood products.

Author Contributions

Conceptualization, Z.E.-D.; methodology, Z.E.-D. and M.E.; software, A.E.; validation, Z.E.-D.; formal analysis, Z.E.-D.; investigation, M.E., N.R.-D. and A.E.; resources, M.S.; data curation, M.E. and N.R.-D.; writing—original draft preparation, M.S.; writing—review and editing, M.E. and A.E.; visualization, Z.E.-D.; supervision, Z.E.-D.; project administration, Z.E.-D.; funding acquisition, Z.E.-D. All authors have read and agreed to the published version of the manuscript.

Funding

This research received no external funding.

Data Availability Statement

Data will be provided upon request.

Acknowledgments

The support of the University of Tehran is gratefully acknowledged.

Conflicts of Interest

The authors declare no conflict of interest.

References

  1. Weston, M.; Phan, M.A.T.; Arcot, J.; Chandrawati, R. Anthocyanin-based sensors derived from food waste as an active use-by date indicator for milk. Food Chem. 2020, 326, 127017. [Google Scholar] [CrossRef] [PubMed]
  2. Tang, B.; He, Y.; Liu, J.; Zhang, J.; Li, J.; Zhou, J.; Ye, Y.; Wang, J.; Wang, X. Kinetic investigation into pH-dependent color of anthocyanin and its sensing performance. Dye Pigment. 2019, 170, 107643. [Google Scholar] [CrossRef]
  3. Riaz, R.S.; Elsherif, M.; Moreddu, R.; Rashid, I.; Hassan, M.U.; Yetisen, A.K.; Butt, H. Anthocyanin-functionalized contact lens sensors for ocular pH monitoring. ACS Omega 2019, 4, 21792–21798. [Google Scholar] [CrossRef] [PubMed] [Green Version]
  4. Alizadeh-Sani, M.; Tavassoli, M.; Mohammadian, E.; Ehsani, A.; Khaniki, G.J.; Priyadarshi, R.; Rhim, J.-W. pH-responsive color indicator films based on methylcellulose/chitosan nanofiber and barberry anthocyanins for real-time monitoring of meat freshness. Int. J. Biol. Macromol. 2021, 166, 741–750. [Google Scholar] [CrossRef] [PubMed]
  5. Abedi-Firoozjah, R.; Yousefi, S.; Heydari, M.; Seyedfatehi, F.; Jafarzadeh, S.; Mohammadi, R.; Rouhi, M.; Garavand, F. Application of red cabbage anthocyanins as pH-sensitive pigments in smart food packaging and sensors. Polymers 2022, 14, 1629. [Google Scholar] [CrossRef] [PubMed]
  6. Amaregouda, Y.; Kamanna, K.; Gasti, T. Fabrication of intelligent/active films based on chitosan/polyvinyl alcohol matrices containing Jacaranda cuspidifolia anthocyanin for real-time monitoring of fish freshness. Int. J. Biol. Macromol. 2022, 218, 799–815. [Google Scholar] [CrossRef]
  7. Shakouri, M.; Salami, M.; Lim, L.-T.; Ekrami, M.; Mohammadian, M.; Askari, G.; Emam-Djomeh, Z.; McClements, D.J. Development of active and intelligent colorimetric biopolymer indicator: Anthocyanin-loaded gelatin-basil seed gum films. J. Food Meas. Charact. 2022, 1–13. [Google Scholar] [CrossRef]
  8. Haq, S.U.; Aghajamali, M.; Hassanzadeh, H. Cost-effective and sensitive anthocyanin-based paper sensors for rapid ammonia detection in aqueous solutions. RSC Adv. 2021, 11, 24387–24397. [Google Scholar] [CrossRef]
  9. Kuswandi, B.; Asih, N.P.; Pratoko, D.K.; Kristiningrum, N.; Moradi, M. Edible pH sensor based on immobilized red cabbage anthocyanins into bacterial cellulose membrane for intelligent food packaging. Packag. Technol. Sci. 2020, 33, 321–332. [Google Scholar] [CrossRef]
  10. Pakolpakçıl, A.; Osman, B.; Göktalay, G.; Tümay Özer, E.; Şahan, Y.; Becerir, B.; Karaca, E. Design and in vivo evaluation of alginate-based pH-sensing electrospun wound dressing containing anthocyanins. J. Polym. Res. 2021, 28, 1–13. [Google Scholar] [CrossRef]
  11. Christodoulou, E.; Kadoglou, N.P.; Kostomitsopoulos, N.; Valsami, G. Saffron: A natural product with potential pharmaceutical applications. J. Pharm. Pharmacol. 2015, 67, 1634–1649. [Google Scholar] [CrossRef] [PubMed]
  12. Moshiri, M.; Vahabzadeh, M.; Hosseinzadeh, H. Clinical applications of Saffron (Crocus sativus) and its constituents: A review. Drug Res. 2015, 65, 287–295. [Google Scholar] [CrossRef] [PubMed] [Green Version]
  13. Khazaei, K.M.; Jafari, S.M.; Ghorbani, M.; Kakhki, A.H.; Sarfarazi, M. Optimization of anthocyanin extraction from saffron petals with response surface methodology. Food Anal. Methods 2016, 9, 1993–2001. [Google Scholar] [CrossRef]
  14. Xing, B.; Li, S.; Yang, J.; Lin, D.; Feng, Y.; Lu, J.; Shao, Q. Phytochemistry, pharmacology, and potential clinical applications of Saffron: A review. J. Ethnopharmacol. 2021, 281, 114555. [Google Scholar] [CrossRef] [PubMed]
  15. Jafari, S.M.; Khazaei, K.M.; Assadpour, E. Production of a natural color through microwave-assisted extraction of saffron tepal’s anthocyanins. Food Sci. Nutr. 2019, 7, 1438–1445. [Google Scholar] [CrossRef]
  16. Kumar, N. Polysaccharide-based component and their relevance in edible film/coating: A review. Nutr. Food Sci. 2019, 49, 793–823. [Google Scholar] [CrossRef]
  17. Umaraw, P.; Verma, A.K. Comprehensive review on application of edible film on meat and meat products: An eco-friendly approach. Crit. Rev. Food Sci. Nutr. 2017, 57, 1270–1279. [Google Scholar] [CrossRef]
  18. Ekrami, M.; Emam-Djomeh, Z. Water vapor permeability, optical and mechanical properties of salep-based edible film. J. Food Process. Preserv. 2014, 38, 1812–1820. [Google Scholar] [CrossRef]
  19. Pourahmad, M.; Jahromi, H.K.; Jahromi, Z.K. Protective effect of Salep on liver. Hepat. Mon. 2015, 15, e28137. [Google Scholar]
  20. Ekrami, M.; Emam-Djomeh, Z.; Joolaei-Ahranjani, P.; Mahmoodi, S.; Khaleghi, S. Eco-friendly U.V. protective bionanocomposite based on Salep-mucilage/flower-like ZnO nanostructures to control photo-oxidation of kilka fish oil. Int. J. Biol. Macromol. 2021, 168, 591–600. [Google Scholar] [CrossRef]
  21. Ekrami, M.; Emam-Djomeh, Z.; Ghoreishy, S.A.; Najari, Z.; Shakoury, N. Characterization of a high-performance edible film based on Salep mucilage functionalized with pennyroyal (Mentha pulegium). Int. J. Biol. Macromol. 2019, 133, 529–537. [Google Scholar] [CrossRef] [PubMed]
  22. ASTM D1746; Standard Test Method for Transparency of Plastic Sheeting. American Society for Testing and Materials: Philadelphia, PA, USA, 1997.
  23. ASTM E96-95; Standard Test Methods for Water Vapor Transmission of Material. American Society for Testing and Materials: Philadelphia, PA, USA, 1995.
  24. ASTM D3985; Standard Test Method for Oxygen Gas Transmission Rate through Plastic Film and Sheeting Using a Coulometric Sensor. American Society for Testing and Materials: Philadelphia, PA, USA, 2010.
  25. ASTM D882; Standard Test Method for Tensile Properties of Thin Plastic Sheeting. Standard designations; American Society for Testing and Materials: Philadelphia, PA, USA, 2001.
  26. Jridi, M.; Boughriba, S.; Abdelhedi, O.; Nciri, H.; Nasri, R.; Kchaou, H.; Kaya, M.; Sebai, H.; Zouari, N.; Nasri, M. Investigation of physicochemical and antioxidant properties of gelatin edible film mixed with blood orange (Citrus sinensis) peel extract. Food Packag. Shelf Life 2019, 21, 100342. [Google Scholar] [CrossRef]
  27. Sutharut, J.; Sudarat, J. Total anthocyanin content and antioxidant activity of germinated colored rice. Int. Food Res. J. 2012, 19, 215–221. [Google Scholar]
  28. Habibi, M.; Golmakani, M.T.; Mesbahi, G.; Majzoobi, M.; Farahnaky, A. Ultrasound-accelerated debittering of olive fruits. Innov. Food Sci. Emerg. Technol. 2015, 31, 105–115. [Google Scholar] [CrossRef]
  29. Müller, L.; Fröhlich, K.; Böhm, V. Comparative antioxidant activities of carotenoids measured by ferric reducing antioxidant power (FRAP), ABTS bleaching assay (αTEAC), DPPH assay and peroxyl radical scavenging assay. Food Chem. 2011, 129, 139–148. [Google Scholar] [CrossRef]
  30. Lin, S.; Tian, W.; Li, H.; Cao, J.; Jiang, W. Improving antioxidant activities of whey protein hydrolysates obtained by thermal preheat treatment of pepsin, trypsin, alcalase and flavourzyme. Int. J. Food Sci. Technol. 2012, 47, 2045–2051. [Google Scholar] [CrossRef]
  31. Samotyja, U. Potato Peel as a Sustainable Resource of Natural Antioxidants for the Food Industry. Potato Res. 2019, 62, 435–451. [Google Scholar] [CrossRef] [Green Version]
  32. Tongnuanchan, P.; Benjakul, S.; Prodpran, T. Properties and antioxidant activity of fish skin gelatin film incorporated with citrus essential oils. Food Chem. 2012, 134, 1571–1579. [Google Scholar] [CrossRef]
  33. Ekrami, A.; Ghadermazi, M.; Ekrami, M.; Hosseini, M.A.; Emam-Djomeh, Z.; Hamidi-Moghadam, R. Development and evaluation of Zhumeria majdae essential oil-loaded nanoliposome against multidrug-resistant clinical pathogens causing nosocomial infection. J. Drug Deliv. Sci. Technol. 2022, 69, 103148. [Google Scholar] [CrossRef]
  34. Li, T.; Li, J.; Hu, W.; Li, X. Quality enhancement in refrigerated red drum (Sciaenops ocellatus) fillets using chitosan coatings containing natural preservatives. Food Chem. 2013, 138, 821–826. [Google Scholar] [CrossRef]
  35. Zhai, X.; Shi, J.; Zou, X.; Wang, S.; Jiang, C.; Zhang, J.; Huang, X.; Zhang, W.; Holmes, M. Novel colorimetric films based on starch/polyvinyl alcohol incorporated with roselle anthocyanins for fish freshness monitoring. Food Hydrocoll. 2017, 69, 308–317. [Google Scholar] [CrossRef] [Green Version]
  36. Jiang, G.; Hou, X.; Zeng, X.; Zhang, C.; Wu, H.; Shen, G.; Li, S.; Luo, Q.; Li, M.; Liu, X.; et al. Preparation and characterization of indicator films from carboxymethyl-cellulose/starch and purple sweet potato (Ipomoea batatas (L.) lam) anthocyanins for monitoring fish freshness. Int. J. Biol. Macromol. 2020, 143, 359–372. [Google Scholar] [CrossRef] [PubMed]
  37. Zhang, X.; Liu, Y.; Yong, H.; Qin, Y.; Liu, J.; Liu, J. Development of multifunctional food packaging films based on chitosan, TiO2 nanoparticles and anthocyanin-rich black plum peel extract. Food Hydrocoll. 2019, 94, 80–92. [Google Scholar] [CrossRef]
  38. Velásquez, P.; Bustos, D.; Montenegro, G.; Giordano, A. Ultrasound-assisted extraction of anthocyanins using natural deep eutectic solvents and their incorporation in edible films. Molecules 2021, 26, 984. [Google Scholar] [CrossRef]
  39. Tan, Y.; Lim, S.; Tay, B.; Lee, M.; Thian, E. Functional chitosan-based grapefruit seed extract composite films for applications in food packaging technology. Mater. Res. Bull. 2015, 69, 142–146. [Google Scholar] [CrossRef]
  40. Riaz, A.; Lei, S.; Akhtar, H.M.S.; Wan, P.; Chen, D.; Jabbar, S.; Abid, M.; Hashim, M.M.; Zeng, X. Preparation and characterization of chitosan-based antimicrobial active food packaging film incorporated with apple peel polyphenols. Int. J. Biol. Macromol. 2018, 114, 547–555. [Google Scholar] [CrossRef]
  41. Hosseini, A.; Razavi, B.M.; Hosseinzadeh, H. Saffron (Crocus sativus) petal as a new pharmacological target: A review. Iran. J. Basic Med. Sci. 2018, 21, 1091. [Google Scholar]
  42. Cozmuta, A.M.; Turila, A.; Apjok, R.; Ciocian, A.; Cozmuta, L.M.; Peter, A.; Nicula, C.; Galić, N.; Benković, T. Preparation and characterization of improved gelatin films incorporating hemp and sage oils. Food Hydrocoll. 2015, 49, 144–155. [Google Scholar] [CrossRef]
  43. Shams, B.; Ebrahimi, N.G.; Khodaiyan, F. Development of antibacterial nanocomposite: Whey protein-gelatin-nanoclay films with orange peel extract and tripolyphosphate as potential food packaging. Adv. Polym. Technol. 2019, 2019, 1–9. [Google Scholar] [CrossRef] [Green Version]
  44. Vedove, T.M.; Maniglia, B.C.; Tadini, C.C. Production of sustainable smart packaging based on cassava starch and anthocyanin by an extrusion process. J. Food Eng. 2021, 289, 110274. [Google Scholar] [CrossRef]
  45. Fathi, N.; Almasi, H.; Pirouzifard, M.K. Sesame protein isolate based bionanocomposite films incorporated with TiO2 nanoparticles: Study on morphological, physical and photocatalytic properties. Polym. Test. 2019, 77, 105919. [Google Scholar] [CrossRef]
  46. Moghadam, M.; Salami, M.; Mohammadian, M.; Emam-Djomeh, Z. Development and characterization of pH-sensitive and antioxidant edible films based on mung bean protein enriched with Echium amoenum anthocyanins. J. Food Meas. Charact. 2021, 15, 2984–2994. [Google Scholar] [CrossRef]
  47. Hosseini, M.; Razavi, S.; Mousavi, M. Antimicrobial, physical and mechanical properties of chitosan-based films incorporated with thyme, clove and cinnamon essential oils. J. Food Process. Preserv. 2009, 33, 727–743. [Google Scholar] [CrossRef]
  48. Pérez-Gago, M.B.; Krochta, J.M. Lipid particle size effect on water vapor permeability and mechanical properties of whey protein/beeswax emulsion films. J. Agric. Food Chem. 2001, 49, 996–1002. [Google Scholar] [CrossRef] [PubMed]
  49. Kester, J.J.; Fennema, O. Edible Films and Coatings: A review. In Food technology; Academic Press: Cambridge, MA, USA, 1986. [Google Scholar]
  50. Jouki, M.; Mortazavi, S.A.; Yazdi, F.T.; Koocheki, A. Characterization of antioxidant–antibacterial quince seed mucilage films containing thyme essential oil. Carbohydr. Polym. 2014, 99, 537–546. [Google Scholar] [CrossRef] [PubMed]
  51. McHugh, T.H.; Krochta, J.M. Sorbitol vs glycerol-plasticized whey protein edible films: Integrated oxygen permeability and tensile property evaluation. J. Agric. Food Chem. 1994, 42, 841–845. [Google Scholar] [CrossRef]
  52. Atarés, L.; Pérez-Masiá, R.; Chiralt, A. The role of some antioxidants in the HPMC film properties and lipid protection in coated toasted almonds. J. Food Eng. 2011, 104, 649–656. [Google Scholar] [CrossRef]
  53. Tongnuanchan, P.; Benjakul, S.; Prodpran, T. Physico-chemical properties, morphology and antioxidant activity of film from fish skin gelatin incorporated with root essential oils. J. Food Eng. 2013, 117, 350–360. [Google Scholar] [CrossRef]
  54. Ahmadian-Kouchaksaraie, Z.; Niazmand, R. Supercritical carbon dioxide extraction of antioxidants from Crocus sativus petals of saffron industry residues: Optimization using response surface methodology. J. Supercrit. Fluids 2017, 121, 19–31. [Google Scholar] [CrossRef]
  55. Omidi, A.; Rahdari, S.; Fard, M.H. A preliminary study on antioxidant activities of saffron petal extracts in lambs. Vet. Sci. Dev. 2014, 4. [Google Scholar] [CrossRef] [Green Version]
  56. Alizadeh-Sani, M.; Tavassoli, M.; McClements, D.J.; Hamishehkar, H. Multifunctional halochromic packaging materials: Saffron petal anthocyanin loaded-chitosan nanofiber/methyl cellulose matrices. Food Hydrocoll. 2021, 111, 106237. [Google Scholar] [CrossRef]
  57. Hashemi, S.M.B.; Jafarpour, D. The efficacy of edible film from Konjac glucomannan and saffron petal extract to improve shelf life of fresh-cut cucumber. Food Sci. Nutr. 2020, 8, 3128–3137. [Google Scholar] [CrossRef]
  58. Fathi, M.; Samadi, M.; Abbaszadeh, S.; Nourani, M.R. Fabrication and characterization of multifunctional bio-safe films based on Carboxymethyl Chitosan and Saffron Petal Anthocyanin Reinforced with Copper Oxide Nanoparticles for sensing the meat freshness. J. Polym. Environ. 2022, 12, 1–12. [Google Scholar] [CrossRef]
  59. Liang, T.; Sun, G.; Cao, L.; Li, J.; Wang, L. A pH and NH3 sensing intelligent film based on Artemisia sphaerocephala Krasch. gum and red cabbage anthocyanins anchored by carboxymethyl cellulose sodium added as a host complex. Food Hydrocoll. 2019, 87, 858–868. [Google Scholar] [CrossRef]
  60. Tassanawat, S.; Phandee, A.; Magaraphan, R.; Nithitanakul, M.; Manuspiya, H. pH-Sensitive P.P./Clay Nanocomposites for Beverage Smart Packaging. In Proceedings of the IEEE International Conference on Nano/Micro Engineered and Molecular Systems, Bangkok, Thailand, 16–19 January 2007; IEEE: Piscataway, NJ, USA, 2007. [Google Scholar]
  61. Hanani, Z.N.; Yee, F.C.; Nor-Khaizura, M. Effect of pomegranate (Punica granatum L.) peel powder on the antioxidant and antimicrobial properties of fish gelatin films as active packaging. Food Hydrocoll. 2019, 89, 253–259. [Google Scholar] [CrossRef]
  62. Emam-Djomeh, Z.; Moghaddam, A.; Yasini Ardakani, S.A. Antimicrobial activity of pomegranate (Punica granatum L.) peel extract, physical, mechanical, barrier and antimicrobial properties of pomegranate peel extract-incorporated sodium caseinate film and application in packaging for ground beef. Packag. Technol. Sci. 2015, 28, 869–881. [Google Scholar] [CrossRef]
  63. Shi, C.; Zhang, J.; Jia, Z.; Yang, X.; Zhou, Z. Intelligent pH indicator films containing anthocyanins extracted from blueberry peel for monitoring tilapia fillet freshness. J. Sci. Food Agric. 2021, 101, 1800–1811. [Google Scholar] [CrossRef]
  64. Gasti, T.; Dixit, S.; D’Souza, O.J.; Hiremani, V.D.; Vootla, S.K.; Masti, S.P.; Chougale, R.B.; Malabadi, R.B. Smart biodegradable films based on chitosan/methylcellulose containing Phyllanthus reticulatus anthocyanin for monitoring the freshness of fish fillet. Int. J. Biol. Macromol. 2021, 187, 451–461. [Google Scholar] [CrossRef]
  65. Moradi, M.; Tajik, H.; Almasi, H.; Forough, M.; Ezati, P. A novel pH-sensing indicator based on bacterial cellulose nanofibers and black carrot anthocyanins for monitoring fish freshness. Carbohydr. Polym. 2019, 222, 115030. [Google Scholar] [CrossRef]
  66. Huang, S.; Xiong, Y.; Zou, Y.; Dong, Q.; Ding, F.; Liu, X.; Li, H. A novel colorimetric indicator based on agar incorporated with Arnebia euchroma root extracts for monitoring fish freshness. Food Hydrocoll. 2019, 90, 198–205. [Google Scholar] [CrossRef]
Figure 1. Photographic images of the palmate-tubers aalep and aalep mucilage control/edible indicator film.
Chemistry 04 00089 g001
Figure 2. The pH-dependence of (A) solution color variations and (B) UV/Visible spectra of SAAs were measured in various buffer solutions.
Chemistry 04 00089 g002
Figure 3. Effect of SAAs concentrations on (A) mechanical and (B) mechanical properties of salep mucilage edible indicator films. g/s m Pa × 10−11.
Chemistry 04 00089 g003
Figure 4. Effect of pH variation on color sensitivity of Salep mucilage edible indicator films (5%v/v SAAs): (A) L, a, and b index and (B) ΔE, WI, and YI. For each linear graph, means with superscripts (a–e) are significantly different (p < 0.05). Data are means ± SD.
Chemistry 04 00089 g004
Figure 5. SEM images of the surface and cross-section of Salep mucilage edible (A) control and (B) indicator films (5 %v/v SAAs).
Chemistry 04 00089 g005
Figure 6. AFM 2D/3D images and height distribution of salep mucilage edible (A) control and (B) indicator films (5%v/v SAAs).
Chemistry 04 00089 g006
Figure 7. Changes in (A) freshness of rainbow trout fillet, (B) TVB-N and TVC, and (C) pH and ΔE values during storage at 4 °C using salep mucilage edible indicator films.
Chemistry 04 00089 g007aChemistry 04 00089 g007b
Table 1. Effect of SAAs concentrations on physical properties of Salep mucilage edible indicator films.
SAAs Concentration (%v/v)Contact Angle (°)Thickness (µm)Moisture Content (%)Water Solubility (%)Transparency (%)
0 (Control)72.14 ± 1.58 a86.90 ± 17.80 d12.90 ± 0.11 e48.33 ± 0.69 e60.34 ± 1.73 a
2.570.11 ± 1.18 b116.83 ± 25.58 cd13.26 ± 0.08 d51.04 ± 1.05 d41.84 ± 2.03 b
565.56 ± 1.84 c147.87 ± 14.67 bc13.44 ± 0.12 c55.13 ± 1.03 c34.14 ± 0.98 c
7.559.98 ± 1.81 d170.80 ± 18.93 ab13.77 ± 0.10 b59.31 ± 1.05 b26.63 ± 1.64 d
1054.02 ± 1.44 e199.03 ± 28.42 a14.13 ± 0.15 a63.71 ± 0.71 a14.27 ± 2.14 e
For each column, means with superscripts (a–e) are significantly different (p < 0.05). Data are means ± SD.
Table 2. Effect of SAAs concentrations on antioxidant and antibacterial properties of salep mucilage edible indicator films.
Antioxidant PropertiesSAAs Concentration (%v/v)
0 (Control)2.557.510
TPC (mg GAE/100 g)7.57 ± 1.54 e45.89 ± 4.36 d80.44 ± 3.18 c114.07 ± 6.73 b158.99 ± 7.33 a
TAC (mg CGE/100 g)0.00 ± 0.00 e3.09 ± 0.65 d5.81 ± 0.32 c6.28 ± 0.44 b8.02 ± 0.59 a
TFC (mg QUE/100 g)1.60 ± 1.21 e7.32 ± 0.90 e12.14 ± 1.82 e16.84 ± 2.63 e19.99 ± 1.84 e
FRAP (µmol TRE/g)0.00 ± 0.00 e0.09 ± 0.01 e0.15 ± 0.03 e0.21 ± 0.02 e0.25 ± 0.01 e
DPPH scavenging (%)0.00 ± 0.00 e19.12 ± 5.35 e28.19 ± 4.59 e35.23 ± 5.18 e42.62 ± 4.02 e
Reducing power (Abs 700 nm)0.00 ± 0.00 e0.02 ± 0.01 e0.07 ± 0.01 e0.11 ± 0.01 e0.15 ± 0.02 e
ABTS scavenging (%)0.00 ± 0.00 e4.22 ± 1.05 e9.08 ± 1.60 e15.96 ± 1.85 e20.01 ± 2.66 e
Inhibition zone diameters (mm)
Staphylococcus aureus0.00 ± 0.00 e7.01 ± 0.20 d9.95 ± 0.32 c12.39 ± 0.23 b14.54 ± 0.16 a
Escherichia coli O157:H70.00 ± 0.00 e6.82 ± 0.21 d7.98 ± 0.28 c9.89 ± 0.14 b11.22 ± 0.24 a
For each row, means with superscripts (a–e) are significantly different (p < 0.05). Data are means ± SD.
Publisher’s Note: MDPI stays neutral with regard to jurisdictional claims in published maps and institutional affiliations.

