Article

Simultaneous Thermal and Spectroscopic Screening of Morphologically Complex Theranostic Gold Nanoparticles

by
Suhash Reddy Chavva
1,2,
Namratha Bhat
1,2,
Angela Michelle T. San Juan
1,2,
Siddhant Jaitpal
1,2 and
Samuel Mabbott
1,2,*
1
Health Technologies and Innovations Building, 3006 TAMU, College Station, TX 77843, USA
2
Biomedical Engineering, Emerging Technologies Building, 3120 TAMU, College Station, TX 77843, USA
*
Author to whom correspondence should be addressed.
J. Nanotheranostics 2022, 3(2), 102-116; https://doi.org/10.3390/jnt3020007
Submission received: 9 March 2022 / Revised: 13 May 2022 / Accepted: 23 May 2022 / Published: 26 May 2022

Abstract

:
Gold nanoparticles absorb light energy and convert it to thermal energy that transfers to the surrounding environment, making them potentially useful for the hyperthermic treatments well known as photothermal therapy (PTT). Further, it is well documented that noble metal nanoparticles are capable of significantly enhancing the Raman scattering of molecules attached to their surfaces, a technique which is termed surface-enhanced Raman scattering (SERS). SERS combined with PTT has the ability to locate nanoparticles at depth and trigger heat production, providing an effective methodology to both seek and destroy diseased tissues. While PTT and SERS are often used in tandem and there are several ways of individually measuring SERS and thermal output, there is currently no method available that pre-screens both properties prior to in vitro or in vivo application. In this work, we have designed a 3D printed platform capable of coupling a commercially available Raman probe to a sample cuvette for SERS and heat output to be monitored simultaneously. We have compared the performance of morphologically complex gold nanoparticles, nanostars (AuNSs) and nanoplates (AuNPLs), which are both well utilized in SERS and photothermal experiments; and measured the SERS activity originating from common Raman reporter analytes 4-mercaptobenzoic acid (MBA) and 1,4-benzenedithiol (BDT). We were able to show that the system effectively measures the thermal output and SERS activity of the particles and can evaluate the effect that multiple irradiation cycles have on the SERS signal.

1. Introduction

The study of the plasmonic metallic nanoparticle-mediated photothermal effect (PTE) has gained enormous interest from a variety of fields due to the tunable optical response of nanoparticles and their adaptability for regulating photothermal conversion upon laser irradiation. PTE occurs when metal nanoparticles (NPs) absorb light and convert the energy for release as heat [1]. The heating effect is especially strong for metal NPs, since they have many mobile electrons delocalized from the metallic atoms [1]. Oscillating electrons transfer kinetic energy into the noble metal nanoparticle lattice through electron–phonon coupling, followed by phonon–phonon interactions with the surrounding medium [2,3]. These phonon–phonon interactions dissipate heat across a nanoparticle−matrix interface at a rate dependent on matrix type, particle size and laser power [4,5,6]. Photothermal therapy (PTT) is among the most popular applications of PTE, offering an alternative, minimally invasive, localized treatment method compared to existing treatments for the ablation of disease sites and the transdermally triggered release of drugs using NIR radiation. Gold nanoparticles (AuNPs) have been extensively studied to evaluate their therapeutic applications. The most sought-after application for AuNPs is in tumor therapies, whereby nanoparticles are delivered via intravenous injection. Injected NPs tend to accumulate in tumors due to the enhanced permeability and retention (EPR) effect [7,8]. Transdermal illumination of the NP accumulation site using NIR light results in the production of heat which ablates the tumor microenvironment, changing the physiology of the cells, ultimately resulting in their death.
Surface-enhanced Raman spectroscopy (SERS) is another widespread application of AuNPs that can be used in conjunction with PTT to track particles [9,10,11]. SERS represents an enhanced version of conventional Raman spectroscopy resulting in the amplification of Raman scattering realized from molecules in close proximity to a NP surface. The usefulness of SERS has already been demonstrated in a vast number of applications, such as trace-level chemical/biological sensing, environmental monitoring, medical diagnosis and real-time bio-imaging [9,10,11,12,13,14]. Similarly to PTE, the magnification of Raman scattering can be attributed to the oscillation of free electrons across the dielectric surfaces of AuNPs [15]. While the fundamental understanding of SERS mechanisms is well established, the effect heat generated by nanoparticles has on the resultant SERS signal has not been studied as intricately. It is known that the increase in the particle temperature due to PTE, and consequently the temperature of the surrounding medium, can directly influence the resultant SERS signal and are effects that have been attributed to several processes, including thermal annealing, modified adsorption/desorption kinetics of surface molecules and changes in the dielectric properties of the medium and the particle [16]. Tandem SERS/heat measurements are especially important to establish the feasibility of particles being used in new spectroscopic techniques, primarily surface-enhanced spatially offset Raman scattering (SESORS), which allows the spectral signature of subdermally located nanoparticles to be measured by offsetting collection and illumination optical pathways, and through prolonged laser irradiation can cause the particles to heat [17,18,19]. Currently, most work carried out using SERS focuses on in vivo measurements of AuNPs using animal models; very few, if any studies, are carrying out pre-screening of the particles with the objective of simultaneously measuring SERS and heating capabilities prior to intravenous injection.
Many different variates of AuNPs have been synthesized, and their photothermal conversion efficiency and SERS output have been studied independently. At present, the measurement of the thermal output generated by NPs is not standardized. Researchers have developed unique approaches and systems to measure heat output. Richardson et al. developed a method to measure temperature change in a water droplet containing a colloidal suspension of AuNPs after laser excitation [20]. The same group developed an indirect method to calculate heat generated by optically excited AuNPs by embedding them into an ice matrix and monitoring the melting of ice upon laser irradiation [21]. Other researchers have performed computational studies to determine the heat output [21,22]. Other studies have adopted simple methods, such as using an infrared camera [23], but infrared cameras are prone to errors because they can only measure surface temperature [24]. Only a few studies have provided detail in terms of the technical specifications of the thermal measurement system used, power of the laser light, volume of NPs used, and effect of evaporation due to heating of NPs, which are all essential for measurement standardization. Furthermore, these methods are often complex, labor-intensive and require specialized skills, and therefore are not suitable for quick screening of nanomaterial candidates for photothermal and SERS applications. Further, understanding the dynamics of the PTE and SERS processes and the time dependence of local heating on the efficiency of Raman scattering will aid in the optimization of nanoprobe geometry and experimental conditions to maximize heat generation and minimize Raman signal loss when applied to techniques such as SESORS. In recent times, it has become essential to simultaneously measure the SERS output and photothermal conversion efficiency, as both properties are complementary when applied in a therapeutic capacity.
However, the use of NPs in seek-and-destroy applications requires a standardized measurement device that is both simple and accurate. This device should be versatile for the analysis/screening of different types, shapes and sizes of NPs; and automated to avoid any discrepancies in readings. The lack of standardized measurements across the field makes it particularly difficult to replicate the work of other researchers, and more rapid standardized tests are required. Establishing a relationship between benchtop and in vivo measurements in the future is of great importance, as it will allow for the rapid pre-screening of metal NPs for light-to-heat conversion efficiency prior to carrying out applied research. Hence, we have developed a pre-screening approach that can be used to perform benchtop tests using the NPs before they are tested and tracked in tumor/animal models. Apart from measuring the heat output from the NPs, our system also allows us to simultaneously monitor the effect of PTE on SERS. We have tested our system with two different types of nanoparticles, gold nanostars (AuNS) and gold nanoplates (AuNPLs), by seeking their photothermal properties and the SERS enhancement of these nanoparticles using two structurally similar molecules, 4-mercaptobenzoic acid (MBA) and benzene-1,4-dithiol (BDT).

2. Materials and Methods

2.1. Materials

All chemicals were purchased from Sigma-Aldrich (St. Louis, MO, USA) and used as received without further purification, unless otherwise stated. Potassium iodide (KI, Alfa-Aesar, Assay >99.0%) was purchased from Fisher Scientific (Hampton, NH, USA). Deionized (DI) water was used in all experiments. All glassware was cleaned with soap and water, rinsed with DI water followed by acetone and dried in the oven. Glassware that contained nanoparticles (NPs), including the quartz cuvettes, was cleaned between measurements using freshly prepared aqua regia (HCl/HNO3, 3:1 v/v) and then rinsed thoroughly with DI water.

2.2. Methods

2.2.1. Gold Nanostars’ Synthesis

Gold nanostars (AuNS) were synthesized according to a previously reported seed-mediated protocol developed by Yuan et al. [25]. First, gold seeds of approximately 13 nm were synthesized by adding 15 mL of 1% trisodium citrate to 100 mL of a boiling 1 mM tetrachloroauric (III) acid trihydrate (HAuCl4·3H2O, ≥99.9% trace metals basis) solution under vigorous stirring. After 15 min of boiling, the reaction mixture was left to cool to room temperature, and then stored at 4 °C. To synthesize the AuNS particles, 10 mL of HAuCl4·3H2O (0.25 mM), hydrochloric acid (HCl, 10 µL, 1 M) and gold seeds (10 µL, OD 1) were mixed. To this solution, silver nitrate (AgNO3, 100 µL, 5 mM) and ascorbic acid (50 µL, 100 mM) were added simultaneously. The solution immediately turned greenish-blue, indicating the formation of AuNS particles. To maintain particle stability through coulombic repulsion, 40 µL of 5% sodium citrate solution was added to the reaction mixture, post-synthesis.

2.2.2. Gold Nanoplates’ Synthesis

Gold nanoplates (AuNPLs) were synthesized according to a procedure described by Alfranca et al. [26]. Two separate solutions referred to as “Solution A” and “Solution B” were prepared. Each solution contained KI (3 µL, 0.1 M) and sodium thiosulfate (Na2S2O3, 11 mL, 0.5 mM). Solution A was first mixed with 20 mL of HAuCl4 solution (2 mM), resulting in an instantaneous color change from yellow to light brown. The solution was then allowed to rest undisturbed for 4 min before mixing with Solution B, after which the solution became dark brown. The mixture was allowed to rest for another 4 min before 7 mL of Na2S2O3 (0.5 mM) was finally added to the mixture to yield a dark brown solution, which is indicative of AuNPL formation.

2.2.3. Surface Modification of NPs for SERS Study

In our tandem photothermal and SERS experiments, we modified the surfaces of the AuNSs and AuNPLs with 2 commonly used Raman reporters: 4-mercaptobenzoic acid (MBA) and 1,4-benzenedithiol (BDT). The NPs (1 mL, OD1) were surface modified by separately incubating them with 100 µL of 10−3 M of MBA and BDT for 1 h at room temperature before carrying out SERS and photothermal measurements. The absorption spectra of the modified NP solutions were compared with control solutions containing only the bare AuNS and AuNPLs to ensure that no aggregation had occurred.

2.2.4. Characterization of AuNSs and AuNPLs

AuNSs and AuNPLs were characterized using an Agilent Technologies Cary 60 UV–Vis Spectrophotometer. Absorbance spectra were collected across a range of 190–1100 nm using a spectral resolution of 0.5 nm. Transmission electron microscopy (TEM, JEOL 1200 EX) operating at 100 kV was used to image the NPs pre-dried onto a carbon-coated Cu grid.

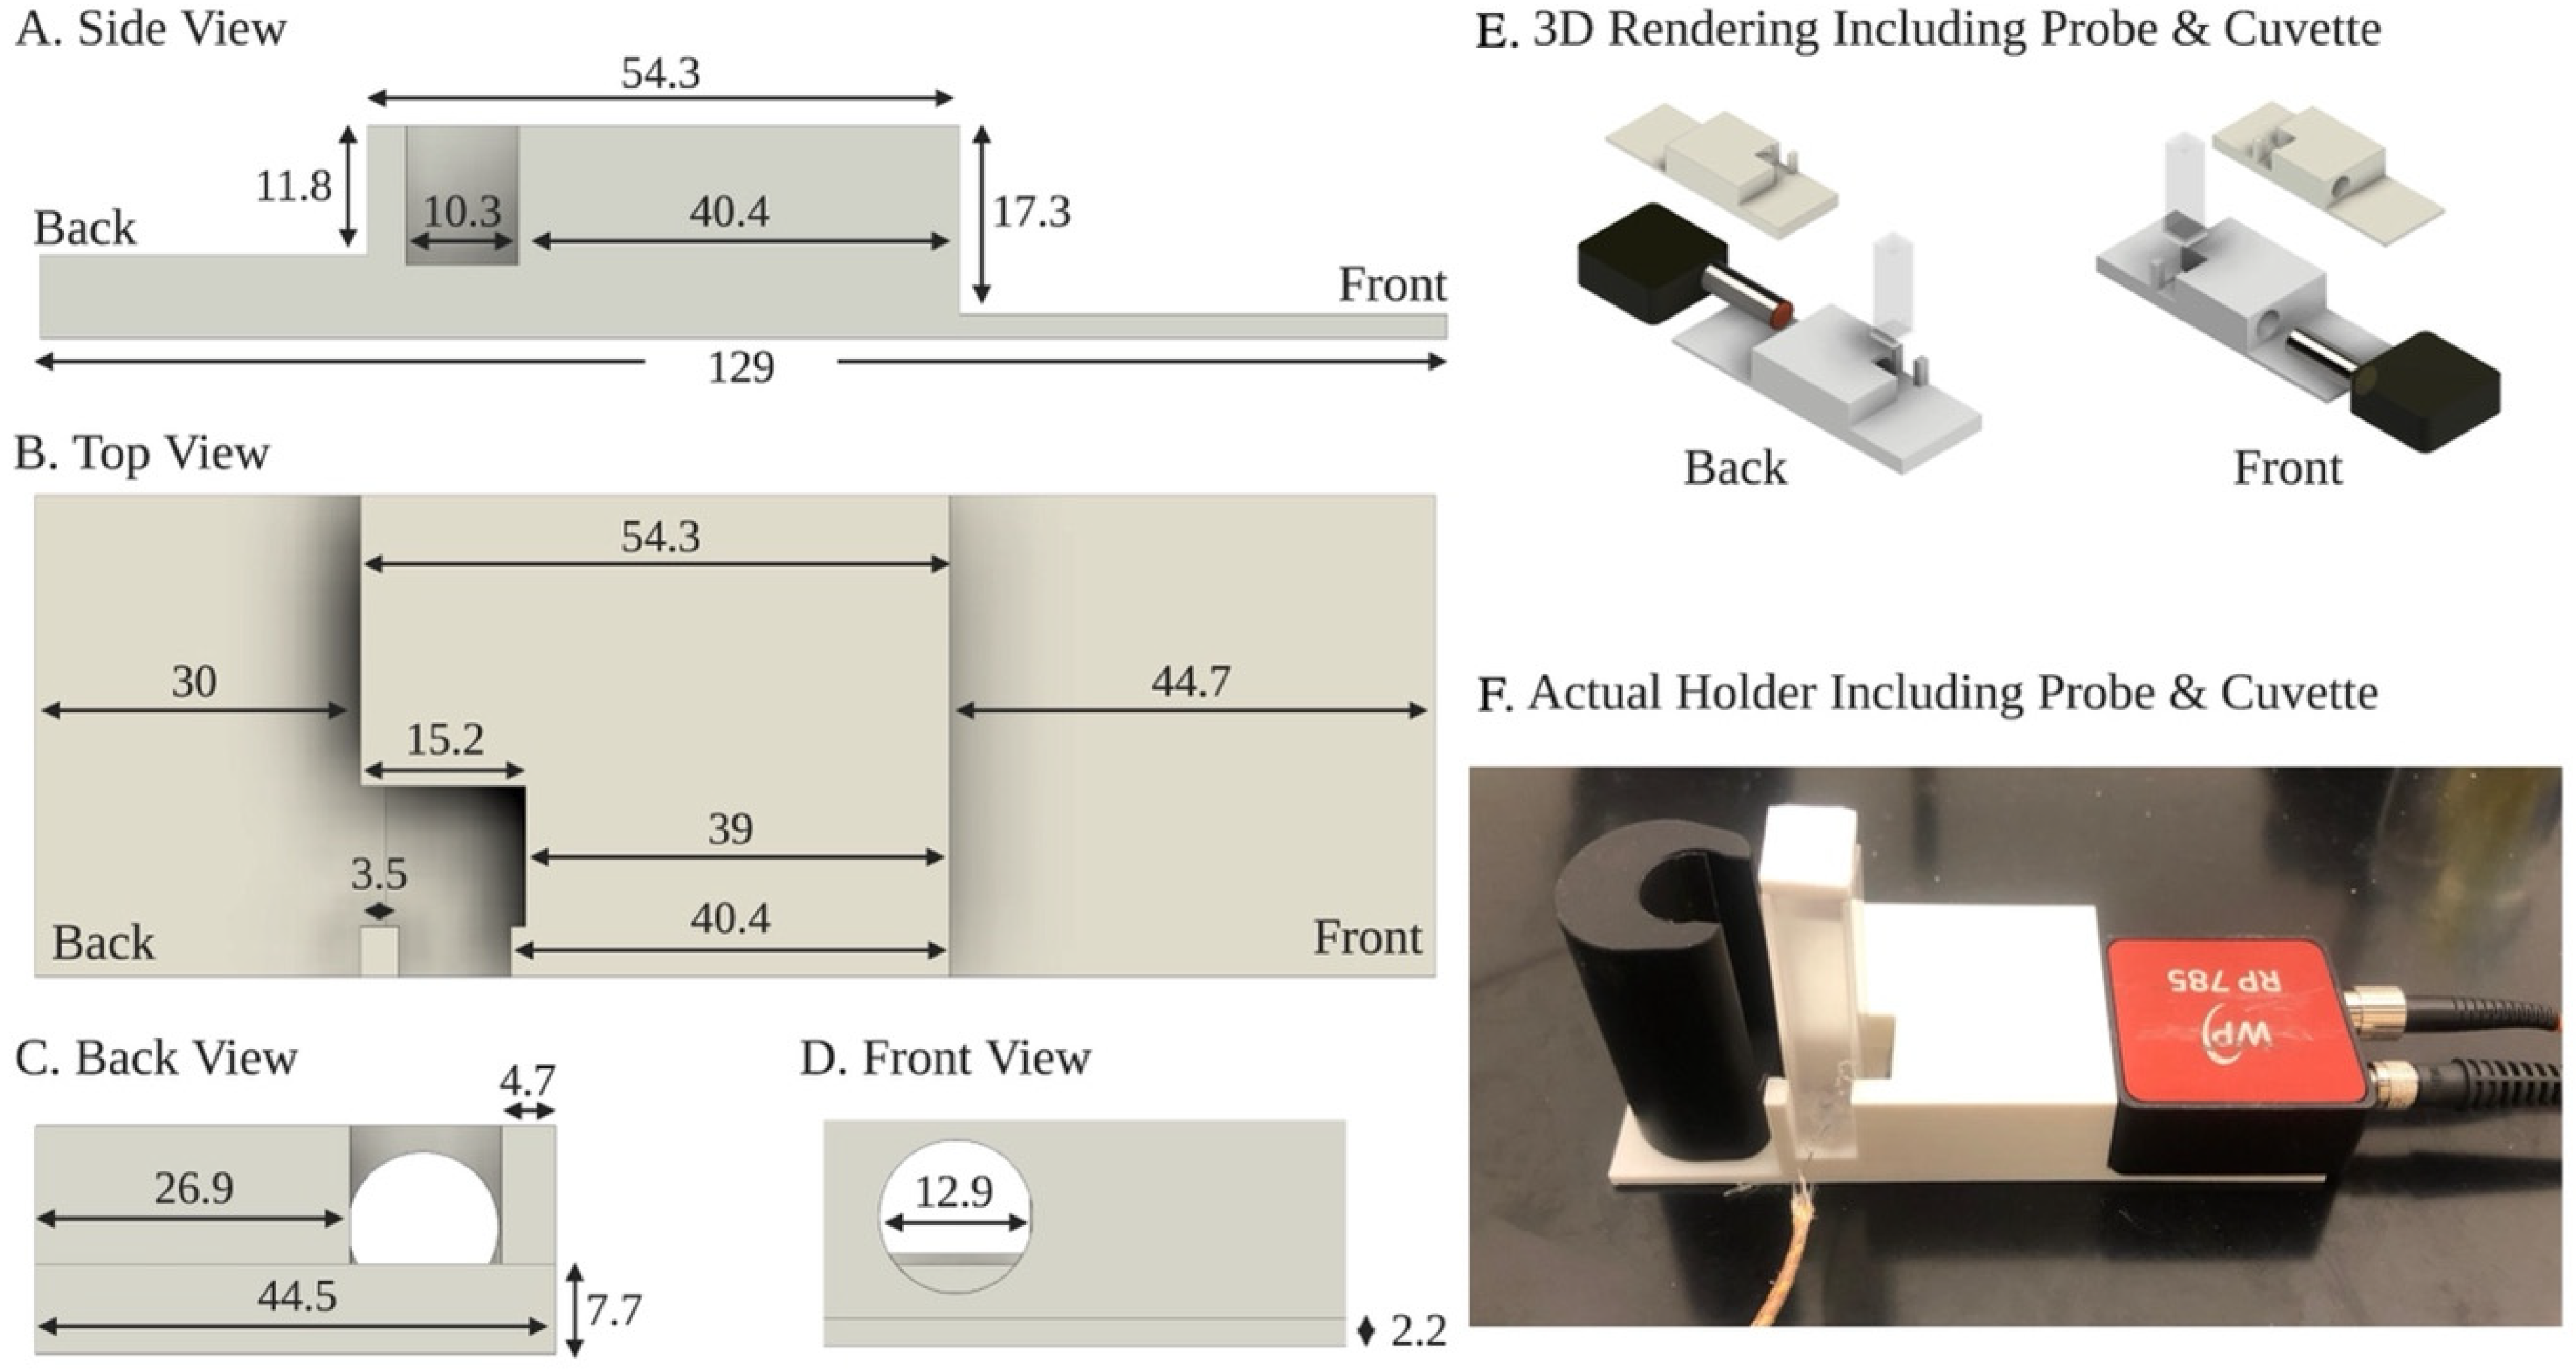
2.2.5. Setup for Simultaneous Photothermal Conversion and SERS Study

As shown in Scheme 1, the setup was comprised of 4 basic parts: a 3D printed spectrometer-to-cuvette coupler, a Raman probe (Wasatch Photonics, Morrisville, NC, USA) connected to a WP 785 Raman Spectrometer (Wasatch Photonics), a quartz cuvette (700 µL capacity) and a thermocouple attached to an Arduino microcontroller. The 785 nm Raman system contains a fiber optic continuous wave laser with a maximum unfocused laser power of output 300 mW (165 mW used for all experiments) and a focal length of 11 mm. The 3D printed holder was optimized so that the laser probe is focused on the center of the glass cuvette (2 mm from the bottom) used to house the nanoparticle samples. The 3D printed holder was designed using Fusion360, then printed from polylactic acid (PLA) using a Prusa I3 MK3S fused deposition printer. To make sure the thermocouple was in the same position for each measurement, a 1 mm diameter hole was drilled onto the bottom side of the cuvette. This allowed the thermocouple to be inserted and fixed into position using adhesive. The thermocouple was threaded through the hole, and the tip was positioned along the bottom edge of the cuvette level in line with the laser focal plane but offset by 2 mm to avoid direct overlap with the laser (which would cause an instantaneous temperature increase, leading to inaccuracies in nanoparticle thermal measurements). When solutions were added to the cuvette, a cap was placed on the top to mitigate the evaporation of sample during the experiments. To verify the effectiveness of the cap’s ability to limit evaporation, the cuvette was weighed before and after heating for 20 min, during which there was an insignificant change in mass (−0.005%). The thermocouple was connected to an Arduino microcontroller via a MAX6675 k-type thermocouple breakout board. Temperature changes were measured using a change in voltage between the 2 metals at the thermocouple junction. The difference in voltage was uploaded to the microcontroller board and converted to temperature readings using the MAX5565 module. Open-source software PLX-DAQ was used to automatically transfer the temperature output from the serial monitor of the Arduino microcontroller IDE to MS Excel. A black anodized box was placed behind the cuvette to absorb any laser light scattered out of the back of the cuvette. The box also ensured no spectral background from the PLA was observed during the SERS experiments.

2.2.6. Simultaneous Measurement of Heat Output and SERS Spectra

First, 100–300 µL of NP (AuNS or AuNPL) solution was placed inside the quartz cuvette and capped. The microcontroller was then connected to the computer and temperature readings were recorded. After 1 min, when the reading from the thermocouple had stabilized to ~22.75 °C (the room temperature), the laser was turned on (laser power, 165 mW/cm2) to avoid any discrepancy in the base temperature. Temperature readings were collected every second and averaged for every minute. This was performed for a period of 20 min, after which the laser was switched off. The length of laser exposure was chosen based on the temperature plateauing after exposure through a trial-and-error method. The cuvette was allowed to cool and was cleaned before the next measurements were taken. SERS spectra were collected every 5 min for up to 20 min. Each spectrum could be immediately viewed within the ENLIGHTEN Spectroscopy Software (proprietary to Wasatch spectrometers). SERS spectra were exported in .csv format and transferred to MATLAB for analysis. Peaks of interest from MBA and BDT were extracted from the spectra and baseline corrected using an asymmetric least squares algorithm to remove any underlying background.

2.2.7. Time-Dependent Stability of the NPs

It was necessary to check for changes in nanoparticle absorbance and morphology throughout our experiments using UV–Vis spectrophotometry and TEM imaging, before and after experiments to understand the effects laser illumination was having on the NP properties. It was also essential for us to ensure nanoparticle stability, as other than citrate, no nanoparticle stabilizing reagents were added to the sols post-synthesis. A 100 µL aliquot of AuNS or AuNPL solution was taken from their stocks every 24 h and the UV–vis spectra were obtained before and immediately after 20 min of laser irradiation; furthermore, 8 µL of each pre- and post-irradiation sample was deposited onto a copper grid for TEM imaging.

2.2.8. Effect of Heating on NP Morphology

This experiment involved looking at the effect the heat generated had on the NP’s morphology. AuNS or AuNPL sample was taken before the heating experiment for TEM imaging and UV–vis spectrophotometry. After subjecting 100 µL of NP sample to laser-induced heating, 8 µL of the sample was taken out for TEM analysis and the rest was scrutinized using UV–vis spectrophotometry.

2.2.9. Effect of Sample Volume on the Heat Output

First, 100 µL of AuNSs or AuNPLs was first placed into the cuvette. The laser was turned on and the heat output was recorded from the temperature probe. After 20 min of heating, the laser was switched off and the sample was collected. The cuvette was cleaned with DI water multiple times before repeating the experiment with 200 and then 300 µL of the sample. All the heating measurements were performed in triplicate. The final heat output was calculated by averaging the temperature change values at a 20 min time point, and the standard deviation (SD) of triplicate measurements was calculated in a Microsoft Excel spreadsheet using the STDEVA function. The data are expressed as the mean ± SD.

2.2.10. NP Exposure to Multiple Heat/Cool Cycles

Our next experiment looked at the effects this aggregation or agglomeration had on further heat generated by the NPs. This experiment was performed to determine if multiple exposures of NPs to laser irradiation would have any effect on the heat output. The NPs were subject to 20 min of laser light exposure, after which the laser was turned off for 15 min, allowing the sample to cool down. The sample was then re-exposed to the laser for 2 more 20 min heating and 15 min cooling cycles. The lengths of heating and cooling cycles were chosen based on the temperature plateauing after exposure through a trial-and-error method.

3. Results

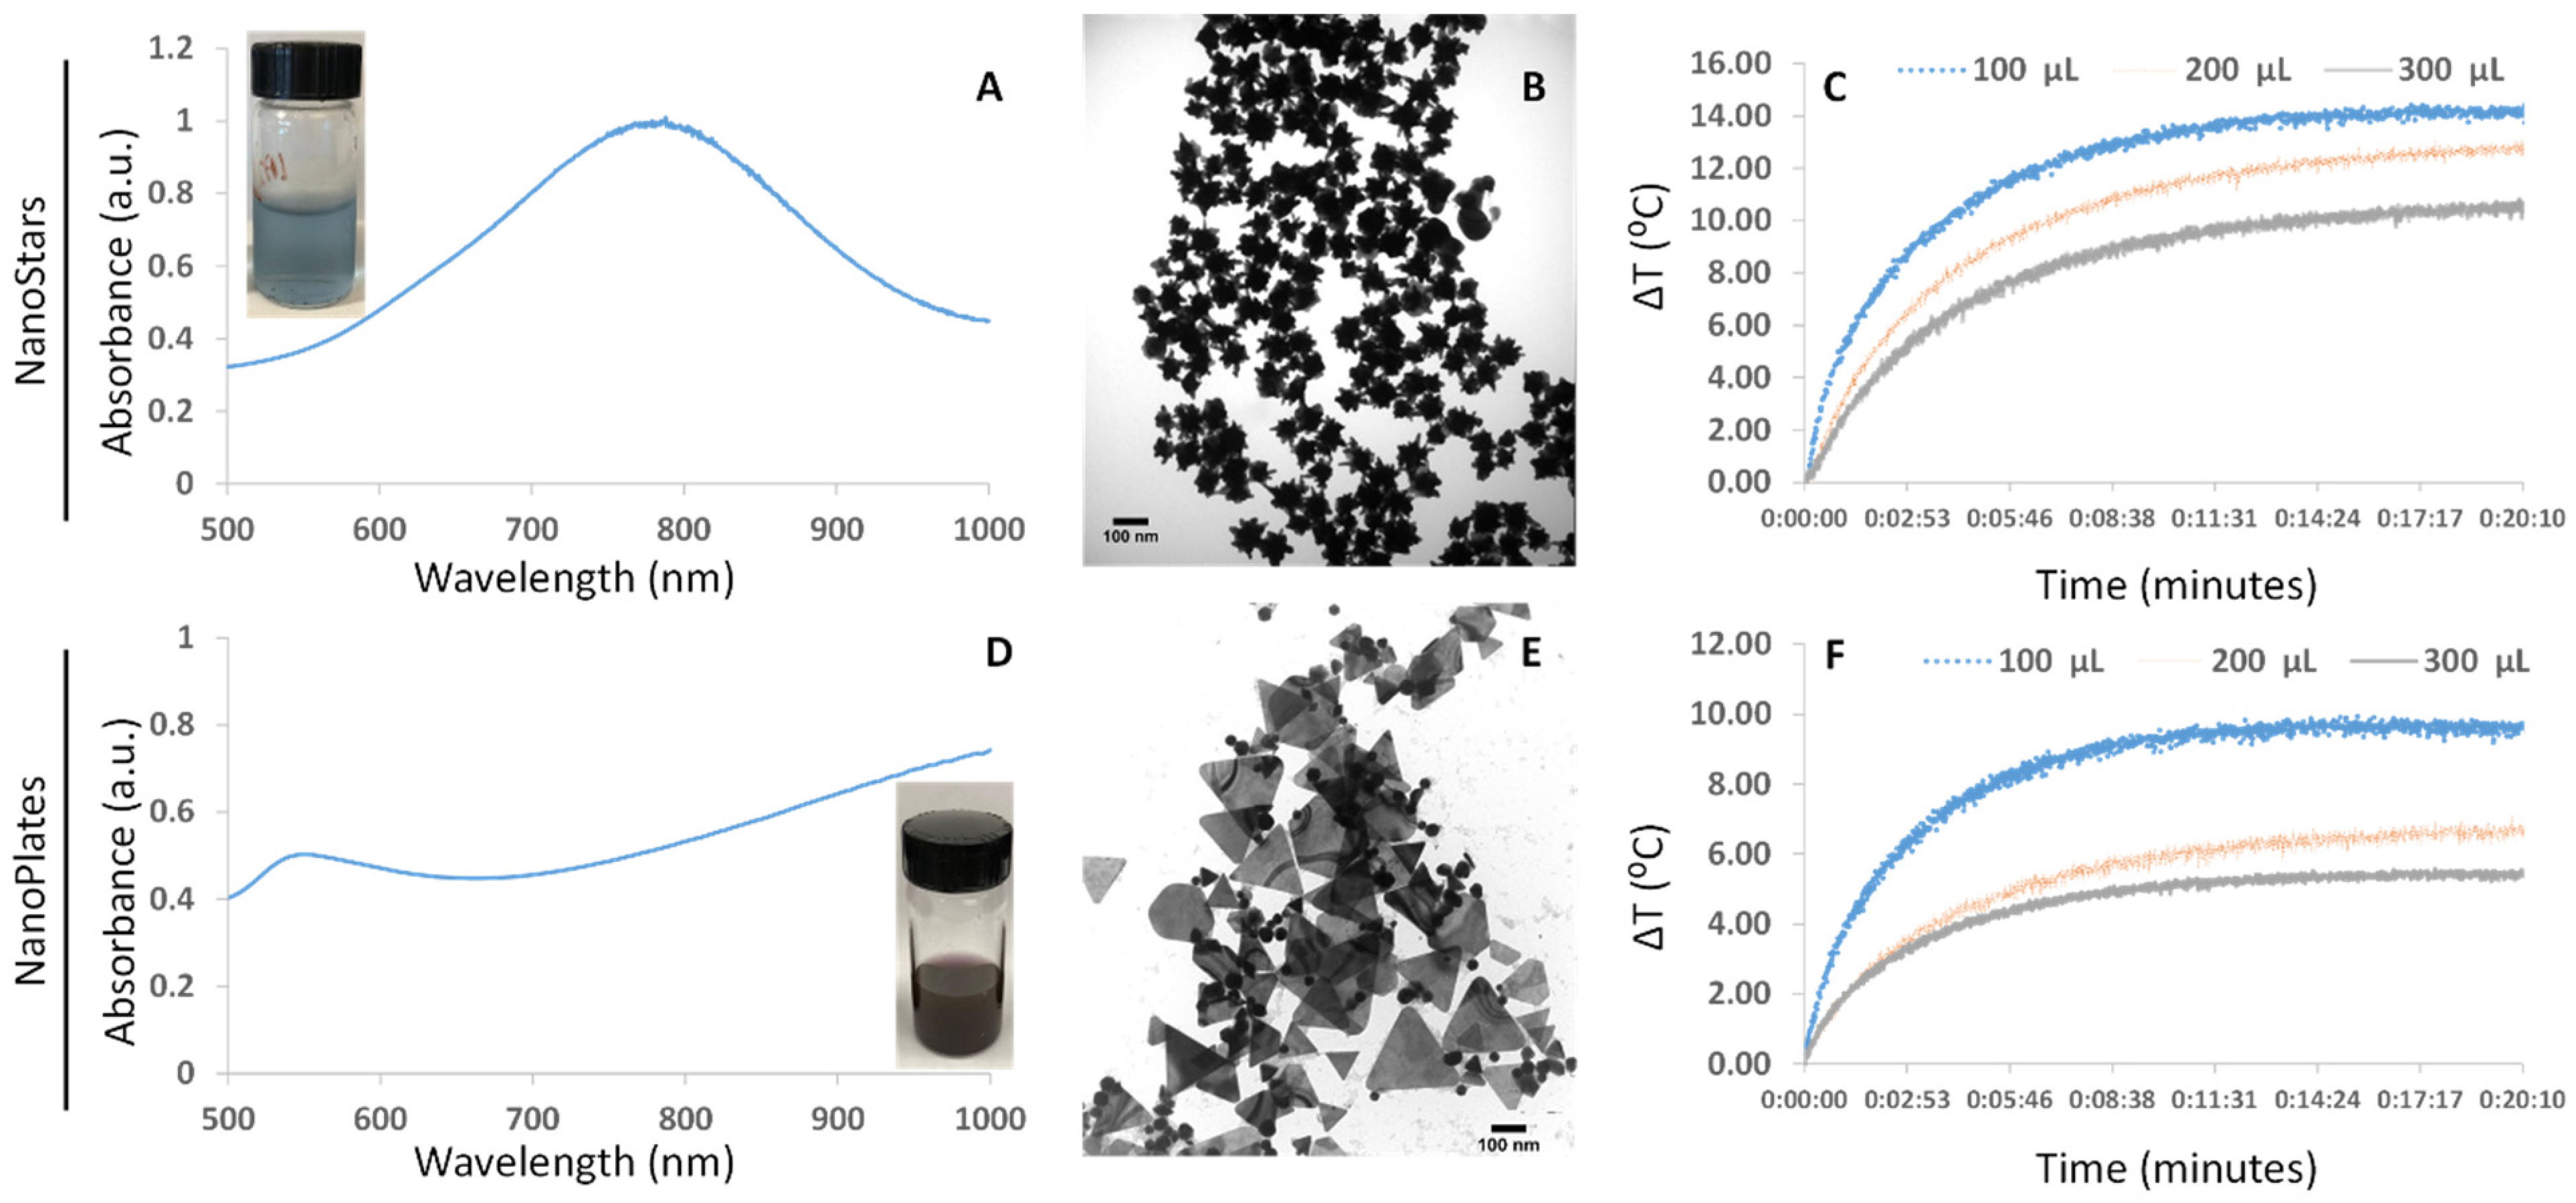
3.1. Characterization of Gold Nanostars and Nanoplates

The successful synthesis of the AuNSs was confirmed visually upon observing a color change in the reaction solution from light yellow to light blue (Figure 1A, inset). As seen in Figure 1A, the UV–vis spectrum of AuNSs shows that the average λmax is 785 nm, which aligns well with our laser source. The TEM image of the AuNSs (Figure 1B) shows that the AuNS cores were approximately 50 nm in diameter. There were approximately 10–15 arms per nanoparticle, the length of which ranged between 15–20 nm. The AuNPLs shown in Figure 1D-inset were dark brown in color. The UV–vis spectra (Figure 1D) of the AuNPLs showed a broad peak at 1000 nm. Another small peak was observed at 535 nm, which corresponds to the spherical gold nanoparticle byproduct. As can be seen in the TEM image (Figure 1E), the surfactant-free synthesis of AuNPLs yielded a solution containing both triangular plates and spherical byproducts. ImageJ analysis showed that a typical solution contained between 50–75% triangular plates. From ImageJ analysis, the nanoplate particles were calculated to have lengths ranging from 50 to 135 nm, and spherical particles had a diameter of ~5–30 nm.

3.2. Effect of Volume on Heat Output

To determine the ideal volume of sample for making simultaneous heat and SERS measurements, we tested the heat output from 100, 200, and 300 µL of AuNS solution. Due to the configuration of the system, it was not possible to measure volumes less than 100 µL. Figure 1C shows the heating data collected for the three volumes of AuNS samples. The 100 µL sample heated up the most, with an average 14.33 ± 0.38 °C increase in temperature in 20 min. We also noticed a considerable drop in the heat outputs of the 200 and 300 µL samples averaging 12.67 ± 0.38 °C (11.63% drop) and 10.67 ± 0.29 °C (25.58% drop) respectively. Similarly, AuNPLs exhibited a decrease in heat output with an increase in the volume (Figure 1F): 9.75 ± 0.90 °C for the 100 µL sample, 6.58 ± 0.14 °C for the 200 µL sample and 5.45 ± 0.14 °C for the 300 µL sample, which represent decreases in heat output by 32.48% and 44.11% with each increment in volume, compared to 100 µL sample volume. Based on these findings, we opted to use 100 µL of nanoparticles in our further studies.

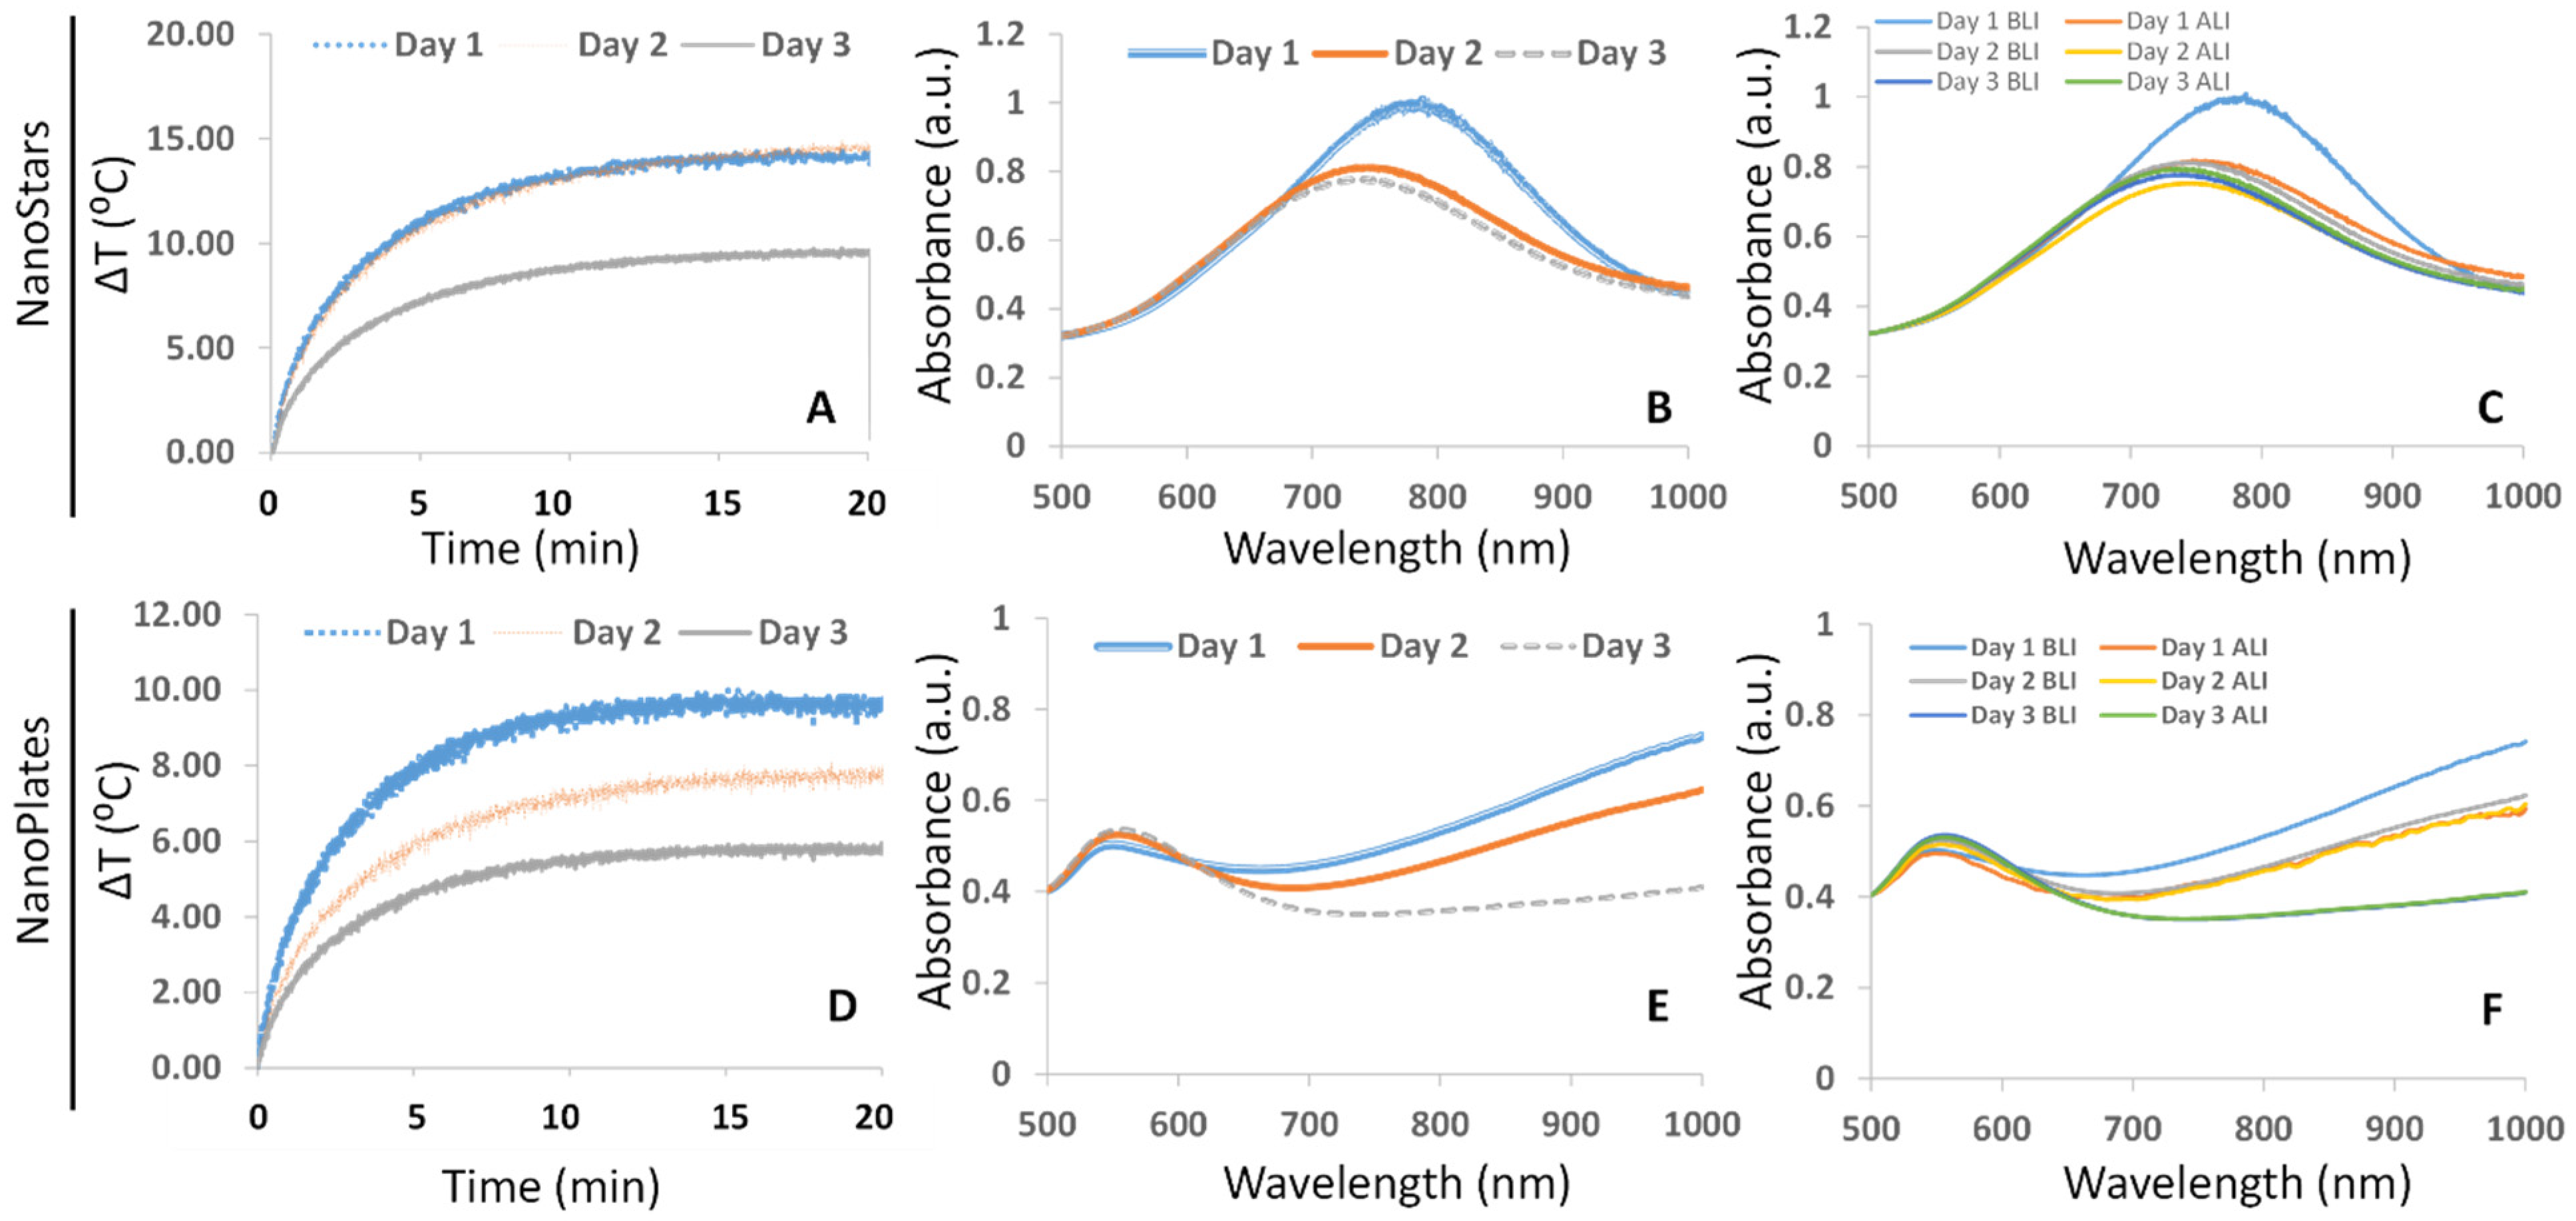
3.3. Stability—UV–vis Analysis

Though surfactant-free synthesis methods are largely non-cytotoxic, the absence of a strongly adhered stabilizing agent on the surfaces of the particles can compromise their stability [27]. Hence, we compared the absorption spectra and heat output collected from the AuNSs and AuNPLs for three consecutive days after synthesis to infer if any changes in the properties occur over the short term. The absorption spectra were used to determine the stability of the NPs, and the corresponding heat output was used to look at the effects of instability. Figure 2B shows the UV–vis spectra of the AuNSs on three consecutive days. The blue spectrum was taken immediately after particle synthesis, and the orange spectrum was taken after overnight storage at 4 °C. After overnight incubation, the spectra showed significant blueshift (from λmax 785 nm to 747 nm), indicating an alteration of the AuNS morphology. The same trend was observed on the third day with a slight blue shift to 738 nm. As shown in Figure 2A, compared to fresh AuNS, which heated up to 14.33 ± 0.38 °C above room temperature (abrt) in 20 min upon laser irradiation, after overnight storage, the heat output increased slightly to 14.58 ± 0.63 °C (1.74% increase) on the second day. However, on the third day, the heat output dropped significantly to 9.64 ± 0.80 °C, which represented a decrease by 32.72% compared to the fresh sample. As with the AuNSs, we wanted to look at any changes that occurred to the AuNPLs post storage. The absorption spectra of the AuNPLs are shown in Figure 2E. The blue curve is the absorption spectrum taken just after the AuNPLs were synthesized with λmax above 1000 nm, whereas the orange and grey curves represent spectra taken 24 and 48 h after synthesis respectively. Though the λmax is above 1000 nm, the spectra show that the nanoparticles are capable of absorption at the wavelength of interest (785 nm). We observed a significate drop in the intensity of absorption and flattening of the peak with time. The laser-induced heat output from these particles decreased consistently for three consecutive days after synthesis, from 9.75 ± 0.90 °C on day 1, to 7.67 ± 0.38 °C on day 2 and 5.81 ± 0.38 °C on day 3 (Figure 2D), which represents a drop in heat output by 21.37% on day 2 and 40.41% on day 3, compared to day 1.

3.4. Change in Morphology after Heating

Our next experiment was performed to look at any induced effects the heating had on the NP. For this, we compared the TEM and UV–vis data of the AuNSs before and after heating. From the TEM data (Supplementary Materials, Figure S1), we can visually infer there was no immediate observable change in the length of the arms of the NS after irradiation with the laser. However, the λmax of the AuNS particles shifted from 785 to 760 nm (Figure 2C) upon laser irradiation. We also noticed a significant decrease in optical density of the AuNSs by 0.19 units after they had been exposed to the laser light. There was a noticeable broadening of the absorbance peak (full width at half maximum (FWHM) increased from 343.99 to 434.02 ± 1.14), which may indicate aggregation of the AuNSs due to the heat from the NPs. Like the AuNSs, we wanted to see the effect of laser-induced heating on the morphology of AuNPLs. From the TEM data (Supplementary Materials, Figure S2), we can observe no significant change in the morphology of NPLs after being exposed to the laser. From the UV–vis spectra (Figure 2F), we can observe an optical density difference of 0.08 units between the spectra before and after exposure to the laser. We also noticed a slight broadening of the spectrum (FWHM increased from 143.01 to 145.53 ± 0.90), which could further indicate agglomeration of the particles after exposure to the laser [28,29].

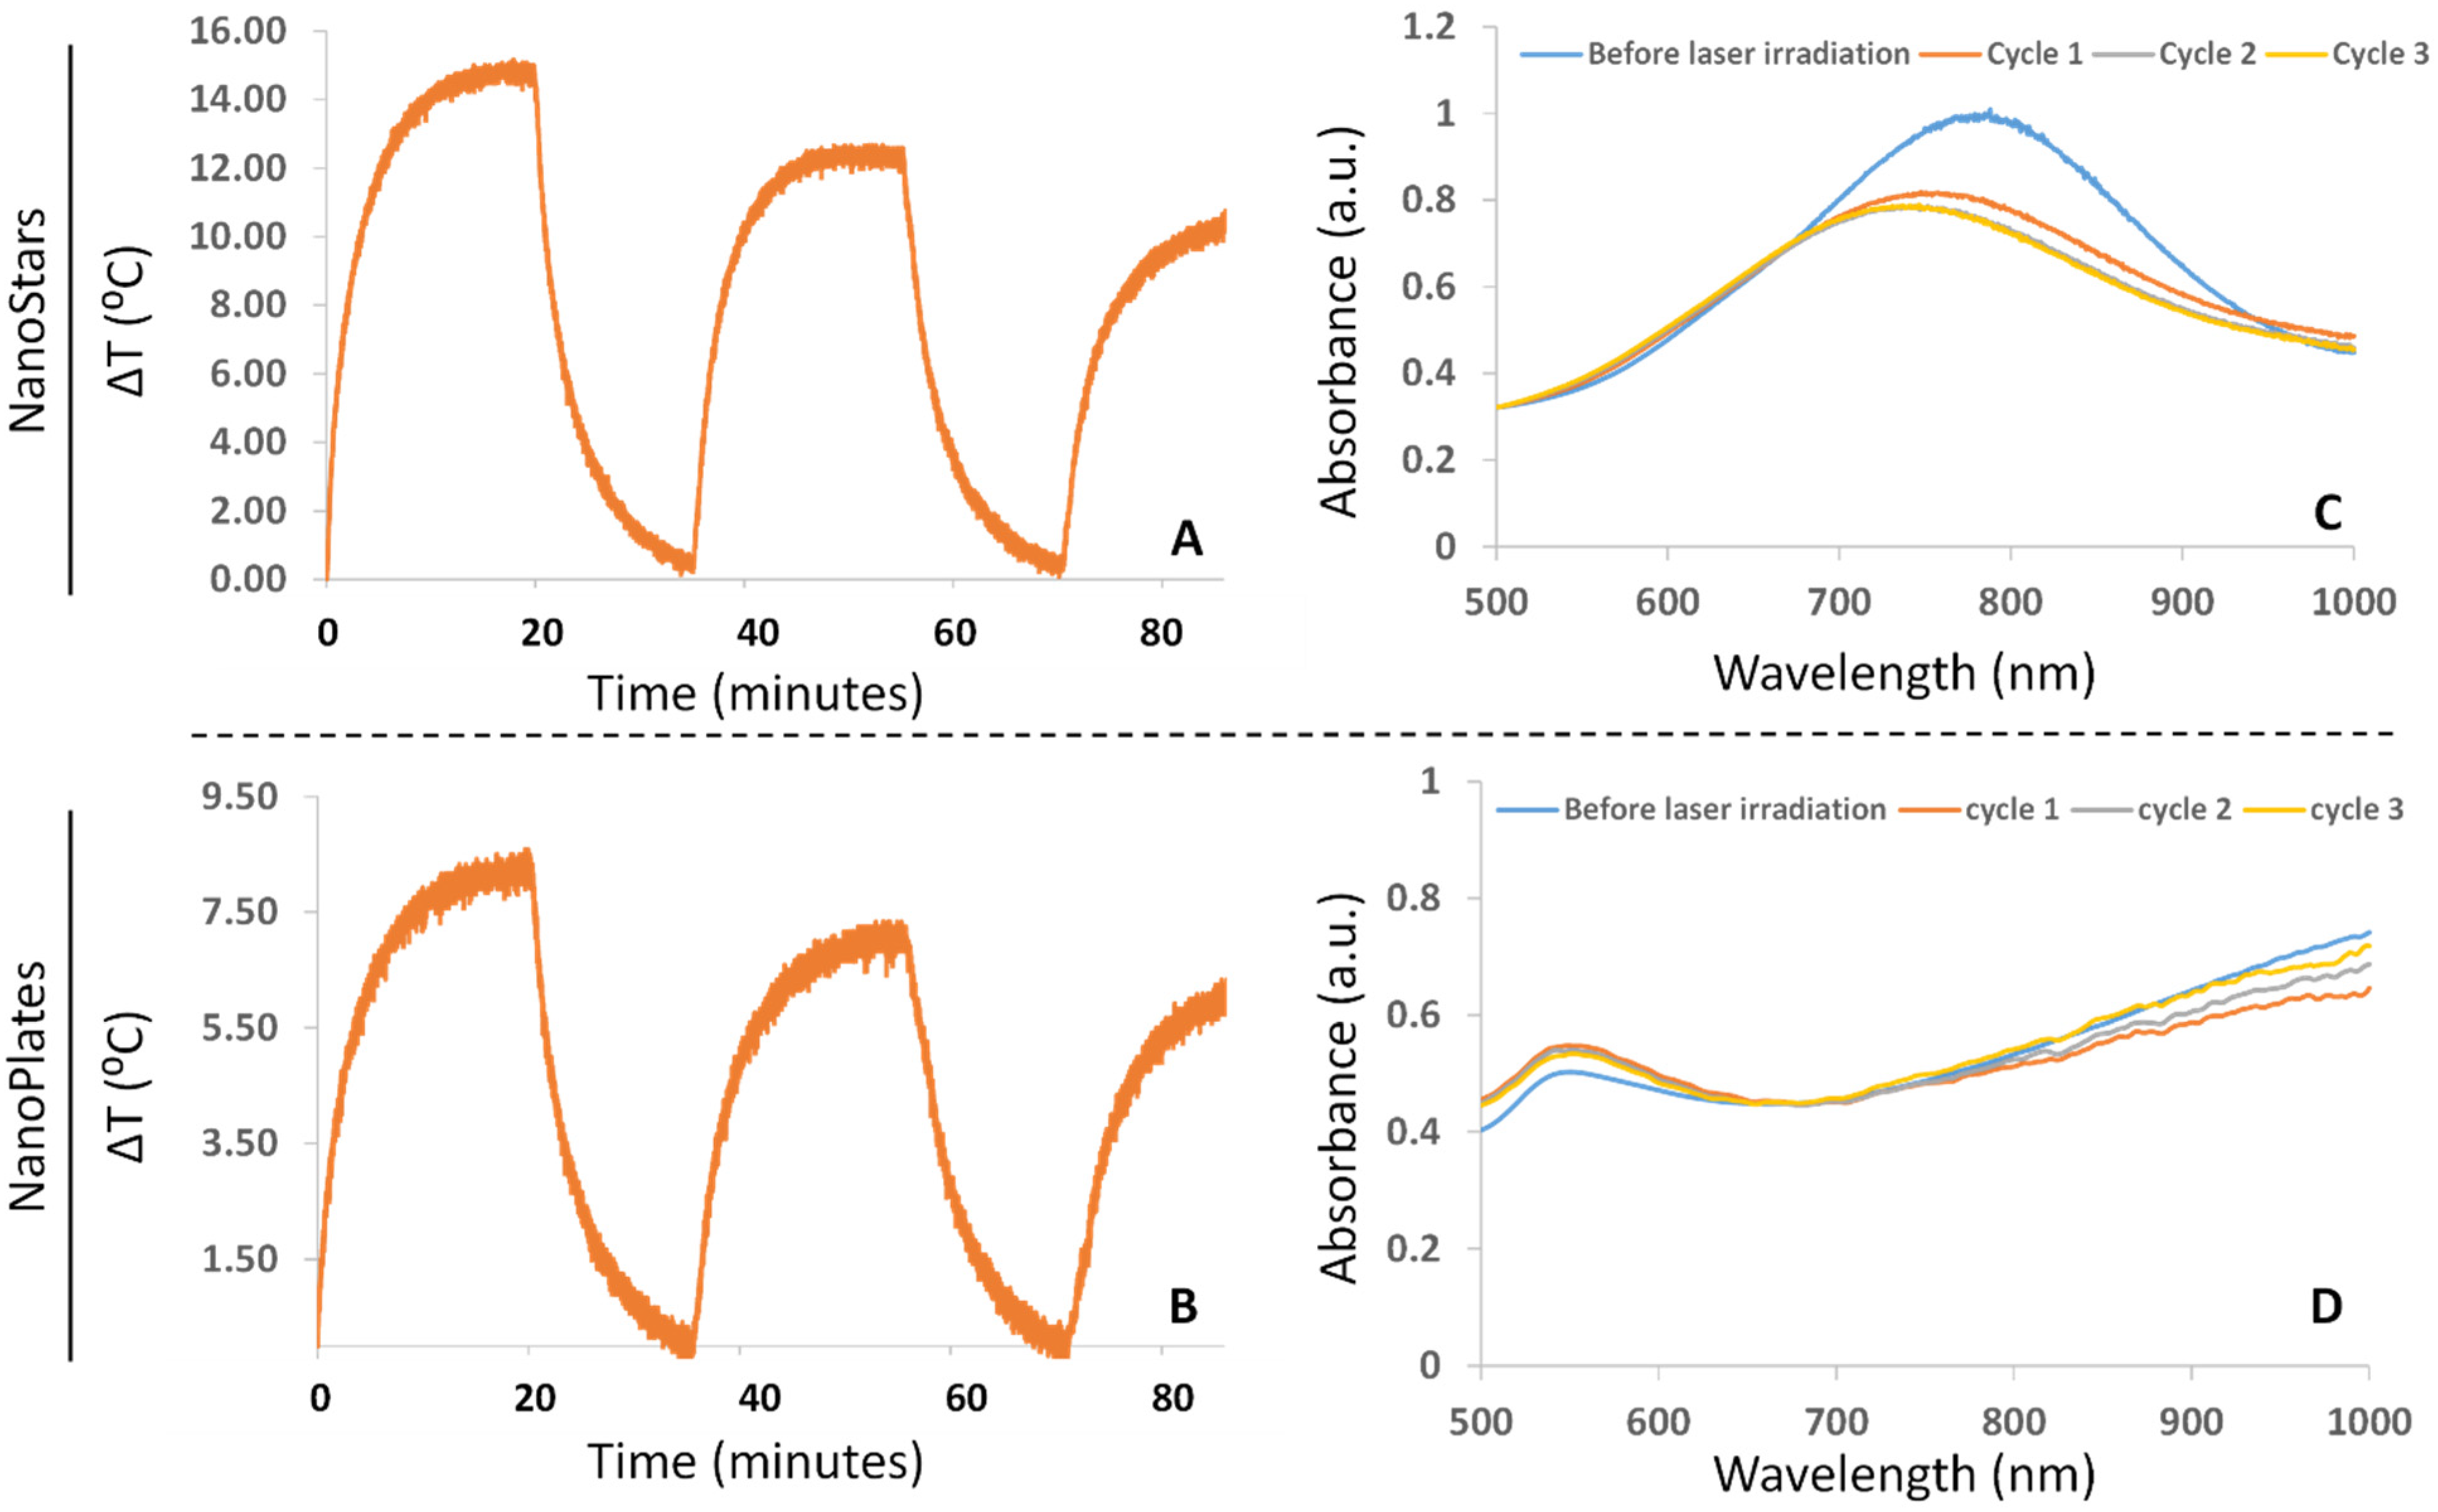
3.5. Exposure to Multiple Heating and Cooling Cycles

Our next experiment involved exposing the NS to multiple rounds of heating and cooling (Figure 3A). Aware that there was possible aggregation of the NS occurring due to the heat generation, we wanted to check the effects that multiple laser irradiations followed by cooling may have on the heat output, so 20 min heat and 15 min cool cycles were chosen based on the temperature plateauing after laser exposure. In the case of AuNSs, we observed maximum heating of 14.50 ± 0.25 °C for the first heat–cool cycle, 12.17 ± 0.63 °C for the second heat–cool cycle and 10.67 ± 0.95 °C for the heat–cool third cycle, which represent decreases in the heat output by 15.64% (between the first and second cycles) and 26.41% (between the first and third cycles). As shown in Figure 3B, in the case of AuNPLs, we observed maximum average heating of 8.25 ± 0.66 °C in the first heating cycle, followed by decreases in the heat output to 7.00 ± 0.43 °C and 6.25 ± 0.50 °C in the next two cycles, which represent 15.15% and 24.24% decreases in the heat output, respectively. As seen in Figure 3C, the absorbance spectrum of the AuNSs showed a significant blue shift upon laser irradiation in each heating cycle. In the case of AuPLs, we observed a slight broadening of the absorption peak (FWHM increased from 143.01 to 145.01 ± 0.57) with consecutive heating and cooling cycles (Figure 3D).

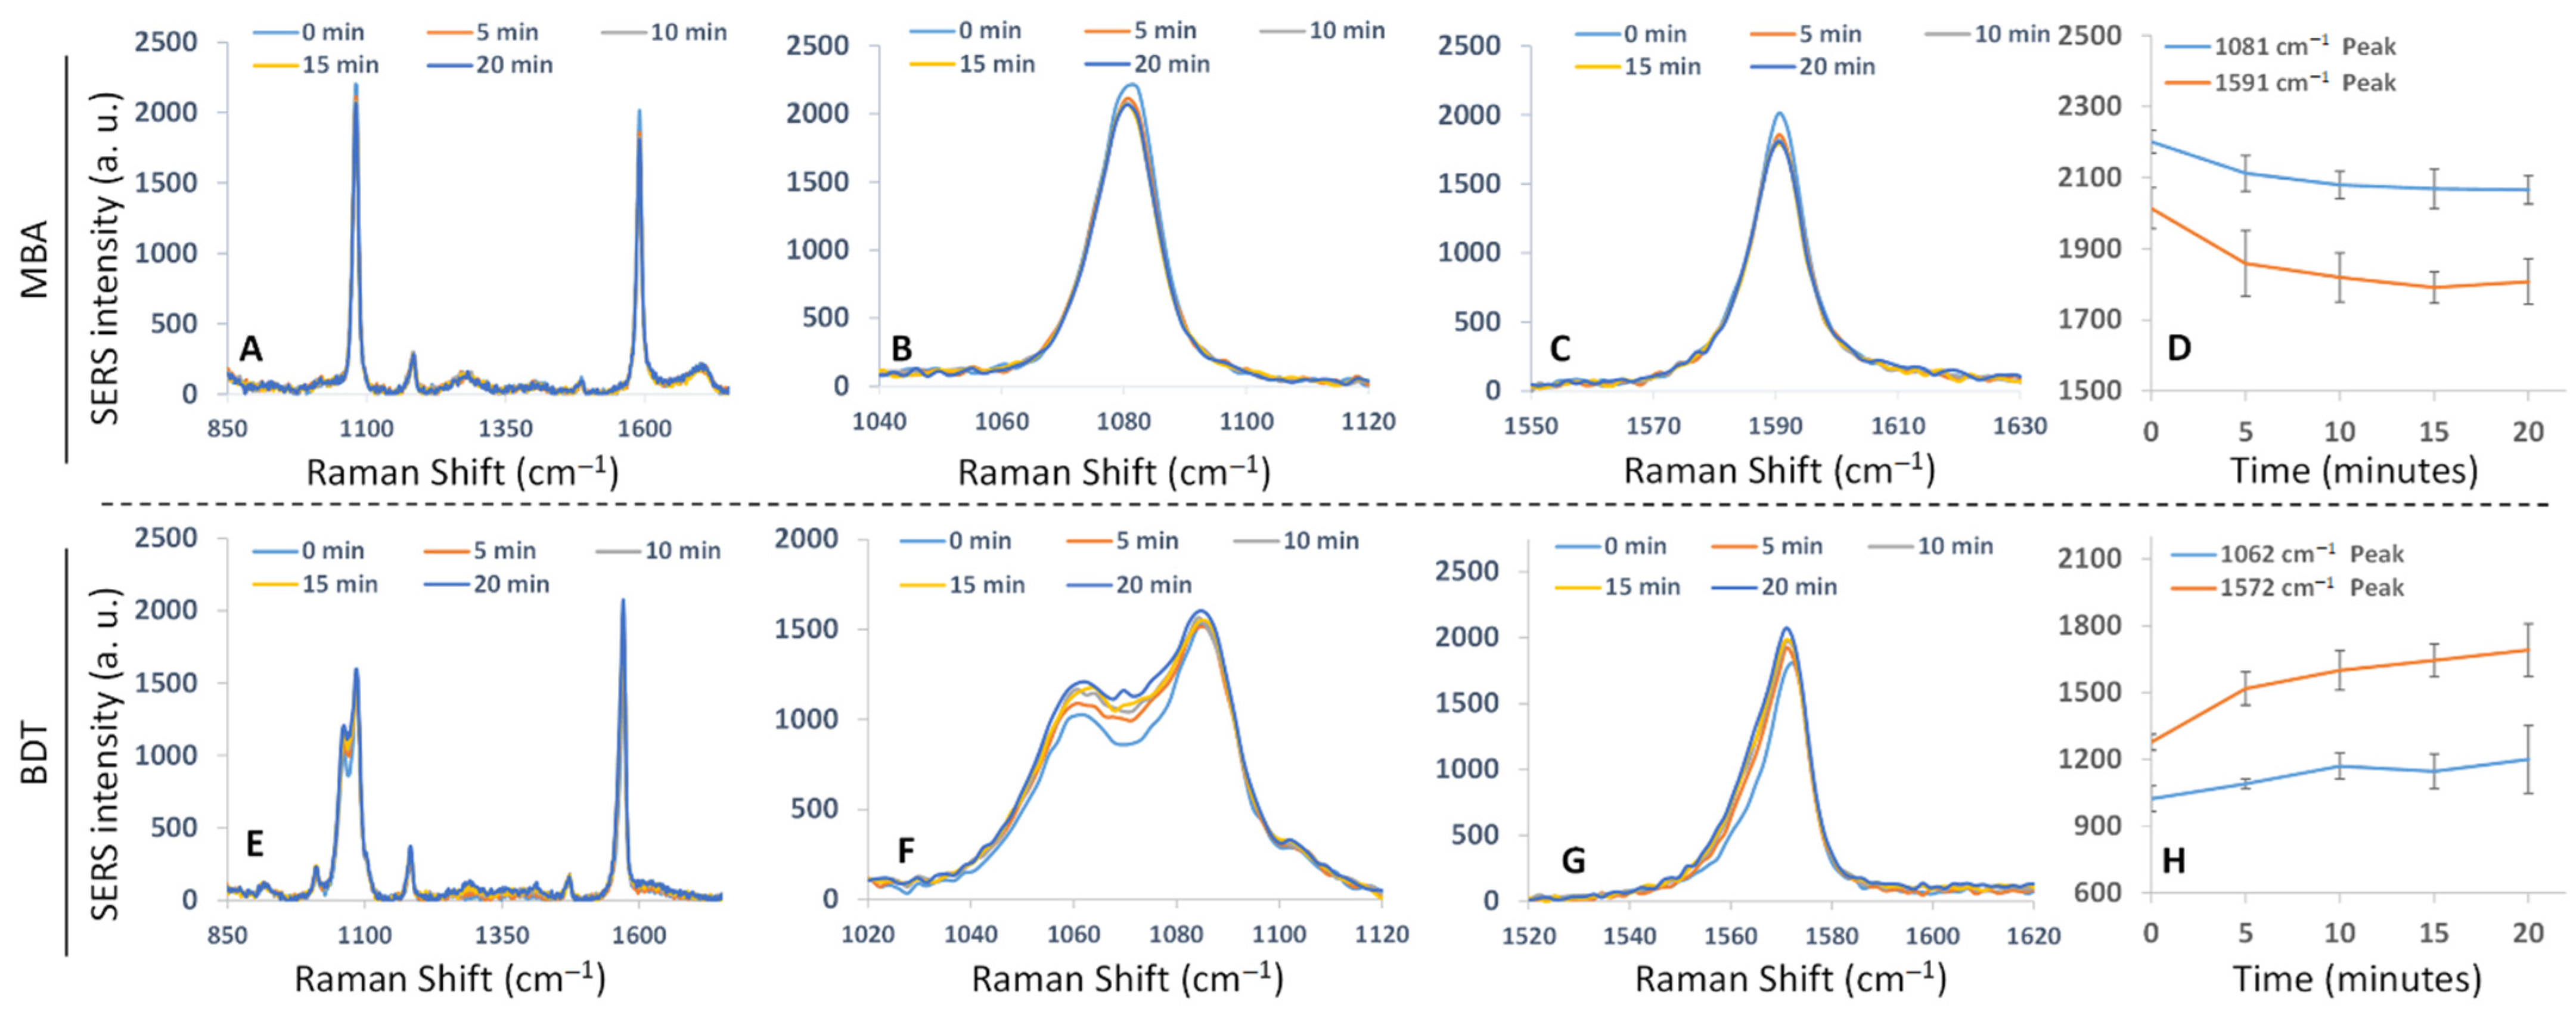
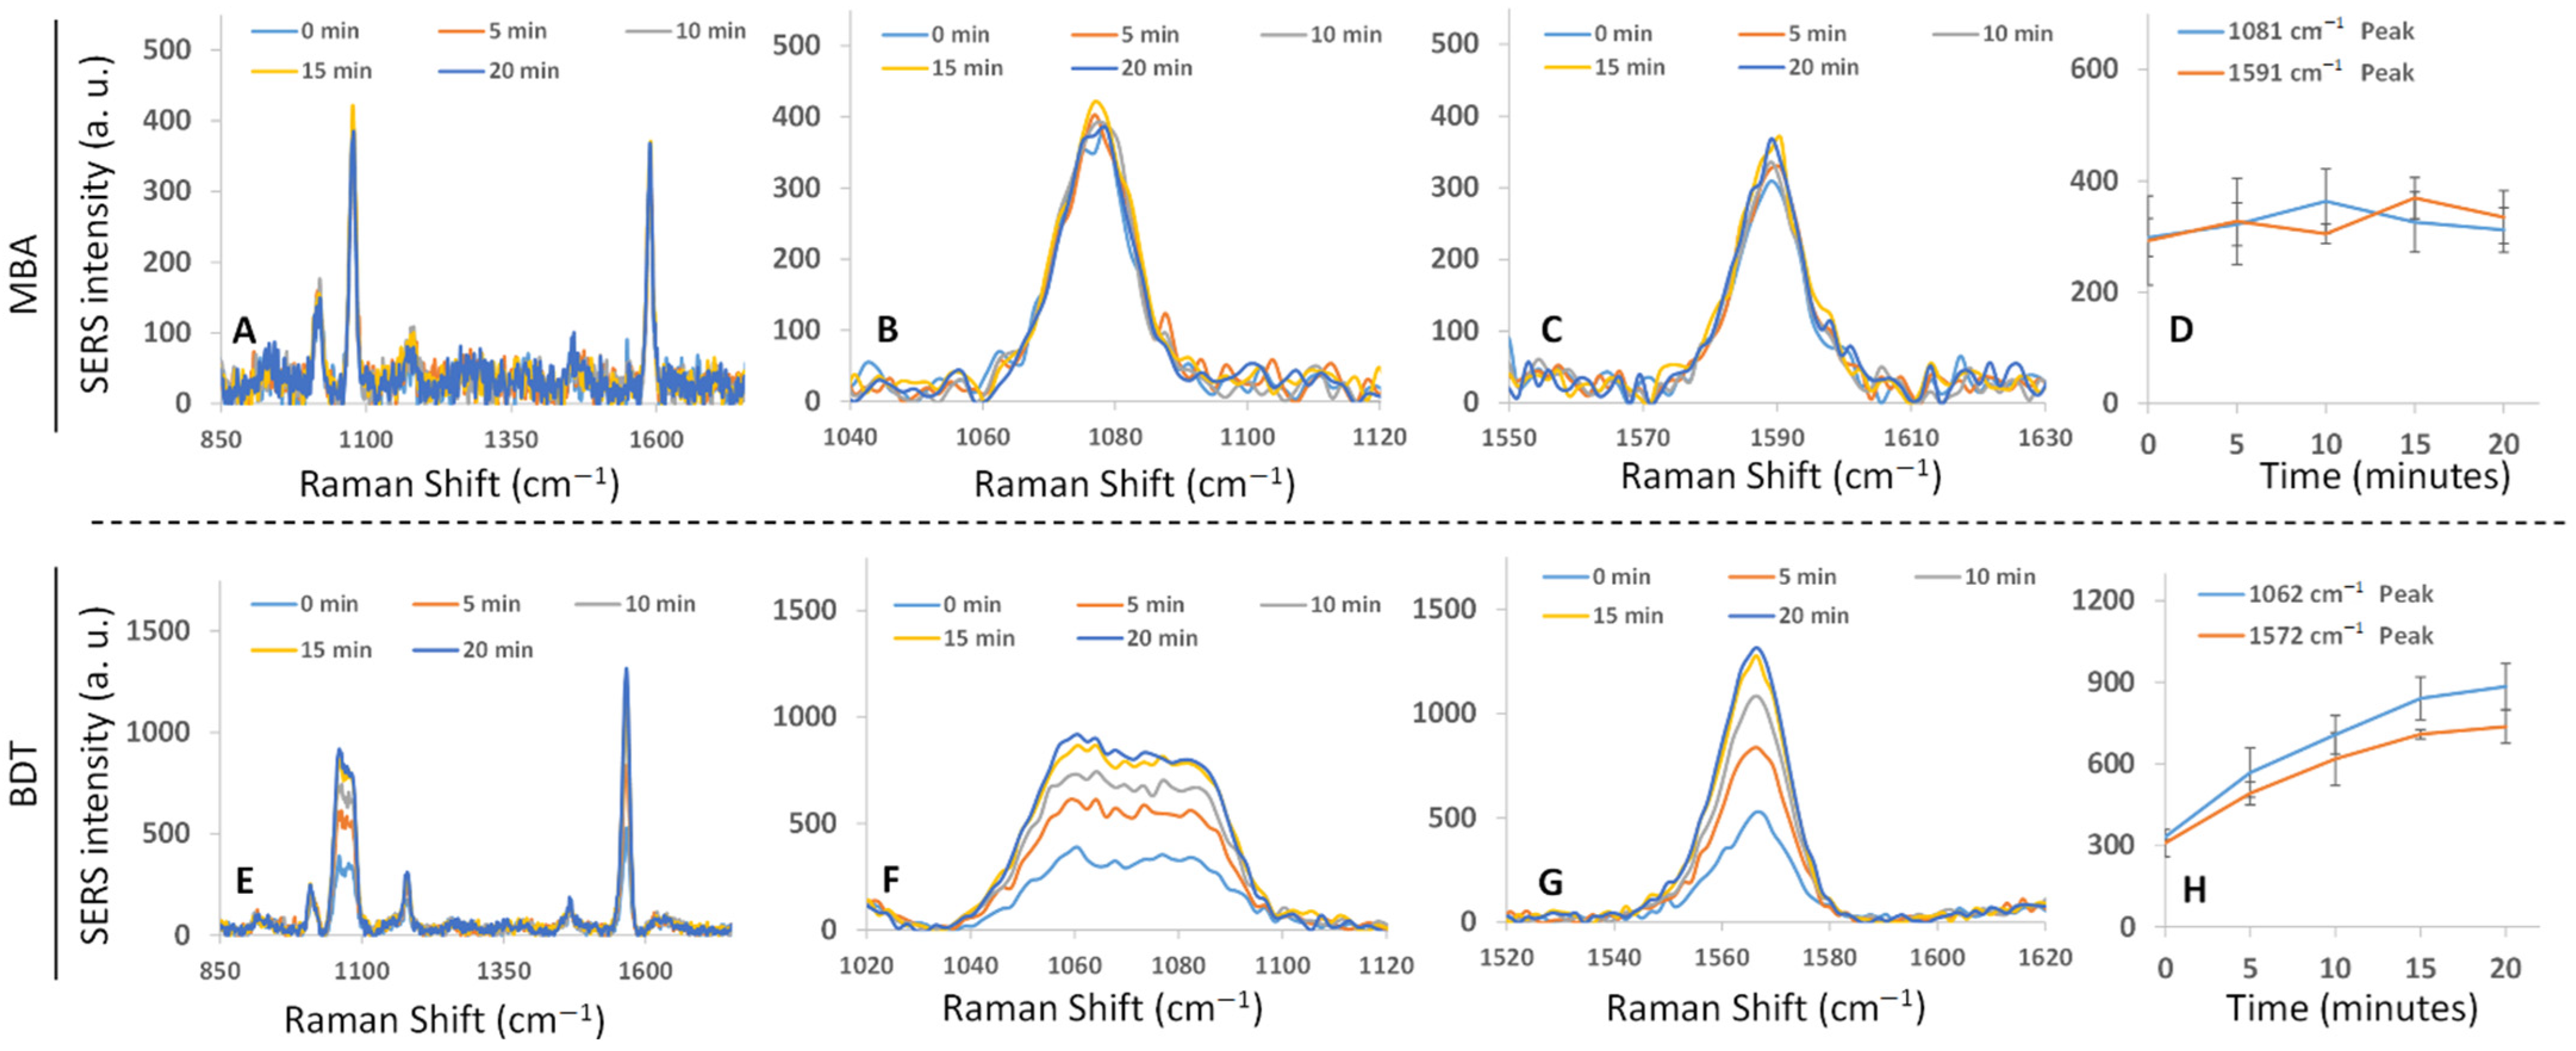
3.6. SERS Enhancement

SERS enhancement of AuNSs and AuNPLs was studied using two different Raman reporters: MBA and BDT. These were chosen because of the presence of thiol groups in the structure that enable strong binding to gold NPs [30]. For MBA, we examined the molecule’s characteristic Raman peaks at around 1081 and 1591 cm−1, both of which assigned to the benzene ring breathing mode [31,32], and for BDT, peaks at 1062 and 1572 cm−1 were studied, which are also a result of ring breathing modes [33]. Figure 4A shows the SERS spectra observed for MBA adsorbed onto the AuNSs. The peaks observed at 1081 and 1591 cm−1 were truncated and the baseline corrected. Figure 4B,C shows how the SERS intensity for the two peaks changed over a period of 20 min when irradiated with a 785 nm laser. There appears to have been a slight decrease in SERS intensity for both the MBA peaks during the 20 min heating cycle, as shown in Figure 4D. Initially, counts for the 1081 cm−1 peak were just above 2201, which decreased to 2065.85 by the end of 20 min (6.14% decrease), whereas the 1591 cm−1 peak had an initial SERS intensity of 2014.08, which decreased to 1807.57 (10.25% decrease) by the end of 20 min. For the AuNPLs, we observed a different trend. The complete SERS spectrum of MBA is shown in Figure 5A. The intensity of the SERS signal generated from the MBA attached to the AuNPL surface was less than what was seen for the MBA when attached to the AuNS surface (Figure 4A). In Figure 5D, we can see no decrease in the SERS intensity for either peak (1081 and 1591 cm−1 peaks shown in Figure 5B,C respectively) over the course of 20 min of laser irradiation, but in fact, there was variable increasing and decreasing of SERS intensity.
Figure 4E shows the SERS spectrum of the BDT Raman reporter for the AuNSs. Both BDT peaks (1062 and 1572 cm−1) were baseline corrected. There appeared to be a slight increase in SERS enhancement of the BDT Raman signal by AuNSs. There was a significant and gradual increase in SERS enhancement by the AuNPLs. For the AuNSs, we can see a slight increase in the intensity of the 1572 cm−1 peak (from 1022.63 intensity to 1199.42), whereas the 1062 cm−1 peak’s increased from 1276 intensity to 1690. In the case of AuNPLs, the 1062 cm−1 peak increased in intensity from 330 to 884.69, and the peak at 1572 cm−1 increased in intensity from 308.45 to 737.09 by the end of 20 min laser exposure. These represent 167.76% and 138.97% increases in the intensity of 1062 and 1572 cm−1 peaks, respectively.

4. Discussion

This study presented a simple method for the rapid, simultaneous screening of heat output and SERS signal generated using AuNPs. We synthesized two morphologically complex NPs, AuNSs and AuNPLs, via surfactant-free methods, and characterized them using UV–vis absorption spectroscopy and TEM. We demonstrated that the measurement setup can be used in a variety of ways to prescreen the properties of the nanoparticles prior to them being applied to in vitro or in vivo studies. Using a commercial, portable spectrometer coupled to a quartz cuvette by a 3D printed device, we were able to observe the changes in the photothermal and spectroscopic outputs of our particles.
First, to determine the ideal volume of sample for further experiments, we exposed different volumes (100, 200, and 300 µL) of both NPs to laser light for 20 min. We found that the increase in the temperature was maximal for 100 µL, followed by 200 µL and 300 µL. This decrease in the heat output with the increase in volume was expected because of the increased cooling effect from the medium around the area of dissipation [34,35]. Reducing the volume further might improve the signal-to-noise ratio; however, lower volumes are not suitable for the designed setup because of the laser path and temperature probe positioning. Next, we conducted a series of experiments to determine the stability and laser-induced heat output of both AuNSs and AuNPLs. We observed that the heat output from AuNSs on day 2 was not significantly different from day 1; however, it decreased considerably on day 3. To understand the trend, we looked at the UV–vis spectra of the nanoparticles taken on three consecutive days before they were exposed to laser irradiation. The λmax of the particles blue-shifted significantly on day 2 when compared to day 1, and not so much on day 3 when compared to day 2. We noticed a significant blue shift on day 1 after laser irradiation when compared to particles that were not exposed to the laser. However, on day 2 and 3, there was no change in the λmax of the spectra collected before and after laser irradiation. This UV–vis absorbance data indicate that upon storage of AuNSs in the refrigerator overnight, their stability was affected, which could have been caused by them reverting to a more thermodynamically favorable spherical morphology, as observed by others [36,37,38]; however, TEM analysis did not confirm any quantifiable morphological changes. Based on the heat output data, we believe that this process was accelerated by laser exposure on day 1; however, on day 2 and 3, laser irradiation did not contribute much to such change in morphology. The AuNPLs, on the other hand, showed a consistent drop in the laser-induced heat output from day 1 to day 3. From the UV–vis data, it is clear that there was consistent broadening of peak from day 1 to day 2, and from day 2 to day 3. We hypothesize that the broadening of the peak was due to the aggregation of nanoparticles [39].
As multiple rounds of laser irradiation is becoming increasingly popular for PTT and extended drug release therapies, we screened both AuNSs and AuNPLs for their ability to generate heat upon multiple exposures to NIR irradiation [10,40,41,42,43]. Both the particles showed considerable drops in the maximum heat generated in each 20 min exposure. We believe that the drop in the heat output can be attributed to slight changes in the plasmonic absorption and aggregation caused by laser irradiation. To understand how surface modification can effect SERS enhancement, we conducted a series of experiments with MBA and BDT modified NPs. It is known that sharp edges of plasmonic nanoparticles contribute to SERS tremendously due to enhancement of the local electromagnetic field at the tips [44,45]. In line with this fact, the reduction in arm lengths in the case of AuNSs might have caused the slight drop in SERS signal when MBA was added, over the course of 20 min laser irradiation. This morphological change also contributed to a significant shift in the absorption λmax and a decrease in the absorption intensity at the 785 nm resonance wavelength, which is another reason for the overall decrease in SERS signal. Another contributing factor to the decrease in SERS intensity could have been photo-degradation of MBA, caused by localized heat generated by AuNSs upon laser irradiation [46]. On the other hand, we saw an increase in the intensity of SERS signal from BDT with time, despite the fact that the change in morphology of AuNSs contributed negatively to SERS intensity. We believe that this increase in the signal could have been due to increased aggregation facilitated by the dithiol structure of BDT [47,48]. In the case of AuNPLs, we have seen that the SERS signals of both MBA and BDT increased with laser exposure time; however, the increase in SERS was insignificant in the case of MBA but very significant in case of BDT. In both cases, the contributing factor for this increase in SERS signal could have been the generation of hotspots upon laser-induced aggregation [49]. Again, the increase in SERS signal was large in case of BDT because of increased aggregation facilitated by the dithiol structure of BDT [47,48]. Further, for both types of nanoparticle, the increase/decrease in SERS signal can also be attributed to both photophysical and chemical changes caused by the increase in temperature, as others have observed previously [50,51,52,53].

5. Conclusions

Based on our results, we can summarize that both AuNSs and AuNPLs have the strongest photothermal properties when used freshly after synthesis. This suggests that surface modification to stabilize the nanoparticles is necessary for long-term storage [54,55]. Both the particles can be irradiated multiple times to induce a photothermal affect, but it should be noted that the maximum heat output decreases with each exposure. Both particles were capable of being used for SERS transduction; however, researchers engaged in using the technique should be aware that changes in the intensity of the spectral signature of the analyte are likely to differ depending on the analyte and nanoparticle used during heating. This kind of information will allow researchers to effectively screen nanoparticle candidates for their photothermic and SERS properties and make informed decisions for their specific needs. However, researchers should bear in mind that the heat output and particle stability are dependent on factors such as laser power, concentration of nanoparticles, volume of the sample and the medium/matrices. Thus, the experiments must be designed to mimic in vivo conditions as much as possible.

Supplementary Materials

The following supporting information can be downloaded at: https://www.mdpi.com/article/10.3390/jnt3020007/s1. The accompanying supplementary material shows Figure S1: TEM images of freshly prepared AuNS before and after laser irradiation on three consecutive days; Figure S2: TEM images of freshly prepared AuNPL before and after laser irradiation on three consecutive days. The 3D designs for the spectrometer-to-cuvette coupler are available in the Thingiverse repository via the following link (https://www.thingiverse.com/thing:5277004, accessed on 16 May 2022).

Author Contributions

Conceptualization, S.R.C., N.B. and S.M.; methodology, S.R.C., N.B. and S.M.; software, N.B.; formal analysis, S.R.C., N.B., A.M.T.S.J. and S.J.; investigation, S.R.C., N.B. and A.M.T.S.J.; resources, S.M.; data curation, S.R.C.; writing—original draft preparation, S.R.C. and N.B.; writing—review and editing, S.M.; visualization, S.R.C., N.B., A.M.T.S.J. and S.M.; supervision, S.M.; project administration, S.R.C. and S.M.; funding acquisition, S.M. All authors have read and agreed to the published version of the manuscript.

Funding

This research was funded by S.M’s start-up funds provided by the Texas A&M Department of Biomedical Engineering, Texas A&M College of Engineering, and Texas A&M Engineering Experiment Station.

Institutional Review Board Statement

Not applicable.

Informed Consent Statement

Not applicable.

Data Availability Statement

The data presented in this study are available on reasonable request from the corresponding author.

Conflicts of Interest

The authors declare no conflict of interest.

References

  1. Govorov, A.O.; Richardson, H.H. Generating Heat with Metal Nanoparticles. Nano Today 2007, 2, 30–38. [Google Scholar] [CrossRef]
  2. Rashidi-Huyeh, M.; Palpant, B. Thermal Response of Nanocomposite Materials under Pulsed Laser Excitation. J. Appl. Phys. 2004, 96, 4475–4482. [Google Scholar] [CrossRef]
  3. Roper, D.K.; Ahn, W.; Hoepfner, M. Microscale Heat Transfer Transduced by Surface Plasmon Resonant Gold Nanoparticles. J. Phys. Chem. C 2007, 9, 3636–3641. [Google Scholar] [CrossRef] [Green Version]
  4. Plech, A.; Kotaidis, V.; Grésillon, S.; Dahmen, C.; Von Plessen, G. Laser-Induced Heating and Melting of Gold Nanoparticles Studied by Time-Resolved x-Ray Scattering. Phys. Rev. B—Condens. Matter Mater. Phys. 2004, 70, 195423. [Google Scholar] [CrossRef]
  5. Wilson, O.M.; Hu, X.; Cahill, D.G.; Braun, P.V. Colloidal Metal Particles as Probes of Nanoscale Thermal Transport in Fluids. Phys. Rev. B—Condens. Matter Mater. Phys. 2002, 66, 224301. [Google Scholar] [CrossRef] [Green Version]
  6. Hu, M.; Hartland, G.V. Heat Dissipation for Au Particles in Aqueous Solution: Relaxation Time versus Size. J. Phys. Chem. B 2002, 106, 7029–7033. [Google Scholar] [CrossRef]
  7. Nakamura, Y.; Mochida, A.; Choyke, P.L.; Kobayashi, H. Nanodrug Delivery: Is the Enhanced Permeability and Retention Effect Sufficient for Curing Cancer? Bioconjug. Chem. 2016, 27, 2225–2238. [Google Scholar] [CrossRef]
  8. Wu, J. The Enhanced Permeability and Retention (Epr) Effect: The Significance of the Concept and Methods to Enhance Its Application. J. Pers. Med. 2021, 11, 771. [Google Scholar] [CrossRef]
  9. Yuan, H.; Khoury, C.G.; Wilson, C.M.; Grant, G.A.; Bennett, A.J.; Vo-Dinh, T. In Vivo Particle Tracking and Photothermal Ablation Using Plasmon-Resonant Gold Nanostars. Nanomed. Nanotechnol. Biol. Med. 2012, 8, 1355–1363. [Google Scholar] [CrossRef] [Green Version]
  10. Liu, Y.; Ashton, J.R.; Moding, E.J.; Yuan, H.; Register, J.K.; Fales, A.M.; Choi, J.; Whitley, M.J.; Zhao, X.; Qi, Y.; et al. A Plasmonic Gold Nanostar Theranostic Probe for in Vivo Tumor Imaging and Photothermal Therapy. Theranostics 2015, 5, 946–960. [Google Scholar] [CrossRef] [Green Version]
  11. Kim, J.; Nam, S.H.; Lim, D.K.; Suh, Y.D. SERS-Based Particle Tracking and Molecular Imaging in Live Cells: Toward the Monitoring of Intracellular Dynamics. Nanoscale 2019, 11, 21724–21727. [Google Scholar] [CrossRef]
  12. Guo, H.; He, L.; Xing, B. Applications of Surface-Enhanced Raman Spectroscopy in the Analysis of Nanoparticles in the Environment. Environ. Sci. Nano 2017, 4, 2093–2107. [Google Scholar] [CrossRef]
  13. Bodelón, G.; Pastoriza-Santos, I. Recent Progress in Surface-Enhanced Raman Scattering for the Detection of Chemical Contaminants in Water. Front. Chem. 2020, 8, 478. [Google Scholar] [CrossRef]
  14. Chavva, S.R.; Pramanik, A.; Nellore, B.P.V.; Sinha, S.S.; Yust, B.; Kanchanapally, R.; Fan, Z.; Crouch, R.A.; Singh, A.K.; Neyland, B.; et al. Theranostic Graphene Oxide for Prostate Cancer Detection and Treatment. Part. Part. Syst. Charact. 2014, 31, 1252–1259. [Google Scholar] [CrossRef]
  15. Kneipp, K.; Kneipp, H.; Itzkan, I.; Dasari, R.R.; Feld, M.S. Ultrasensitive Chemical Analysis by Raman Spectroscopy. Chem. Rev. 1999, 99, 2957–2976. [Google Scholar] [CrossRef]
  16. Kelly, K.L.; Coronado, E.; Zhao, L.L.; Schatz, G.C. The Optical Properties of Metal Nanoparticles: The Influence of Size, Shape, and Dielectric Environment. J. Phys. Chem. B 2003, 107, 668–677. [Google Scholar] [CrossRef]
  17. West, C.L.; Doughty, A.C.V.; Liu, K.; Chen, W.R. Monitoring Tissue Temperature during Photothermal Therapy for Cancer. J. Bio-X Res. 2019, 2, 159–168. [Google Scholar] [CrossRef]
  18. Nicolson, F.; Jamieson, L.E.; Mabbott, S.; Plakas, K.; Shand, N.C.; Detty, M.R.; Graham, D.; Faulds, K. Multiplex Imaging of Live Breast Cancer Tumour Models through Tissue Using Handheld Surface Enhanced Spatially Offset Resonance Raman Spectroscopy (SESORRS). Chem. Commun. 2018, 54, 8530–8533. [Google Scholar] [CrossRef] [Green Version]
  19. Nicolson, F.; Jamieson, L.E.; Mabbott, S.; Plakas, K.; Shand, N.C.; Detty, M.R.; Graham, D.; Faulds, K. Through Tissue Imaging of a Live Breast Cancer Tumour Model Using Handheld Surface Enhanced Spatially Offset Resonance Raman Spectroscopy (SESORRS). Chem. Sci. 2018, 9, 3788–3792. [Google Scholar] [CrossRef] [Green Version]
  20. Richardson, H.H.; Carlson, M.T.; Tandler, P.J.; Hernandez, P.; Govorov, A.O. Experimental and Theoretical Studies of Light-to-Heat Conversion and Collective Heating Effects in Metal Nanoparticle Solutions. Nano Lett. 2009, 9, 1139–1146. [Google Scholar] [CrossRef] [Green Version]
  21. Richardson, H.H.; Hickman, Z.N.; Govorov, A.O.; Thomas, A.C.; Zhang, W.; Kordesch, M.E. Thermooptical Properties of Gold Nanoparticles Embedded in Ice: Characterization of Heat Generation and Melting. Nano Lett. 2006, 6, 783–788. [Google Scholar] [CrossRef] [PubMed]
  22. Maksimova, I.L.; Akchurin, G.G.; Khlebtsov, B.N.; Terentyuk, G.S.; Akchurin, G.G.; Ermolaev, I.A.; Skaptsov, A.A.; Soboleva, E.P.; Khlebtsov, N.G.; Tuchin, V.V. Near-Infrared Laser Photothermal Therapy of Cancer by Using Gold Nanoparticles: Computer Simulations and Experiment. Med. Laser Appl. 2007, 22, 199–206. [Google Scholar] [CrossRef]
  23. Hessel, C.M.; Pattani, V.P.; Rasch, M.; Panthani, M.G.; Koo, B.; Tunnell, J.W.; Korgel, B.A. Copper Selenide Nanocrystals for Photothermal Therapy. Nano Lett. 2011, 11, 2560–2566. [Google Scholar] [CrossRef] [Green Version]
  24. Baffou, G.; Bordacchini, I.; Baldi, A.; Quidant, R. Simple Experimental Procedures to Distinguish Photothermal from Hot-Carrier Processes in Plasmonics. Light Sci. Appl. 2020, 9, 108. [Google Scholar] [CrossRef]
  25. Yuan, H.; Khoury, C.G.; Hwang, H.; Wilson, C.M.; Grant, G.A.; Vo-Dinh, T. Gold Nanostars: Surfactant-Free Synthesis, 3D Modelling, and Two-Photon Photoluminescence Imaging. Nanotechnology 2012, 23, 75102. [Google Scholar] [CrossRef] [Green Version]
  26. Alfranca, G.; Artiga, Á.; Stepien, G.; Moros, M.; Mitchell, S.G.; De La Fuente, J.M. Gold Nanoprism-Nanorod Face off: Comparing the Heating Efficiency, Cellular Internalization and Thermoablation Capacity. Nanomedicine 2016, 11, 2903–2916. [Google Scholar] [CrossRef] [Green Version]
  27. Vega, M.M.; Bonifacio, A.; Lughi, V.; Marsi, S.; Carrato, S.; Sergo, V. Long-Term Stability of Surfactant-Free Gold Nanostars. J. Nanoparticle Res. 2014, 16, 2729. [Google Scholar] [CrossRef]
  28. Matsuo, N.; Muto, H.; Miyajima, K.; Mafuné, F. Single Laser Pulse Induced Aggregation of Gold Nanoparticles. Phys. Chem. Chem. Phys. 2007, 9, 6027–6031. [Google Scholar] [CrossRef]
  29. Mafuné, F.; Kohno, J.Y.; Takeda, Y.; Kondow, T. Dissociation and Aggregation of Gold Nanoparticles under Laser Irradiation. J. Phys. Chem. B 2001, 105, 9050–9056. [Google Scholar] [CrossRef]
  30. Xue, Y.; Li, X.; Li, H.; Zhang, W. Quantifying Thiol-Gold Interactions towards the Efficient Strength Control. Nat. Commun. 2014, 5, 4348. [Google Scholar] [CrossRef] [Green Version]
  31. Shen, M.; Duan, N.; Wu, S.; Zou, Y.; Wang, Z. Polydimethylsiloxane Gold Nanoparticle Composite Film as Structure for Aptamer-Based Detection of Vibrio Parahaemolyticus by Surface-Enhanced Raman Spectroscopy. Food Anal. Methods 2019, 12, 595–603. [Google Scholar] [CrossRef]
  32. Liu, Y.; Yang, L.; Shen, Y. Hydrothermal Synthesis of Gold Nanoplates and Their Structure-Dependent LSPR Properties. J. Mater. Res. 2018, 33, 2671–2679. [Google Scholar] [CrossRef]
  33. Rycenga, M.; Kim, M.H.; Camargo, P.H.C.; Cobley, C.; Li, Z.Y.; Xia, Y. Surface-Enhanced Raman Scattering: Comparison of Three Different Molecules on Single-Crystal Nanocubes and Nanospheres of Silver. J. Phys. Chem. A 2009, 113, 3932–3939. [Google Scholar] [CrossRef] [PubMed] [Green Version]
  34. Camacho De La Rosa, A.; Becerril, D.; Gómez-Farfán, G.; Esquivel-Sirvent, R. Time-Harmonic Photothermal Heating by Nanoparticles in a Non-Fourier Medium. J. Phys. Chem. C 2021, 125, 22856–22862. [Google Scholar] [CrossRef]
  35. Breitenborn, H.; Dong, J.; Piccoli, R.; Bruhacs, A.; Besteiro, L.V.; Skripka, A.; Wang, Z.M.; Govorov, A.O.; Razzari, L.; Vetrone, F.; et al. Quantifying the Photothermal Conversion Efficiency of Plasmonic Nanoparticles by Means of Terahertz Radiation. APL Photonics 2019, 4, 126106. [Google Scholar] [CrossRef]
  36. Wu, H.Y.; Liu, M.; Huang, M.H. Direct Synthesis of Branched Gold Nanocrystals and Their Transformation into Spherical Nanoparticles. J. Phys. Chem. B 2006, 110, 19291–19294. [Google Scholar] [CrossRef]
  37. Blazhynska, M.M.; Kyrychenko, A.; Kalugin, O.N. Molecular Dynamics Simulation of the Size-Dependent Morphological Stability of Cubic Shape Silver Nanoparticles. Mol. Simul. 2018, 44, 981–991. [Google Scholar] [CrossRef]
  38. Van De Broek, B.; Frederix, F.; Bonroy, K.; Jans, H.; Jans, K.; Borghs, G.; Maes, G. Shape-Controlled Synthesis of NIR Absorbing Branched Gold Nanoparticles and Morphology Stabilization with Alkanethiols. Nanotechnology 2011, 22, 15601. [Google Scholar] [CrossRef]
  39. Haiss, W.; Thanh, N.T.K.; Aveyard, J.; Fernig, D.G. Determination of Size and Concentration of Gold Nanoparticles from UV-Vis Spectra. Anal. Chem. 2007, 79, 4215–4221. [Google Scholar] [CrossRef]
  40. Zhu, D.; Zheng, Z.; Luo, G.; Suo, M.; Li, X.; Duo, Y.; Tang, B.Z. Single Injection and Multiple Treatments: An Injectable Nanozyme Hydrogel as AIEgen Reservoir and Release Controller for Efficient Tumor Therapy. Nano Today 2021, 37, 101091. [Google Scholar] [CrossRef]
  41. Moorcroft, S.C.T.; Roach, L.; Jayne, D.G.; Ong, Z.Y.; Ong, Z.Y.; Evans, S.D. Nanoparticle-Loaded Hydrogel for the Light-Activated Release and Photothermal Enhancement of Antimicrobial Peptides. ACS Appl. Mater. Interfaces 2020, 12, 24544–24554. [Google Scholar] [CrossRef] [PubMed]
  42. Higbee-Dempsey, E.; Amirshaghaghi, A.; Case, M.J.; Miller, J.; Busch, T.M.; Tsourkas, A. Indocyanine Green–Coated Gold Nanoclusters for Photoacoustic Imaging and Photothermal Therapy. Adv. Ther. 2019, 2, 1900088. [Google Scholar] [CrossRef] [PubMed]
  43. Ren, M.; Zhou, J.; Song, Z.; Mei, H.; Zhou, M.; Fu, Z.F.; Han, H.; Zhao, L. Aptamer and RVG Functionalized Gold Nanorods for Targeted Photothermal Therapy of Neurotropic Virus Infection in the Mouse Brain. Chem. Eng. J. 2021, 411, 128557. [Google Scholar] [CrossRef]
  44. Ding, S.; Ma, L.; Feng, J.; Chen, Y.; Yang, D.; Wang, Q. Surface-Roughness-Adjustable Au Nanorods with Strong Plasmon Absorption and Abundant Hotspots for Improved SERS and Photothermal Performances. Nano Res. 2022, 15, 2715–2721. [Google Scholar] [CrossRef]
  45. Puente, C.; Sánchez-Domínguez, M.; Brosseau, C.L.; López, I. Silver-Chitosan and Gold-Chitosan Substrates for Surface-Enhanced Raman Spectroscopy (SERS): Effect of Nanoparticle Morphology on SERS Performance. Mater. Chem. Phys. 2021, 260, 124107. [Google Scholar] [CrossRef]
  46. Sun, C.; Gao, M.; Zhang, X. Surface-Enhanced Raman Scattering (SERS) Imaging-Guided Real-Time Photothermal Ablation of Target Cancer Cells Using Polydopamine-Encapsulated Gold Nanorods as Multifunctional Agents. Anal. Bioanal. Chem. 2017, 409, 4915–4926. [Google Scholar] [CrossRef]
  47. Guarise, C.; Pasquato, L.; Scrimin, P. Reversible Aggregation/Deaggregation of Gold Nanoparticles Induced by a Cleavable Dithiol Linker. Langmuir 2005, 21, 5537–5541. [Google Scholar] [CrossRef]
  48. Ikbal, M.; Balogh, D.; Mervinetsky, E.; Sfez, R.; Yitzchaik, S. Light-Induced Aggregation of Gold Nanoparticles and Photoswitching of Silicon Surface Potential. J. Phys. Chem. C 2017, 121, 27176–27181. [Google Scholar] [CrossRef]
  49. Jung, S.; Nam, J.; Hwang, S.; Park, J.; Hur, J.; Im, K.; Park, N.; Kim, S. Theragnostic PH-Sensitive Gold Nanoparticles for the Selective Surface Enhanced Raman Scattering and Photothermal Cancer Therapy. Anal. Chem. 2013, 85, 7674–7681. [Google Scholar] [CrossRef]
  50. Xiao, C.; Chen, Z.; Zhang, D.; Xiao, W.; Qing, M.; Liu, X. Research on the Temperature Effect Characteristics of SERS Enhancement Factor. Optik 2016, 127, 9926–9931. [Google Scholar] [CrossRef]
  51. Rycenga, M.; Wang, Z.; Gordon, E.; Cobley, C.M.; Schwartz, A.G.; Lo, C.S.; Xia, Y. Probing the Photothermal Effect of Gold-Based Nanocages with Surface-Enhanced Raman Scattering (SERS). Angew. Chem.—Int. Ed. 2009, 48, 9924–9927. [Google Scholar] [CrossRef] [PubMed] [Green Version]
  52. King, M.D.; Khadka, S.; Craig, G.A.; Mason, M.D. Effect of Local Heating on the SERS Efficiency of Optically Trapped Prismatic Nanoparticles. J. Phys. Chem. C 2008, 112, 11751–11757. [Google Scholar] [CrossRef]
  53. Canpean, V.; Astilean, S. Temperature Effect on the SERS Signature of P-Aminothiophenol: A New Evidence for the Production of p,p’-Dimercaptoazobenzene on Metallic Nanostructures. Spectrochim. Acta—Part A Mol. Biomol. Spectrosc. 2012, 96, 862–867. [Google Scholar] [CrossRef] [PubMed]
  54. Hidehiro, K.; Motoyuki, I. Surface Modification and Characterization for Dispersion Stability of Inorganic Nanometer-Scaled Particles in Liquid Media. Sci. Technol. Adv. Mater. 2010, 11, 44304. [Google Scholar] [CrossRef]
  55. Guerrini, L.; Alvarez-Puebla, R.A.; Pazos-Perez, N. Surface Modifications of Nanoparticles for Stability in Biological Fluids. Materials 2018, 11, 1154. [Google Scholar] [CrossRef] [Green Version]
Scheme 1. Schematic representation of the designed setup for simultaneous photothermal conversion and SERS study. (AD) The dimensions of the 3D printed spectrometer-to-cuvette coupler that houses a sample holding quartz cuvette and a laser/Raman probe as shown in (E,F).
Jnt 03 00007 sch001
Figure 1. Characterization of gold nanostars (AuNS) and nanoplates (AuNPLs). (A) The absorption spectrum of AuNSs showing λmax at 785 nm. Insert shows a photograph of blue colored AuNSs (B) Transmission electron microscopy (TEM) image of AuNSs shows that the nanoparticles are star-shaped, featuring a ~50 nm core and between 10–15 arms calculated to be between 15 and 20 nm in length. (D) The absorption spectrum of AuNPLs showing two peaks at 535 and 1000 nm. (E) The TEM image of AuNPLs shows that the nanoparticles were triangular-plate-shaped and range from 50 to 135 nm in size. Plot showing the changes in temperature of different volumes of AuNS (C) and AuNPL (F) solutions upon exposure to a 785 nm laser for 20 min.
Jnt 03 00007 g001
Figure 2. Stability of gold nanostars (AuNSs) and nanoplates (AuNPLs). Plot showing the changes in temperature of 100 µL of (A) AuNS and (D) AuNPL solutions upon exposure to a 785 nm laser for 20 min taken on three consecutive days after synthesis. UV–vis spectra of (B) AuNSs and (E) AuNPLs taken on three consecutive days after synthesis. (C,F) The UV–vis spectra of AuNSs and AuNPLs taken before and after laser irradiation on three consecutive days after synthesis.
Jnt 03 00007 g002
Figure 3. Multiple heating and cooling cycles. (A,B) The changes in temperature when AuNSs and AuNPLs were exposed to three continuous cycles of laser-induced heating and cooling to room temperature. UV–vis spectra from (C) AuNSs and (D) AuNPLs taken before laser irradiation and after each heating and cooling cycle.
Jnt 03 00007 g003
Figure 4. SERS enhancement of AuNSs. (A) SERS spectrum of MBA on the AuNS surface. (B,C) Expanded MBA peaks at 1081 and 1591 cm−1. (D) Plot showing how the intensities of 1081 and 1591 cm−1 peaks change with laser irradiation time. (E) SERS spectrum of MBA on the AuNS surface. (F,G) Expanded BDT peaks at 1062 and 1572 cm−1. (H) Plot showing how the intensities of 1062 and 1572 cm−1 peaks changed with laser irradiation time.
Jnt 03 00007 g004
Figure 5. SERS enhancement by AuNPLs. (A) SERS spectrum of MBA on the AuNPL surface. (B,C) Expanded MBA peaks at 1081 and 1591 cm−1. (D) Plot showing how the intensities of 1081 and 1591 cm−1 peaks change with laser irradiation time. (E) SERS spectrum of MBA on the AuNS surface. (F,G) Expanded BDT peaks at 1062 and 1572 cm−1. (H) Plot showing how the intensities of 1062 and 1572 cm−1 peaks change with laser irradiation time.
Jnt 03 00007 g005
Publisher’s Note: MDPI stays neutral with regard to jurisdictional claims in published maps and institutional affiliations.

