Do Successful Researchers Reach the Self-Organized Critical Point?

Abstract
:1. Introduction
2. Socio-Statistical Inequality and Its Measures
Landau-Like Expansion of and Approximate Relation
3. Inequality Data Analysis from Google Scholar
4. Summary and Discussion
Author Contributions
Funding
Data Availability Statement
Acknowledgments
Conflicts of Interest
References
- de Oliveira, S.M.; de Oliveira, P.M.C.; Stauffer, D. Evolution, Money, War and Computers. Non-Traditional Applications of Computational Statistical Physics; B. G. Teubner Stuttgart: Leipzig, Germany; Springer Fachmedien Wiesbaden GmbH: Wiesbaden, Germany, 1999. [Google Scholar] [CrossRef]
- Chakrabarti, B.K.; Chakraborti, A.; Chatterjee, A. (Eds.) Econophysics and Sociophysics: Trends and Perspectives; Wiley-VCH Verlag GmbH and Co. KGaA: Weinheim, Germany, 2006. [Google Scholar] [CrossRef]
- Castelano, C.; Fortunato, S.; Loreto, V. Statistical physics of social dynamics. Rev. Mod. Phys. 2009, 81, 591–646. [Google Scholar] [CrossRef]
- Helbing, D. Quantitative Sociodynamics: Stochastic Methods & Models of Social Interaction Processes; Springer: Berlin/Heidelberg, Germany, 2010. [Google Scholar] [CrossRef]
- Galam, S. Sociophysics: A Physicist’s Modeling of Psycho-Political Phenomena; Springer Science+Business Media, LLC: New York, NY, USA, 2012. [Google Scholar] [CrossRef]
- Sen, P.; Chakrabarti, B.K. Sociophysics: An Introduction; Oxford University Press: Oxford, UK, 2014; Available online: https://archive.org/details/sociophysicsintr0000senp (accessed on 2 December 2023).
- Galam, S. Sociophysics: A review of Galam models. Int. J. Mod. Phys. C 2008, 19, 409–440. [Google Scholar] [CrossRef]
- Galam, S.; Cheon, T. Tipping points in opinion dynamics: A universal formula in five dimensions. Front. Phys. 2020, 8, 566580. [Google Scholar] [CrossRef]
- Biswas, S.; Chatterjee, A.; Sen, P.; Mukherjee, S.; Chakrabarti, B.K. Social dynamics through kinetic exchange: The BChS model. Front. Phys. 2023, 11, 1196745. [Google Scholar] [CrossRef]
- Filho, E.A.; Lima, F.W.; Alves, T.A.; Alves, G.A.; Plascak, J.A. Opinion dynamics systems via Biswas–Chatterjee–Sen model on Solomon networks. Physics 2023, 5, 873–882. [Google Scholar] [CrossRef]
- Challet, D.; Marsili, M.; Zhang, Y.-C. Minority Games. Interacting Agents in Financial Markets; Oxford University Press: Oxford, UK, 2005. [Google Scholar]
- Martin, L. Extending Kolkata Paise Restaurant problem to dynamic matching in mobility markets. Jr. Manag. Sci. 2019, 4, 1–34. [Google Scholar] [CrossRef]
- Harlalka, A.; Belmonte, A.; Griffin, C. Stability of dining clubs in the Kolkata Paise Restaurant Problem with and without cheating. Phys. A Stat. Mech. Appl. 2023, 620, 128767. [Google Scholar] [CrossRef]
- Ghosh, A.; Chakrabarti, B.K.; Ram, D.R.S.; Mitra, M.; Maiti, R.; Biswas, S.; Banerjee, S. Scaling behavior of the Hirsch index for failure avalanches, percolation clusters, and paper citations. Front. Phys. 2022, 10, 1019744. [Google Scholar] [CrossRef]
- Ghosh, A.; Chakrabarti, B.K. Scaling and kinetic exchange like behavior of Hirsch index and total citation distributions: Scopus-CiteScore data analysis. Phys. A Stat. Mech. Appl. 2023, 626, 129061. [Google Scholar] [CrossRef]
- Hirsch, J.E. An index to quantify an individual’s scientific research output. Proc. Natl. Acad. Sci. USA 2005, 102, 16569–16572. [Google Scholar] [CrossRef] [PubMed]
- Manna, S.S.; Biswas, S.; Chakrabarti, B.K. Near universal values of social inequality indices in self-organized critical models. Phys. A Stat. Mech. Appl. 2022, 596, 127121. [Google Scholar] [CrossRef]
- Ghosh, A.; Chakrabarti, B.K. Limiting value of the Kolkata index for social inequality and a possible social constant. Phys. A Stat. Appl. 2021, 573, 125944. [Google Scholar] [CrossRef]
- Banerjee, S.; Biswas, S.; Chakrabarti, B.K.; Challagundla, S.K.; Ghosh, A.; Guntaka, S.R.; Koganti, H.; Kondapalli, A.R.; Maiti, R.; Mitra, M.; et al. Evolutionary dynamics of social inequality and coincidence of Gini and Kolkata indices under unrestricted competition. Int. J. Mod. Phys. C 2023, 34, 2350048. [Google Scholar] [CrossRef]
- Gini, C. Measurement of inequality of incomes. Econ. J. 1921, 31, 124–126. [Google Scholar] [CrossRef]
- Ghosh, A.; Chattopadhyay, N.; Chakrabarti, B.K. Inequality in societies, academic institutions and science journals: Gini and k-indices. Phys. A Stat. Mech. Appl. 2014, 410, 30–34. [Google Scholar] [CrossRef]
- Banerjee, S.; Chakrabarti, B.K.; Mitra, M.; Mutuswami, S. Social inequality measures: The Kolkata index in comparison with other measures. Front. Phys. 2020, 8, 562182. [Google Scholar] [CrossRef]
- Bak, P.; Tang, C.; Wiesenfeld, K. Self-organized criticality: An explanation of the 1/f noise. Phys. Rev. Lett. 1987, 59, 381–384. [Google Scholar] [CrossRef]
- Manna, S.S. Two-state model of self-organized criticality. J. Phys. A Math. Gen. 1991, 24, L363–L370. [Google Scholar] [CrossRef]
- Yong, A. A critique of hirsch’s citation index: A combinatorial fermi problem. Not. Am. Math. Soc. 2014, 61, 1040–1050. [Google Scholar] [CrossRef]
- Dunbar, R.I.M. Neocortex size as a constraint on group size in primates. J. Hum. Evol. 1992, 22, 469–493. [Google Scholar] [CrossRef]
- Dunbar, R. How Many Friends Does One Person Need? Dunbar’s Number and Other Evolutionary Quirks; Faber and Faber Limited: London, UK, 2010; Available online: https://archive.org/details/howmanyfriendsdo0000dunb (accessed on 2 December 2023).
- Joseph, B.; Chakrabarti, B.K. Variation of Gini and Kolkata indices with saving propensity in the Kinetic Exchange model of wealth distribution: An analytical study. Phys. A Stat. Mech. Appl. 2022, 594, 127051. [Google Scholar] [CrossRef]
- Jovanovic, F.; Schinckus, C. Econophysics and Financial Economics: An Emerging Dialogue; Oxford University Press: Oxford, UK, 2017; p. 178. [Google Scholar] [CrossRef]
- Schinckus, C. When Physics Became Undisciplined: An Essay on Econophysics. Ph.D. Thesis, University of Cambridge, Cambridge, UK, 2018; pp. 15–16. [Google Scholar] [CrossRef]
- Dunbar, R.I.M. Coevolution of neocortical size, group size and language in humans. Behav. Brain Sci. 1993, 16, 681–735. [Google Scholar] [CrossRef]
- Yakovenko, V.M.; Rosser, J.B. Statistical mechanics of money, wealth, and income. Rev. Mod. Phys. 2009, 81, 1703–1725. [Google Scholar] [CrossRef]
- Ioannidis, J.P.A. September 2022 Data-Update for “Updated Science-Wide Author Databases of Standardized Citation Indicators”. Version 5; Elsevier Data Repository, Elsevier Inc.: New York, NY, USA, 2022. [Google Scholar] [CrossRef]
- Katz, J.S.; Hicks, D. How much is a collaboration worth? A calibrated bibliometric model. Sociometrics 1997, 40, 541–554. [Google Scholar] [CrossRef]
- Arnaboldi, V.; Dunbar, R.I.M.; Passarella, A.; Conti, M. Analysis of co-authorship ego networks. In Advances in Network Science. Proceedings of the 12th International Conference and School, NetSci-X 2016, Wroclaw, Poland, 11–13 January 2016; Wierzbicki, A., Brandes, U., Schweitzer, F., Pedreschi, D., Eds.; Springer International Publishing: Cham, Switzerland, 2016; pp. 82–96. [Google Scholar]


| Inequality Indices: Hirsch (h), Gini (g), Kolkata (k) | Line | ||||||||
|---|---|---|---|---|---|---|---|---|---|
| Researcher Name | Award/Prize/ Known for | (overall) | (overall) | (yearly-av.) | (yearly-av.) | Crossed Near 0.82? | |||
| H Amano | NP(P) | 2161 | 57,281 | 106 | 0.84 | 0.83 | 0.72 ± 0.13 | 0.78 ± 0.06 | Yes |
| B Josephson | NP(P) | 127 | 11,685 | 22 | 0.94 | 0.92 | 0.71 ± 0.13 | 0.79 ± 0.06 | No |
| AB McDonald | NP(P) | 437 | 25,111 | 53 | 0.91 | 0.88 | 0.80 ± 0.06 | 0.83 ± 0.04 | Yes |
| J Frank | NP(C) | 686 | 50,518 | 116 | 0.77 | 0.80 | 0.72 ± 0.07 | 0.78 ± 0.04 | No |
| R Henderson | NP(C) | 267 | 31,822 | 65 | 0.85 | 0.84 | 0.78 ± 0.06 | 0.81 ± 0.04 | Yes |
| JP Sauvage | NP(C) | 655 | 61,572 | 114 | 0.70 | 0.76 | 0.70 ± 0.07 | 0.77 ± 0.04 | Marginally |
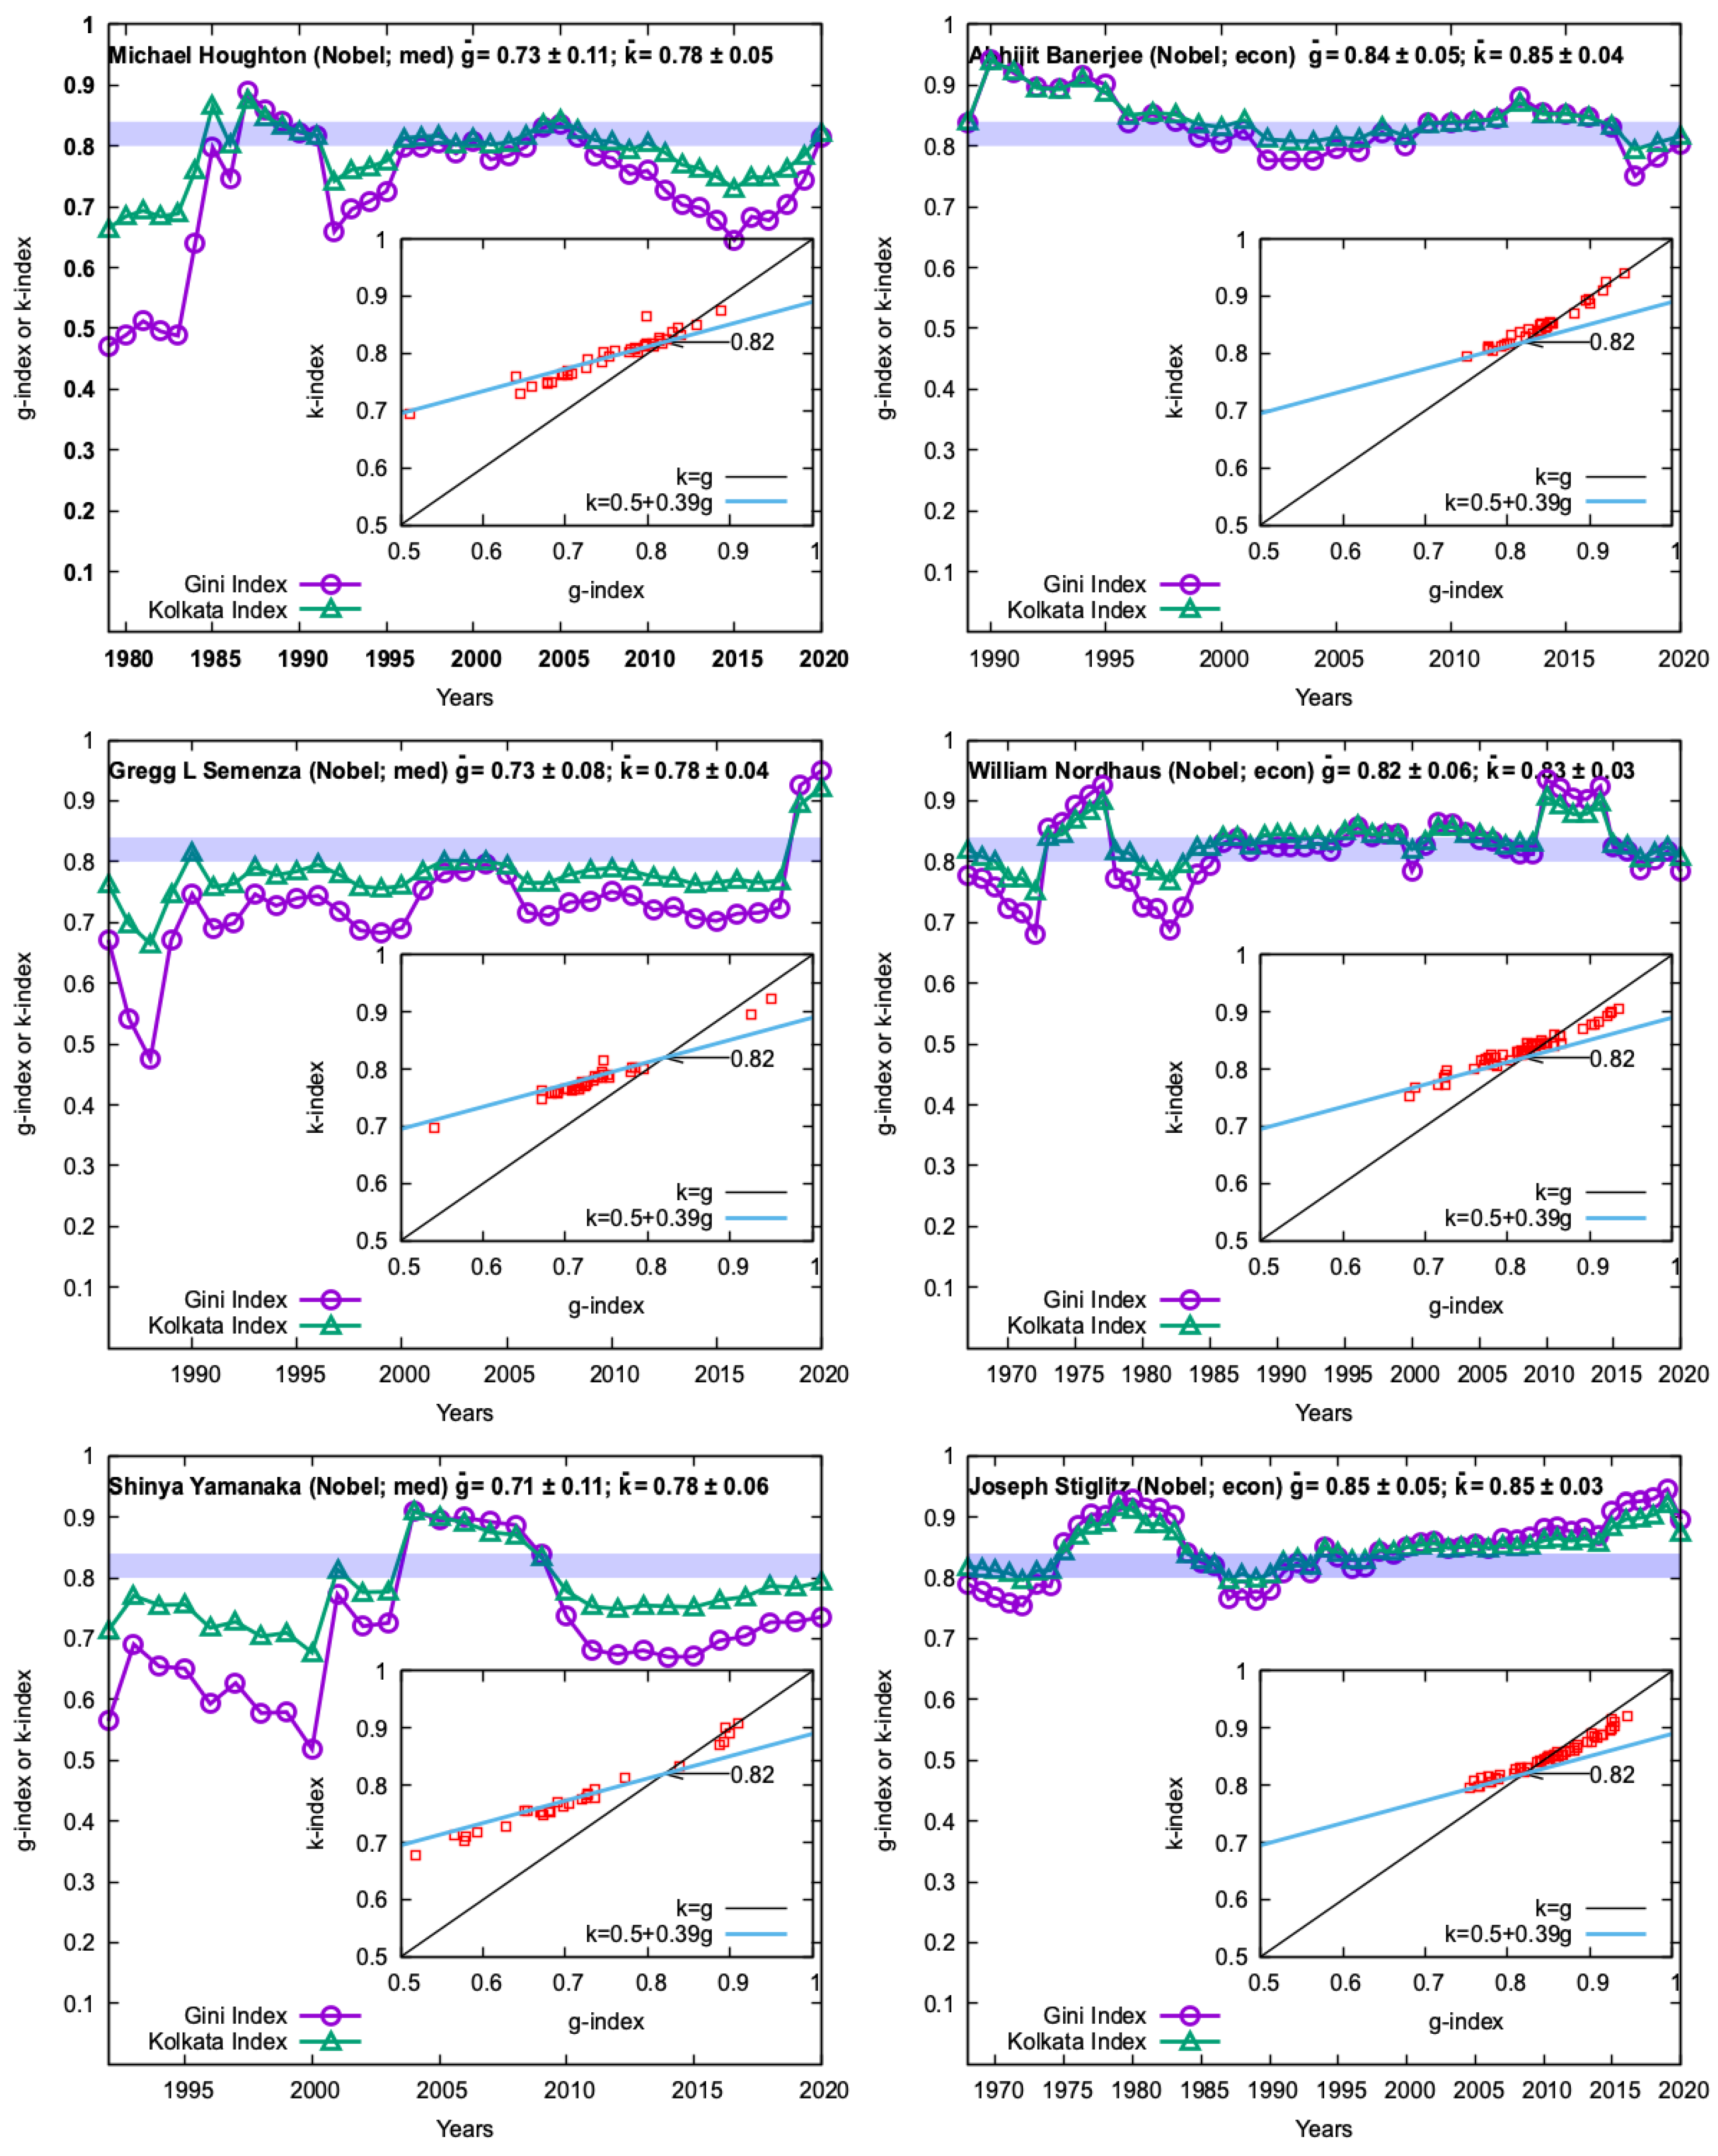
| M Houghton | NP(M) | 529 | 59,029 | 102 | 0.85 | 0.84 | 0.73 ± 0.11 | 0.78 ± 0.05 | Yes |
| GL Semenza | NP(M) | 682 | 192,246 | 196 | 0.80 | 0.81 | 0.73 ± 0.08 | 0.78 ± 0.04 | Yes |
| S Yamanaka | NP(M) | 345 | 124,106 | 125 | 0.85 | 0.84 | 0.71 ± 0.11 | 0.78 ± 0.06 | Yes |
| A Banerjee | NP(E) | 524 | 79,076 | 106 | 0.86 | 0.86 | 0.84 ± 0.05 | 0.85 ± 0.04 | Yes |
| W Nordhaus | NP(E) | 647 | 101,219 | 124 | 0.87 | 0.86 | 0.82 ± 0.06 | 0.83 ± 0.03 | Yes |
| J Stiglitz | NP(E) | 2408 | 364,237 | 235 | 0.89 | 0.87 | 0.85 ± 0.05 | 0.85 ± 0.03 | Yes |
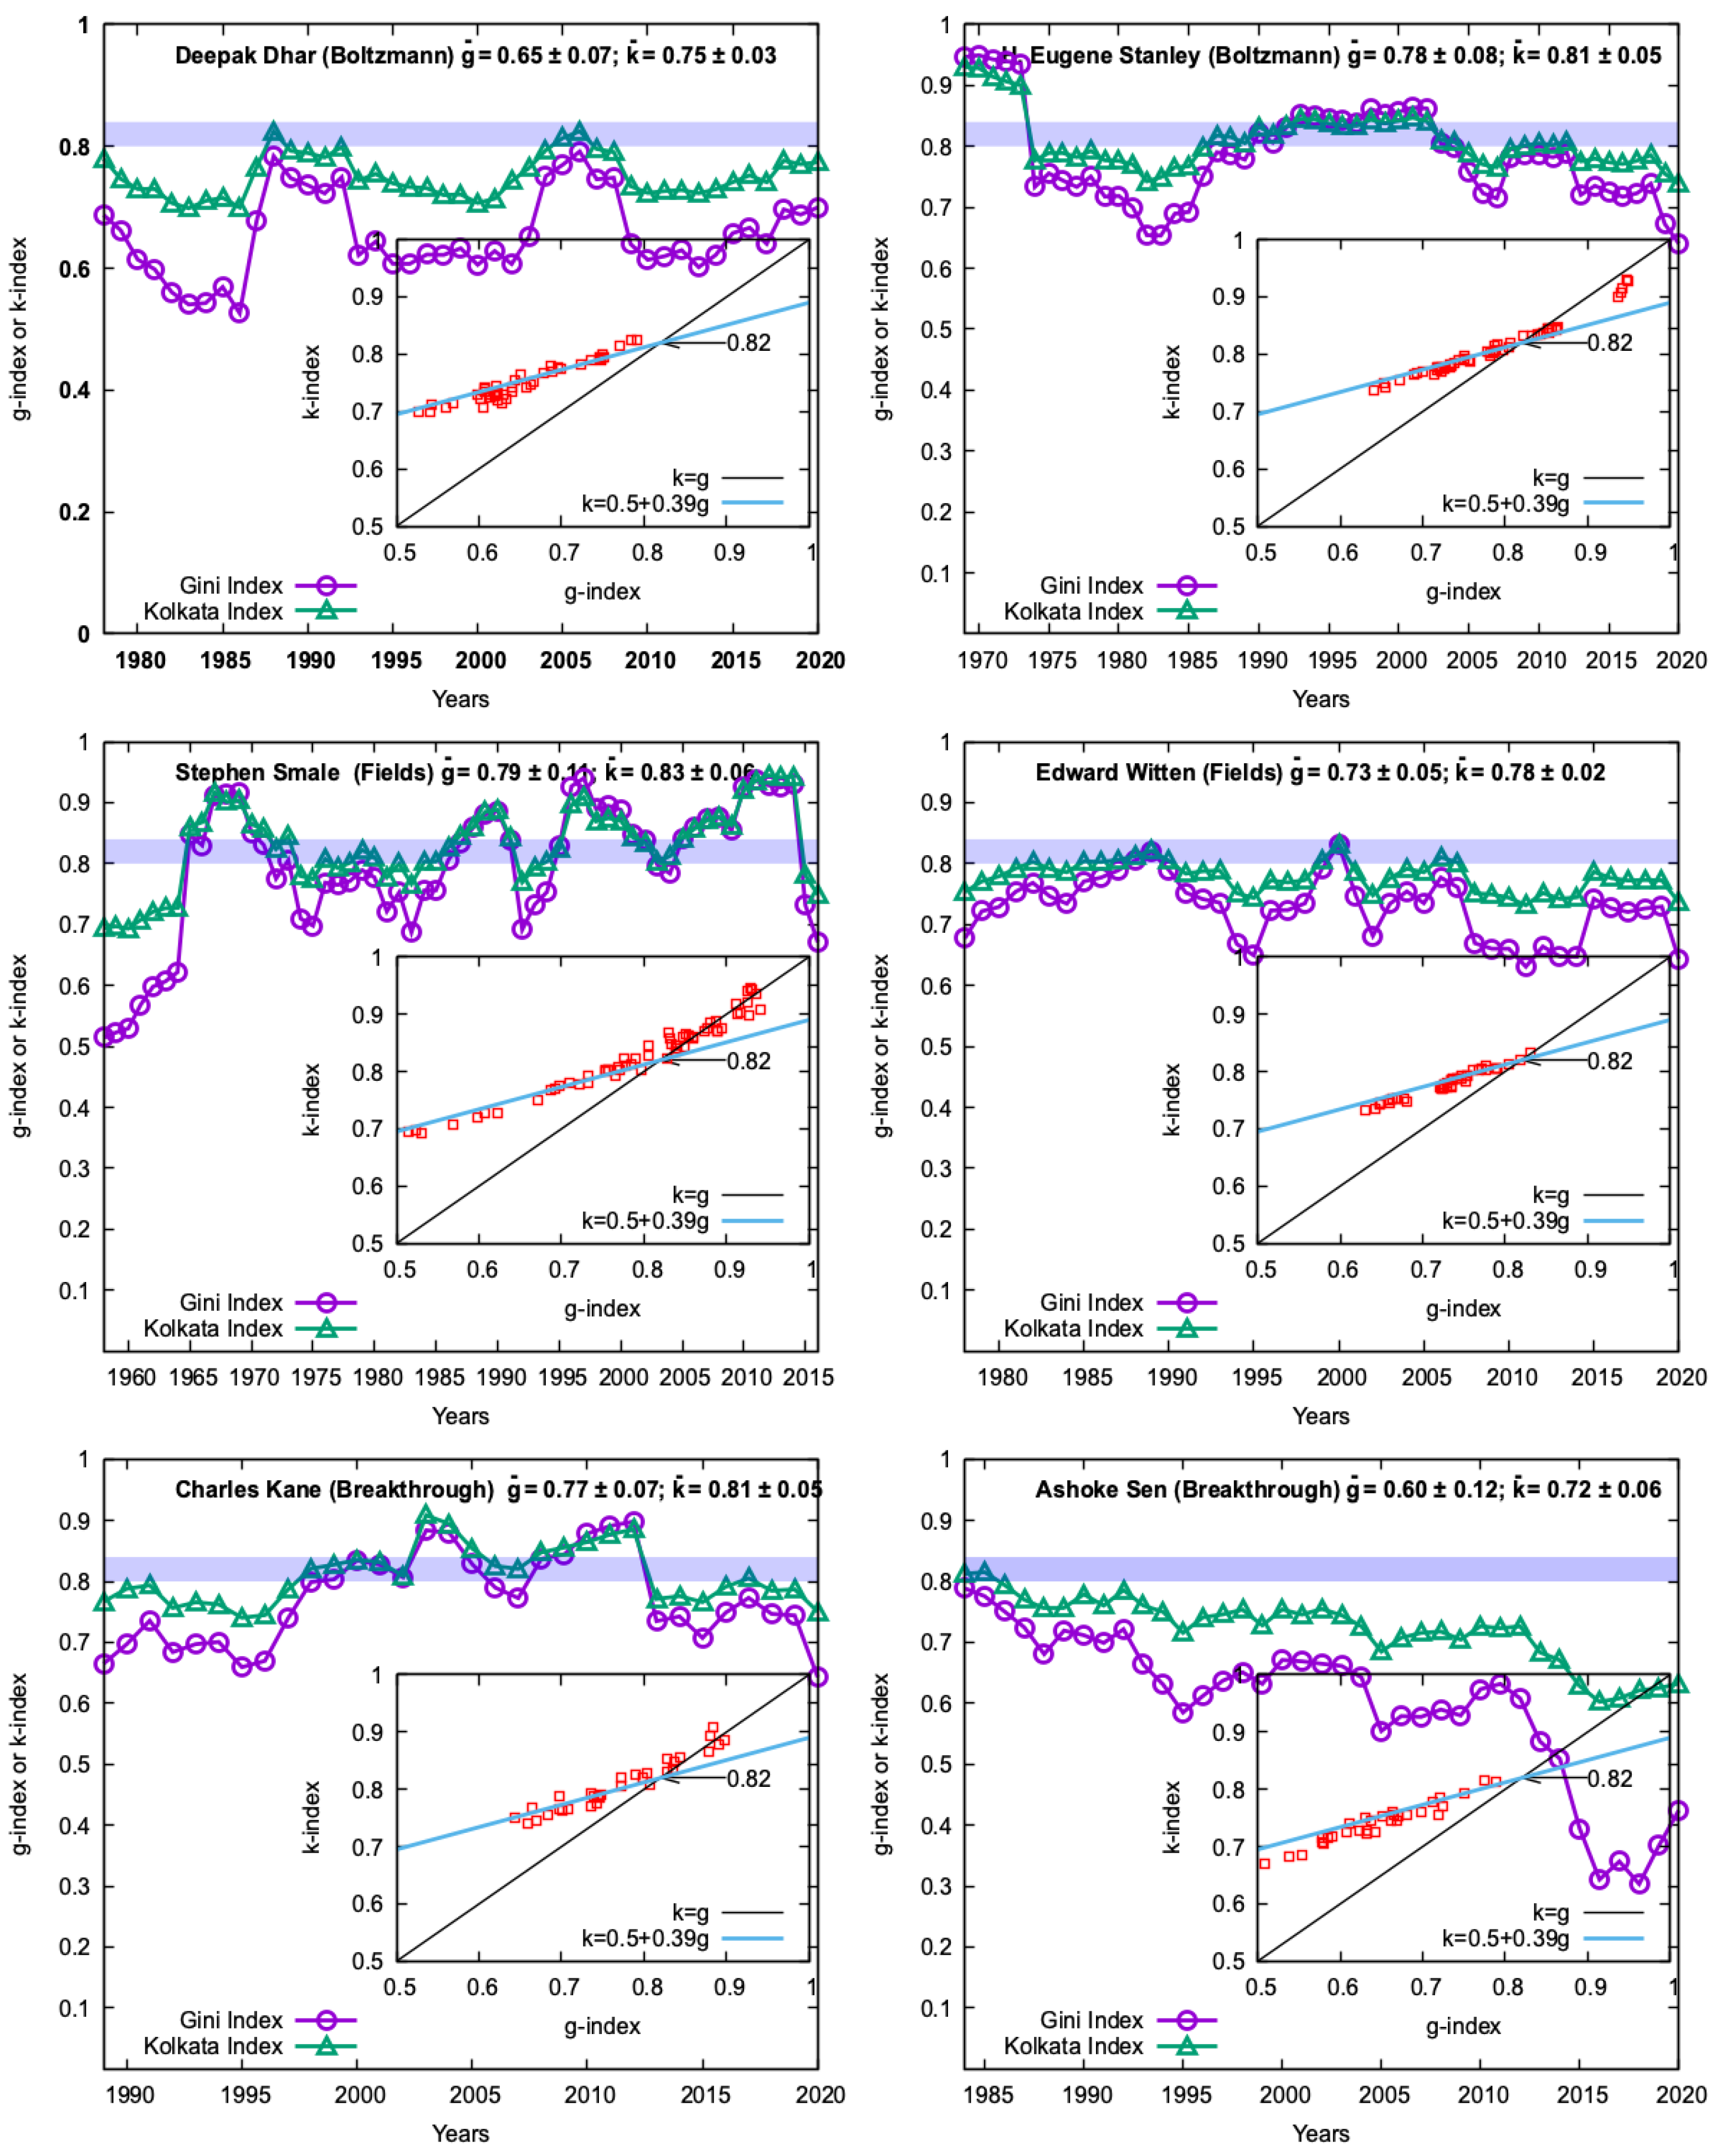
| D Dhar | BA | 209 | 8299 | 44 | 0.76 | 0.80 | 0.65 ± 0.07 | 0.75 ± 0.03 | No |
| HE Stanley | BA, FEP | 2070 | 225,169 | 204 | 0.83 | 0.83 | 0.78 ± 0.08 | 0.81 ± 0.05 | Yes |
| S Smale | FM | 346 | 48,084 | 85 | 0.87 | 0.85 | 0.79 ± 0.11 | 0.83 ± 0.06 | Yes |
| E Witten | FM, BP(P) | 620 | 242,911 | 206 | 0.79 | 0.81 | 0.73 ± 0.05 | 0.78 ± 0.02 | Marginally |
| C Kane | BP(P) | 189 | 80,714 | 75 | 0.88 | 0.87 | 0.77 ± 0.07 | 0.81 ± 0.05 | Yes |
| A Sen | BP(P) | 401 | 37,065 | 103 | 0.69 | 0.76 | 0.60 ± 0.12 | 0.72 ± 0.06 | No |
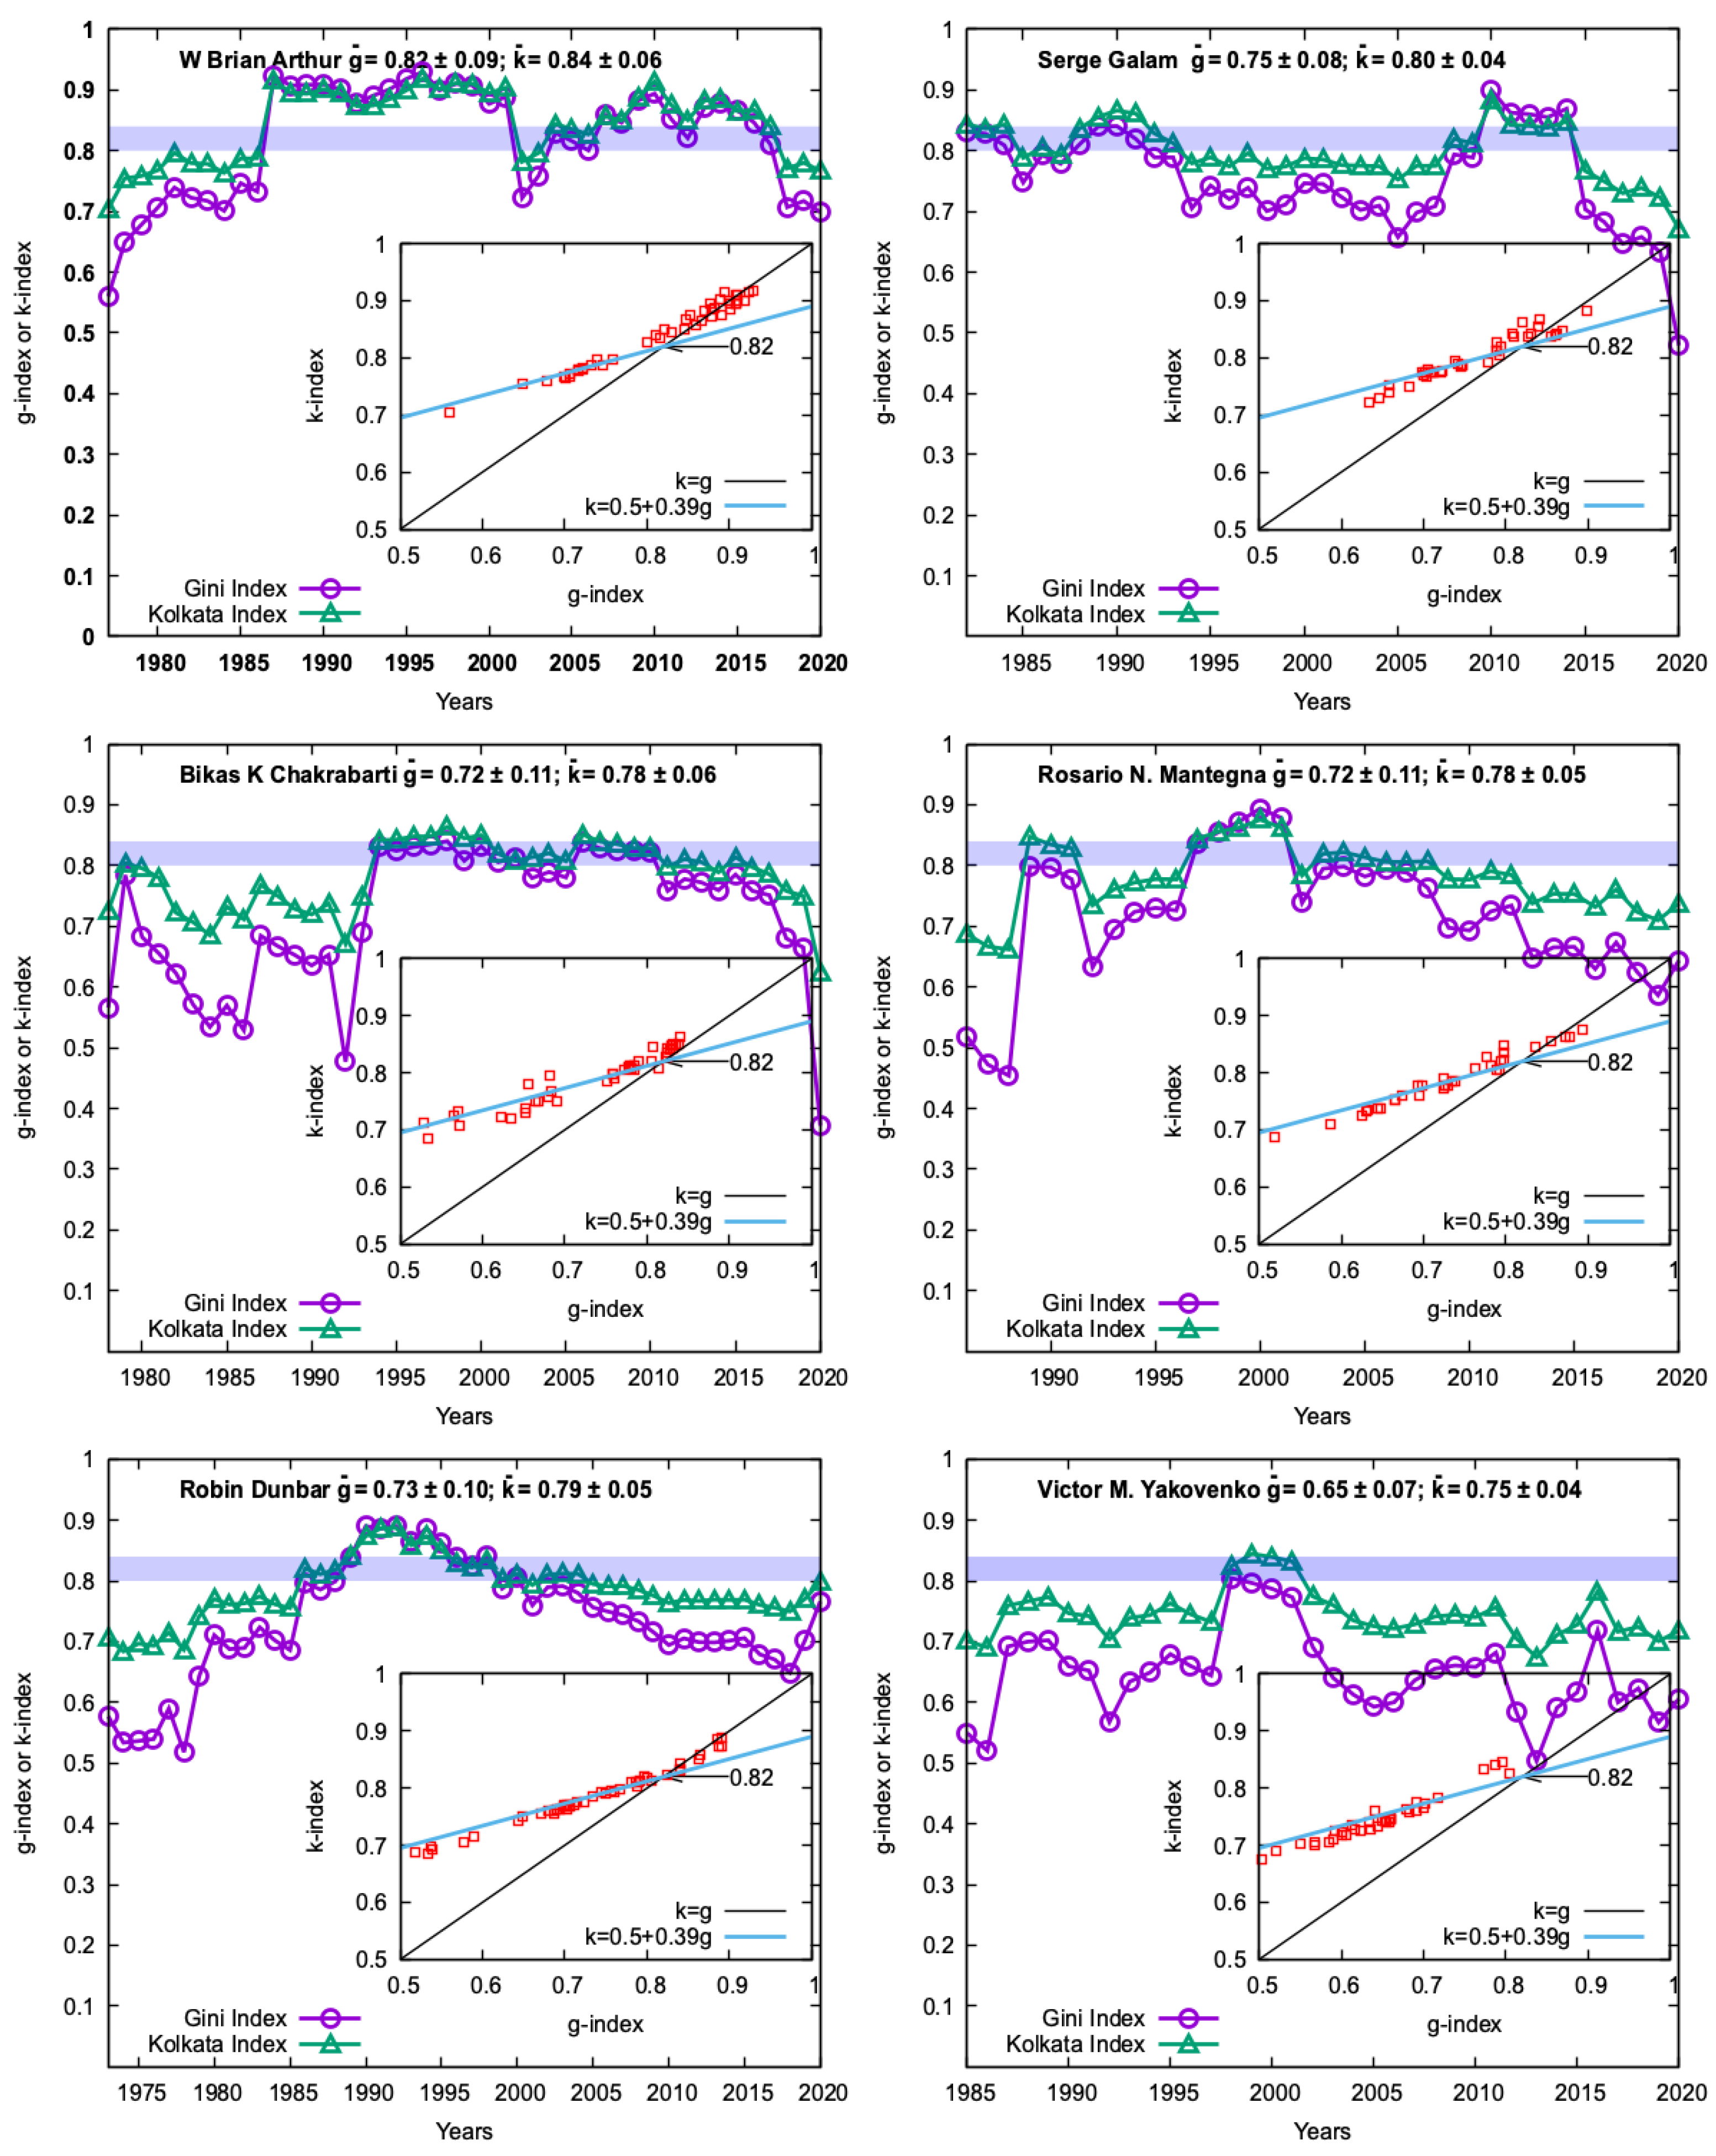
| WB Arthur | EFBP | 196 | 52,545 | 56 | 0.91 | 0.89 | 0.82 ± 0.09 | 0.84 ± 0.06 | Yes |
| BK Chakrabarti | FEP | 390 | 12,596 | 47 | 0.81 | 0.82 | 0.72 ± 0.11 | 0.78 ± 0.06 | Marginally |
| RIM Dunbar | DN | 857 | 85,486 | 141 | 0.79 | 0.81 | 0.73 ± 0.10 | 0.79 ± 0.05 | Yes |
| S Galam | FSP | 252 | 8828 | 42 | 0.81 | 0.83 | 0.75 ± 0.08 | 0.80 ± 0.04 | Yes |
| RN Mantegna | FEP | 259 | 28,561 | 68 | 0.84 | 0.84 | 0.72 ± 0.11 | 0.78 ± 0.05 | Yes |
| VM Yakovenko | PKEM | 171 | 9076 | 44 | 0.73 | 0.78 | 0.65 ± 0.07 | 0.75 ± 0.04 | No |
| M Graetzel | SCS-1 | 2282 | 463,382 | 295 | 0.82 | 0.82 | 0.78 ± 0.07 | 0.81 ± 0.04 | Yes |
| RC Kessler | SCS-4 | 1829 | 523,835 | 328 | 0.83 | 0.83 | 0.77 ± 0.04 | 0.80 ± 0.02 | Yes |
| ZL Wang | SCS-3 | 2954 | 394,080 | 299 | 0.71 | 0.77 | 0.69 ± 0.10 | 0.76 ± 0.05 | Yes |
| I Fofana | SCS-119997 | 353 | 5759 | 39 | 0.73 | 0.78 | 0.68 ± 0.03 | 0.76 ± 0.02 | No |
| N Tomoyuki | SCS-119993 | 304 | 9073 | 51 | 0.75 | 0.79 | 0.64 ± 0.09 | 0.74 ± 0.04 | No |
| U Sennur | SCS-119994 | 455 | 18,987 | 63 | 0.73 | 0.78 | 0.68 ± 0.05 | 0.76 ± 0.03 | No |
| Researcher Name | Award/ Known for | h | SOC Level Achieved (Table 1) | Comments | |||||
|---|---|---|---|---|---|---|---|---|---|
| H Amano | NP(P) | 2161 | 57,281 | 3154 | 106 | 27 | 119 | Yes | Out of the eighteen researchers with , one failed in achieving the SOC level (crossing the line in Figure 2, Figure 3, Figure 4, Figure 5 and Figure 6; see Table 1). therefore indicates SOC level for the researcher with more than 94% success rate. |
| B Josephson | NP(P) | 127 | 11,685 | 6554 | 22 | 92 | 71 | No | |
| AB McDonald | NP(P) | 437 | 25,111 | 5375 | 53 | 57 | 94 | Yes | |
| J Frank | NP(C) | 686 | 50,518 | 2299 | 116 | 74 | 31 | No | |
| R Henderson | NP(C) | 267 | 31,822 | 3681 | 65 | 119 | 31 | Yes | |
| JP Sauvage | NP(C) | 655 | 61,572 | 1805 | 114 | 94 | 19 | Marginally | |
| M Houghton | NP(M) | 529 | 59,029 | 9952 | 102 | 112 | 89 | Yes | |
| GL Semenza | NP(M) | 682 | 192,246 | 12,229 | 196 | 282 | 43 | Yes | |
| S Yamanaka | NP(M) | 345 | 124,106 | 30,735 | 125 | 360 | 85 | Yes | |
| A Banerjee | NP(E) | 524 | 79,076 | 9254 | 106 | 151 | 61 | Yes | |
| W Nordhaus | NP(E) | 647 | 101,219 | 19,605 | 124 | 156 | 125 | Yes | |
| J Stiglitz | NP(E) | 2408 | 364,237 | 23,844 | 235 | 151 | 158 | Yes | |
| D Dhar | BA | 209 | 8299 | 1182 | 44 | 40 | 30 | No | |
| HE Stanley | BA, FEP | 2070 | 225,169 | 14,348 | 204 | 109 | 132 | Yes | |
| S Smale | FM | 346 | 48,084 | 7912 | 85 | 139 | 57 | Yes | |
| E Witten | FM, BP(P) | 620 | 242,911 | 14,380 | 206 | 392 | 37 | Marginally | |
| C Kane | BP(P) | 189 | 80,714 | 19,504 | 75 | 427 | 46 | Yes | |
| A Sen | BP(P) | 401 | 37,065 | 1443 | 103 | 92 | 16 | No | |
| WB Arthur | EFBP | 196 | 52,545 | 15,227 | 56 | 268 | 57 | Yes | |
| BK Chakrabarti | FEP | 390 | 12,596 | 730 | 47 | 32 | 23 | Marginally | |
| RIM Dunbar | DN | 857 | 85,486 | 5312 | 141 | 100 | 53 | Yes | |
| S Galam | FSP | 252 | 8828 | 653 | 42 | 35 | 19 | Yes | |
| RN Mantegna | FEP | 259 | 28,561 | 5796 | 68 | 110 | 53 | Yes | |
| VM Yakovenko | PKEM | 171 | 9076 | 920 | 44 | 53 | 17 | No | |
| M Graetzel | SCS-1 | 2282 | 463,382 | 35,789 | 295 | 203 | 176 | Yes | |
| RC Kessler | SCS-4 | 1829 | 523,835 | 35,079 | 328 | 286 | 122 | Yes | |
| ZL Wang | SCS-3 | 2954 | 394,080 | 8120 | 299 | 133 | 61 | Yes | |
| I Fofana | SCS-119997 | 353 | 5759 | 333 | 39 | 16 | 20 | No | |
| N Tomoyuki | SCS-119993 | 304 | 9073 | 467 | 51 | 30 | 16 | No | |
| U Sennur | SCS-119994 | 455 | 18,987 | 1198 | 63 | 42 | 29 | No |
Disclaimer/Publisher’s Note: The statements, opinions and data contained in all publications are solely those of the individual author(s) and contributor(s) and not of MDPI and/or the editor(s). MDPI and/or the editor(s) disclaim responsibility for any injury to people or property resulting from any ideas, methods, instructions or products referred to in the content. |
© 2023 by the authors. Licensee MDPI, Basel, Switzerland. This article is an open access article distributed under the terms and conditions of the Creative Commons Attribution (CC BY) license (https://creativecommons.org/licenses/by/4.0/).
Share and Cite
Ghosh, A.; Chakrabarti, B.K. Do Successful Researchers Reach the Self-Organized Critical Point? Physics 2024, 6, 46-59. https://doi.org/10.3390/physics6010004
Ghosh A, Chakrabarti BK. Do Successful Researchers Reach the Self-Organized Critical Point? Physics. 2024; 6(1):46-59. https://doi.org/10.3390/physics6010004
Chicago/Turabian StyleGhosh, Asim, and Bikas K. Chakrabarti. 2024. "Do Successful Researchers Reach the Self-Organized Critical Point?" Physics 6, no. 1: 46-59. https://doi.org/10.3390/physics6010004