
Improved Detection and Response via Optimized Alerts: Usability Study


Center for Cybersecurity Research and Analysis, Capitol Technology University, 11301 Springfield Road, Laurel, MD 20708, USA
J. Cybersecur. Priv. 2022, 2(2), 379-401; https://doi.org/10.3390/jcp2020020
Submission received: 5 April 2022
/
Revised: 21 May 2022
/
Accepted: 25 May 2022
/
Published: 31 May 2022
(This article belongs to the Collection Machine Learning and Data Analytics for Cyber Security)
Abstract
:Security analysts working in the modern threat landscape face excessive events and alerts, a high volume of false-positive alerts, significant time constraints, innovative adversaries, and a staggering volume of unstructured data. Organizations thus risk data breach, loss of valuable human resources, reputational damage, and impact to revenue when excessive security alert volume and a lack of fidelity degrade detection services. This study examined tactics to reduce security data fatigue, increase detection accuracy, and enhance security analysts’ experience using security alert output generated via data science and machine learning models. The research determined if security analysts utilizing this security alert data perceive a statistically significant difference in usability between security alert output that is visualized versus that which is text-based. Security analysts benefit two-fold: the efficiency of results derived at scale via ML models, with the additional benefit of quality alert results derived from these same models. This quantitative, quasi-experimental, explanatory study conveys survey research performed to understand security analysts’ perceptions via the Technology Acceptance Model. The population studied was security analysts working in a defender capacity, analyzing security monitoring data and alerts. The more specific sample was security analysts and managers in Security Operation Center (SOC), Digital Forensic and Incident Response (DFIR), Detection and Response Team (DART), and Threat Intelligence (TI) roles. Data analysis indicated a significant difference in security analysts’ perception of usability in favor of visualized alert output over text alert output. The study’s results showed how organizations can more effectively combat external threats by emphasizing visual rather than textual alerts.
1. Introduction
The compounding challenges for security analysts working in the modern threat landscape include excessive events and alerts, a high volume of false-positive alerts, the treatment of time as a critical resource, threat actor innovation, and a high volume of unstructured data [1]. One solution is the use of data science and machine learning to relieve pressure for security analysts, where models and automation can be deployed to ingest and prioritize security event and threat data. Further, machine learning can enable pattern and trend analysis to better identify adversarial behavior [1]. Most importantly, the way the results of these data science (DS) and machine learning (ML) methods are presented to security analysts can have a direct impact on performance and efficacy. Interactive security data visualization via the likes of graph and timeline visualization are methods known to be of benefit to security analysts [2]. This study specifically considered security analysts’ perceptions of usability and ease of use of security alert output from DS and ML methods. This study’s findings provide useful data points for organizations seeking to improve the working experience for security analysts with the hope of increasing organizational safety and security.
1.1. Background
Many organizations must deal with a high volume of security alert and event data derived from security devices and detective capabilities [3]. A Dimensional Research study found that these organizations face a large burden due to alert overload, where 99% of security professionals surveyed acknowledge that high volumes of security alerts are problematic. The Dimensional Research study also determined that primary challenges include many minor problems or noise (68%), wasted time chasing false positives (66%), team members who feel overwhelmed (50%), excessive time spent triaging alerts (47%), and an increased overall security risk (42%) [4]. Bartos found that one of the core issues an analyst faces is the large number of alerts generated by numerous cybersecurity tools. When considering additional data received via various sharing and collaborative platforms, the issue is further amplified. As such, for security analysts, data prioritization and summarization are essential to reduce the excessive amount of information presented. Prioritization is consistently identified as a core tenet of security incident handling in numerous studies [5]. A lack of prioritization can result in security data fatigue, analyst burnout, and ineffective or insufficient incident response [6]. Organizations face increased risk and liability if their capacity to respond to high-fidelity detections is reduced by excessive alert noise [7]. As indicated by FireEye data, in organizations that receive 17,000 alerts weekly, more than 51% of the alerts are false positives, and only 4% of the alerts are thoroughly investigated [8]. More narrowly, Seals found that 80% of organizations who receive 500 or more severe/critical alerts per day investigate fewer than 1% of them [9]. The issue is exacerbated by data volumes. Oltsik reported that, as part of security operations, 38% of organizations collect, process, and analyze more than 10 terabytes monthly. As of 2017, 28% of organizations collect, process, and analyze substantially more data than in the two years prior, while another 49% of organizations collect, process, and analyze somewhat more data today than the two years prior [10]. A recent survey of 50 SOC professionals, Managed Security Services Providers (MSSP), and Managed Detection and Response (MDR) providers evaluated the state of incident response within SOCs and found numerous causes for concern. Nearly half of respondents reported a false-positive rate of 50% or higher, which was so high because security information and event management (SIEM) and incident response tools are improperly tuned and alert on known-good activity, resulting in investigations with a high rate of false positives [11]. Respondents reported that when their SOC had too many alerts for analysts to process, 38% either turn off high-volume alerting features or hire more analysts. Additionally, respondents felt that their main job responsibility was less to analyze and remediate security threats and more to reduce alert investigation time or the volume of alerts [11]. All of this results in significant security analyst turnover. A large majority (80%) of respondents indicated that their SOC had experienced at least 10% analyst turnover. The largest pool of respondents (45%) indicated a 10–25% turnover, and more than a third (35%) lost a quarter or more of their SOC analysts in less than 12 months [11]. Slatman’s research focused on data-driven security operations and security analytics to investigate and address the investigation challenges security analysts face [3]. The challenges are categorized into four main categories: an increasingly complex IT environment, limited business alignment, ever-evolving adversaries and corresponding attacks, and inadequate resources with respect to people and technology. The concept of data-driven security operations is the seminal starting point for this research. A focus on data-driven security operations addresses and enables discussions related to challenges that security analysts face, as well as opportunities for improvements such as applied machine learning and visualization.
The specific business problem is: organizations risk data breach, loss of valuable human resources, reputation, and revenue due to excessive security alert volume and a lack of fidelity in security event data. A Cloud Security Alliance survey illuminated the problem further. With an average of two billion transactions a month at the average enterprise, IT security professionals say that 40.4% of alerts received lack actionable intelligence to investigate, and another 31.9% report ignored alerts due to false positives [12]. Chickowski stated that as much as 25% of a security analyst’s time is spent processing false-positive alerts, commonly erroneous security alerts or false indicators of confidence, before focusing on true-positive findings. Every hour an analyst spends on the job, 15 min are wasted on false positives, leading the typical organization to waste between 286 and 424 h per week on false positives [13]. In addressing this problem, improving the efficiency of security analysts can be helpful. In a survey that examines specific areas where high- and low-performing SOCs diverge, with a focus on the challenges both groups struggle with, Ponemon found key data points in the differences and similarities between the two classes of SOCs. Even highly effective SOCs suffer from job-related stress affecting security analysts, where 55% of respondents from high-performing SOCs rated their stress level as a 9 or 10 on a 10-point scale. Twenty-two percent of survey respondents rated their SOC as ineffective, citing a lack of visibility into the attack surface and a lack of timely remediation as the core factors [14]. To examine opportunities for increased efficiencies, this study used a survey questionnaire based on the Technology Acceptance Model (TAM) to test for statistical differences between security analysts’ responses regarding perception and usability of text-based alert output (TAO) versus visualized alert output (VAO).
1.2. Research Purpose
The purpose of this quantitative, quasi-experimental, explanatory study was to determine if security analysts utilizing this security alert data perceive a statistically significant difference in usability between security alert output that is visualized versus that which is text-based. Prior studies have found that study participants using a visual analytics (VA) interface performed better than those on the text-oriented interface and that the visual analytic interface yielded performance that was quicker and more accurate than the text interface [15]. This study built on these findings to assess security analysts’ preferences specific to both usability and ease of use of security alert output from various models and security data analytics.
1.3. Research Question
The research question that guided the proposed study was:
- Is there a difference in the level of acceptance of security alert output between those with a preference for visual alert outputs (VAO) and those with a preference for text alert outputs (TAO), with VAO and TAO generated via data science/machine learning methods, as predicted by the TAM?
Sub-questions were:
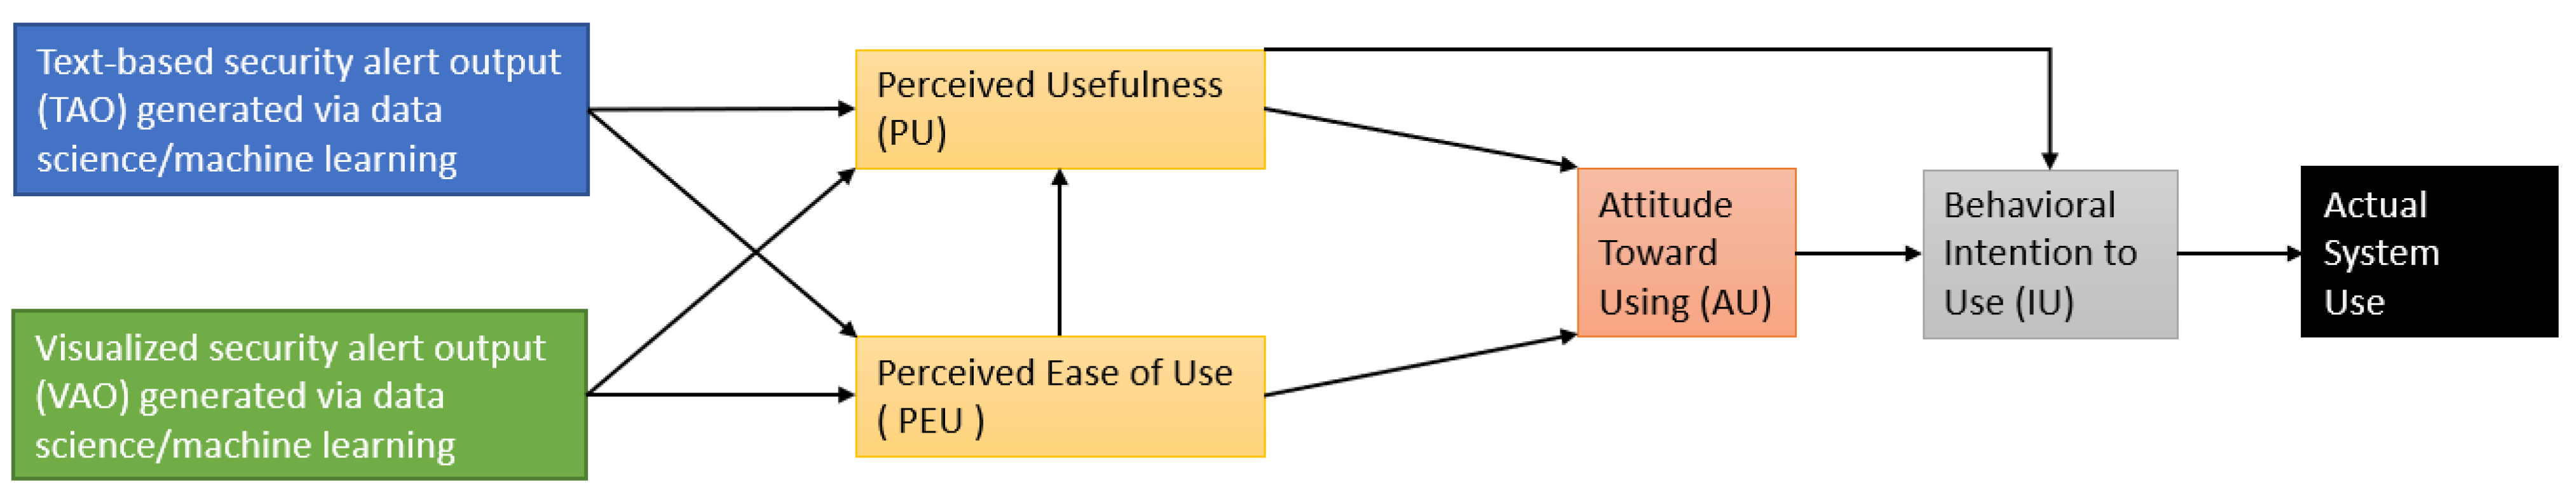
- Does the adoption of VAO have a significant impact on the four individual TAM components: perceived usefulness (PU), perceived ease of use (PEU), attitude toward using (AU), and intention to use (IU)?
- Does the adoption of TAO have a significant impact on the four individual TAM components: perceived usefulness (PU), perceived ease of use (PEU), attitude toward using (AU), and intention to use (IU)?
1.4. Theoretical Framework
Figure 1 illustrates the theoretical framework by which the research question will be explored.
The TAM asserts that the behavioral intention to use a system is determined by PU and PEU [16]. PU is the extent to which a person believes that using the system will enhance his or her job performance, while perceived ease of use (PEU) is the extent to which a person believes that using the system will be effortless [17]. TAM additionally asserts that the effects of external variables (system characteristics) on intention to use are mediated by PU and PEU. Finally, PU is also influenced by PEU because the easier a system is to use, the more useful it can be [18].
Section 1 provided an overview of the study with the context and background for the research problem and statement, as well as purpose and significance. Section 2 includes details of the methodological approach used by the researcher for this study. Section 3 offers background on the research results and provides a description of the sample as well as hypothesis testing, inclusive of a summary and data analysis. Section 4 concludes the study with a discussion of the research results, coupled with its conclusions, limitations, implications for practice, and recommendations for future research.
2. Material and Methods
2.1. Design and Methodology
The researcher utilized a quantitative, quasi-experimental, explanatory methodology for the envisioned study, using survey research to better understand related phenomena. Quantitative methods are used to measure behavior, knowledge, opinions, or attitudes in business research, as is pertinent when the Technology Acceptance Model is the utilized instrument. An online survey was used to test for statistically significant differences in the level of acceptance of alert output between those choosing VAO in all scenarios and those having some or complete preference for TAO, with VAO and TAO being generated via data science/machine learning methods as predicted by the TAM. In pursuit of further insights relevant to potential differences in security analysts’ perceptions of visual and text analytics, the research question that guides this study was:
- RQ1: Is there a difference in the level of acceptance of security alert output between those with a preference for VAO and those with a preference for TAO, with VAO and TAO generated via data science/machine learning methods, as predicted by the TAM?
- ○
- Sub-questions were:
- ▪
- SQ1: Does the adoption of VAO have a significant impact on the four individual TAM components: PU, PEU, AU, and IU?
- ▪
- SQ2: Does the adoption of TAO have a significant impact on the four individual TAM components: PU, PEU, AU, and IU?
The online survey utilized for this study incorporated visual images as part of the questioning process, to create clarity and compel answering in full. To further minimize non-response, and to prepare data for testing, the following were included:
- As part of this quantitative, quasi-experimental, explanatory study, the online survey for data collection utilized a 7-point Likert scale.
- The online survey questionnaire and survey experiment, given that this research was specifically focused on visualization versus text, incorporated visual elements, which lead to a higher response quality and generate interesting interaction effects [19].
The target population for this study was global information security analysts working in a blue team (defender) capacity, analyzing security monitoring data and alerts. This is an appropriate population given the significant challenges the industry faces due to the sheer scale of security data, and the resulting difficulties security analysts face seeking precise and efficient answers to alert-related questions. Participants were solicited from this population via social media, including LinkedIn and Twitter, mailing lists, industry partners, and contact lists. The researcher ensured prequalification with a job and role-specific question. Survey participants who did not meet population requirements were disqualified.
Data analysis for this study utilized a mixed ANOVA because it enables efficiency while keeping variability low [20]. In other words, given the within-subjects component of this study where all participants undertook the same three scenarios, a mixed ANOVA allowed for partitioning out variability as a function of individual differences. Additionally, a mixed ANOVA provided the benefit of efficiency while keeping variability low, thereby keeping the validity of the results higher yet allowing for smaller subject groups [20].
2.2. Data Collection
SurveyMonkey was utilized to create survey hyperlinks for social media and e-mail dissemination to prospective participants and solicit their responses. The criteria for inclusion in the sample were as follows: (a) information security analysts, (b) working in a security monitoring role as part of a security operations center or fusion center, and (c) responding to security alert data. Participants were prequalified to meet these criteria and those who did not were excluded. Any survey results received from participants determined not to meet the criteria for inclusion were eliminated. Participants were required to provide their informed consent before responding to the survey. An opt-out option was available for participants while taking the survey.
The defined variables, related constructs, applied scale, and data types for each variable are listed in Table 1.
2.3. Instrumentation
The TAM implies that positive perception of usefulness and ease of use (perceived usability) influence intention to use, which in turn influences the actual likelihood of use [21]. Original construction of the TAM for measurement of PU and PEU resulted in a 12-item instrument that was shown to be reliable [22]. It consisted of the two factors PU and PEU and was correlated with intentions to use and self-report usage [17]. This quantitative, quasi-experimental, explanatory study utilized a 7-point Likert scale to assess the level of acceptance and the perceived ease of use and perceived usefulness of alerts in three scenarios (the within-subjects independent variable). The preferred alert output (VAO or TAO) forms the basis of the between-subjects independent variable. Likert-type scale response anchors set the range between agreement and disagreement; as an example, 1 indicated strong disagreement and 7 indicated strong agreement with a statement.
2.4. Hypotheses
The following research questions served to determine if a relationship exists between the dependent variable, which is the level of acceptance of alert output, and the two independent variables, which are Session (1, 2, or 3) and Maximum Visual. Maximum Visual had two levels: one where VAO was chosen for all scenarios and one where TAO was chosen for some or all scenarios.
- Is there a difference in the level of acceptance of alert outputs between those preferring VAO in all scenarios and those preferring TAO in some or all scenarios, as predicted by the TAM?
- ○
- Sub-questions:
- ▪
- Does the adoption of VAO have a significant impact on the four individual TAM components: PU, PEU, AU, and IU?
- ▪
- Does the adoption of TAO have a significant impact on the four individual TAM components: PU, PEU, AU, and IU?
The following research hypotheses explored the research questions for a relationship between the independent variable of Maximum Visual (a preference for VAO in all scenarios versus a preference for TAO in some or all scenarios), and the dependent variable, which is the level of acceptance of alert outputs. The dependent variable is specific to security analysts’ perception of machine learning (ML)- and data science (DS)-generated alert output.
The null and alternative hypotheses are stated as:
H1:
There is no significant difference in the level of acceptance of alert outputs between those preferring VAO in all scenarios and those preferring TAO in some or all scenarios, as predicted by the TAM.
H2:
There is a significant difference in the level of acceptance of alert outputs between those preferring VAO in all scenarios and those preferring TAO in some or all scenarios, as predicted by the TAM.
Omnibus tests are applicable to these hypotheses, where H1: R-squared is equal to 0 and H2: R-squared is greater than 0. Table 2 highlights the relationship between the research questions and the hypotheses.
2.5. Data Analysis
The data collected for analysis from the results of a SurveyMonkey online questionnaire were processed with IBM SPSS software and R, a programming language for statistical computing, machine learning, and graphics. The analysis focused on data exploration of dependent and independent variables. The main dependent variable was the level of acceptance of the security alert output and was based on the four individual TAM components: PU, PEU, AU, and IU. Each component was derived from responses to groups of Likert-style statements (scored 1 through to 7, with 7 representing the most favorable response). PU and PEU had a total of six statements, and AU and IU had three statements. The level of acceptance of the alert output was calculated by adding all 18 scores together, with a maximum score of 126 and a minimum score of 18. The sub-scores for PU, PEU, AU, and IU represent secondary dependent variables. The within-subjects independent variable was scenario. It had three levels, Scenario 1, Scenario 2, and Scenario 3, with all participants being subject to all scenarios. The between-subjects independent variable was Maximum Visual. This had two levels: a preference for VAO in all three scenarios, and a preference for TAO in at least one of the scenarios.
Both parametric and non-parametric tests were performed. Mixed ANOVA tested whether the level of acceptance of alert outputs is influenced by the within-subjects variable Scenario and the between-subjects variable Maximum Visual. Mixed ANOVA was also repeated for the four sub-scales of PU, PEU, AS, and IU, with Bonferroni corrections for multiple comparisons. Additionally, a Mann–Whitney U test was performed, comparing the level of acceptance of alert outputs of the two levels of Maximum Visual, and a Friedman test compared the level of acceptance across the three scenarios.
2.6. Validity and Reliability
The study’s dependent variables are derived from the TAM. As such, the validity and reliability of TAM are paramount. Davis developed and validated scales for two variables, perceived usefulness (PU) and perceived ease of use (PEU), as basic determinants of user acceptance. Davis used definitions for PU and PEU to develop scale markers pretested for content validity, as well as tested for reliability and construct validity [17].
Davis found that the PU scale attained a Cronbach’s alpha reliability of 0.97 for both systems tested, while PEU achieved a reliability of 0.86 for one system tested and 0.93 for the other. Upon pooling observations for the two systems, Cronbach’s alpha was found to be 0.97 for usefulness and 0.91 for ease of use [17].
Davis tested for convergent and discriminant validity using multi-trait–multimethod (MTMM) analysis, where the MTMM matrix contained the intercorrelations of items (methods) applied to the two different test systems (traits). Davis indicated that convergent validity determines if items making up a scale behave as if measuring a common underlying construct. Convergent validity is demonstrated when items that measure the same trait correlate highly with one another [17]. Davis’ study found that 90 mono-trait–hetero-method correlations for PU were all significant at the 0.05 level, while for PEU, 86 out of 90, or 95.56%, of the mono-trait–hetero-method correlations were significant. These data support the convergent validity of TAM’s two scales: PU and PEU [17].
3. Results
3.1. Background
The specific business problem that oriented this study is: organizations risk data breach, loss of valuable human resources, reputation, and revenue due to excessive security alert volume and a lack of fidelity in security event data. To determine means of support for security analysts experiencing these security event-specific challenges, the study asked if there is a difference in the level of acceptance of security alert outputs between those preferring VAO in all scenarios, and those preferring TAO in some or all scenarios, as predicted by the TAM. The dependent variable was participants’ level of acceptance of security alert output: the within-subjects independent variable is Scenario, and the between-subjects independent variable is Maximum Visual (preference for VAO in all scenarios versus preference for TAO in some or all scenarios). SurveyMonkey was utilized to deliver an online survey to participants, from which the collected data were analyzed. The survey queried a population of cybersecurity analysts and managers in SOC, DFIR, DART, and TI roles, targeted for participation via social media. Twitter and LinkedIn were utilized. The LinkedIn campaign included the use of Linked Helper to create a list of potential participants whose profiles matched the desired role descriptions from connections in the researcher’s network of 1411 connections as of this writing. The final filtered list resulted in 234 potential participants to whom an invitation to participate was sent. A 7-point Likert scale survey queried participants regarding their perspectives on perceived ease of use and perceived usefulness of ML and DS-generated alert output across three scenarios with TAO and VAO results [23]. Of 119 respondents, 24 disqualified themselves and 95 identified themselves as qualified, 81 of whom completed all 3 scenarios.
3.2. Description of the Sample
Data collected from cybersecurity analysts and managers in SOC, DFIR, DART, and TI roles resulted in 95 qualified respondents. A total of 95 qualified respondents is in keeping with estimates of an appropriate sample size. Where 2018 Bureau of Labor Statistics data indicate that there were 112,300 information security analysts, and this specific target population is a subpopulation of the larger 112,300 security analysts, if 5% of the larger 112,300 population is applied, a target population of 5615 is appropriate [24]. With a 95% confidence level, and 10% confidence interval (margin of error), then the ideal sample size is 94 [25]. Of the 95 respondents to this survey, 81 completed all 3 scenarios presented in the survey. The 14 incomplete survey results were discarded, resulting in an 85.20% completion rate. The 14 incomplete surveys were discarded due to missing data and to enable analysis of two complete and distinct groups, namely respondents who chose VAO across all three scenarios, and those who selected a mix of VAO and TAO or all TAO results across all three scenarios. The 81 respondents, as broken down into their 2 distinct groups, are defined under the Maximum Visual variable (Vis_max), where the participants who said yes to VAO in all three scenarios were labeled Yes (N = 59), and the participants who selected a mix of VAO and TAO or all TAO results across all three scenarios were labeled No (N = 22).
3.3. Hypothesis Testing
Given that the data collected for this study did not meet the standard for normality, both parametric and non-parametric tests were performed. Parametric statistical procedures depend on assumptions about the shape of the distribution (assume a normal distribution) in the population and the form or parameters (means and standard deviations) of the assumed distribution [26]. On the other hand, nonparametric statistical procedures depend on few or no assumptions about the shape (normality) or parameters of the population distribution from which the sample was taken [26]. Nonparametric tests include the Mann–Whitney U test and the Friedman test. Parametric tests can be conducted via a mixed analysis of variance (ANOVA) with a Bonferroni correction. The mixed ANOVA tests included an approach for treatment of the dependent variable: security analysts’ level of acceptance of the alert output. First, mixed ANOVA was performed across the TAM-based questionnaire categories, namely perceived usefulness (PU), perceived ease of use (PEU), attitude towards using (AU), and intent to use (IU), where the scores for all sub-scales were summed. Second, mixed ANOVA was performed on each sub-scale. For the individual sub-scales, statistical significance was set at α/4, or 0.0125.
3.4. Validating Assumptions
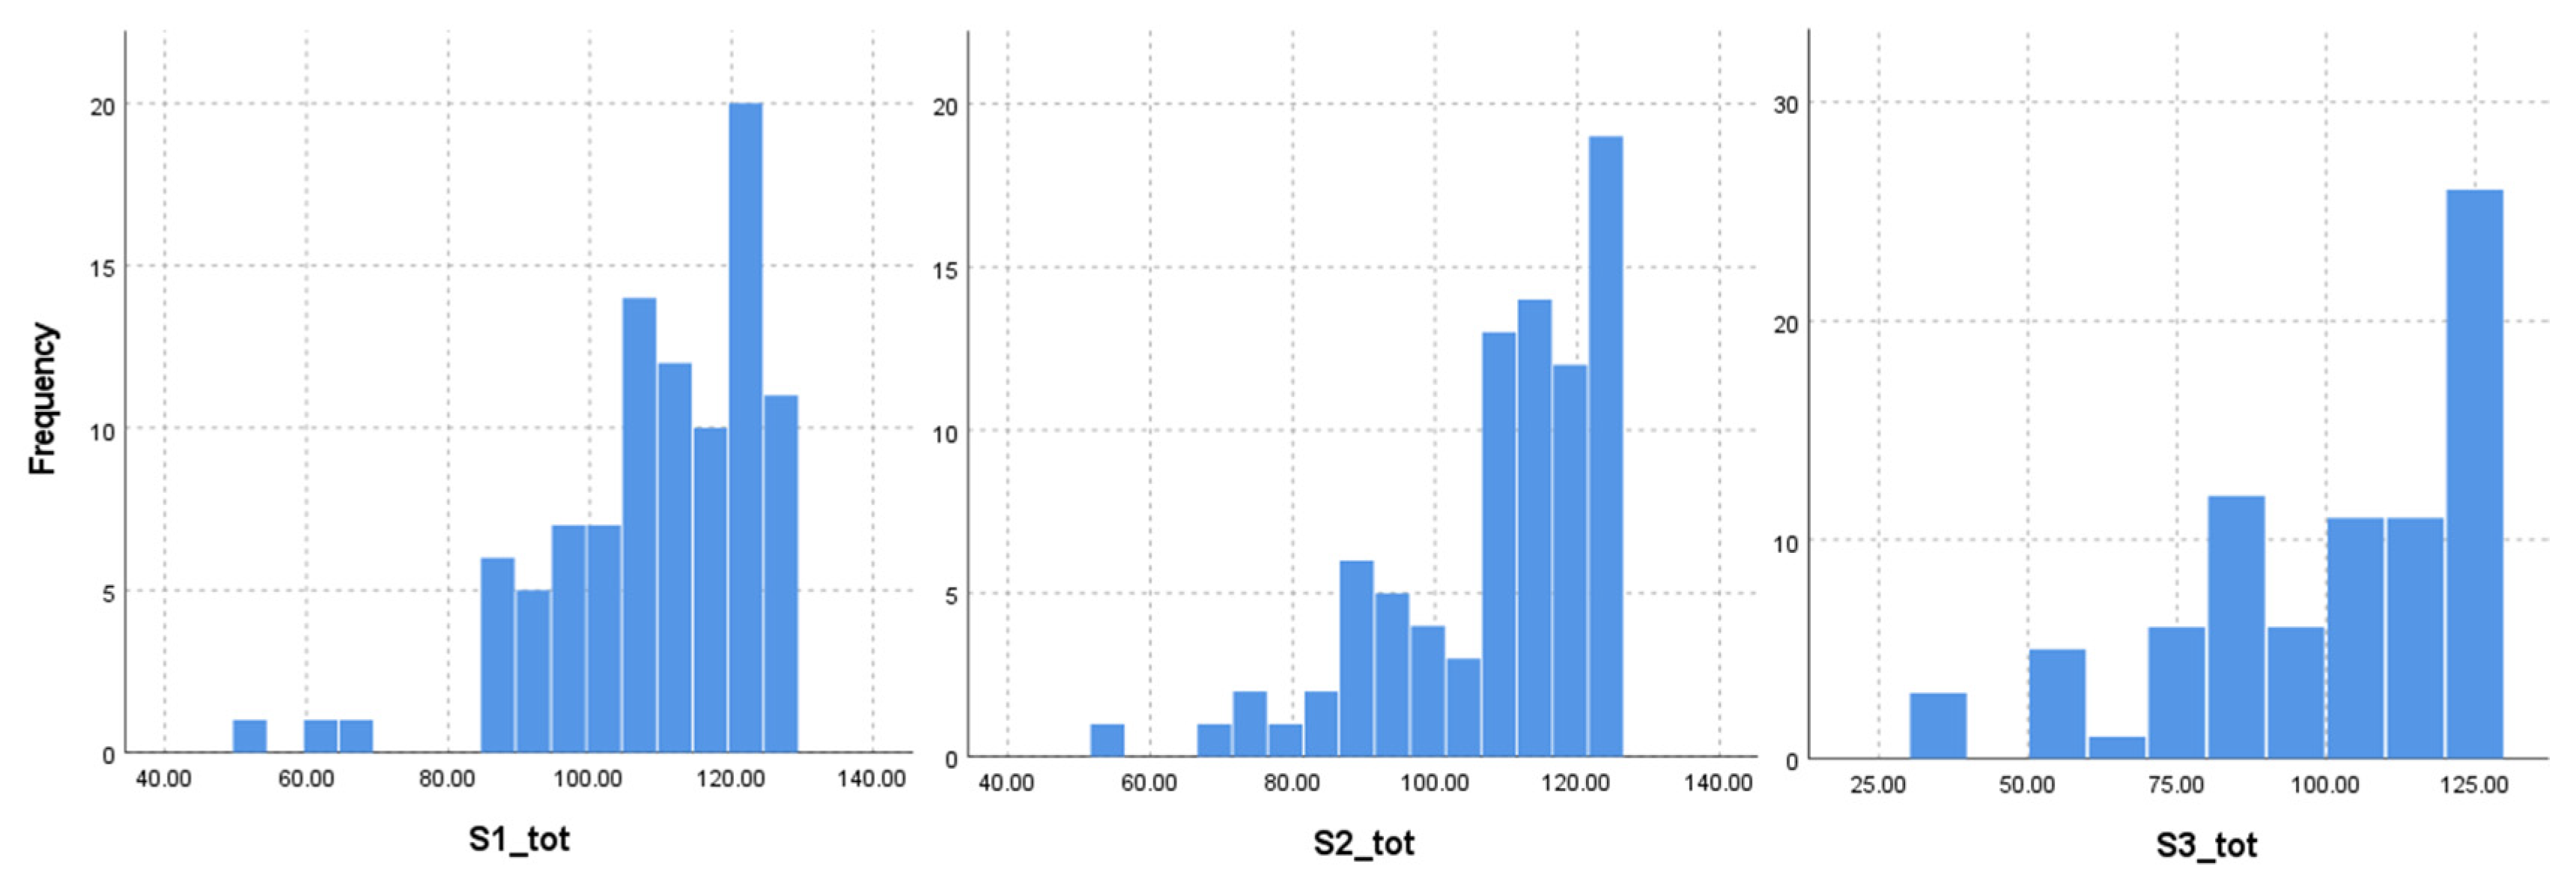
When assessing normality, the distributions were not normally distributed. Standardized residuals for each of the three scenarios do not appear normally distributed, as seen in the histograms in Figure 2.
Given that the residuals are skewed, Friedman’s test was also conducted, as a non-parametric equivalent of a within-subjects one-way ANOVA. It only considers the impact of the within-subjects variable Scenario.
Finally, reliability was assumed where Cronbach’s alpha measures the internal consistency of questions related to the same issues across each of the three scenarios. If Cronbach’s alpha ranged from 0 to 1 and scores were expected to be between 0.7 and 0.9, the result for this study represents good consistency [27]. Using a scale comprised of 18 TAM questions for each scenario, and 81 valid cases, with 14 excluded (n = 95), the reliability statistic for each scenario as indicated by Cronbach’s alpha was 0.958 for Scenario 1, 0.971 for Scenario 2, and 0.986 for Scenario 3.
3.5. Descriptive Statistics
Survey respondents were categorized as follows:
- For each of the three scenarios, a scenario variable:
- ○
- 0 = no response
- ○
- 1 = text response
- ○
- 2 = visual response
- A scenario product variable (product of all scenario variables):
- ○
- All visual responses: 2 ∗ 2 ∗ 2 = 8
- ○
- 2 visual responses, 1 text response: 2 ∗ 2 ∗ 1 = 4
- ○
- 1 visual response, 2 text responses: 2 ∗ 1 ∗ 1 = 2
- ○
- All text responses: 1 ∗ 1 ∗ 1 = 1
The results using these variables are seen in Table 3.
The dependent variable is represented by survey scenario question response totals as summed from Likert-scale responses ranging from 1 (strongly disagree) to 7 (strongly agree). These are represented for each scenario presented to participants as S1_tot for Scenario 1, S2_tot for Scenario 2, and S3_tot for Scenario 3. For the mixed ANOVA, these represent the within-subjects factors seen in Table 4.
The Maximum Visual variable (Vis_max) defined the participants who said yes to VAO in all three scenarios, labeled Yes (N = 59), and the participants who selected a mix of VAO and TAO or all TAO results across all three scenarios, labeled No (N = 22). Maximum Visual is the study’s between-subjects independent variable. It was one of the main factors in the mixed ANOVA, as can be seen in Table 5.
3.6. Mann–Whitney U Test
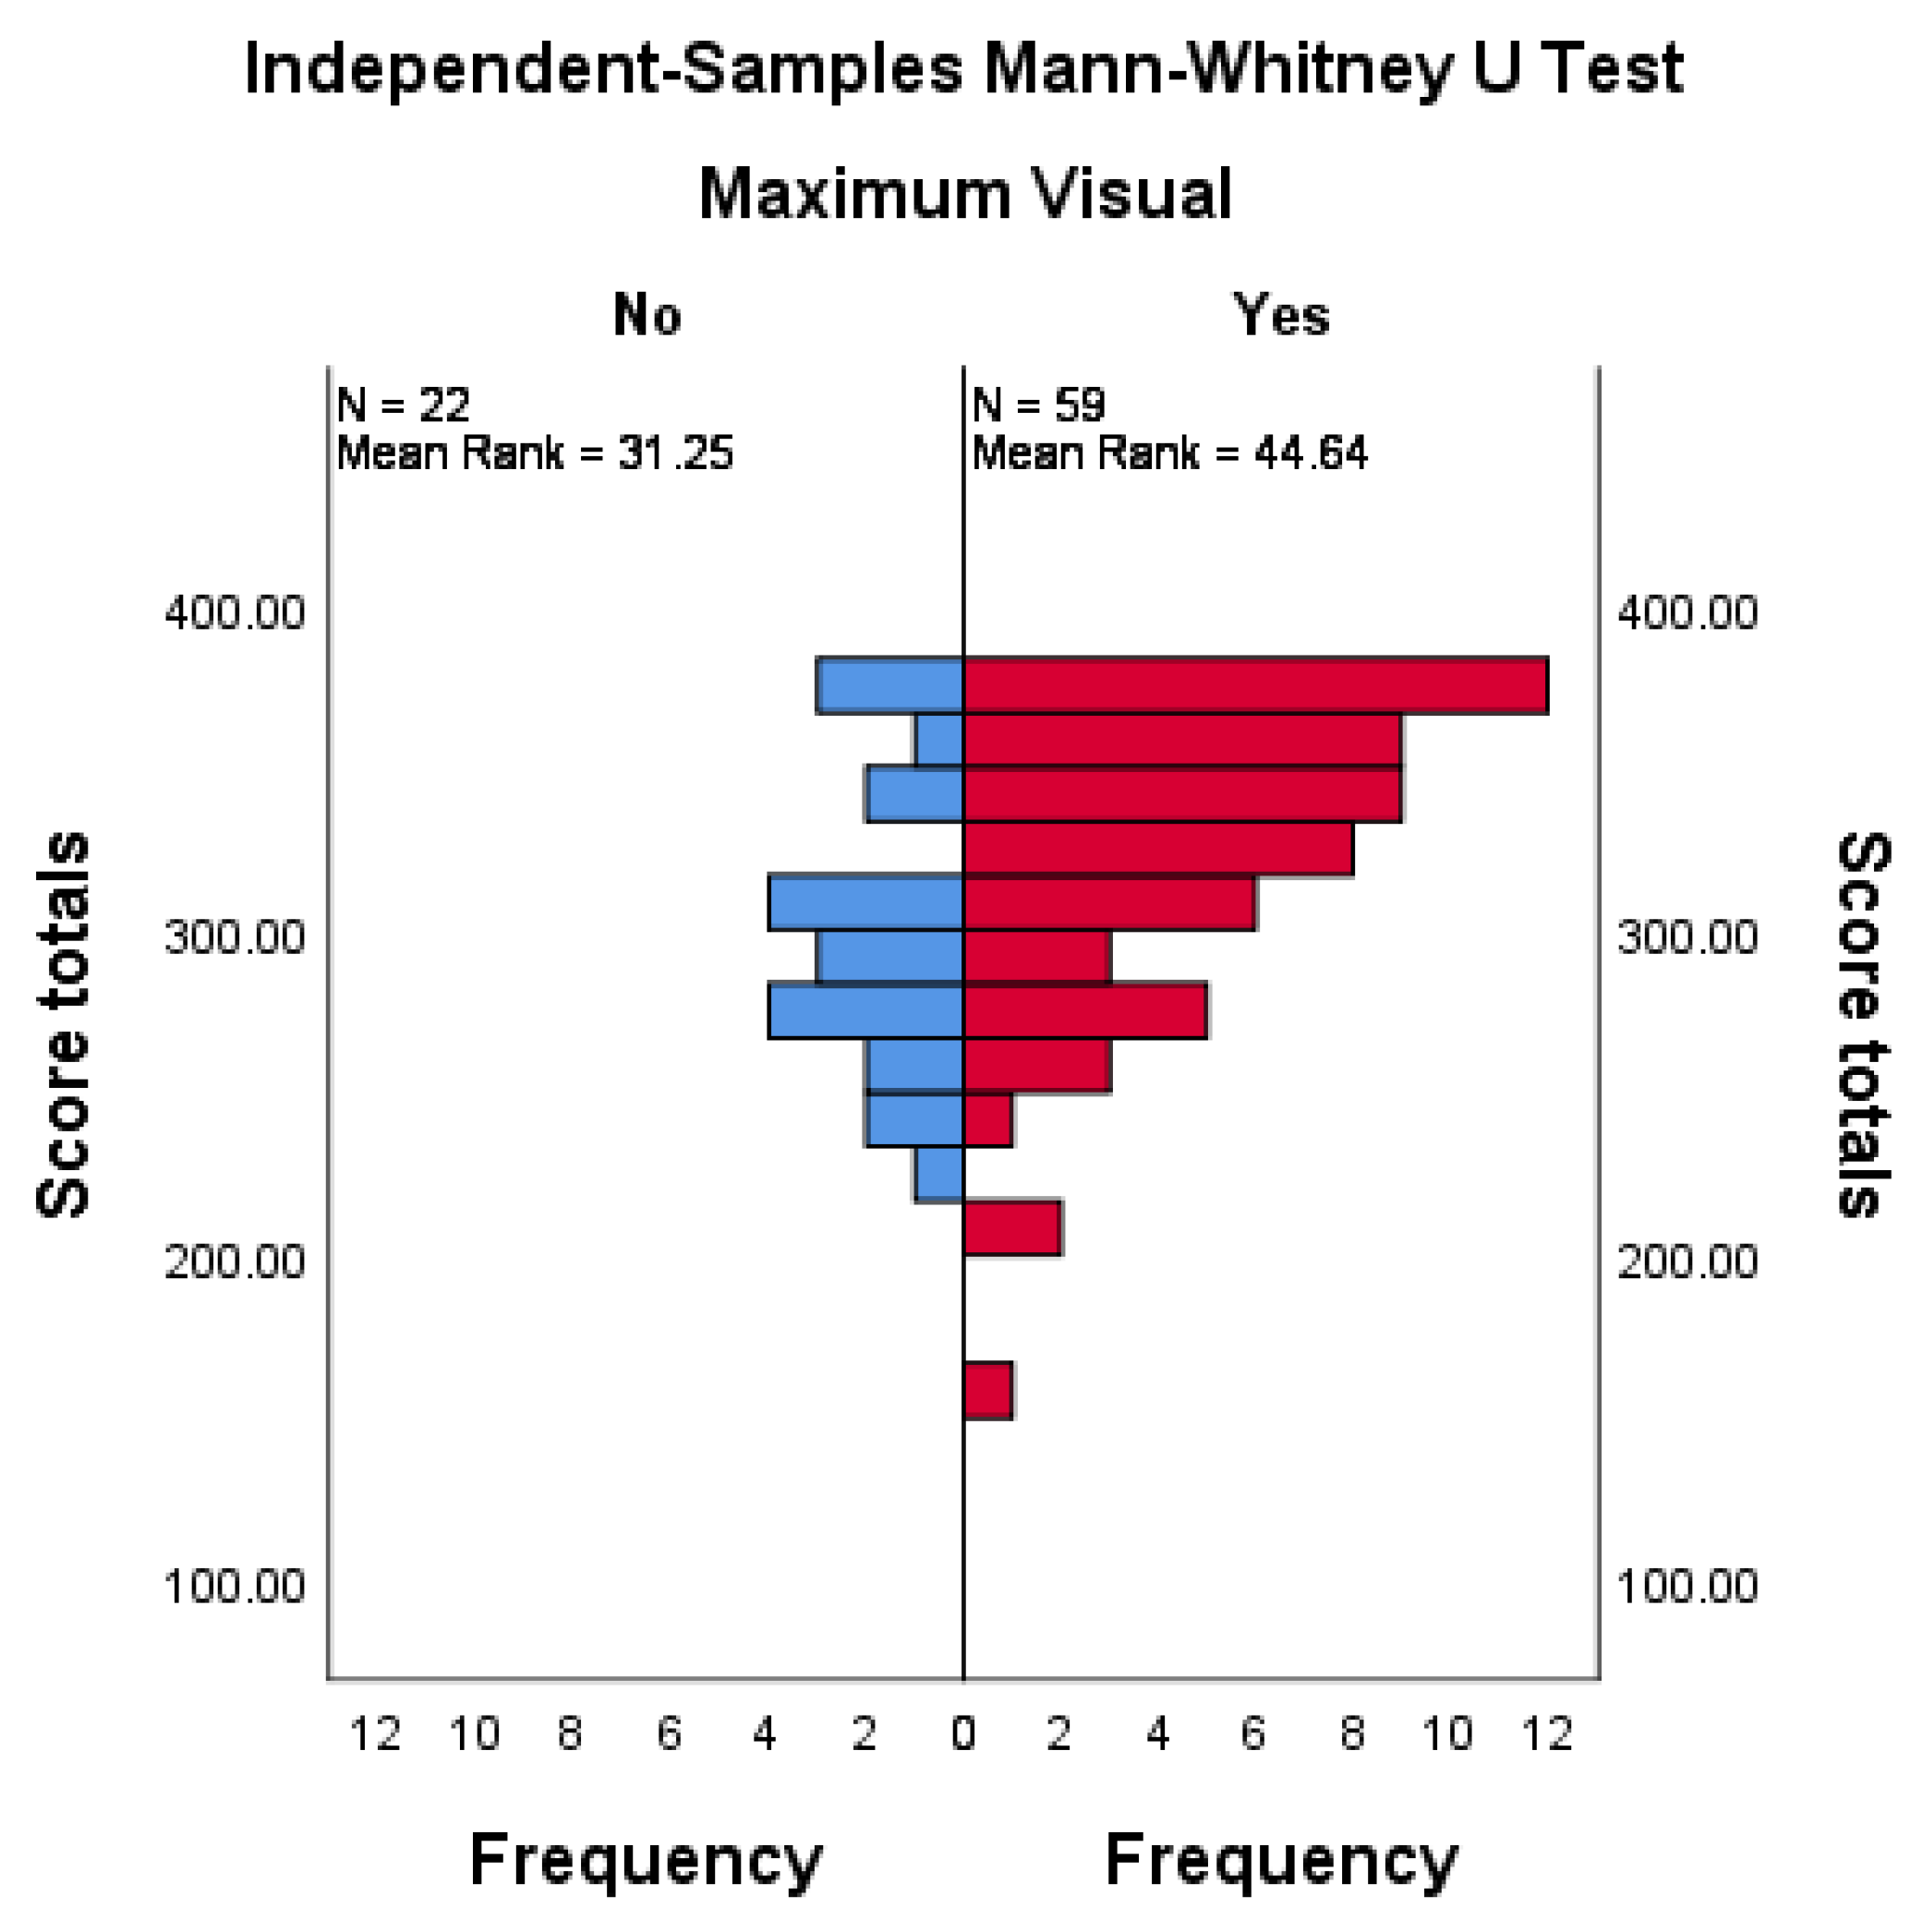
A Mann–Whitney U test of independent samples had participants’ level of acceptance of alert output as its dependent variable, which is the ranked, summed scores across all scenarios (S_tot). The independent variable is Maximum Visual (Vis_max). The test determines whether the group who prefer VAO across all scenarios have a significantly different acceptance score than those who prefer TAO in some or all scenarios. Score totals are noted in Figure 3, while Table 6 provides a statistical summary.
The Mann–Whitney U test indicates that there is a significant difference (U = 863.5, p = 0.023) in the level of acceptance of alert output between the respondents who selected visual output across all scenarios (n = 59) as compared to the respondents who provided mixed responses (n = 22). As such, the null hypothesis, that there is no statistically significant difference in the level of acceptance of alert output between those who preferred VAO in all scenarios and those preferring TAO in some or all scenarios, is rejected.
The effect size is calculated by dividing the Standardized Test Statistic, Z, by the square root of the number of pairs: . The effect size, according to Cohen’s classification of effect, is moderate, given 0.1 (small effect), 0.3 (moderate effect), and 0.5 and above (large effect).
3.7. Friedman Test
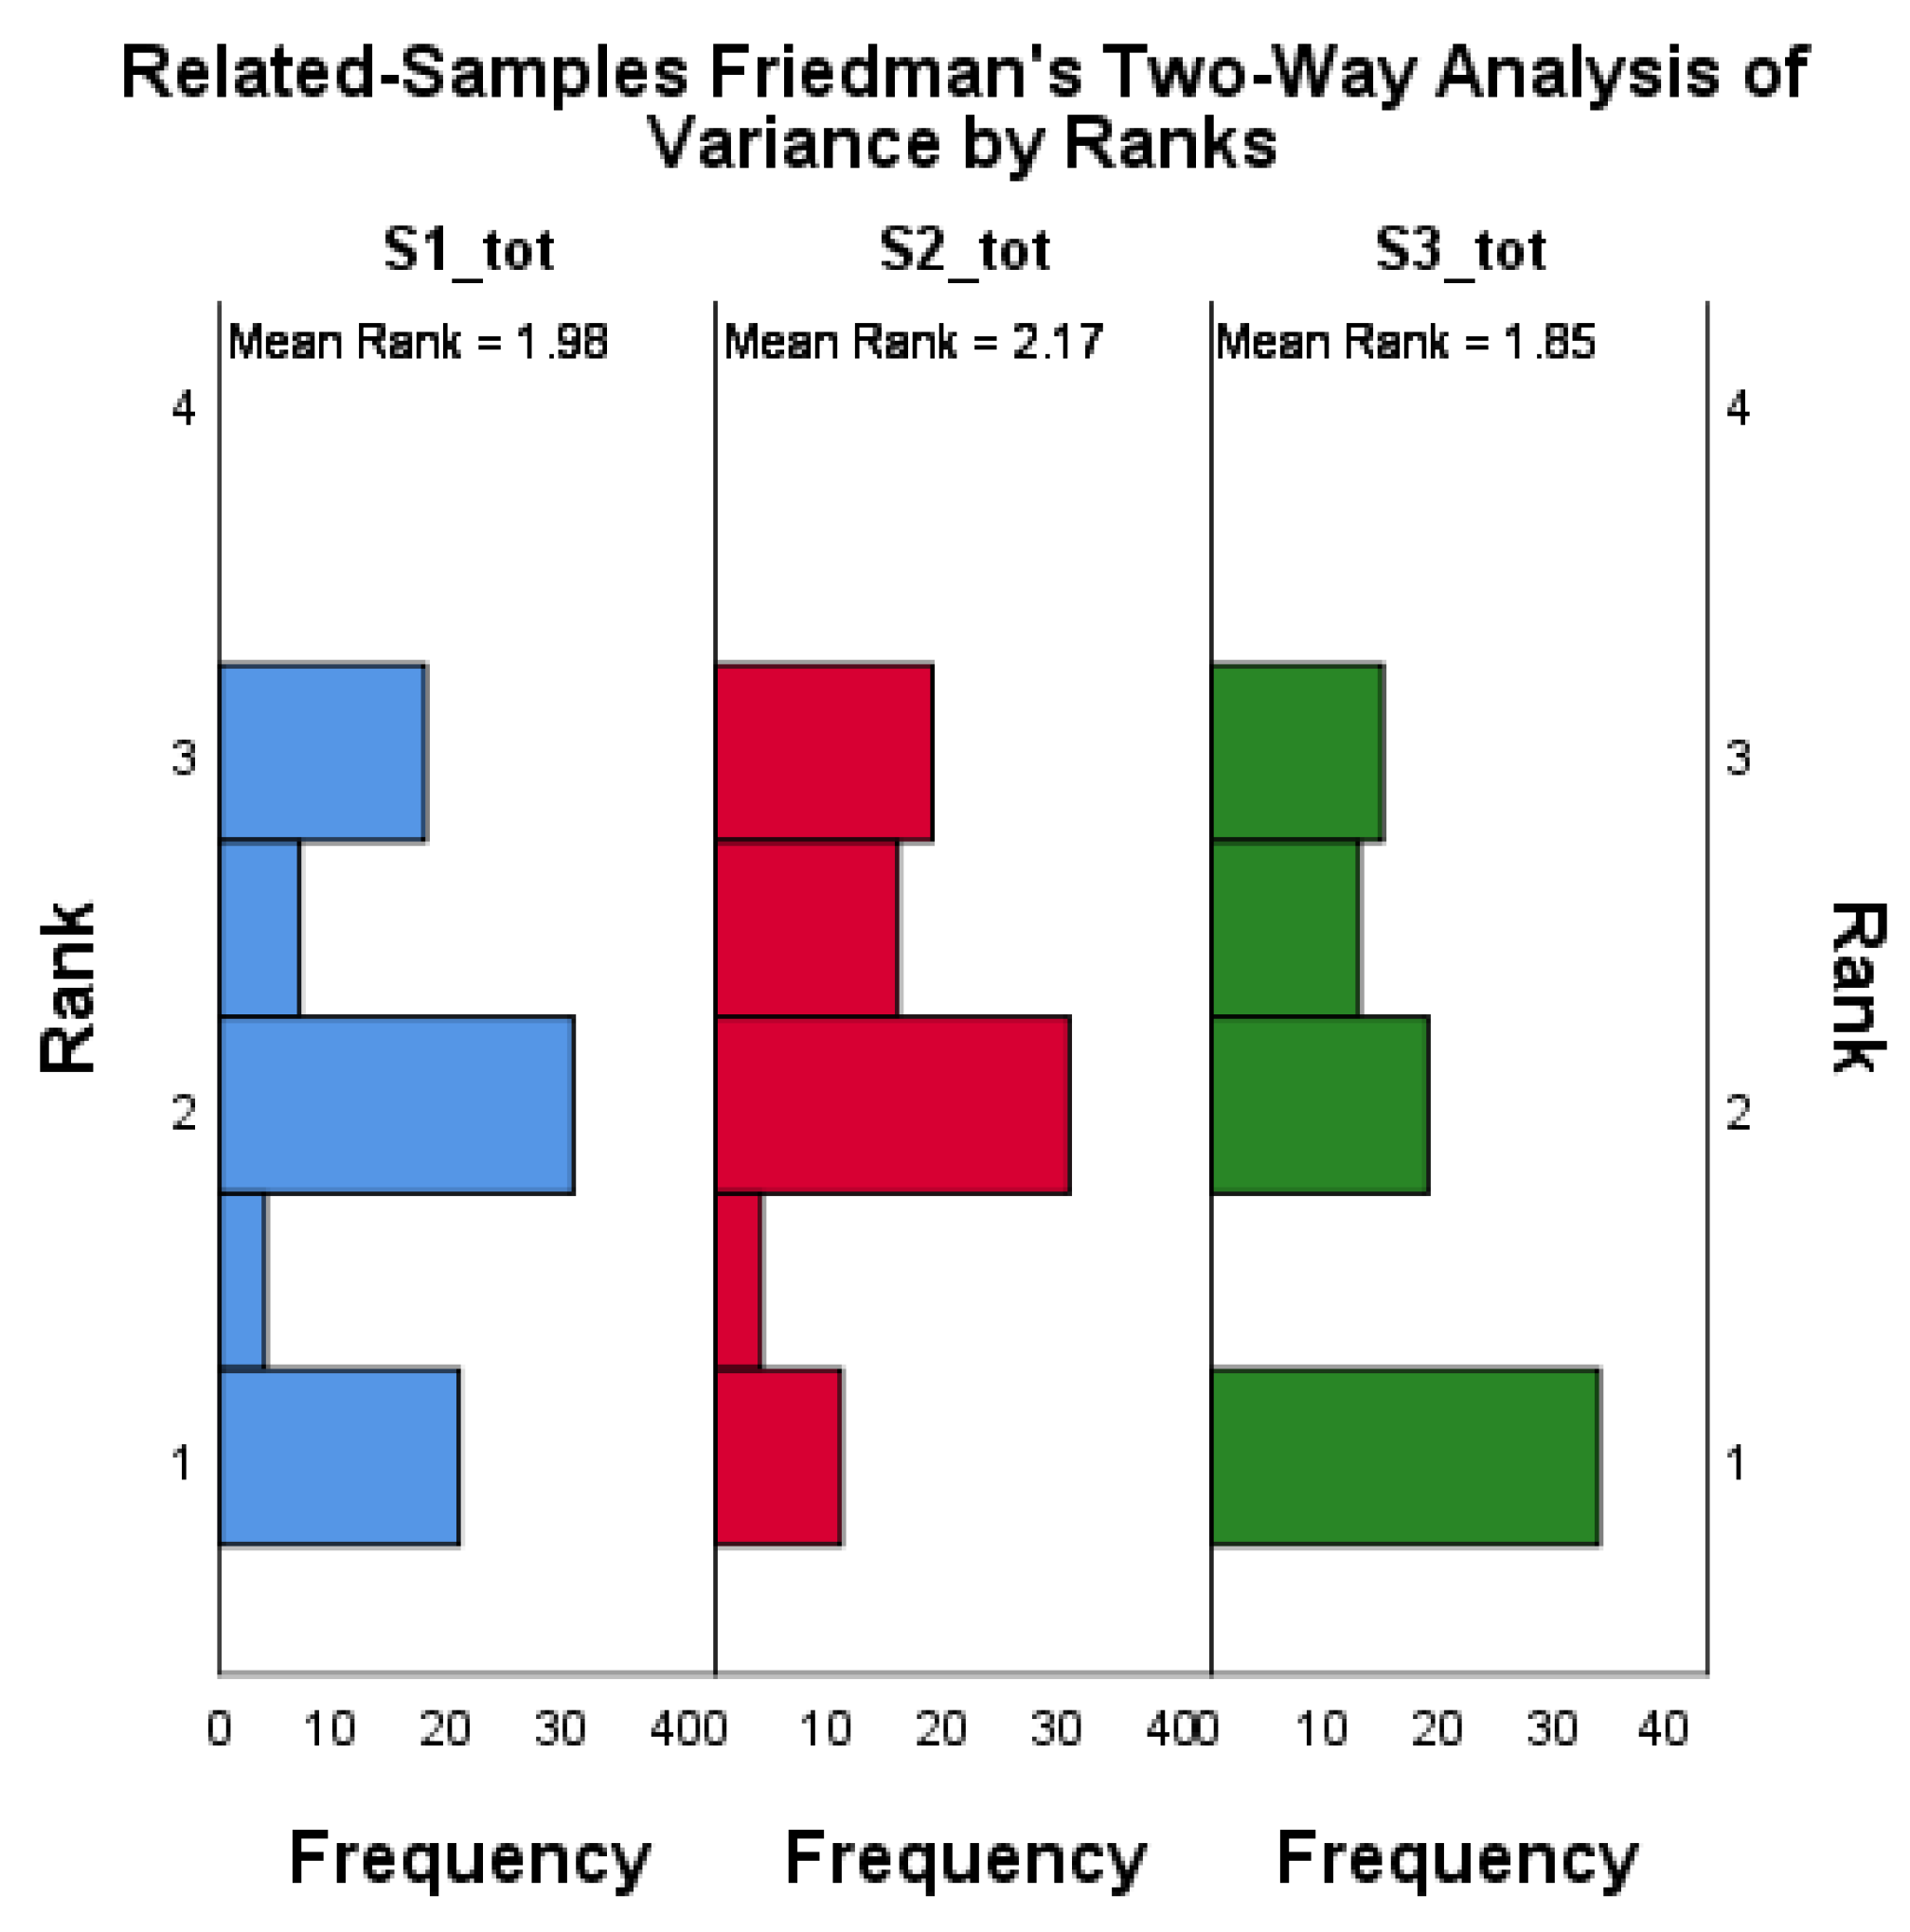
A related samples Friedman test was conducted to assess the measurements of the same dependent variable under different conditions for each participant, namely the three scenarios for this study defined by the variables S1_tot, S2_tot, and S3_tot. Rank frequencies are shown in Figure 4 and the statistical summary is represented in Table 7.
The Friedman test carried out to compare the score ranks for the three scenarios found there to be no significant difference between scenarios: . The result indicates that scenario mean ranks did not differ significantly from scenario to scenario when not also factoring for responses based on output preference (Maximum Visual).
Effect size was not applicable as no measurable significance was found.
3.8. Mixed ANOVA—All Measures (PU, PEU, AU, IU Combined)
A two-way mixed ANOVA was conducted, with a Bonferroni correction for the within-subjects variable. The dependent variable was the level of acceptance of alert output, with all items of all TAM sub-scales summed.
While considered more conservative, most authorities suggest the Greenhouse–Geisser correction when the epsilon (ε) estimate is below 0.75. As noted in Table 8, ε = 0.727, and thus the Greenhouse–Geisser correction was utilized.
As indicated in Table 8, sphericity cannot be assumed as p < 0.001. As such, the Greenhouse–Geisser correction was applied.
The within-subjects variable, equating to score totals for each of the three study scenarios, is represented by Scenarios (S1_tot, S2_tot, and S3_tot). The between-subjects variable was Maximum Visual (Vis_max), labeled as Yes (n = 59) and No (n = 22). Again, the Maximum Visual variable (Vis_max) differentiates between the participants who said yes to VAO in all three scenarios, labeled Yes (N = 59), and the participants who selected a mix of VAO and TAO, or all TAO results, across all three scenarios, labeled No (n = 22). Maximum Visual is the statistical analogy for the study’s between-subjects independent variable, specifically (a) ML/DS-generated TAO, and (b) ML/DS-generated VAO.
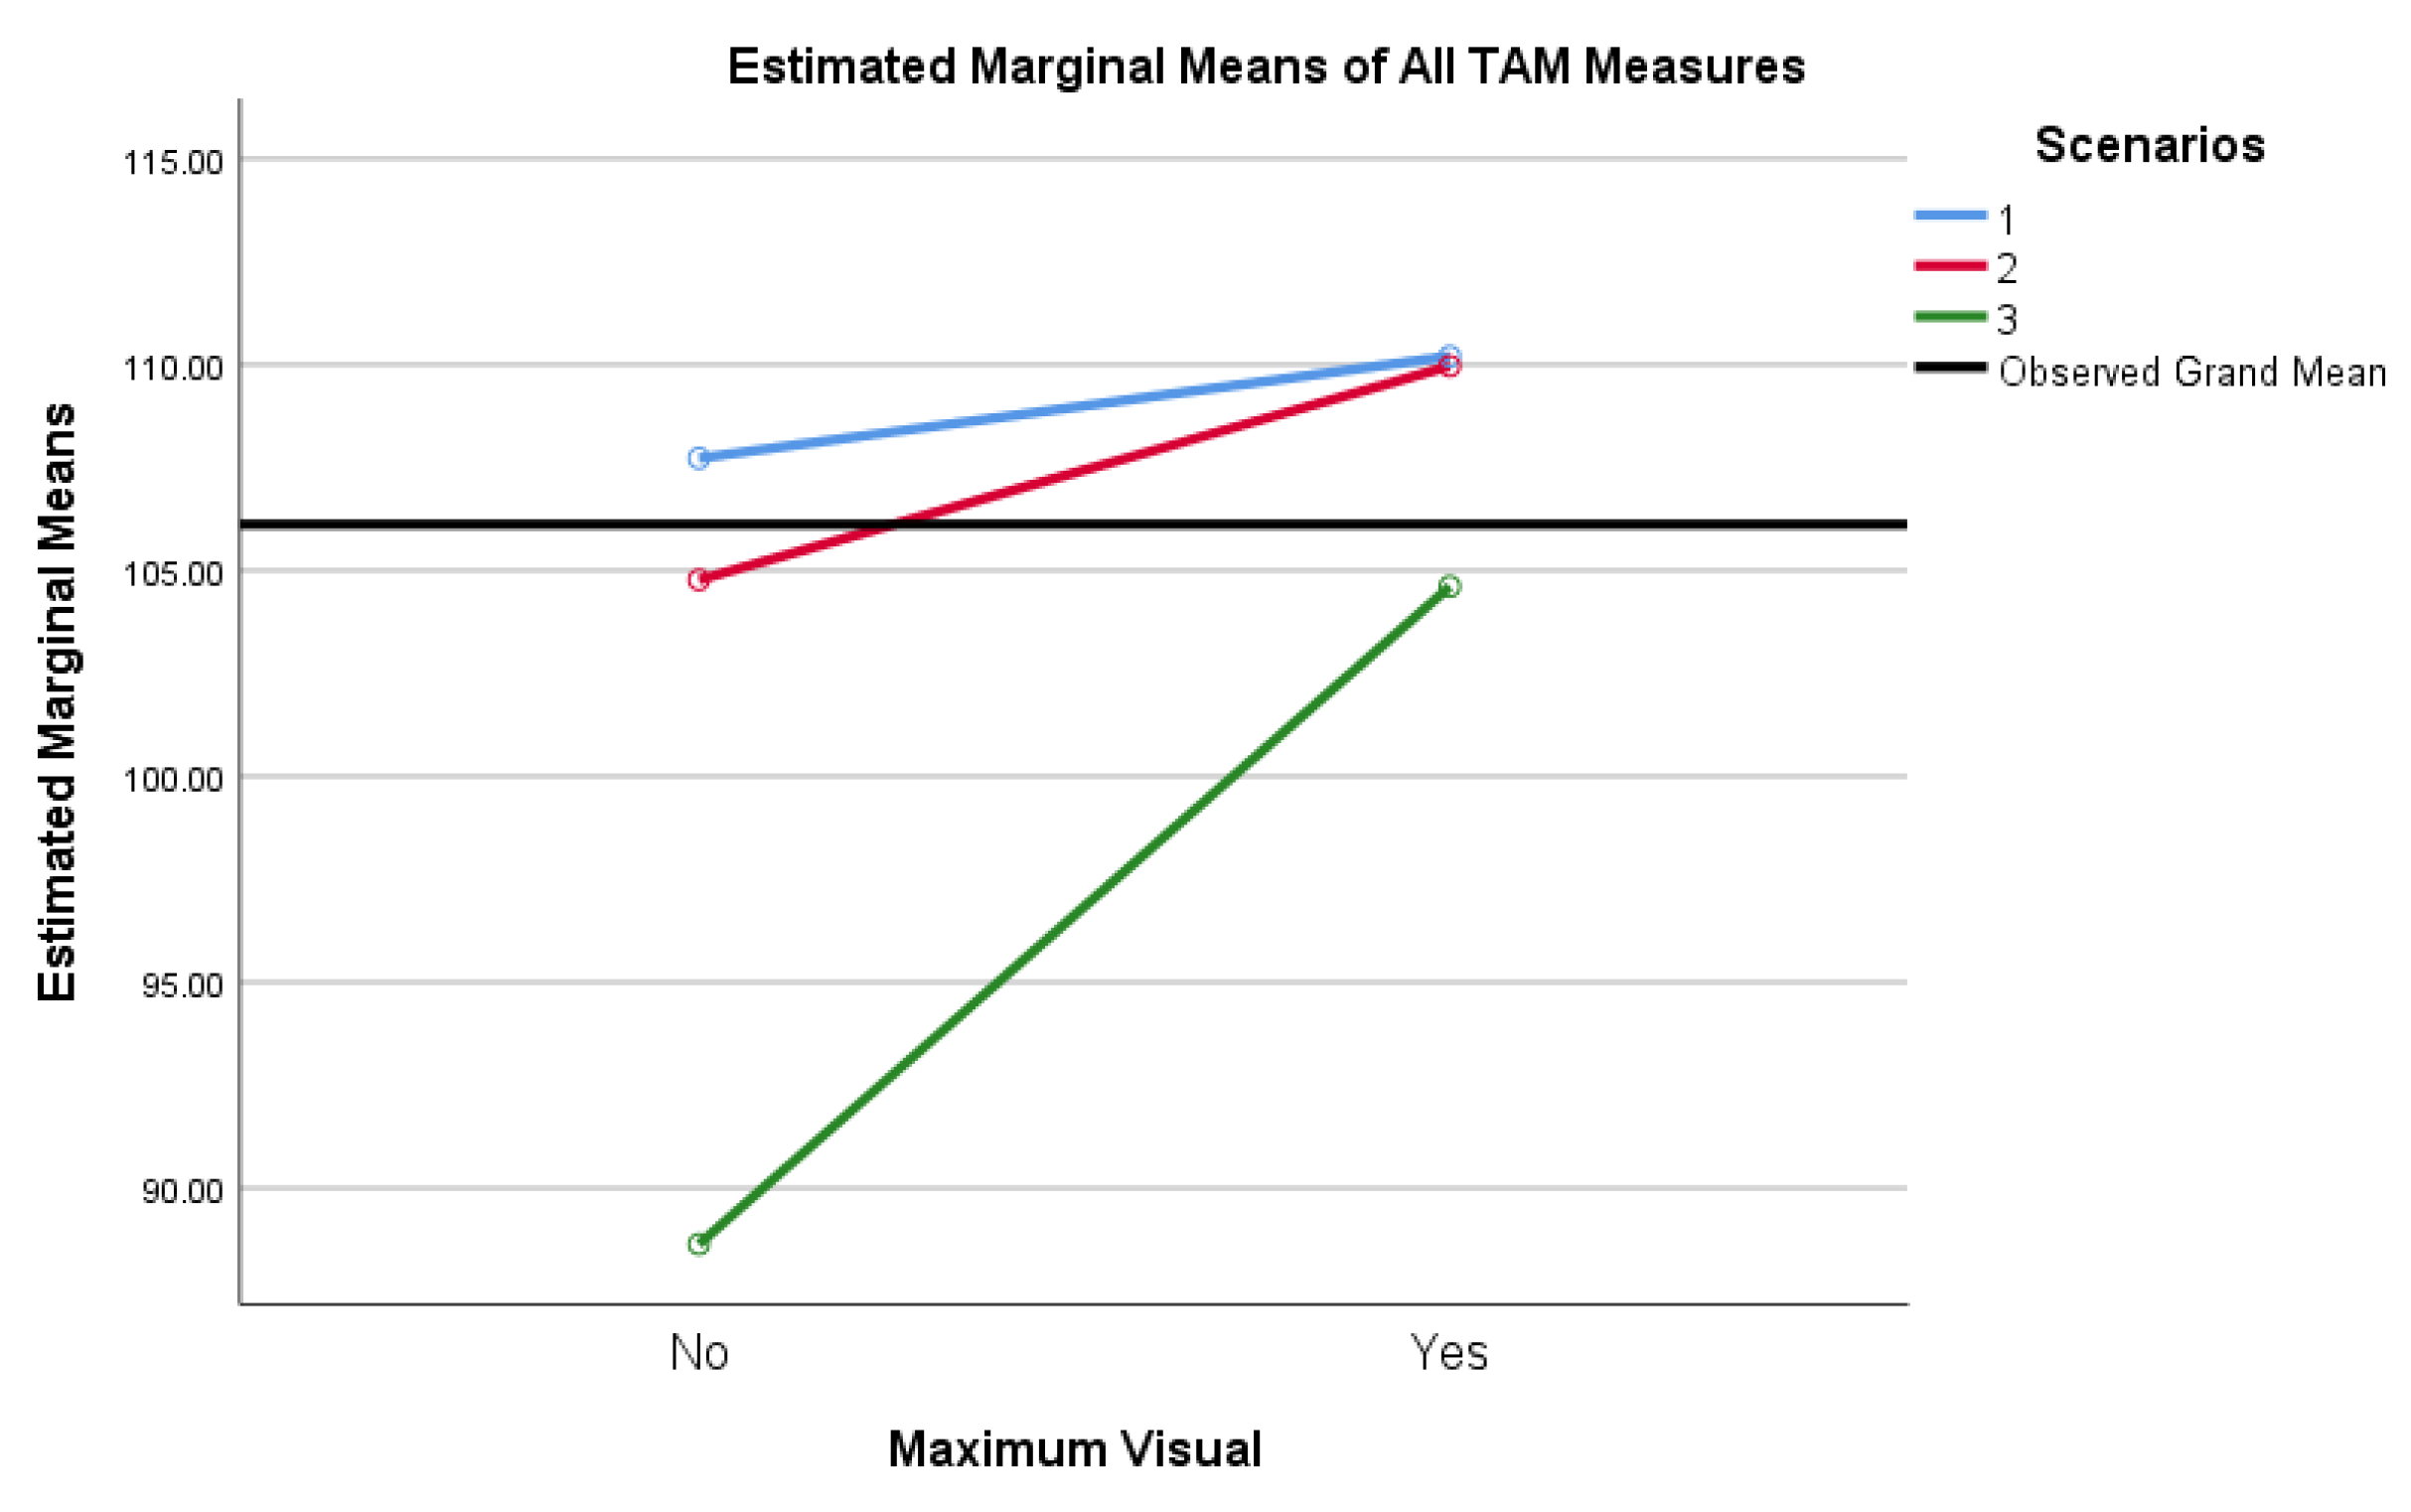
Participants were presented with three scenarios exhibiting security alert output for the results of applied models, where the output was both VAO and TAO. A mixed ANOVA using α = 0.05 with a Greenhouse–Geisser correction showed that scores varied significantly across Scenarios in tests of within-subject effects, and there was also a significant interaction with Maximum Visual:
- Scenarios: (F (1.455, 114.915) = 19.925, p < 0.001, ηp2 = 0.201)
- Scenarios∗Vis_max: (F (1.455, 114.915) = 5.634, p = 0.010, ηp2 = 0.067)
The impact of Maximum Visual (vis_max) on the level of acceptance of output was mediated by Scenarios. The difference of the level of acceptance was more significant for Scenario 3, as an example. Post hoc tests using the Bonferroni correction revealed that favorable scores declined insignificantly from Scenario 1 to Scenario 2 by an average of 1.596 points (p = 0.702) but declined significantly from Scenario 1 to Scenario 3 by 12.342 points (p < 0.001). Scenario 2 to Scenario 3 saw an additional significant decrease of 10.746 points (p < 0.001). The differences in scores were not particularly meaningful between or within Scenarios 1 and 2 (S1_tot and S2_tot) and Maximum Visual (Vis_max) = Yes or No. However, a significant difference was noted in Scenario 3 (S3_tot) compared to Scenarios 1 and 2, as well as Maximum Visual = Yes versus Maximum Visual = No. Most noteworthy is a 15% decrease in mean score for Maximum Visual = No in Scenario 3 as compared to Scenario 2, indicating a noteworthy decrease in PU, PEU, AU, and IU for participants selecting TAO.
Via estimated marginal means between-subjects, where Maximum Visual = Yes or Maximum Visual = No, inclusive of all TAM components with α = 0.05 and Bonferroni correction, pairwise comparisons yielded a 7.881 point mean difference in favor of VAO, significant at p = 0.046. As such, there was a significant main effect of Maximum Visual scores (F (1, 79) = 4.111, p = 0.046, ηp2 = 0.049) on the level of acceptance of alert output, as indicated by the sum of participants’ scores for all TAM components (PU, PEU, AU, and IU). These results are represented visually in Figure 5.
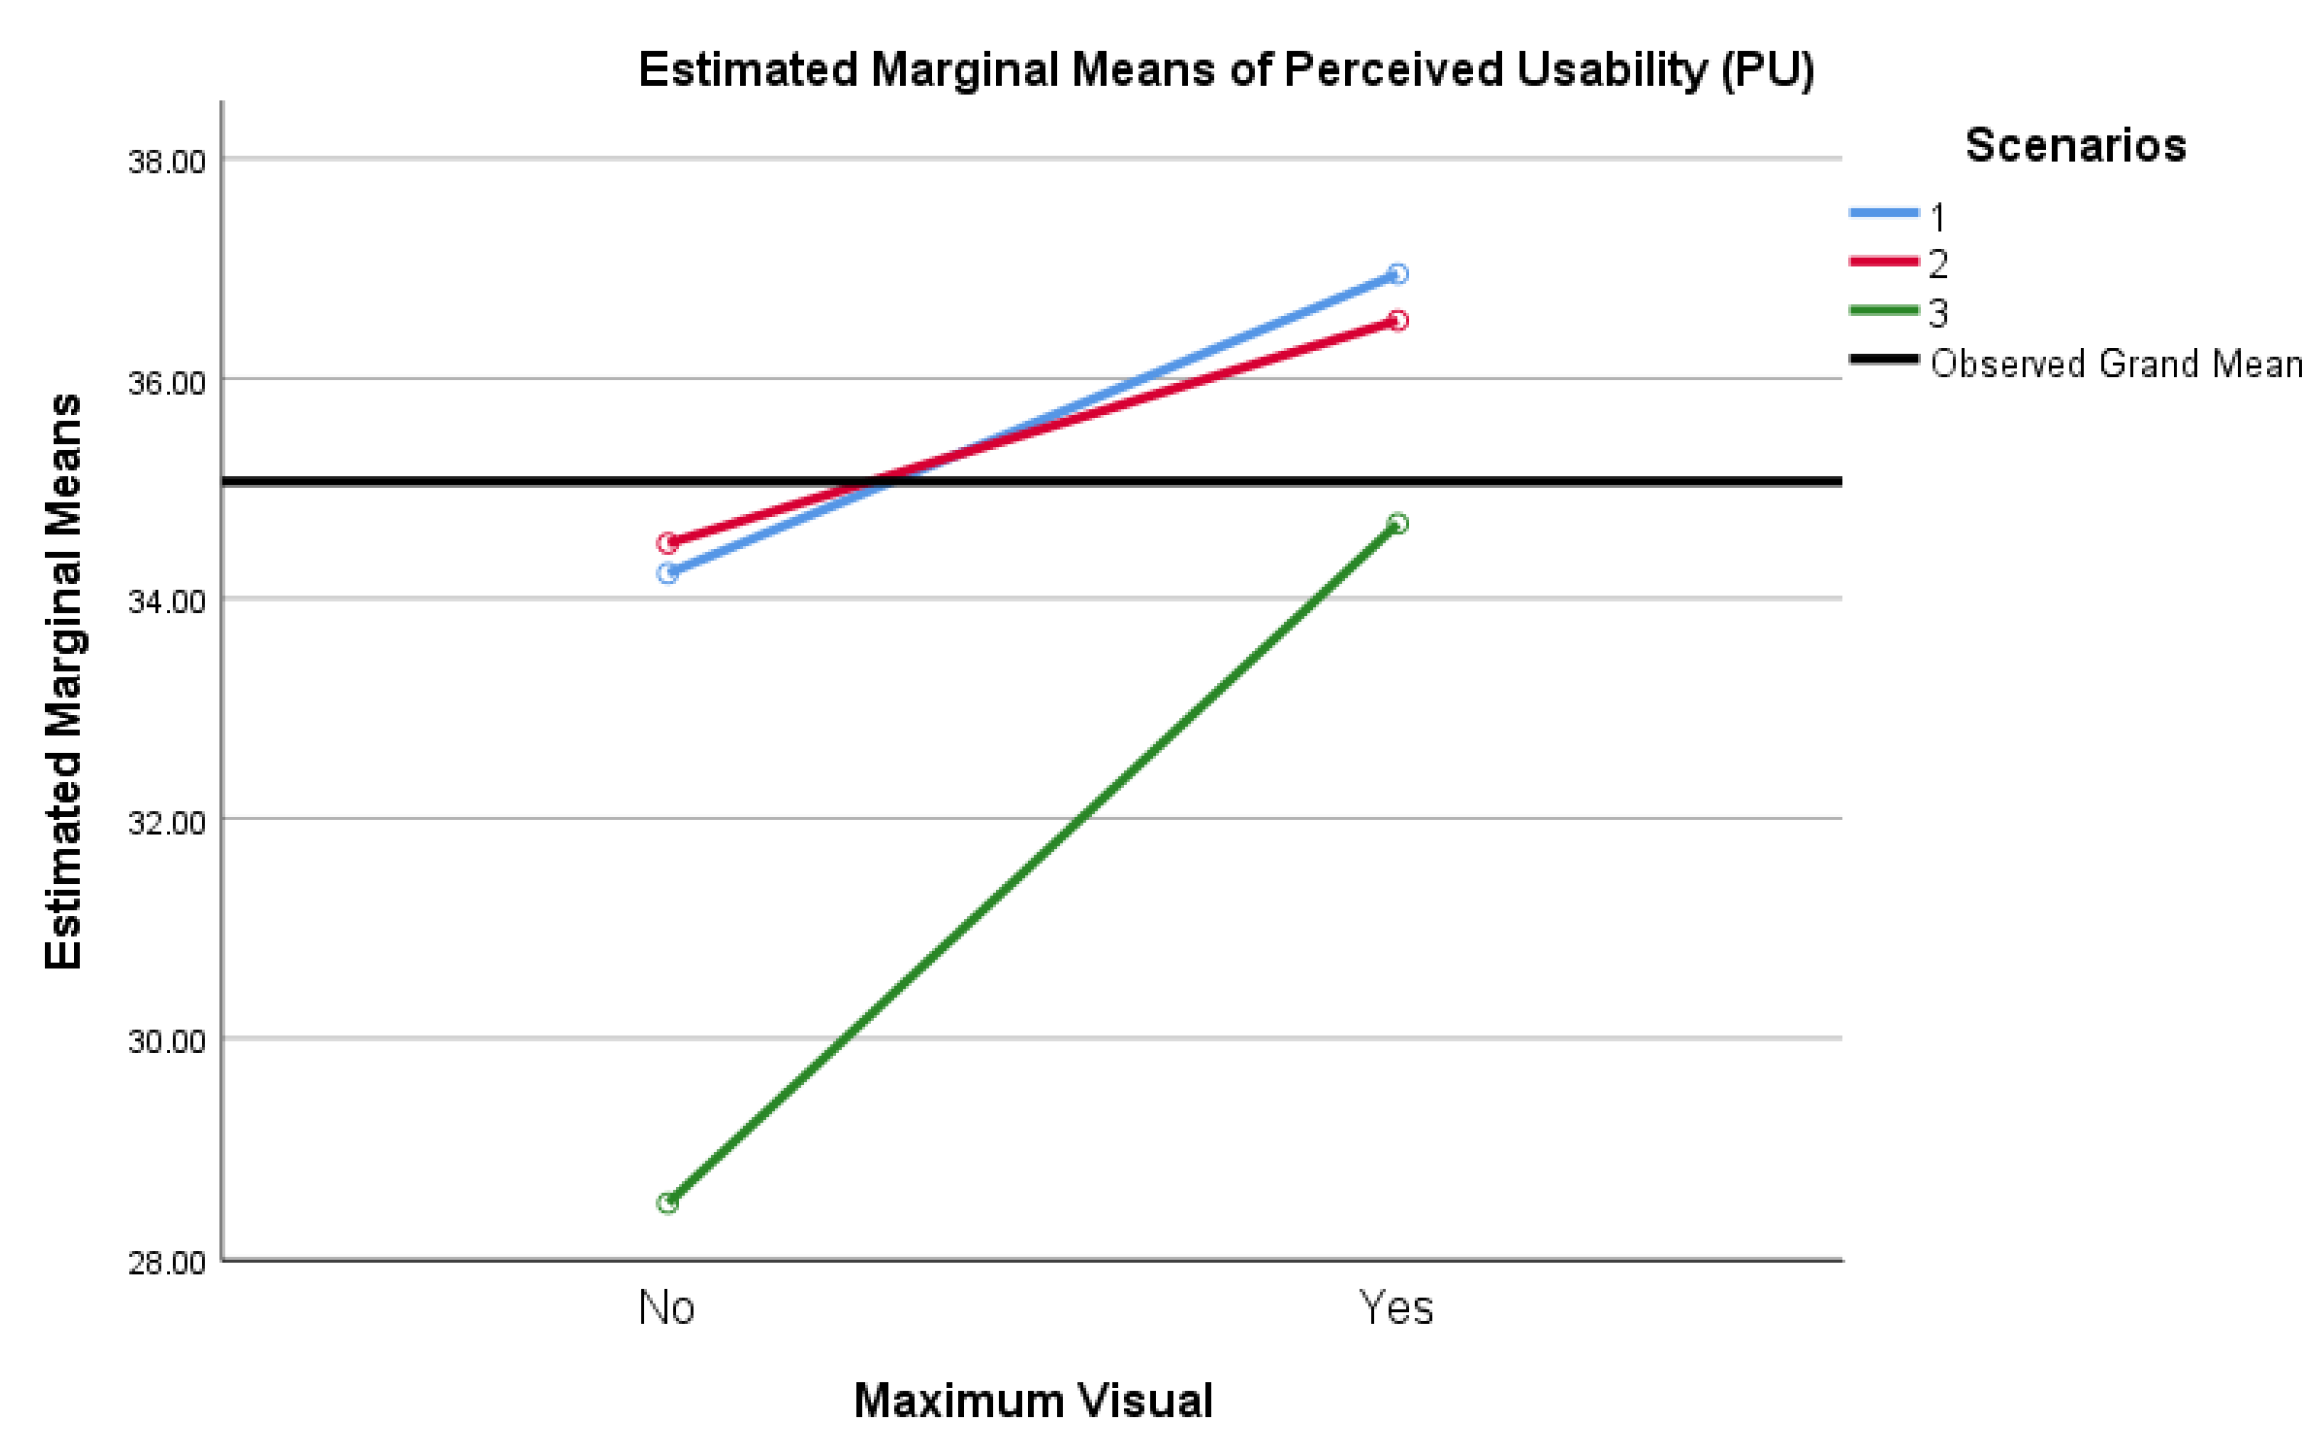
3.9. Mixed ANOVA—Perceived Usefulness (PU)
Two-way mixed ANOVA with Bonferroni correction, computed using α = 0.0125, was performed for PU in isolation. α = 0.0125 was appropriate to avoid family-wise errors by adjusting to be more conservative, where four tests at α = 0.05 implies the use of α = 0.0125. The measures related to PU represented one of four TAM-specific comparisons, and thus a conservative but accurate method to compensate for multiple tests was required.
Mixed ANOVA was again applied, where the within-subjects variables equating to score totals for each of the three study scenarios were represented by Perceived_Usefulness (PUS1_tot, PUS2_tot, and PUS3_tot), and between-subjects factors were again represented by Maximum Visual (Vis_max), labeled as Yes (n = 59) and No (n = 22).
Participants were presented with three scenarios exhibiting security alert output for the results of applied models, where the output was both VAO and TAO. A mixed ANOVA computed using α = 0.0125 with a Greenhouse–Geisser correction showed that scores varied significantly across scenarios specific to Perceived_Usefulness (PUS1_tot, PUS2_tot, and PUS3_tot) in tests of within-subject effects, and less significantly when differentiated for Maximum Visual:
- Scenarios: (F (1.637, 129.311) = 16.999, p < 0.001, ηp2 = 0.177)
- Scenarios∗Vis_max: (F (1.637, 129.311) = 4.017, p = 0.028, ηp2 = 0.048)
Post hoc tests using the Bonferroni correction revealed that favorable scores for PU declined insignificantly from Scenario 1 to Scenario 2 by an average of 0.076 points (p = 1.000), but then declined significantly from Scenario 1 to Scenario 3 by 3.999 points (p = < 0.001) and from Scenario 2 to Scenario 3 by an additional 3.924 points (p < 0.001). The differences in scores were not particularly meaningful between or within Scenarios 1 and 2 (PUS1_tot and PUS2_tot) and Maximum Visual (Vis_max) = Yes or No. A significant difference was, however, noted in Scenario 3 (PUS3_tot) compared to Scenarios 1 and 2, as well as Maximum Visual = Yes versus Maximum Visual = No. Again, a 15% decrease in mean score for Maximum Visual = No was noted in Scenario 3 as compared to Scenario 2, indicating a significant decrease in PU for participants selecting TAO. Interestingly, there was a 1% increase in PU for participants selecting TAO for Scenario 2 as compared to Scenario 1.
Via estimated marginal means between-subjects, where Maximum Visual = Yes or Maximum Visual = No, inclusive only of PU data with α = 0.0125 and Bonferroni correction, pairwise comparisons yielded a 3.642 point mean difference in favor of VAO, significant at p = 0.007. As such, there was a significant main effect of Maximum Visual scores (F (1, 79) = 7.643, p = 0.007, ηp2 = 0.088) on the level of acceptance of alert output, as indicated by sum of participants’ scores for PU. These results are best represented visually, as noted in Figure 6.
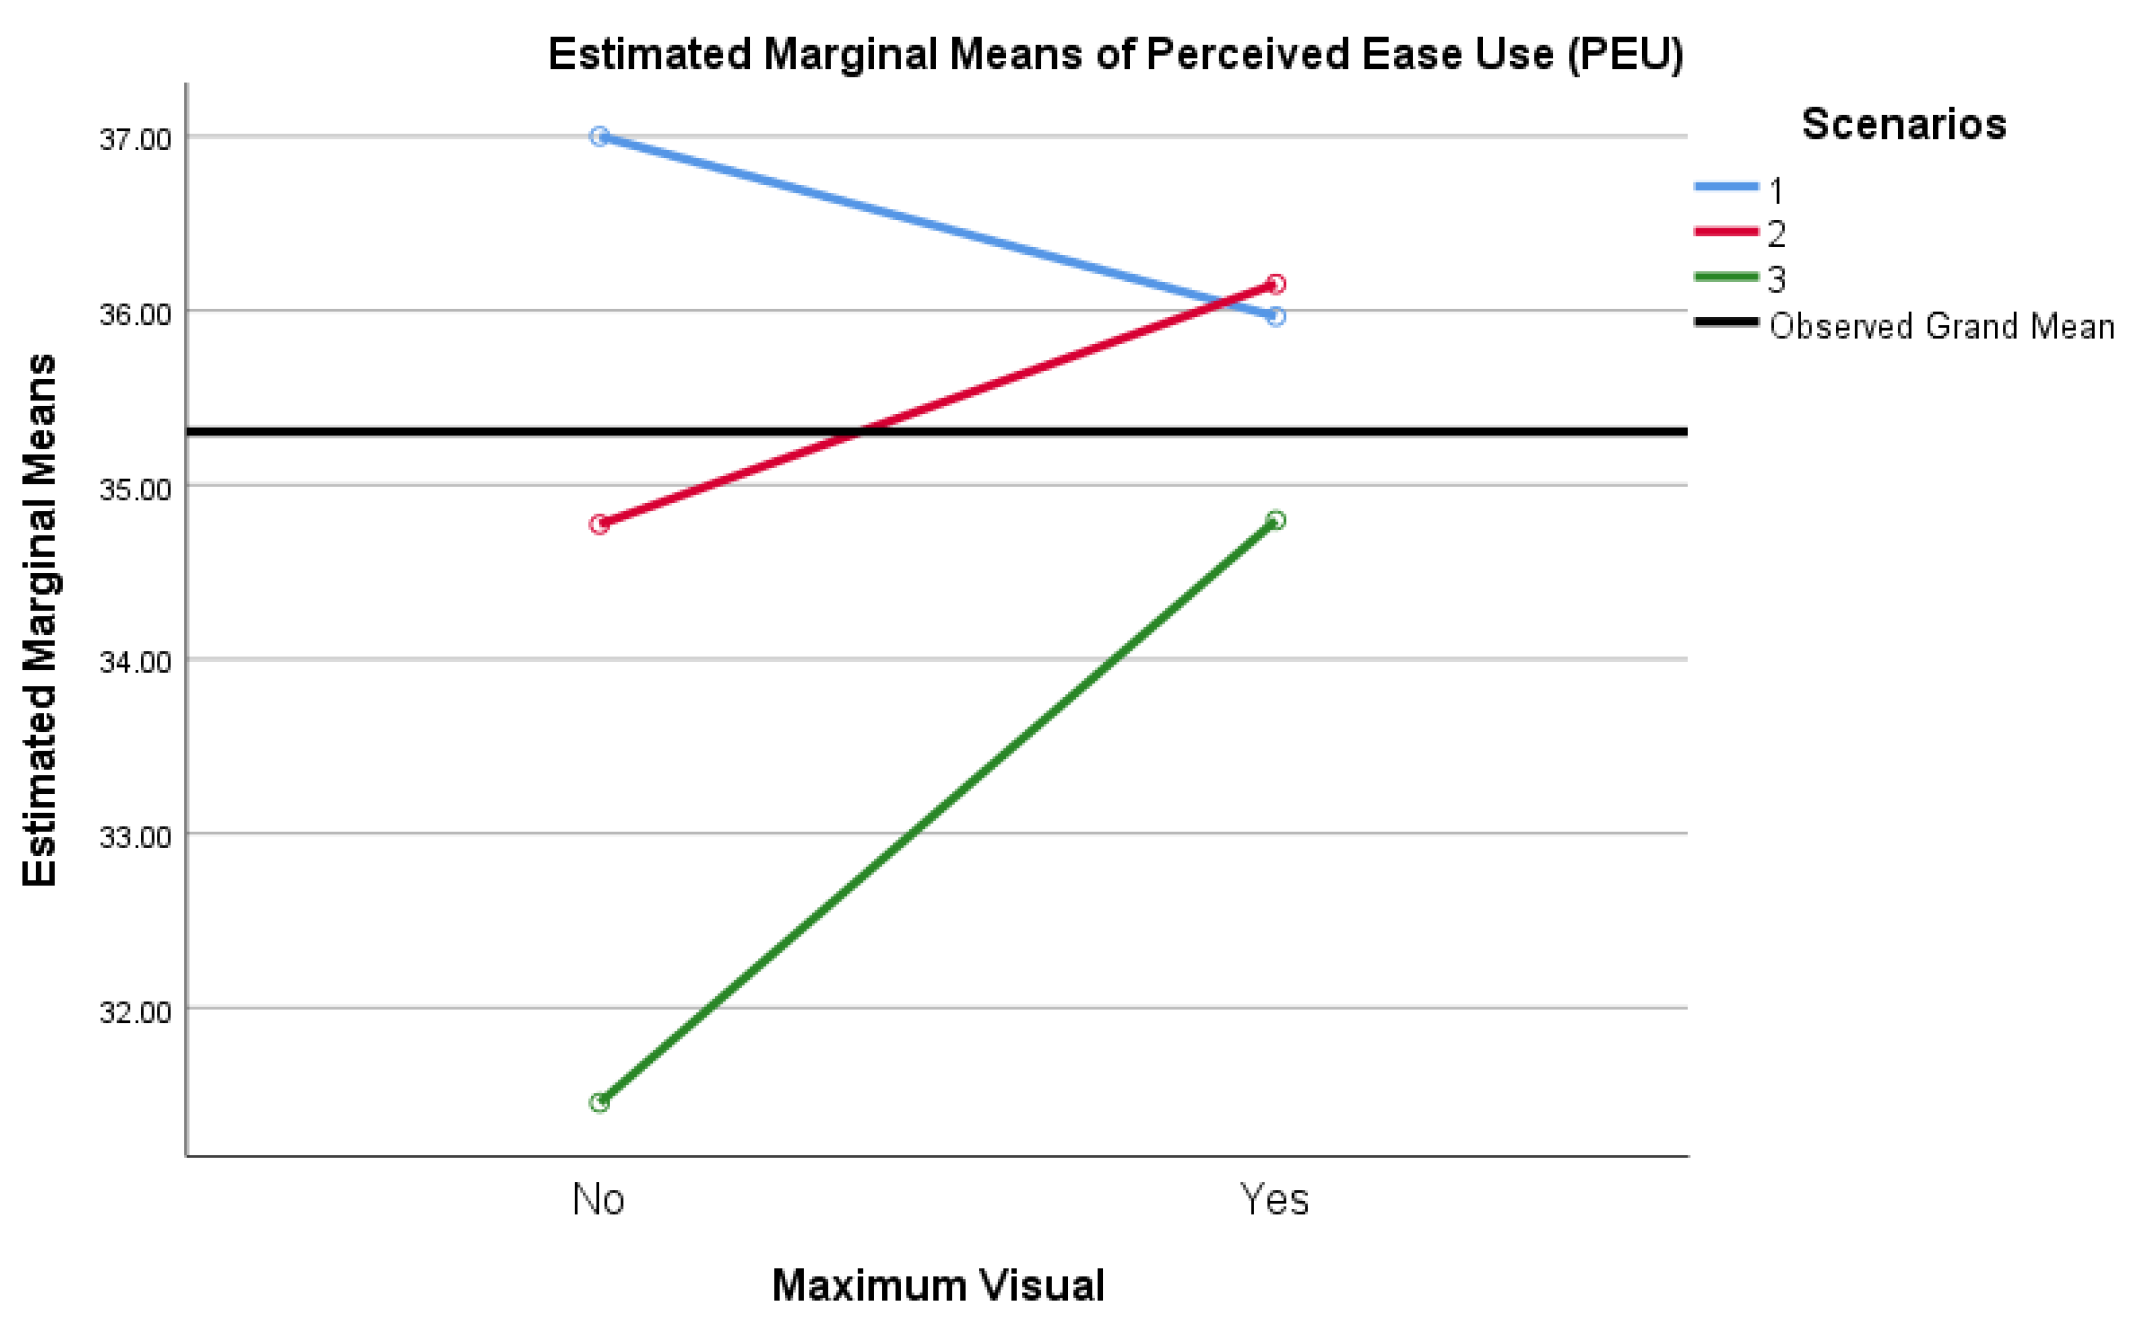
3.10. Mixed ANOVA—Perceived Ease of Use (PEU)
Two-way mixed ANOVA with Bonferroni correction, computed using α = 0.0125, was performed for PEU in isolation. α = 0.0125 was applicable as one quarter of α = 0.05 given that the TAM components related to PEU represent one of four tests of related measures.
Mixed ANOVA was again applied, where the within-subjects variables equating to score totals for each of the three study scenarios are represented by Perceived_EaseOfUse (PEUS1_tot, PEUS2_tot, and PEUS3_tot), and between-subjects factors were again represented by Maximum Visual (Vis_max), labeled as Yes (n = 59) and No (n = 22).
Participants were presented with three scenarios exhibiting security alert output for the results of applied models, where the output was both VAO and TAO. A mixed ANOVA computed using α = 0.0125 with a Greenhouse–Geisser correction showed that scores varied significantly across scenarios specific to perceived ease of use (PEUS1_tot, PEUS2_tot, and PEUS3_tot) in tests of within-subject effects, and insignificantly when differentiated for Maximum Visual:
- Scenarios: (F (1.658, 130.988) = 8.752, p = 0.001, ηp2 = 0.100)
- Scenarios∗Vis_max: (F (1.658, 130.988) = 3.548, p = 0.040, ηp2 = 0.043)
Post hoc tests using the Bonferroni correction revealed that favorable scores for PEU decreased insignificantly from Scenario 1 to Scenario 2 by an average of 1.020 points (p = 0.294) but declined significantly from Scenario 1 to Scenario 3 by an average of 3.357 points (p = 0.002). An insignificant decrease was noted from Scenario 2 to Scenario 3 by an additional 2.337 points (p = 0.033). The differences in scores were meaningful between Scenarios 1 and 2 (PEUS1_tot and PEUS2_tot) and Maximum Visual (Vis_max) = No and again between Scenarios 2 and 3 (PEUS2_tot and PEUS3_tot) and Maximum Visual (Vis_max) = No. A significant difference was, however, noted in Scenario 3 (PEUS3_tot) compared to Scenarios 1 and 2, as well as Maximum Visual = Yes versus Maximum Visual = No. Again, a 10% decrease in mean score for Maximum Visual = No was noted in Scenario 3 as compared to Scenario 2, indicating a significant decrease in PEU for participants selecting TAO. Interestingly, there was a 1% increase in PEU for participants selecting VAO for Scenario 2 as compared to Scenario 1. Additionally, for the first time in this analysis, within Scenario 1, TAO outscored VAO within a specific TAM component (PEU).
Via estimated marginal means between-subjects, where Maximum Visual = Yes or Maximum Visual = No, inclusive only of PEU data with α = 0.0125 and Bonferroni correction, pairwise comparisons yielded only a 1.229 point mean difference in favor of VAO, insignificant at p = 0.362. As such, there was not a significant main effect of Maximum Visual scores (F (1, 79) = 0.842, p = 0.362, ηp2 = 0.011) on the level of acceptance of alert output, as indicated by the sum of participants’ scores for PEU. These results are best represented visually, as noted in Figure 7.
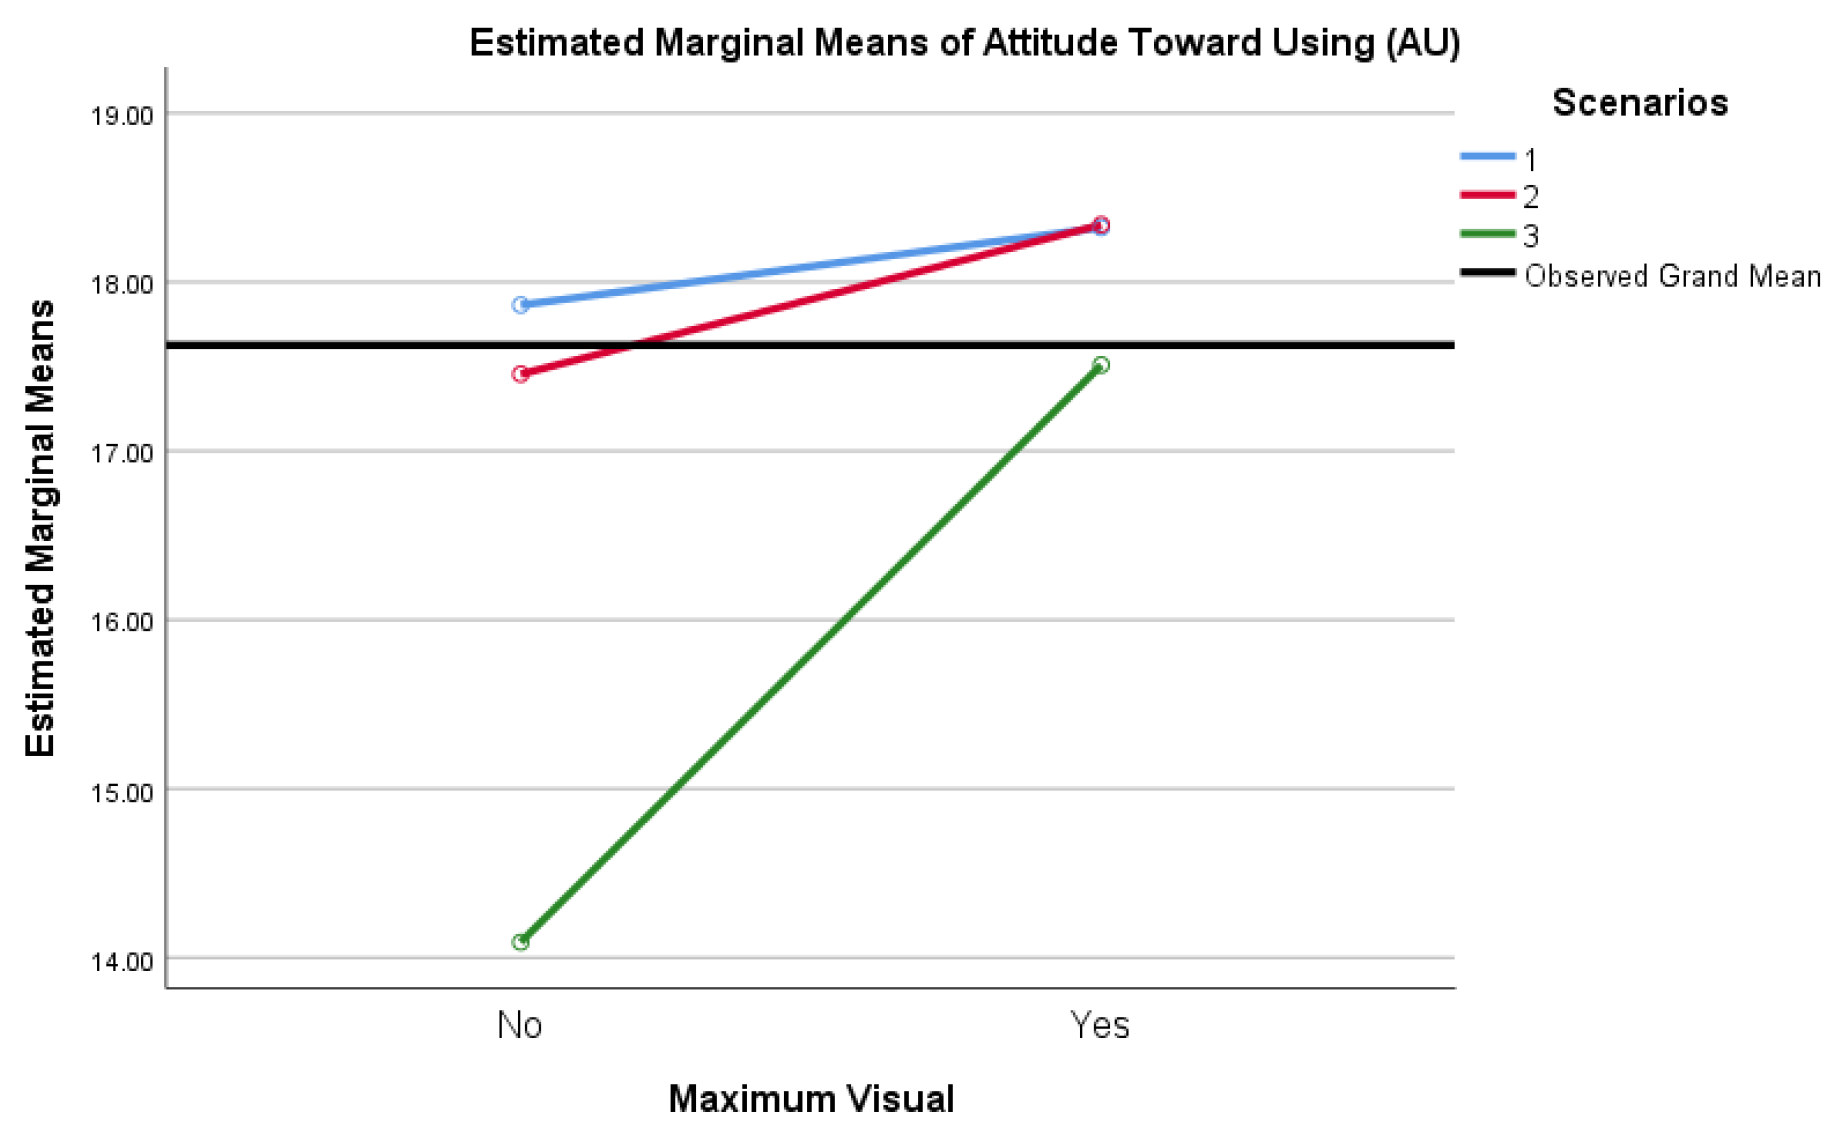
3.11. Mixed ANOVA—Attitude toward Using (AU)
Two-way mixed ANOVA with Bonferroni correction, computed using α = 0.0125, was performed for AU in isolation. α = 0.0125 was applicable as one quarter of α = 0.05 given that the TAM measures related to AU represented one of four tests of related measures.
Mixed ANOVA was again applied, where the within-subjects variables equating to score totals for each of the three study scenarios were represented by Attitude2Use (AUS1_tot, AUS2_tot, and AUS3_tot), and between-subjects factors were again represented by Maximum Visual (Vis_max), labeled as Yes (n = 59) and No (n = 22).
Participants were presented with three scenarios exhibiting security alert output for the results of applied models, where the output was both VAO and TAO. A mixed ANOVA computed using α = 0.0125 with a Greenhouse–Geisser correction showed that scores varied significantly across scenarios specific to attitude toward using (AUS1_tot, AUS2_tot, and AUS3_tot) in tests of within-subject effects, and significantly again when differentiated for Maximum Visual:
- Scenarios: (F (1.669, 131.861) = 20.605, p < 0.001, ηp2 = 0.207)
- Scenarios∗Vis_max: (F (1.669, 130.988) = 8.159, p = 0.001, ηp2 = 0.094)
Post hoc tests using the Bonferroni correction revealed that favorable scores for AU decreased insignificantly from Scenario 1 to Scenario 2 by an average of 0.196 points (p = 1.000) but declined significantly from Scenario 1 to Scenario 3 by an average of 2.293 points (p < 0.001). A significant decrease was noted from Scenario 2 to Scenario 3 by an additional 2.097 points (p < 0.001). The differences in scores were not meaningful between Scenarios 1 and 2 (AUS1_tot and AUS2_tot) and Maximum Visual (Vis_max) = No, but were quite impactful between Scenarios 2 and 3 (AUS2_tot and AUS3_tot) and Maximum Visual (Vis_max) = No. As is consistent throughout this analysis, there was a significant difference noted in Scenario 3 (AUS3_tot) compared to Scenarios 1 and 2, as well as Maximum Visual = Yes versus Maximum Visual = No. A stark 19% decrease in mean score for Maximum Visual = No was noted in Scenario 3 as compared to Scenario 2, indicating a significant decrease in AU for participants selecting TAO. No change in AU was noted for participants selecting VAO for Scenario 2 as compared to Scenario 1. Also noteworthy was the lowest mean scores of all results recorded, specifically for TAO in Scenario 3, indicating a particularly poor attitude towards using TAO.
Via estimated marginal means between-subjects, where Maximum Visual = Yes or Maximum Visual = No, inclusive only of AU data with α = 0.0125 and Bonferroni correction, pairwise comparisons yielded a small 1.587 point mean difference in favor of VAO, insignificant at p = 0.036. As such, there was not a significant main effect of Maximum Visual scores (F (1, 79) = 4.566, p = 0.036, ηp2 = 0.055) on the level of acceptance of alert output, as indicated by the sum of participants’ scores for AU. These results are best represented visually, as noted in Figure 8.
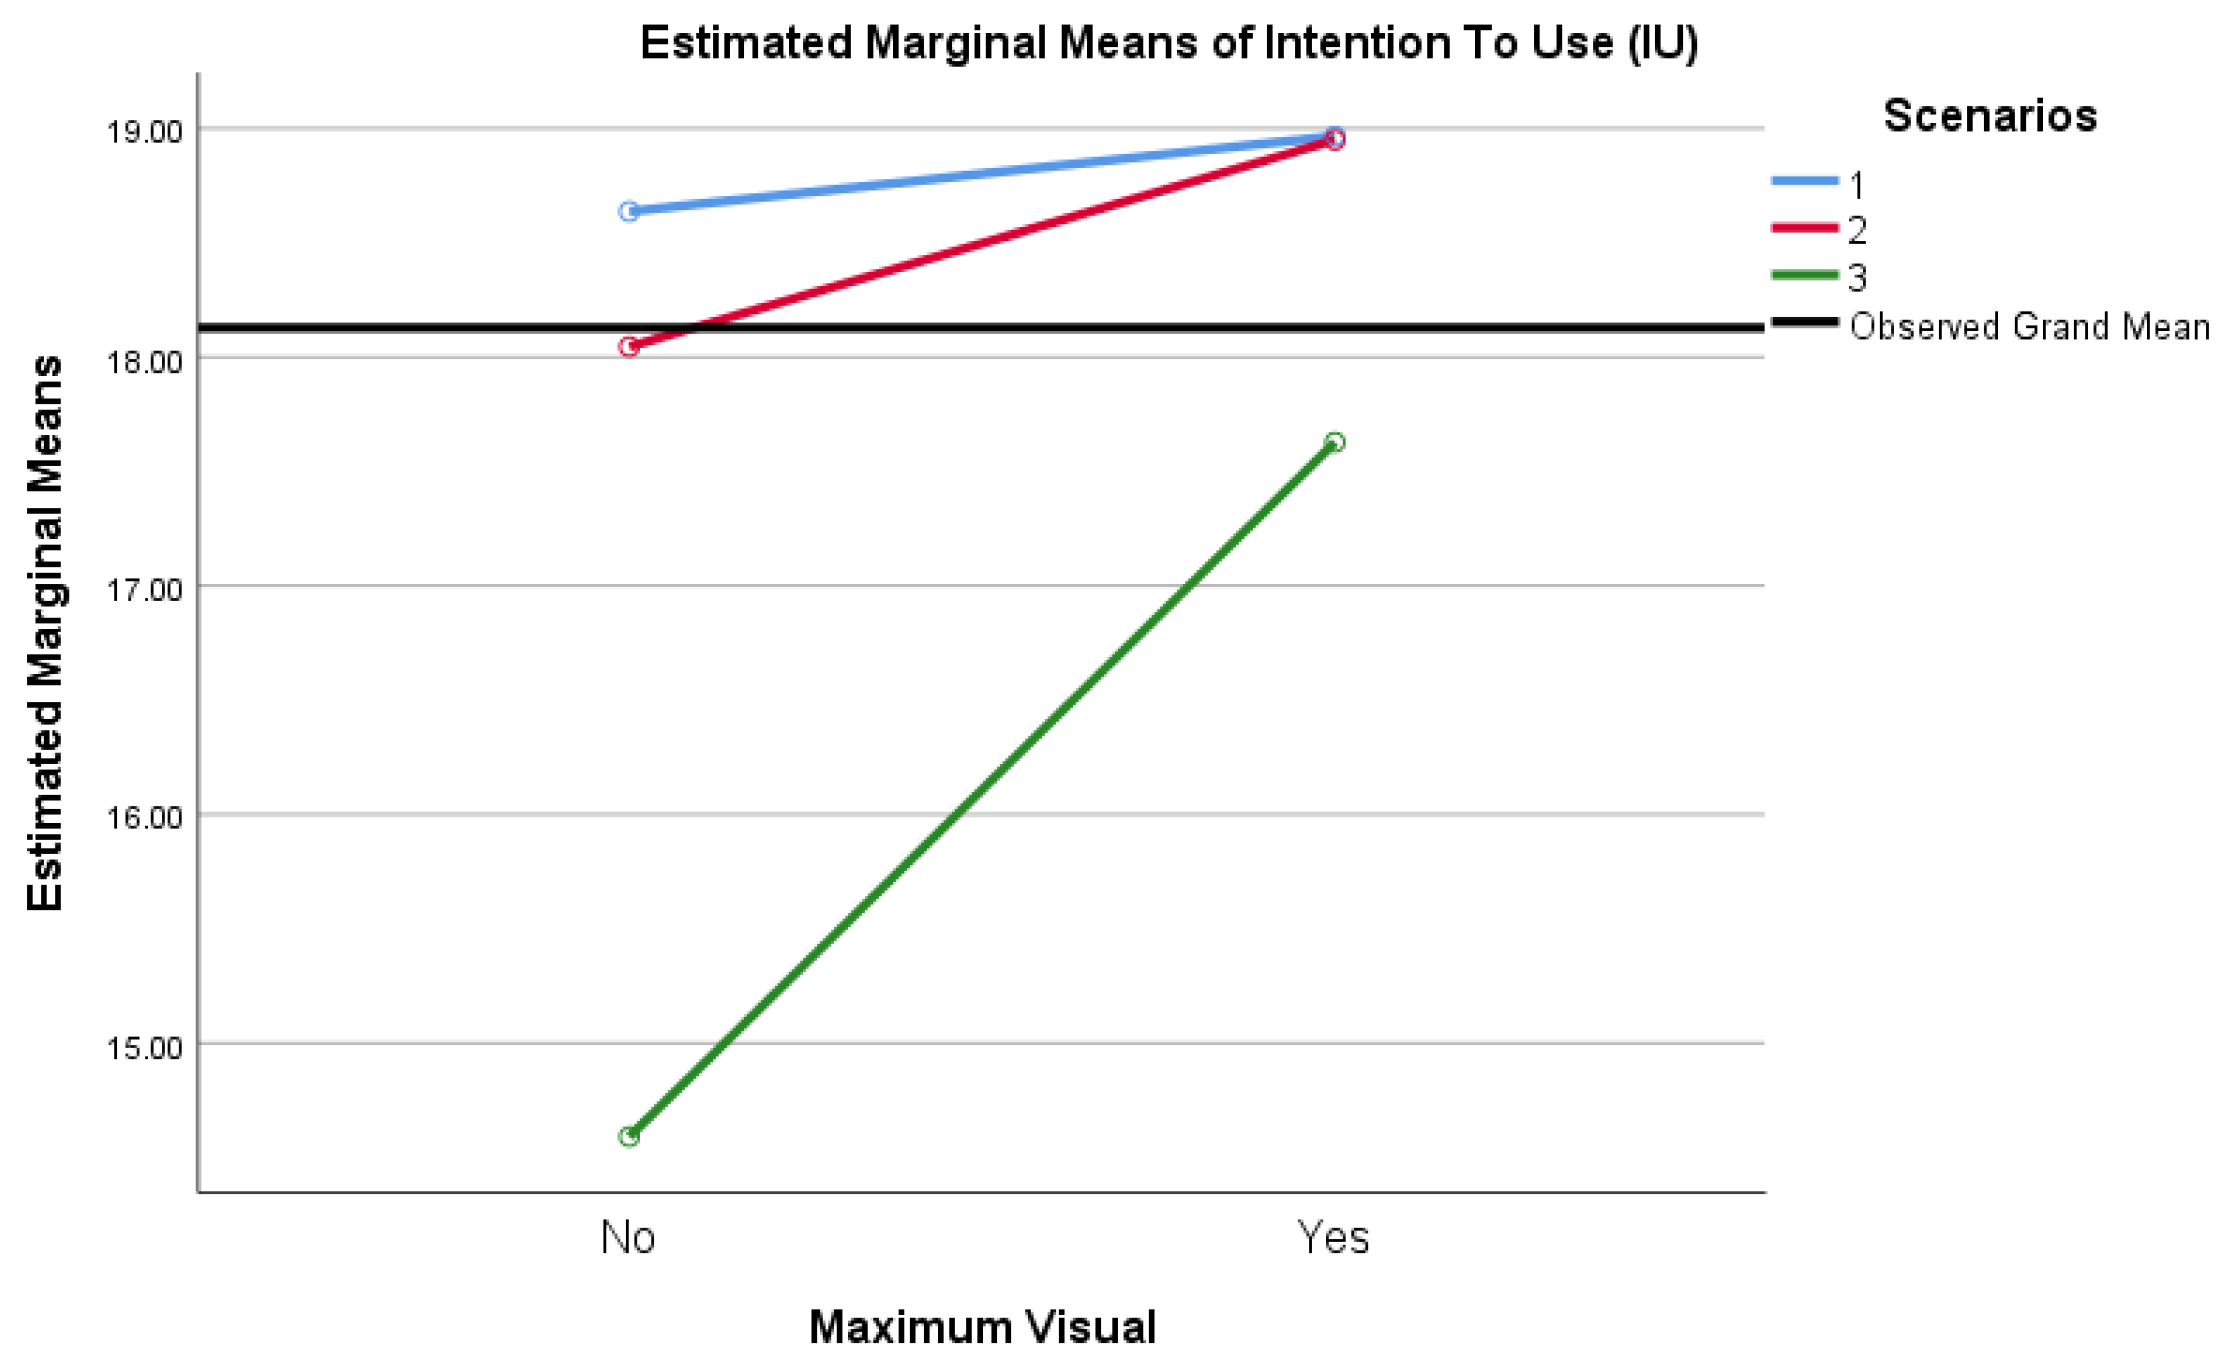
3.12. Mixed ANOVA—Intention to Use (IU)
Two-way mixed ANOVA (mixed ANOVA) with Bonferroni correction, computed using α = 0.0125, was performed for IU in isolation. α = 0.0125 was applicable as one quarter of α = 0.05 given that the TAM measures related to IU represent one of four tests of related measures.
Mixed ANOVA was again applied, where the within-subjects variables equating to score totals for each of the three study scenarios were represented by Intention2Use (IUS1_tot, IUS2_tot, and IUS3_tot), and between-subjects factors were again represented by Maximum Visual (Vis_max), labeled as Yes (n = 59) and No (n = 22).
Participants were presented with three scenarios exhibiting security alert output for the results of applied models, where the output was both VAO and TAO. A mixed ANOVA computed using α = 0.0125 with a Greenhouse–Geisser correction showed that scores varied significantly across scenarios specific to Intention to Use (IUS1_tot, IUS2_tot, and IUS3_tot) in tests of within-subject effects, and significantly again when differentiated for Maximum Visual:
- Scenarios: (F (1.447, 114.327) = 24.493, p < 0.001, ηp2 = 0.237)
- Scenarios∗Vis_max: (F (1.447, 114.327) = 5.728, p = 0.009, ηp2 = 0.068)
Post hoc tests using the Bonferroni correction revealed that favorable scores for IU decreased insignificantly from Scenario 1 to Scenario 2 by an average of 0.304 points (p = 0.758) but declined significantly from Scenario 1 to Scenario 3 by an average of 2.692 points (p < 0.001). A significant decrease was noted from Scenario 2 to Scenario 3 by an additional 2.388 points (p < 0.001). The differences in scores were not meaningful between Scenarios 1 and 2 (IUS1_tot and IUS2_tot) and Maximum Visual (Vis_max) = No, but were quite impactful between Scenarios 2 and 3 (IUS2_tot and IUS3_tot) and Maximum Visual (Vis_max) = No. As is consistent throughout this analysis, there was a significant difference noted in Scenario 3 (IUS3_tot) compared to Scenarios 1 and 2, as well as Maximum Visual = Yes versus Maximum Visual = No. Again, a substantial 19% decrease in mean score for Maximum Visual = No was noted in Scenario 3 as compared to Scenario 2, indicating a significant decrease in IU for participants selecting TAO. As is the case for AU, no change in IU was noted for participants selecting VAO for Scenario 2 as compared to Scenario 1. Also noteworthy was the largest percentage of decrease in mean scores of all results recorded, specifically for Scenario 3, indicating that intention to use was low for any aspect of Scenario 3, TAO, or VAO.
Via estimated marginal means between-subjects, where Maximum Visual = Yes or Maximum Visual = No, inclusive only of IU data with α = 0.0125 and Bonferroni correction, pairwise comparisons yielded a small 1.423 point mean difference in favor of VAO, insignificant at p = 0.040. As such, there was not a significant main effect of Maximum Visual scores (F (1, 79) = 4.378, p = 0.040, ηp2 = 0.053) on the level of acceptance of alert output, as indicated by the sum of participants’ scores for IU. These results are represented visually in Figure 9.
3.13. Summary of Hypothesis Testing
The null hypothesis states that there is no statistically significant difference in the level of acceptance of alert output between those choosing VAO and those having some or complete preference for TAO, with VAO and TAO being generated via data science/machine learning methods as predicted by the TAM. The null hypothesis was rejected via non-parametric and parametric methods. Table 9 represents non-parametric outcomes per an independent samples Mann–Whitney U test.
The Mann–Whitney U test indicates that there was a significant difference (U = 863.5, p = 0.023) between the respondents who selected visual output across all scenarios (n = 59) as compared to the respondents who provided mixed responses (n = 22).
Table 10 represents the outcomes for parametric tests of within-subjects effects.
The mixed ANOVA using α = 0.05 with a Greenhouse–Geisser correction was significant when differentiated for Maximum Visual: F (1.455, 114.915) = 5.634, p = 0.010.
Table 11 represents the outcomes for parametric tests of between-subjects effects.
The mixed ANOVA using α = 0.05 with Bonferroni adjustment was significant: (F (1, 79) = 4.111, p = 0.046.
In summary, the null hypothesis was rejected, as follows:
- Non-parametric: U = 863.5, p = 0.023
- Parametric:
- ○
- Within-subjects: (F (1.455, 114.915) = 5.634, p = 0.010, ηp2 = 0.067)
- ○
- Between-subjects: (F (1, 79) = 4.111, p = 0.046, ηp2 = 0.049)
As such, for RQ1: is there a difference in the level of acceptance of security alert output between those with a preference for VAO and those with a preference for TAO, with VAO and TAO generated via data science/machine learning methods, as predicted by the TAM? the answer is yes.
Additional sub-questions were examined in this analysis. Specifically, the sub-questions are stated as:
- SQ1: Does the adoption of VAO have a significant impact on the four individual TAM components: PU, PEU, AU, and IU?
- SQ2: Does the adoption of TAO have a significant impact on the four individual TAM components: PU, PEU, AU, and IU?
Outcomes indicate mixed results in answering the sub-questions. Table 12 states the results of within-subjects effects per individual TAM components.
The within-subjects findings indicated that PU and PEU were not significantly influenced by the adoption of VAO or TAO, while AU and IU were significantly influenced by the adoption of VAO. Table 13 states the results of between-subjects effects per individual TAM components.
The between-subjects findings indicate that PU was the only TAM component to be significantly influenced by the adoption of VAO.
As a result, the answer to SQ1 is yes, in part:
- The TAM components PU and PEU were not significantly influenced by the adoption of VAO within-subjects, while AU and IU were significantly influenced by the adoption of VAO within-subjects.
- The TAM component PU was significantly influenced by the adoption of VAO between-subjects.
The answer to SQ2 is universally no. No individual TAM component was significantly influenced by TAO adoption, and TAO adoption trailed VAO in near totality.
3.14. Summary
The results indicate that there was a difference in acceptance as predicted by TAM. The dependent variable, security analysts’ level of acceptance of security alert output, and the two independent variables, Scenario and ML/DS-generated alert output (TAO and VAO), were assessed with non-parametric and parametric methods. Both the Mann–Whitney U test and the mixed ANOVA determined that there was a difference between the acceptance of VAO and TAO in favor of VAO. The mixed ANOVA also demonstrated that two of the TAM factors, AU and IU, were influenced by the adoption of VAO and TAO.
4. Discussion
4.1. Discussion of the Results
This study sought to determine if there is a difference between the adoption of VAO and TAO generated via data science/machine learning methods as predicted by the TAM. The related hypothesis tested for significant differences in the level of acceptance of alert outputs between those preferring VAO in all scenarios and those preferring TAO in some or all scenarios, as predicted by the TAM. The null hypothesis was rejected. A non-parametric test, the Mann–Whitney test, indicated a significant difference in the level of acceptance of output between those preferring visual alerts in all scenarios, and other preferences (U = 863.5, p = 0.023). This result was repeated in the between-subjects element of a mixed ANOVA, F (1, 79) = 4.111, p = 0.046, ηp2 = 0.049. The within-subjects element of the mixed ANOVA, relating to different responses to each scenario, was also statistically significant, F (1.455, 114.915) = 5.634, p = 0.010, ηp2 = 0.067. These results indicate a statistically significant difference in perception that favors VAO.
4.2. Original Contribution to the Body of Knowledge
This study begins to close a gap in the body of knowledge and represents opportunities for additional research. Prior studies have focused exclusively on specific tenets discussed herein, but not in aggregate or totality. Studies focused on visual analytics versus text-oriented interfaces, while robust, did not factor for scale or usability, nor efficiencies gained from ML/DS. Other research focused on security operations at scale to address data overload and complexity but did not address solutions for an improved analyst experience and usability with visualization. More studies addressed detailed ML/DS opportunities leading to increased efficiency and detection, but again with no focus on alert output and usability. This research intentionally joined these tenets to improve security analysts’ experience with optimized alert output derived from ML/DS to address challenges of scale, detection fidelity, and usability. This contribution to the body of knowledge enables industry and academia to further refine security detection methods and products to reduce risk and better protect organizations. Specific contributions follow, and are discussed further in Section 4.4:
- Enables industry, service, and application providers to develop, deploy, and utilize tools and capabilities that include visualizations for alert output.
- Indicates that the interface for security analysts working daily with such tools and capabilities offers a favorable user experience that is rich in visual features.
- Clarifies that issues specific to this study’s problem statement can be rectified with visual alert output derived from machine learning and data science intended to reduce the burden on security analysts.
4.3. Limitations
This study’s results did not conform to expectations for normality, exhibiting a noteworthy skew towards strongly agree, or a 7 on the Likert scale. Bias may have been introduced in two distinct ways. First, TAM-based user experience (UX) studies are best delivered using a left-to-right layout, where 1 = Extremely disagree and 7 = Extremely agree [18]. Additionally, Lewis suggested that all questionnaire items have a positive tone such that greater levels of agreement indicate a better user experience [18]. This could explain why the normality histograms as seen in Figure 2, Figure 3 and Figure 4 show such a strong skew to the right (strongly agree). Second, the researcher may have introduced additional bias by describing the VAO with a caveat stating that users who selected visual output would have the ability to mouse over the graphical interface and interact with specific data points. No such additional benefit or opportunity was discussed for users who preferred TAO.
Scenario 3 included a dynamic, animated visualization, where alert counts moved through days of the month over a five-month period. The researcher asserts that this visual was not met with positive perception and likely viewed as of low quality and difficult to interpret as compared to the static visuals seen in Scenarios 1 and 2. Additionally, the researcher did not randomize the scenarios as delivered to participants. As such, all participants received the scenarios in the same order. Thus, order effects could explain the decline in positive perception of Scenario 3 for participants. Order effects refer to the phenomenon where different orders for the presentation of questions, or response alternatives, may systematically influence respondents’ answers [28]. Scores may decrease over time from fatigue, or increase due to learning, and order effects can interfere with estimates of the effect of the treatment itself during analysis, a disadvantage of repeated measures designs [29].
4.4. Implications for Practice
The most significant implications for practice as determined from this study’s results are simple. Develop, deploy, and utilize tooling and capabilities that include visualizations for alert output. Better still, ensure that the interface imposed on the security analysts working daily with such tooling and capabilities offers a favorable user experience that is rich in visual features, including additional right-click context (additional exploratory analytics available via a mouse right-click menu). Ben-Asher and Gonzalez determined that a high volume of intrusion alerts to be processed, coupled with excessive false-positive alerts, challenges human cognitive capabilities in accurately detecting an attack [30]. This study’s findings indicate an opportunity to rectify these issues with the benefits of visual alert output derived from machine learning and data science intended to reduce the burden on security analysts.
4.5. Recommendations for Future Study
A future study that builds on this study’s findings might incorporate a third option for participants: text alert output, visual alert output, or both. Security analysts would likely seek an initial visual alert inclusive of the options to dive deeper into the raw data. A future study could expose the degree to which analysts may seek such multifaceted options.
Results specific to Scenario 3 revealed a noteworthy decline in perception and satisfaction for the visual alert output included with the scenario. Given that this visual alert output was a dynamic animation unlike its static counterparts in Scenarios 1 and 2, a future study could further explore the perceptions of, and interactions with, dynamic visualizations versus static visualizations. Even more stark was the dip in perception and satisfaction for the text alert output included with Scenario 3. Future research could further explore the layout of data tables, including satisfaction with a variety of included fields and column headings.
Performance-based experimentation represents a potential focus area for future research, with attention to key performance indicators and metrics and analysis of the speed to conclusions as a comparison of TAO versus VAO. While this study’s delimitations prevented true experimentation, the premise of presenting participants with actionable scenarios while measuring their response time, accuracy, and efficacy would provide more accurate assessment of VAO versus TAO’s impact on performance.
5. Conclusions
Organizations dealing with a high volume of security alert and event data, that are also facing a high burden due to alert overload, should consider implementing features and capabilities that incorporate visual alert output. These organizations risk data breach, loss of valuable human resources, reputation, and revenue due to excessive security alert volumes and a lack of fidelity in security event data. Visualization can benefit security analysts faced with these burdens on behalf of their organizations. This quantitative, quasi-experimental, explanatory study determined that security analysts perceive improved usability of security alert output that is visualized rather than text-based. The related hypothesis tested for significant differences in the level of acceptance of output between those affirming a maximum visual preference (three out of three scenarios) and those showing a preference for text in at least one scenario. The results determined that those showing maximum visual preference had a significantly higher acceptance of alert output (U = 863.5, p = 0.023). This finding was also supported by the main between-subjects effect of a mixed ANOVA, F (1, 79) = 4.111, p = 0.046, ηp2 = 0.049. The ANOVA’s within-subjects main effect (scenario) was also statistically significant, F (1.455, 114.915) = 5.634, p = 0.010, ηp2 = 0.067. All supporting data are available with Supplementary Martials, including a literature review. These findings represent an opportunity to enhance and enable higher-order analysis, including detection development, tuning, and validation, as well as threat hunting and improved investigations: cut the noise, hone the signal.
Supplementary Materials
The following supporting information can be downloaded at: https://github.com/holisticinfosec/Optimized-Alerts-Usability-Study (accessed on 24 May 2022).
Funding
This research received no external funding.
Institutional Review Board Statement
The study was conducted in accordance with the Declaration of Helsinki, and approved by the Institutional Review Board of Capitol Technology University (approved 28 September 2020).
Informed Consent Statement
Informed consent was obtained from all subjects involved in the study.
Conflicts of Interest
The author declares no conflict of interest.
References
- Khan, M. Security Analysts Are Overworked, Understaffed and Overwhelmed—Here’s How AI Can Help. Available online: https://securityintelligence.com/security-analysts-are-overworked-understaffed-and-overwhelmed-heres-how-ai-can-help (accessed on 21 September 2020).
- Cambridge Intelligence. Visualizing Cyber Security Threats. Available online: https://cambridge-intelligence.com (accessed on 1 May 2021).
- Slatman, H. Unboxing Security Analytics: Towards Effective Data Driven Security Operations; Computer Science, University of Twente: Enschede, The Netherlands, 2016. [Google Scholar]
- Dimensional Research. 2020 State of SecOps and Automation. Available online: https://www.sumologic.com/brief/state-of-secops (accessed on 5 May 2021).
- Bartos, V.; Zadnik, M.; Habib, S.M.; Vasilomanolakis, E. Network entity characterization and attack prediction. Future Gener. Comput. Syst. 2019, 97, 674–686. [Google Scholar] [CrossRef] [Green Version]
- Sundaramurthy, S.C.; Bardas, A.G.; Case, J.; Ou, X.; Wesch, M.; McHugh, J.; Rajagopalan, S.R. A Human Capital Model for Mitigating Security Analyst Burnout. In Proceedings of the Symposium on Usable Privacy and Security, Ottawa, CA, USA, 22–24 July 2015. [Google Scholar]
- Paul, C.L.; Dykstra, J. Understanding operator fatigue, frustration, and cognitive workload in tactical cybersecurity operations. J. Inf. Warf. 2017, 16, 1–11. [Google Scholar]
- FireEye. The Numbers Game: How Many Alerts Is Too Many to Handle? Available online: https://www.fireeye.com/offers/rpt-idc-numbers-game-special-report.html (accessed on 11 June 2020).
- Seals, T. Less Than 1% of Severe/Critical Security Alerts Are Ever Investigated. Available online: https://www.infosecurity-magazine.com/news/less-than-1-of-severe-critical (accessed on 12 July 2021).
- Oltsik, J. The Problem with Collecting, Processing, and Analyzing More Security Data. Available online: https://www.esg-global.com/blog/the-problem-with-collecting-processing-and-analyzing-more-security-data (accessed on 10 April 2021).
- CriticalStart. The Impact of Security Alert Overload. Available online: https://www.criticalstart.com (accessed on 10 April 2021).
- Kohgadai, A. Alert Fatigue: 31.9% of IT Security Professionals Ignore Alerts. Available online: https://www.skyhighnetworks.com/cloud-security-blog/alert-fatigue-31-9-of-it-security-professionals-ignore-alerts (accessed on 10 April 2021).
- Chickowski, E. Every Hour SOCs Run, 15 Minutes Are Wasted on False Positives. Available online: https://securityboulevard.com/2019/09/every-hour-socs-run-15-minutes-are-wasted-on-false-positives (accessed on 2 September 2019).
- Ponemon. 2020 Devo SOC Performance Report: A Tale of Two SOCs. Available online: https://www.devo.com (accessed on 8 February 2021).
- Giacobe, N.A. Measuring the Effectiveness of Visual Analytics and Data Fusion Techniques on Situation Awareness in Cyber-Security; Penn State University: State College, PA, USA, 2013. [Google Scholar]
- Venkatesh, V.; Davis, D. A theoretical extension of the technology acceptance model: Four longitudinal field studies. Inf. Syst. Res. 2000, 46, 186–204. [Google Scholar] [CrossRef] [Green Version]
- Davis, F.D. Perceived Usefulness, Perceived Ease of Use, and User Acceptance of Information Technology. MIS Q. 1989, 13, 319–340. [Google Scholar] [CrossRef] [Green Version]
- Lewis, J.R. Comparison of Four TAM Item Formats: Effect of Response Option Labels and Order. J. Usability Stud. 2019, 14, 224–236. [Google Scholar]
- Deutskens, E.; De Ruyter, K.; Wetzels, M.; Oosterveld, P. Response rate and response quality of Internet-based surveys: An experimental study. Mark. Lett. 2004, 15, 21–36. [Google Scholar] [CrossRef] [Green Version]
- Lumen. Repeated-Measures ANOVA. Boundless Statistics. Available online: https://courses.lumenlearning.com/boundless-statistics/chapter/repeated-measures-anova (accessed on 19 August 2021).
- Lewis, J.R.; Utesch, B.S.; Maher, D.E. Measuring Perceived Usability: The SUS, UMUX-LITE, and AltUsability. Int. J. Hum. Comput. Interact. 2015, 31, 496–505. [Google Scholar] [CrossRef]
- Szajna, B. Software evaluation and choice: Predictive validation of the technology acceptance instrument. MIS Q. 1994, 18, 319. [Google Scholar] [CrossRef]
- Shahrabi, M.A.; Ahaninjan, A.; Nourbakhsh, H.; Ashlubolagh, M.A.; Abdolmaleki, J.; Mohamadi, M. Assessing psychometric reliability and validity of Technology Acceptance Model (TAM) among faculty members at Shahid Beheshti University. Manag. Sci. Lett. 2013, 3, 2295–2300. [Google Scholar] [CrossRef]
- U.S. Bureau of Labor Statistics. Information Security Analysts: Occupational Outlook Handbook: U.S. Bureau of Labor Statistics. Available online: https://www.bls.gov/ooh/computer-and-information-technology/information-security-analysts.htm (accessed on 14 June 2019).
- Barlett, J.E.; Kotrlik, J.W.; Higgins, C.C. Organizational research: Determining appropriate sample size in survey research. Inf. Technol. Learn. Perform. J. 2001, 19, 43–50. [Google Scholar]
- Hoskin, T. Parametric and Nonparametric: Demystifying the Terms. Available online: https://www.mayo.edu/research/documents/parametric-and-nonparametric-demystifying-the-terms/doc-20408960 (accessed on 19 August 2021).
- Lane, D.M. Online Statistics Education: A Multimedia Course of Study. Available online: https://onlinestatbook.com (accessed on 19 August 2021).
- Strack, F. Order Effects in Survey Research: Activation and Information Functions of Preceding Questions. In Context Effects in Social and Psychological Research; Schwarz, N., Sudman, S., Eds.; Springer: New York, NY, USA, 1992; pp. 23–34. [Google Scholar]
- Minitab Blog Editor. Repeated Measures Designs: Benefits, Challenges, and an ANOVA Example. Available online: https://blog.minitab.com/en/adventures-in-statistics-2/repeated-measures-designs-benefits-challenges-and-an-anova-example (accessed on 19 August 2021).
- Ben-Asher, N.; Gonzalez, C. Effects of cyber security knowledge on attack detection. Comput. Hum. Behav. 2015, 48, 51–61. [Google Scholar] [CrossRef]
Figure 1.
Theoretical Framework: Technology Acceptance Model. Adapted from “Perceived Usefulness, Perceived Ease of Use, and User Acceptance of Information Technology” [17].
Figure 1.
Theoretical Framework: Technology Acceptance Model. Adapted from “Perceived Usefulness, Perceived Ease of Use, and User Acceptance of Information Technology” [17].

Figure 2.
Standardized residual normality for Scenarios 1–3.

Figure 3.
Independent samples Mann–Whitney U test results.

Figure 4.
Related samples Friedman’s two-way ANOVA by ranks.

Figure 5.
Estimated marginal means of all measures.

Figure 6.
Estimated marginal means—PU.

Figure 7.
Estimated marginal means—perceived ease use (PEU).

Figure 8.
Estimated marginal means—attitude toward using (AU).

Figure 9.
Estimated marginal means—intention to use (IU).


Table 1.
Variable and data types.
| RQ | Construct | Variable | Scale | Data |
|---|---|---|---|---|
| RQ1 | Level of acceptance | DV | Likert | Interval |
| RQ1 | Scenario (within-subjects) | IV | Likert | Interval |
| RQ1 | Alert output (between-subjects) | IV | Likert | Interval |
| SQ1 | Impact of adoption | DV | Likert | Interval |
| SQ1 | Scenario (within-subjects) | IV | Likert | Interval |
| SQ1 | Alert output (between-subjects) | IV | Likert | Interval |
| SQ2 | Impact of adoption | DV | Likert | Interval |
| SQ2 | Scenario (within-subjects) | IV | Likert | Interval |
| SQ2 | Alert output (between-subjects) | IV | Likert | Interval |
Table 2.
Research question and hypotheses testing.
| RQ | Type of Analysis | Variable | Scale | Data |
|---|---|---|---|---|
| RQ1 | Variance | IV-DV | Likert | H1, H2 |
| SQ1 | Variance | IV-DV | Likert | H1, H2 |
| SQ2 | Variance | IV-DV | Likert | H1, H2 |
Note. RQ = research question; SQ = sub-question; DV = dependent variable; IV = independent variable; H1 = null hypothesis; H2 = alternative hypothesis.
Table 3.
Response products.
| Valid | Frequency | Percent | Valid % | Cumulative % |
|---|---|---|---|---|
| 0 | 14 | 14.7 | 14.7 | 14.7 |
| 1 | 2 | 2.1 | 2.1 | 16.8 |
| 2 | 4 | 4.2 | 4.2 | 21.1 |
| 4 | 16 | 16.8 | 16.8 | 37.9 |
| 8 | 59 | 62.1 | 62.1 | 100 |
| Total | 95 | 100 | 100 |
Table 4.
Factors and descriptive statistics.
| Within-Subjects Factors | ||||
| Scenarios | Dependent Variable | |||
| 1 | S1_tot | |||
| 2 | S2_tot | |||
| 3 | S2_tot | |||
| Between-Subjects Factors | ||||
| Value Label | N | |||
| Maximum Visual | 0.00 | No | 22 | |
| 1.00 | Yes | 59 | ||
| Descriptive Statistics | ||||
| Maximum Visual | Mean | Std. Deviation | N | |
| S1_tot | No | 107.7273 | 11.65856 | 22 |
| Yes | 110.2034 | 15.15754 | 59 | |
| Total | 109.5309 | 14.26454 | 81 | |
| S2_tot | No | 104.7727 | 14.91223 | 22 |
| Yes | 109.9661 | 15.87556 | 59 | |
| Total | 108.5556 | 15.70032 | 81 | |
| S3_tot | No | 88.6364 | 29.03618 | 22 |
| Yes | 104.6102 | 21.62136 | 59 | |
| Total | 100.2716 | 24.7255 | 81 | |
Table 5.
Maximum Visual IVs (between-subjects factors).
| Frequency | Percent | Valid Percent | Cumulative Percent | ||
|---|---|---|---|---|---|
| Valid | No | 22 | 23.2 | 27.2 | 27.2 |
| Yes | 59 | 62.1 | 72.8 | 100.0 | |
| Total | 81 | 85.3 | 100.0 | ||
| Missing | 999.00 | 14 | 14.7 | ||
| Total | 95 | 100.0 | |||
Table 6.
Independent samples Mann–Whitney U test summary.
| Total N | 81 |
| Mann–Whitney U | 863.500 |
| Test Statistic | 863.500 |
| Standard Error | 94.140 |
| Standardized Test Statistic | 2.279 |
| Asymptotic Sig. (2-sided test) | 0.023 |
Table 7.
Related samples Friedman’s two-way ANOVA by ranks, summary.
| Total N | 81 |
| Test Statistic | 5.496 |
| Degree of Freedom | 2 |
| Asymptotic Sig. (2-sided test) | 0.064 |
Table 8.
Mauchly’s test of sphericity.
| Within-Subjects Effect | Mauchly’s W | Approx. Chi-Square | df | Sig. | Greenhouse–Geisser |
|---|---|---|---|---|---|
| Scenarios | 0.625 | 36.652 | 2 | 0.000 | 0.727 |
Table 9.
Means’ analysis—intention to use (IU).
| Maximum Visual | Mean | Std. Deviation | N | |
|---|---|---|---|---|
| IUS1_tot | No | 18.6364 | 2.05971 | 22 |
| Yes | 18.9661 | 2.66501 | 59 | |
| Total | 18.8765 | 2.50690 | 81 | |
| IUS2_tot | No | 18.0455 | 2.60909 | 22 |
| Yes | 18.9492 | 2.80039 | 59 | |
| Total | 18.7037 | 2.76335 | 81 | |
| IUS3_tot | No | 14.5909 | 5.11449 | 22 |
| Yes | 17.6271 | 4.16843 | 59 | |
| Total | 16.8025 | 4.61633 | 81 | |
Table 10.
Tests of within-subjects effects.
| Source | df | F | Sig. | Partial Eta Squared | Observed Power | |
|---|---|---|---|---|---|---|
| Scenarios∗Vis_max | Greenhouse–Geisser | 1.455 | 5.634 | 0.010 | 0.067 | 0.763 |
α = 0.05. ∗ = The impact of vis_max on the level of acceptance of output as mediated by Scenarios.
Table 11.
Tests of between-subjects effects.
| Source | df | F | Sig. | Partial Eta Squared | Observed Power | |
|---|---|---|---|---|---|---|
| Vis_max | Bonferroni | 1 | 4.111 | 0.046 | 0.049 | 0.517 |
α = 0.05.
Table 12.
Tests of within-subjects effects per individual TAM components.
| TAM Factor | Adjustment | df | F | Sig. | Partial Eta Squared | Observed Power |
|---|---|---|---|---|---|---|
| PU | Greenhouse–Geisser | 1.637 | 4.017 | 0.028 | 0.048 | 0.434 |
| PEU | Greenhouse–Geisser | 1.658 | 3.548 | 0.040 | 0.043 | 0.380 |
| AU | Greenhouse–Geisser | 1.669 | 8.159 | 0.001 | 0.094 | 0.819 |
| IU | Greenhouse–Geisser | 1.447 | 5.728 | 0.009 | 0.068 | 0.705 |
α = 0.0125.
Table 13.
Tests of between-subjects effects per individual TAM components.
| TAM Factor | Adjustment | df | F | Sig. | Partial Eta Squared | Observed Power |
|---|---|---|---|---|---|---|
| PU | Bonferroni | 1 | 7.643 | 0.007 | 0.088 | 0.584 |
| PEU | Bonferroni | 1 | 0.842 | 0.362 | 0.011 | 0.055 |
| AU | Bonferroni | 1 | 4.566 | 0.036 | 0.055 | 0.343 |
| IU | Bonferroni | 1 | 4.378 | 0.040 | 0.053 | 0.328 |
α = 0.0125.
Publisher’s Note: MDPI stays neutral with regard to jurisdictional claims in published maps and institutional affiliations. |
© 2022 by the author. Licensee MDPI, Basel, Switzerland. This article is an open access article distributed under the terms and conditions of the Creative Commons Attribution (CC BY) license (https://creativecommons.org/licenses/by/4.0/).
Share and Cite
MDPI and ACS Style
McRee, G.R. Improved Detection and Response via Optimized Alerts: Usability Study. J. Cybersecur. Priv. 2022, 2, 379-401. https://doi.org/10.3390/jcp2020020
AMA Style
McRee GR. Improved Detection and Response via Optimized Alerts: Usability Study. Journal of Cybersecurity and Privacy. 2022; 2(2):379-401. https://doi.org/10.3390/jcp2020020
Chicago/Turabian StyleMcRee, Griffith Russell. 2022. "Improved Detection and Response via Optimized Alerts: Usability Study" Journal of Cybersecurity and Privacy 2, no. 2: 379-401. https://doi.org/10.3390/jcp2020020