1. Introduction
Emergencies triggered by natural disasters that can trigger time-critical mass evacuations, such as the impending Tokai, Tonankai, and Nankai earthquakes and their associated tsunamis [
1,
2,
3], can cause a wide range of uncommon conditions such as non-functioning traffic signals, debris-scattered roads, pedestrians on main roads, and low lighting. Conditions such as traffic signal blackouts can be widespread, as occurred during the 2011 Tohoku Earthquake and Tsunami [
4]. These uncommon conditions can seriously hamper the progress of evacuation, prompting the need for extensive studies using advanced numerical models. Due to their low computational cost and simplicity, simple models [
5,
6] are widely used for tsunami evacuation simulations. Although such simple models can capture common scenarios such as traffic or pedestrian congestion reasonably well, they are either ineffective or incapable of modeling uncommon yet vital scenarios such as debris-scattered roads and pedestrians and cars at a junction with broken traffic signals. A versatile and powerful alternative approach is Agent-Based Models (ABMs) equipped with fully autonomous agents [
7]. Once software agents with sufficient capabilities to reproduce the fundamental behaviors of real evacuees’, such as speed vs. density characteristics, are developed, ABMs can be utilized to model different combinations of these uncommon scenarios as an emergent phenomenon of the agents’ interactions.
Probably driven by the industrial demand to ensure the fire safety of closed spaces, such as high-rise buildings and underground shopping malls, sophisticated ABMs such as EXODUS and EGRESS2002 have been developed; ref. [
8] provides a detailed list of the available ABMs for indoor evacuations. Unlike indoor applications, simple models are widely used for large-scale tsunami evacuations [
5,
6,
9], probably due to the complex conditions involved in tsunami evacuations and the computational challenges posed by the large number of evacuees and the size of the domain. Though simple ABMs capture the heterogeneous actions of evacuees, their agents are not fully autonomous. As an example, to ensure that the evacuation time of each agent is realistic, the speed of each agent is externally controlled according to a given fundamental diagram (i.e., speed vs. density relation) [
5,
6]. This lack of full autonomy of the agents makes simple models either ineffective or incapable of modeling important scenarios such as interruptions to traffic and pedestrians due to the debris scattered on roads and the vehicles and pedestrians at non-signalized junctions. Detailed accounts of autonomous agents for simulating tsunami evacuations are found in [
4,
7,
10]. Several publications have proposed autonomous agents capable of reproducing fundamental diagrams for pedestrians [
11,
12,
13] and different models of vehicles [
14]. Furthermore, the interactions of different modes of evacuation have been studied by [
15,
16]. It is rare to find vehicle–pedestrian interaction models at non-signalized junctions, and even the existing vehicle–vehicle interaction models, which are mostly based on collision avoidance algorithms [
17,
18,
19,
20,
21,
22], scheduling schemes [
23], and game theory [
24], do not reproduce realistic trajectories and speed profiles. According to authors knowledge, only Tomoyuki et al. [
4] have attempted to simulate car–pedestrian mode tsunami evacuation during a traffic signal blackout. They have used an agent-based modeling platform called Artisoc 4.0, in which agents’ speeds are set according to a suitable fundamental diagram (i.e., agents are not fully autonomous). The free-flow speed of cars at junctions were set to 10 km/h. Their paper does not provide information on how the car trajectories at junctions are modeled and how the cars and pedestrians interact at junctions.
The objective of this paper is to present a model to cover the above-discussed research gap in simulating non-signalized junctions such that important scenarios such as pedestrian–car mode evacuation during a traffic signal blackout can be accurately simulated. Specifically, we present details of how to model car trajectories at junctions and car speeds along those curved trajectories, identify cars and pedestrians on collision paths, accurately calculate the point of collision even for cars on merging trajectories, and estimate the time to collision. These accurate sensing abilities of car and pedestrian agents provides a strong basis on which a desired model of evacuees’ complex behaviors can be implemented. The rapid advancement of High-Performance Computing (HPC) capabilities has made it possible to simulate large domains (e.g., areas of several hundred square kilometers) using such computationally demanding models. However, existing HPC implementations of evacuation simulators have low parallel computing efficiency, and most can accommodate only several tens of thousands of agents; see [
11] for a detailed account available for parallel implementations. We implemented the proposed junction model in our existing ABM with high parallel computing efficiency so that large-scale problems can be simulated in a short time.
Our existing HPC-enhanced ABM includes a high-resolution grid model of the environment and complex autonomous agents capable of perceiving the featured in the grid model [
25,
26,
27,
28,
29]. The agents are equipped with functions to reproduce observed speed vs. density characteristics for pedestrian–pedestrian interaction, car–car interaction, and pedestrian–car interactions [
25,
26,
27]. In order to meet the high computational demand of the developed agents, our ABM is equipped with an HPC extension that can efficiently simulate tens of millions of agents in several hundreds of square kilometer regions using parallel computers [
29,
30,
31].
In the proposed new junction model, car trajectories are modeled using third-order B-splines [
32] to a sufficient accuracy, and the free-flow speeds of cars at junctions are approximated to match with the observations. The car agents are programmed to accurately calculate the potential points of collision with pedestrians and other cars at junctions and avoid collisions. As a demonstrative application of the developed non-signalized junction model, a hypothetical tsunami-triggered evacuation scenario, in which traffic signals are assumed to be rendered non-functioning by the preceding earthquake, is presented. Five scenarios, in which different percentages of slow-moving evacuees to use cars, were simulated to quantitatively evaluate the advantages of the use of cars. While the developed code is yet to be thoroughly validated before practical applications, the presented demonstrative scenarios indicate that a significant number of the needy can be allowed to use cars for evacuation if their routes and evacuation start time window are well planned.
A short description of the developed ABM is presented in
Section 2, while details of the non-signalized junctions are presented in
Section 3.
Section 4 presents the demonstrative application of tsunami evacuation with non-functioning traffic signals, and the last sections provide a discussion and a short summary.
2. An Agent-Based Model for Evacuation Simulation
The developed ABM consists of a high-resolution grid to capture the features of the environment, a graph of the topological connectivity of the traversable spaces of the grid, and autonomous agents mimicking the evacuees. The resolution of the grid is decided such that it approximates the simulated domain to a sufficient accuracy, and the grid is updated at suitable time intervals according to the physical disaster being simulated.
Let
be a set of
n number of agents, and the
ith agent be defined as
, where
and
represent the
’s state and update function, respectively.
, where
consists of states, such as speed, walking direction, size, gender, and age category, that can be observed or deduced by fellow evacuees, and the
consists information that are not deducible by or inaccessible to the fellow agent unless communicated, such as its past experiences, its target destination, and route. Similarly,
, where
consists of functions to exchange information with the neighboring agents, while the rest, such as decision making and moving, compose the private part
. Let the state of the simulated physical domain at time
t be represented by
,
be the region of the environment visible to the agent
at time
t, and the public states of all the agents visible to
be
. Then, the discrete time evolution of
can be expressed as:
The time evolution of the agents do not make them hop from cell-to-cell like in cellular automata. Instead, agents can freely move across grid cells, updating their positions as , where and are the position and velocity of agent a at time t.
2.1. Hybrid Model of the Environment
Though a sufficiently high-resolution grid can capture the physical details of the simulated region, grid data structures are computationally inefficient in path planning, storing agents experiences with reference to the spatial locations such that those experiences can be efficiently included in the decision-making process of the agents. To address these weakness of the grid data structures, the environment is modeled as a hybrid of a grid G and a graph , and the strengths of these data structures are exploited to efficiently simulate hundreds of square kilometers size domain in high resolution. A two-dimensional (2D) Cartesian grid approximates the state of the physical environment, where defines the state of the grid cell at time t. Connectivity of the traversable spaces in the grid is abstracted by a bidirectional graph , where and are the sets of links and nodes. Each link contains physical characteristics such as the width and length of , number of vehicle lanes, and allowed flow directions. Furthermore, statistics, such as the number of agents passed and their average speeds, are collected to each link.
Even though the grid is updated according to the physical disaster, neither the connectivity of the graph nor the physical characteristics stored in each link are updated. Therefore, the graph always contains topological connectivity of an ordinary day, severing as the base map in agents’ decision making. Hence, the discrete time evolution of the environment is defined by , where is an external function with which the state of each cell , is updated at suitable time intervals, (), according to the time evolution of the physical disaster (e.g., the progress of tsunami inundation).
Scanning the grid in high-resolution, agent
recognizes the features and changes of its visible surrounding, and important changes, such as blocked or inundated roads, and stores them in its private state
with reference to the links and nodes of the graph. The graph is equipped with various path-planning functions to support agents’ decision-making process. An agent can include its past experiences, such as the list of blocked paths it encountered and the statistics collected to graph links, in its decision making to avoid crowded or blocked routes PRIMA [
28].
2.1.1. Agents’ Update Function—f
The agents’ update function f, which defines the agents’ capabilities, is composed of a set of basic constituent functions ; . Some of the constitutive functions we have implemented are briefly explained below.
Scans the grid
G around an agent’s current location in high resolution and creates the boundary of visibility (see
Figure 1) [
25]. The scanned distance is equal to the agent’s sight distance, which can be 50 m or longer depending on an agent’s physical abilities;
- :
Analyzes the visual boundary and extracts features such as open paths and obstacles [
25];
- :
Chooses a suitable open path based on the obstacles and openings identified in
and the route followed by the agent [
25]
- :
Recognizes neighbor agents to interact with, based on visibility and interaction radius;
- :
Finds a collision-free walking direction along which an agent can move closer to its preferred speed for a given minimum period of comfortable time
to reach the opening chosen in
, evading collision with the neighbors identified in agents
. The preferred comfortable time
and other parameters are tuned to reproduce observed fundamental diagrams [
25,
26];
- :
Finds paths with desired characteristics [
27];
- :
When navigating in a damaged environment, analyzes the data from
to identify whether the desired path is blocked [
27];
- :
Finds a suitable agent and follows it, if the environment is not familiar;
- :
Use pedestrian side walks, when available;
- :
Control the movement of car agents at junctions obeying traffic signals, maintaining safe distances with cars and pedestrians on potential collision courses, and maintaining safe speeds according to the curvature of trajectory;
- :
Extended version of without centralized flow control by traffic lights to enable cars move at non-signalized junctions;
- :
etc.;
- :
Executes desired actions such as move;
- :
Updates an agent’s state.
The white-colored, partially circular boundary in
Figure 1 shows the boundary of visibility produced by the constituent function
of a pedestrian agent. Each individual agents scan its surrounding in a similar manner to identify available paths, obstacles, and visible neighboring agents. Agents store obstacles or important experiences in their memory with respect to the corresponding link or node of the graph
so that those experiences can be taken into account in future decision making.
2.1.2. Agents’ Specializations
Since it is impractical to specialize every and , we first generate a set of template which are composed as . and are defined according to the role of the agent subgroup . As an example, agent subset is defined by designing a suitable to mimic a police officer during an emergency evacuation. Furthermore, police officers with different physical abilities are defined by randomly setting the variables in according to a suitable distribution. Short descriptions of four types of implemented agents are given below.
- :
Represents a local resident of the simulated area. To mimic the familiarity of the living neighborhood, possess a mental map of the environment (i.e., access to and most path finding algorithms) and uses to find paths according to its desired constrains and past experiences. Additionally, they know the locations of possible evacuation areas.
- :
Represents non-resident people in the interest area. They do not possess any additional information of the environment aside what they can visually perceive (i.e., ). Their main evacuation mechanism is to seek a visible high ground or follow other evacuees using .
- :
Represents multiple people (one or more evacuees) traveling by a car. possess a mental map of the environment, and equipped with logic to drive through non-signalized junctions, avoiding collisions with pedestrians and other cars.
- :
This type of agent represents figures of authority, such as law enforcement and event staff. Their main task is to facilitate fast and smooth evacuation by independently or collectively planning the areas to be covered by each with and commanding or delivering information to other agents with . also possess a mental map of the environment which can be updated through communication.
4. Demonstrative Application
As a demonstrative application of the presented model of non-signalized junctions, we simulated a hypothetical evacuation scenario in a coastal city shown in
Figure 8. It is assumed that emergency evacuation was advised at 11 p.m., and a total of 61,218 people are expected to evacuate to above 10 m elevation. Assuming most of the people were at home, the agents are initialized closer to the buildings, setting the number of agents around each building according to its floor area.
While the recommended mode of evacuation is walking, significant use of cars was observed during past major tsunamis such as 2011 Great East Japan Earthquake. Initiated by this use of cars, it is often discussed how many needy people can be allowed to use cars without negatively affecting the expected progress of pedestrian-mode evacuation. To quantitatively evaluate the effect of allowing the needy (e.g., elderly, expecting mothers, etc.) to use cars for evacuation, we made a given p percentage of slow-moving people use cars, assuming each car carries three persons. The slowest people living at least 1 km away from the nearest evacuation were converted to cars. We considered the following five scenarios. In the rest of this section, we refer to these scenarios by the number in the following list:
All the evacuees walk;
6% of the slowest were allowed to use cars; total of 1224 cars;
9% of the slowest were allowed to use cars; total of 1836 cars;
15% of the slowest were allowed to use cars; total of 3060 cars;
15% of the slowest were allowed to use cars, and some roads were restricted either only to pedestrians or cars to reduce the interactions between them.
The statistics of the evacuation start time, speeds, and the distance to closest evacuation area of the pedestrian and car agents, for the scenario with 6% cars users, are shown in
Figure 9 and
Figure 10. Due to the relatively small number of cars, all five scenarios have similar distributions. Since we considered a nighttime evacuation, we assumed that people preferred to walk on roads wider than 4m; the pedestrian agents are allowed to use roads of any widths, but they are programmed to give higher preference to use wider than 4 m roads when available [
28]. Furthermore, we assumed that the earthquake had rendered the traffic signals non-functioning, and the non-signalized junction models presented in the
Section 3 was used to model the car–car and car–pedestrian interactions on roads and at the junctions. In all the scenarios, evacuation areas for car agents were separated from pedestrians’ to prevent congestion at the entrances to evacuation areas, and the number of cars to each evacuation area were controlled to reduce long traffic jams and limit the number according to the available parking area. While in the first four scenarios, agents were allowed to choose the closest evacuation area without any restriction of their routes of choice, in the fifth scenario, we restricted some road stretches such that either only cars or pedestrians travel along those road stretches. However, at junctions, pedestrians (cars) were allowed to cross a road dedicated for cars (pedestrians). We expected that these restrictions of road usage would reduce the friction between cars and pedestrians, making it possible to use large number of cars. In addition, in all the scenarios, car agents were forced to start evacuation within the first 20 min from the time of tsunami warning (see
Figure 9b). This latter settings mimic the restriction of evacuation start time window for the car users, as a strategy of reducing interactions between cars and pedestrian mode evacuees.
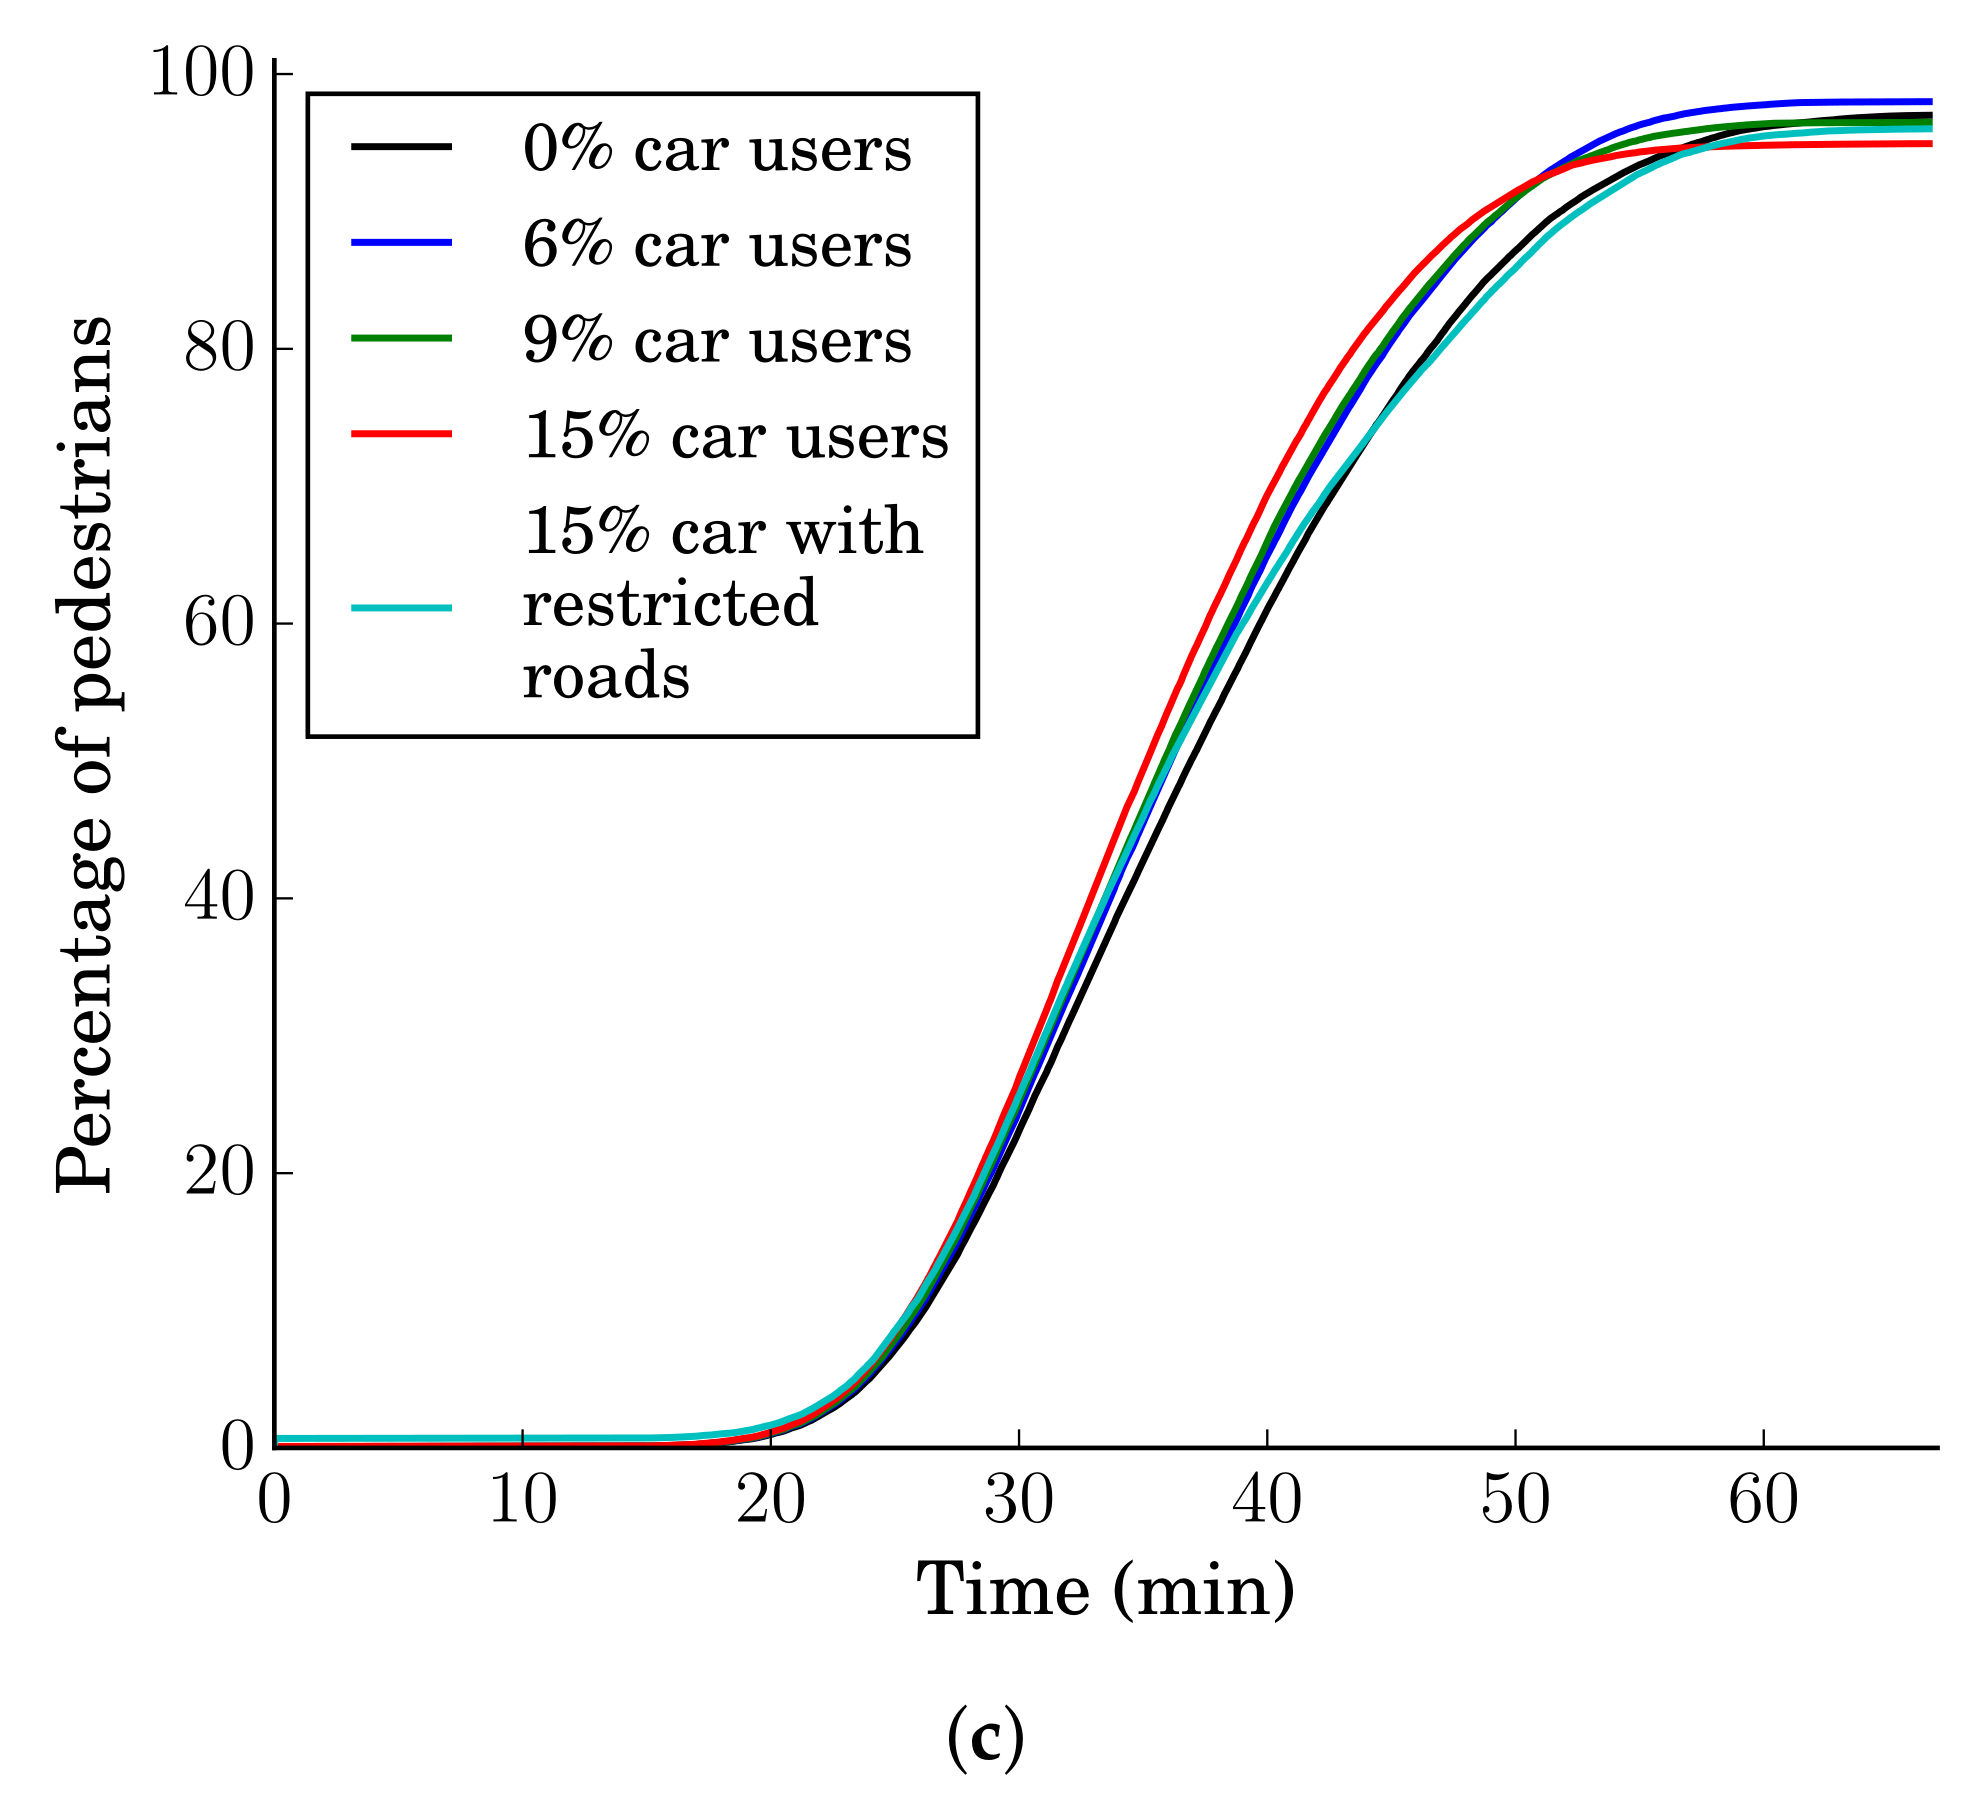
Figure 11 compares each scenario’s progress of evacuation. According to
Figure 12c, when no cars are allowed, a small percentage of the population could not reach a safe shelter. This small percentage is the slow-moving people who were more than 1 km away from the nearest safe area. Allowing 6% of the population to use cars enables these slow-moving (the needy) evacuees to reach a safe shelter, achieving 100% within 60 min. Furthermore, the 6% car users scenario has slightly accelerated the evacuation progress. Though the increases in the number of car users to 9% and 15% have accelerated the progress during the first 30 min, the arrival of a large number of pedestrians significantly hinders the progress of cars roughly between the 30 and 50 min period (see
Figure 11b). We observed that the pedestrians significantly influenced the cars both along the roads and at junctions.
In scenario 5, we tried to reduce this pedestrian interruption to traffic flow by restricting the usage of some stretches of roads either only to pedestrians or cars. However, this restriction is flexible. If a car or a pedestrian is initialized along any of these restricted roads, it is allowed to use the restricted roads until it reaches an unrestricted area. Furthermore, pedestrians (cars) are allowed to cross any of the restricted roads at junctions. Hence, enforced restrictions do not completely eliminate the car–pedestrian interactions. As seen in
Figure 11b, this restriction dramatically improves the evacuation progress, making most of the evacuees reach a shelter within 60 min. Though the progress of this scenario is slower compared to 6% and 9%, its performance is comparable to the scenario with no cars, indicating that a large number of cars can be allowed if well planned.
The
Figure 13 compares the number of pedestrians and cars walked along each road. According to
Figure 13a,b, the changes in pedestrians are minor and localized to the center of the city. On the other hand,
Figure 13c,d indicate that the routes of the cars have significantly changed, and the cars were forced to travel longer to reach a shelter. As seen in
Figure 10, the distances traveled by pedestrians have not changed much from the scenario with 6% of car users, while a significant number of car users were forced to travel to shelters located more than 3 km away. Since less pedestrians were on the suburban roads, the progress of the cars moving to farther shelters were not hindered. Furthermore,
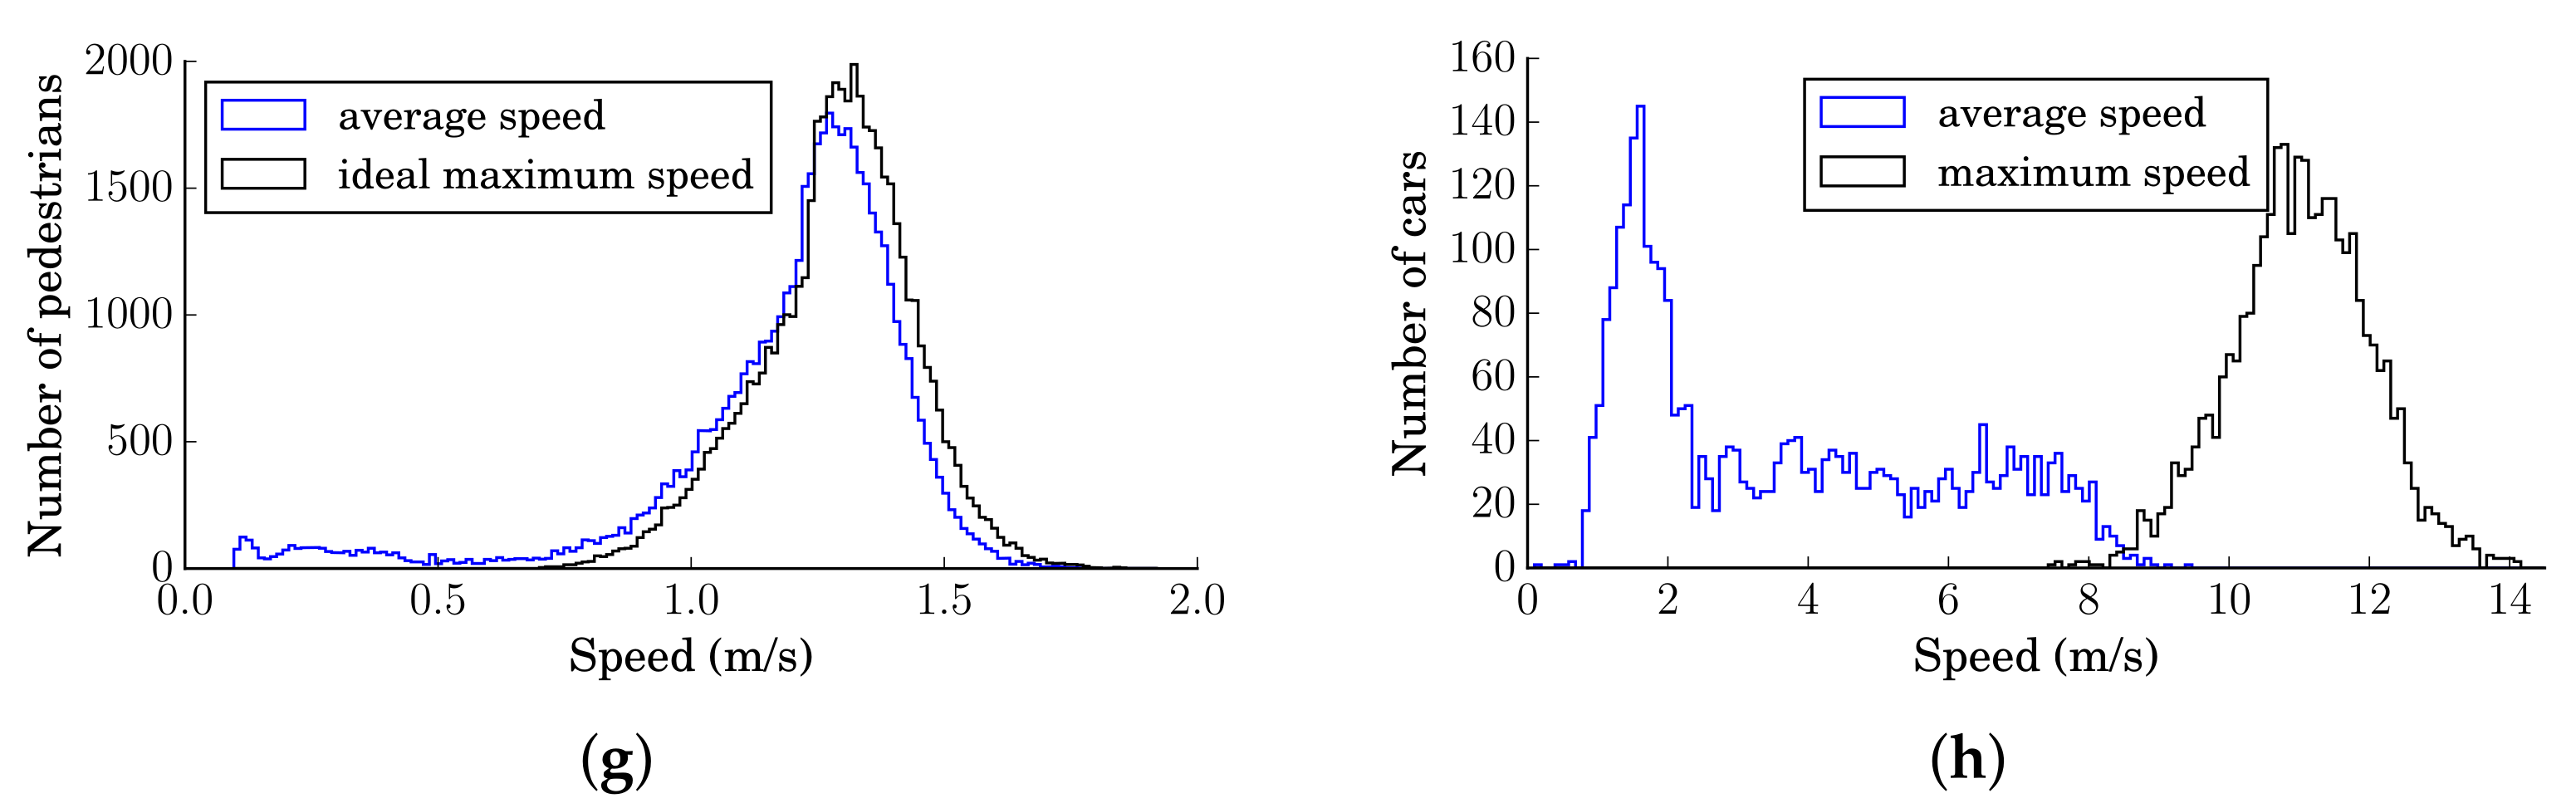
Figure 12 compares the statistics of each agent’s characteristic speed and the the average speed calculated as the ratio of the distance traveled and time taken to reach its destination. The differences between the characteristic and actual average speeds of pedestrians are negligible, probably because of their high mobility and the priority given at the junctions. On the contrary, the estimated average speeds of cars are drastically different from their characteristic speeds. This is expected, since cars cannot travel at their characteristic speed all the time; cars have to slow down at junctions, even if the roads are empty, and pedestrians significantly slow the cars at junctions and along the roads.
Figure 12f shows that a large number of cars in scenario 4, which has 15% cars, is almost stagnant, while
Figure 12h shows that the route restrictions in scenario 5 significantly improved the progress of cars. The estimated average speed of cars in scenario 5 with 15% car users is almost close to that of the scenario with 6% car users.
5. Discussion
According to the Disaster Management Bureau of the Cabinet Office of Japan, there is a 70–80% likelihood that magnitude 8–9 scale earthquake will occur in the area along Nankai Through as of 2021 [
2,
3]. The Central Disaster Management Council of Japan estimates that some coastal areas, which are highly populated, would be inundated within 20–30 min after the earthquake [
3]. Long distances to the closest evacuation area due to relatively flat terrain, a significant percentage of elderly population, short tsunami arrival time, and the significant car usage during the 2011 Tohoku Tsunami have prompted policy makers to allow a certain number of cars to ensure the safety of the needy people (e.g., sick, elderly, families with infants), though the current recommended mode of evacuation is walking [
4]. Extensive traffic jams [
37,
38] observed during the 2011 Tohoku Tsunami emphasizes that allowing cars requires careful planning considering wide range of hampering conditions caused by the preceding mega-earthquake.
Widespread traffic signal blackouts were reported during the 2011 Great East Japan Tsunami [
4], and hence, pedestrian–car mode evacuation during a traffic signal blackout at night is an important scenario in evaluating the usage of cars. Simulating such uncommon conditions caused by earthquakes demands specialized simulators with capabilities to accurately model the space of the environment and agents with functionalities to accurately sense their environment in high-resolution. As discussed in the
Section 1, to the best of our knowledge, existing evacuation simulators are not capable of simulating the interactions between pedestrians and cars at non-signalized junctions.
Section 3 of this paper presented a high-resolution model to cover this research gap.
Our ABM models the environment at 1 × 1 m
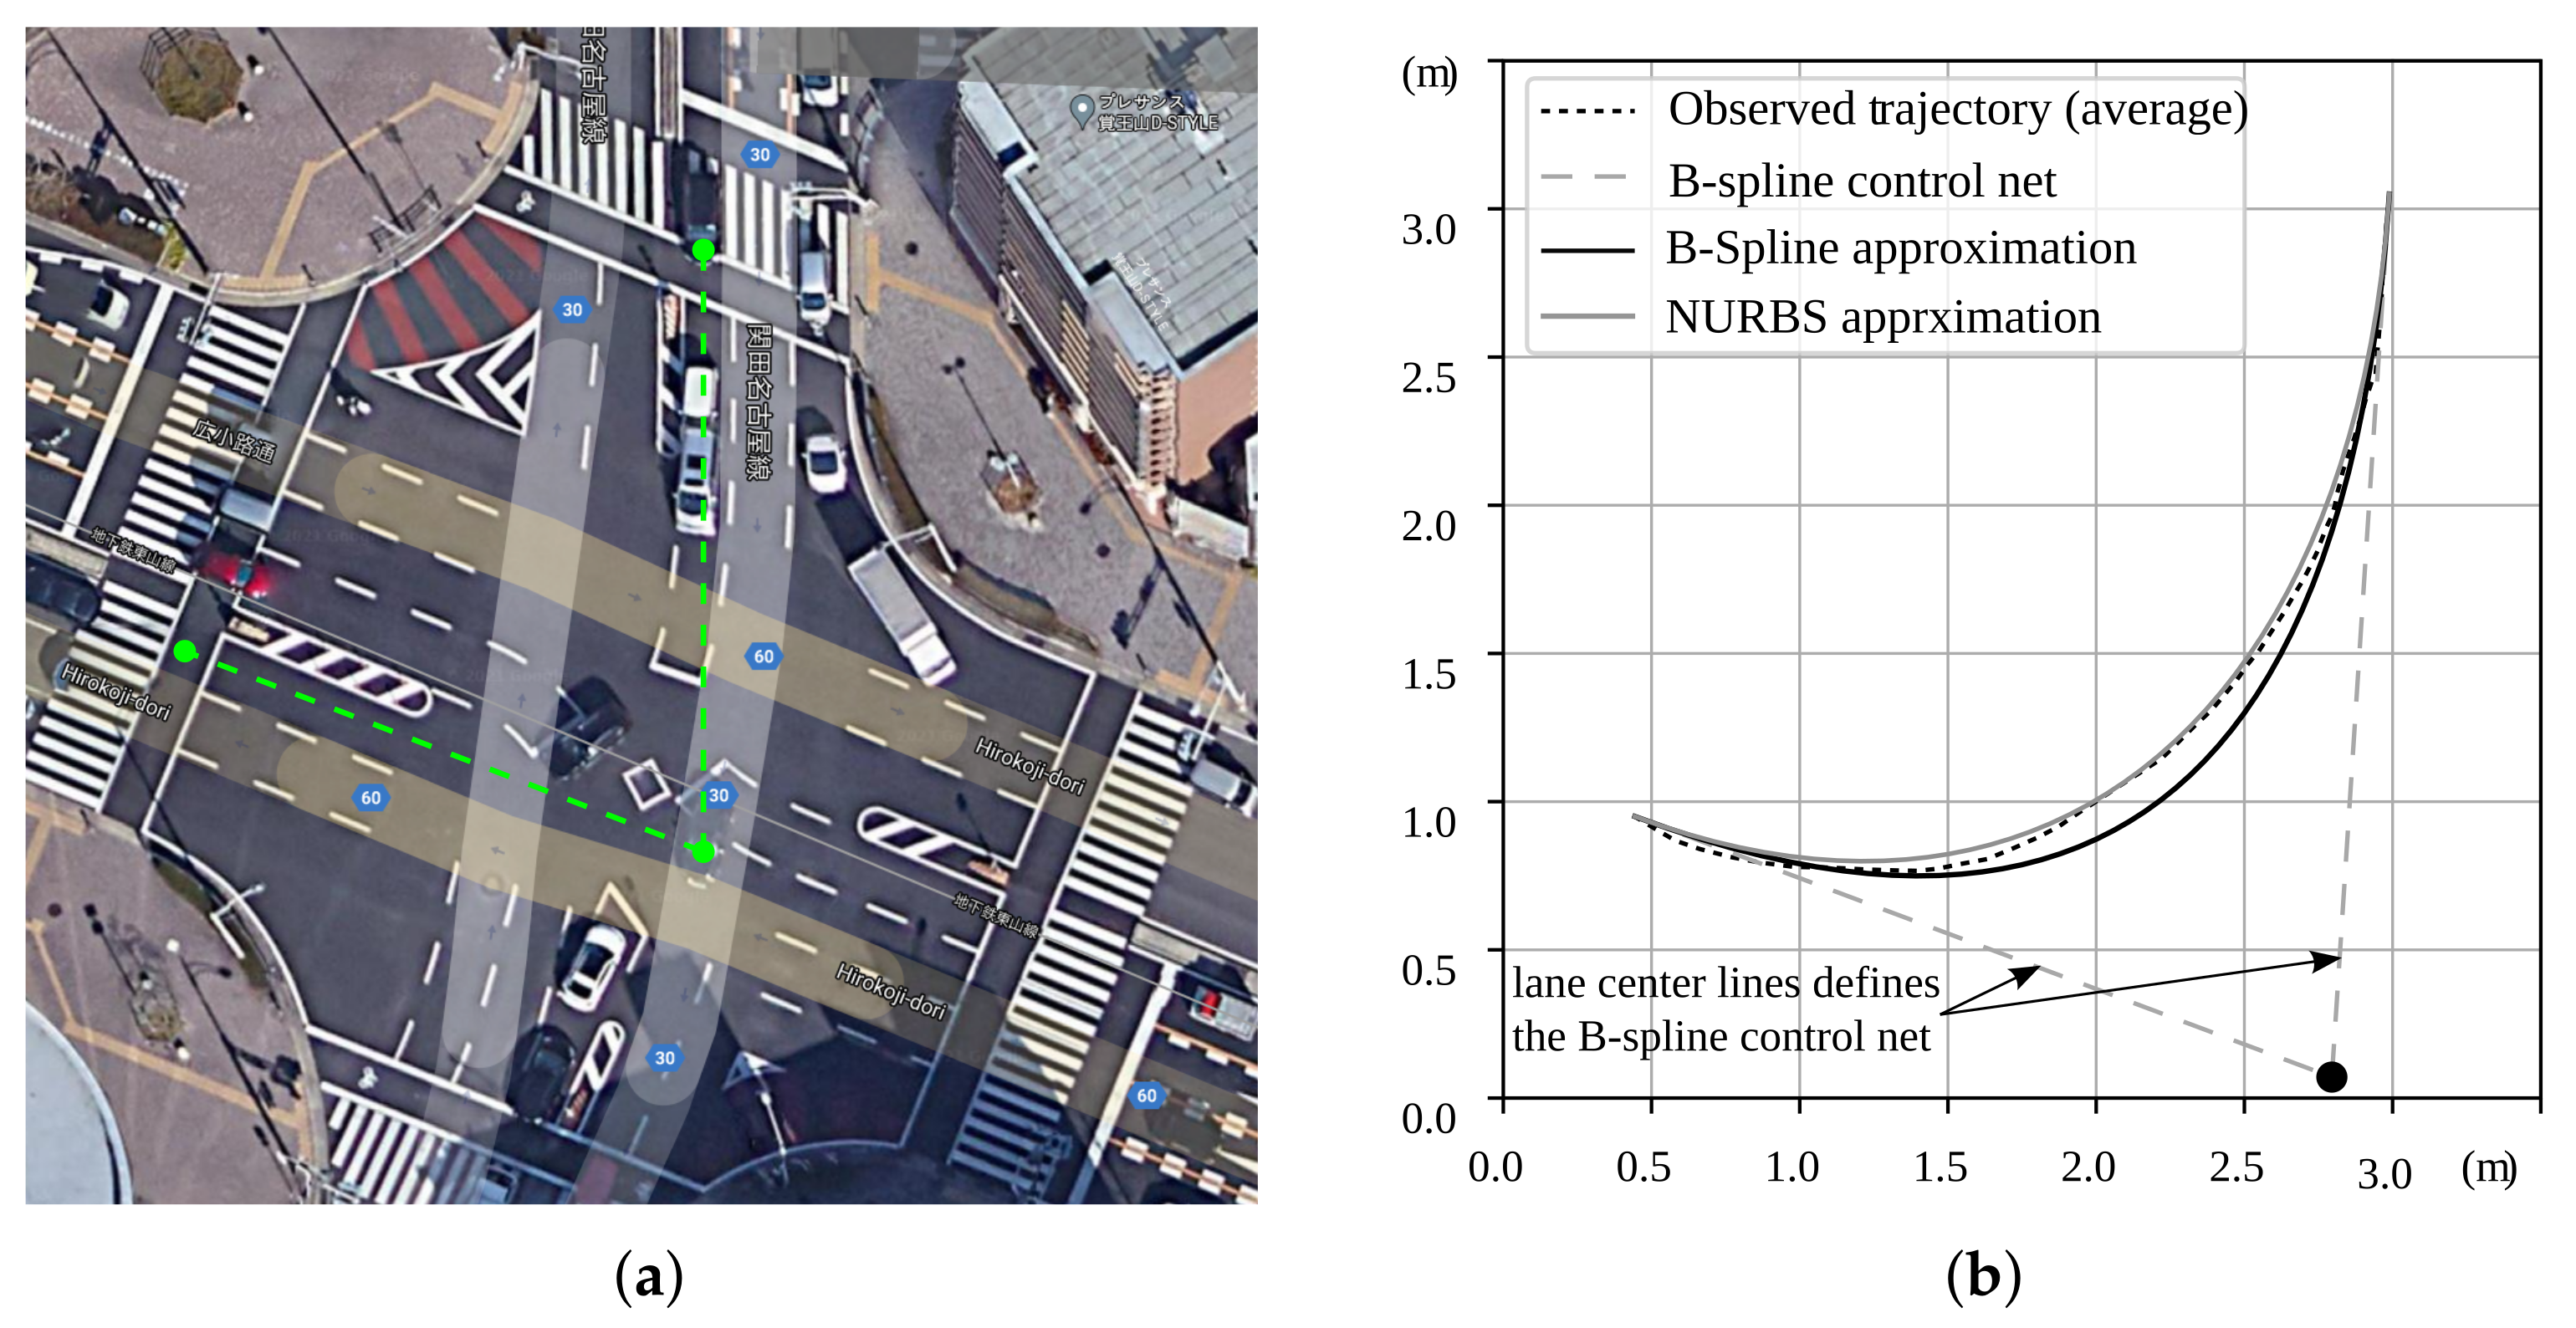
or higher resolution enabling us to accurately model the space at junctions. Comparing with observations by Alhajyaseen et al. [
33], we demonstrated that car trajectories at junctions can be approximated to a sufficient accuracy using third-order B-splines. Although we found that car trajectories could be more accurately approximated by NURBS, we choose third-order B-splines since the required control points were easy to define. We automated the generation of car trajectories since it is impractical to manually define those at tens of thousands of junctions in large scale simulations. A disadvantage of B-splines and NURBS is the difficulty of computing the intersection points of curved trajectories [
34,
35]. We addressed this by approximating the B-spline curves as a piece-wise linear curve; 12 linear segments are found to produce sufficient accuracy for the target application. A limitation of third-order B-splines is their inadequacy to accurately approximate U-turns and trajectories involving double curvatures. Higher-order B-splines or NURBS can be used to overcome this limitation.
We approximated the free-flow speed of cars at junctions using a cubic polynomial parameterized with the distance along the respective third-order B-spline trajectories. Comparisons with Prof. Nakamura’s observations demonstrated that our third-order parametric function could approximate the free-flow speed of cars at junctions reasonably well. Our third-order approximation is based on the assumption that the acceleration with respect to the distance traveled is zero at the point of maximum curvature. Instead of this zero-acceleration condition, we can use the maximum allowable centrifugal force along the curved trajectories to obtain a more realistic approximation for free-flow speed. An analytical expression for the centrifugal force along the third-order B-splines trajectories can be easily derived, making it practical to use this important physical constraint to define the free-flow speed.
At junctions, agents uses their high-resolution scanning functionality to identify fellow agents on potential collision paths and decelerate or change directions to avoid collisions according to a desired set of rules and priorities. The assumption that car agents do not deviate from their B-spline trajectories enables the car agents to accurately identify collision-prone car and pedestrian agents, calculate the points of potential collisions with them, accurately estimate the time to reach the point of collision, even considering the free-flow speed along the B-spline trajectories, and accurately calculate the required deceleration to maintain a safe gap with the collision-prone agents. Our current model uses the simple rule that the car agent first to arrive at the potential point of collision travels uninterrupted, while the other collision-prone cars decelerate to maintain a safe distance. Furthermore, we programmed the car agents to give priority to pedestrians with respect to the fact that the recommended mode of evacuation is walking. While the current model is based on these simple rules to resolve potential collisions, the high-resolution sensing capabilities of agents introduced by the new junction model provide a strong basis on which more sophisticated priorities and collision-avoiding rules can be implemented to accurately mimic the real world.
It should be emphasized that each car agent independently makes the decisions, such as which car should proceed uninterrupted, and no centralized control is involved. The decentralized decision-making significantly simplifies the parallel computing algorithms. However, in rare occasions when two or more cars have the same arrival time to the point of collision, this decentralized decision of car agents leads to deadlocks. Once a deadlock is detected, we either introduce small random perturbations to their speeds or allow the car with the lowest ID to continue uninterrupted. The assumption that cars do not deviate from their B-spline trajectories is not applicable when debris are assumed to be scattered over the roads. This is the major weakness of the implemented junction model, and more sophisticated algorithms have to be developed to simulate debris scattered junctions.
Due to the lack of prior studies on car–pedestrian interactions at non-signalized junctions and difficulties in finding suitable field observations of car–pedestrian interactions during traffic signal blackouts, we could neither verify nor validate the implemented responses of car and pedestrian agents for simulating car–pedestrian interactions during traffic signal blackout. Only interaction modules responsible for pedestrian–pedestrian, car–car, and car–pedestrian interactions on roads have been validated by comparing with field observations. We restrict ourselves from making a detailed discussion on the results presented in previous section, since a detailed analysis of the results from a non-validated module can lead to premature conclusions.
Simulating hypothetical evacuation scenario involving mixed car–pedestrian mode evacuation, we demonstrate that the use of a certain percentage of cars can be beneficial, provided that mainly the needy are allowed to use cars, and the time window for the cars’ usage is restricted. According to simulated scenarios, increasing the number of car users beyond 6% with no restrictions of route choices increasingly degraded the evacuation progress. However, we observed that strategically restricting some road stretches only to cars or pedestrians to reduce the friction between cars and pedestrians can accommodate a large number of car users without degrading evacuation progress. While the routes were restricted manually in the presented scenario, significantly better performing route restrictions could be found using a suitable optimization algorithm [
28]. Although the developed code must be thoroughly validated before any practical applications, the presented demonstrative scenarios indicate that a significant number of the needy can be allowed to use cars for evacuation if their routes and evacuation start time window are strategically planned.


 ,
, 


