
Mapping Shrimp Pond Dynamics: A Spatiotemporal Study Using Remote Sensing Data and Machine Learning
 ,
,  , ,
, ,
Abstract
:1. Introduction
2. Data
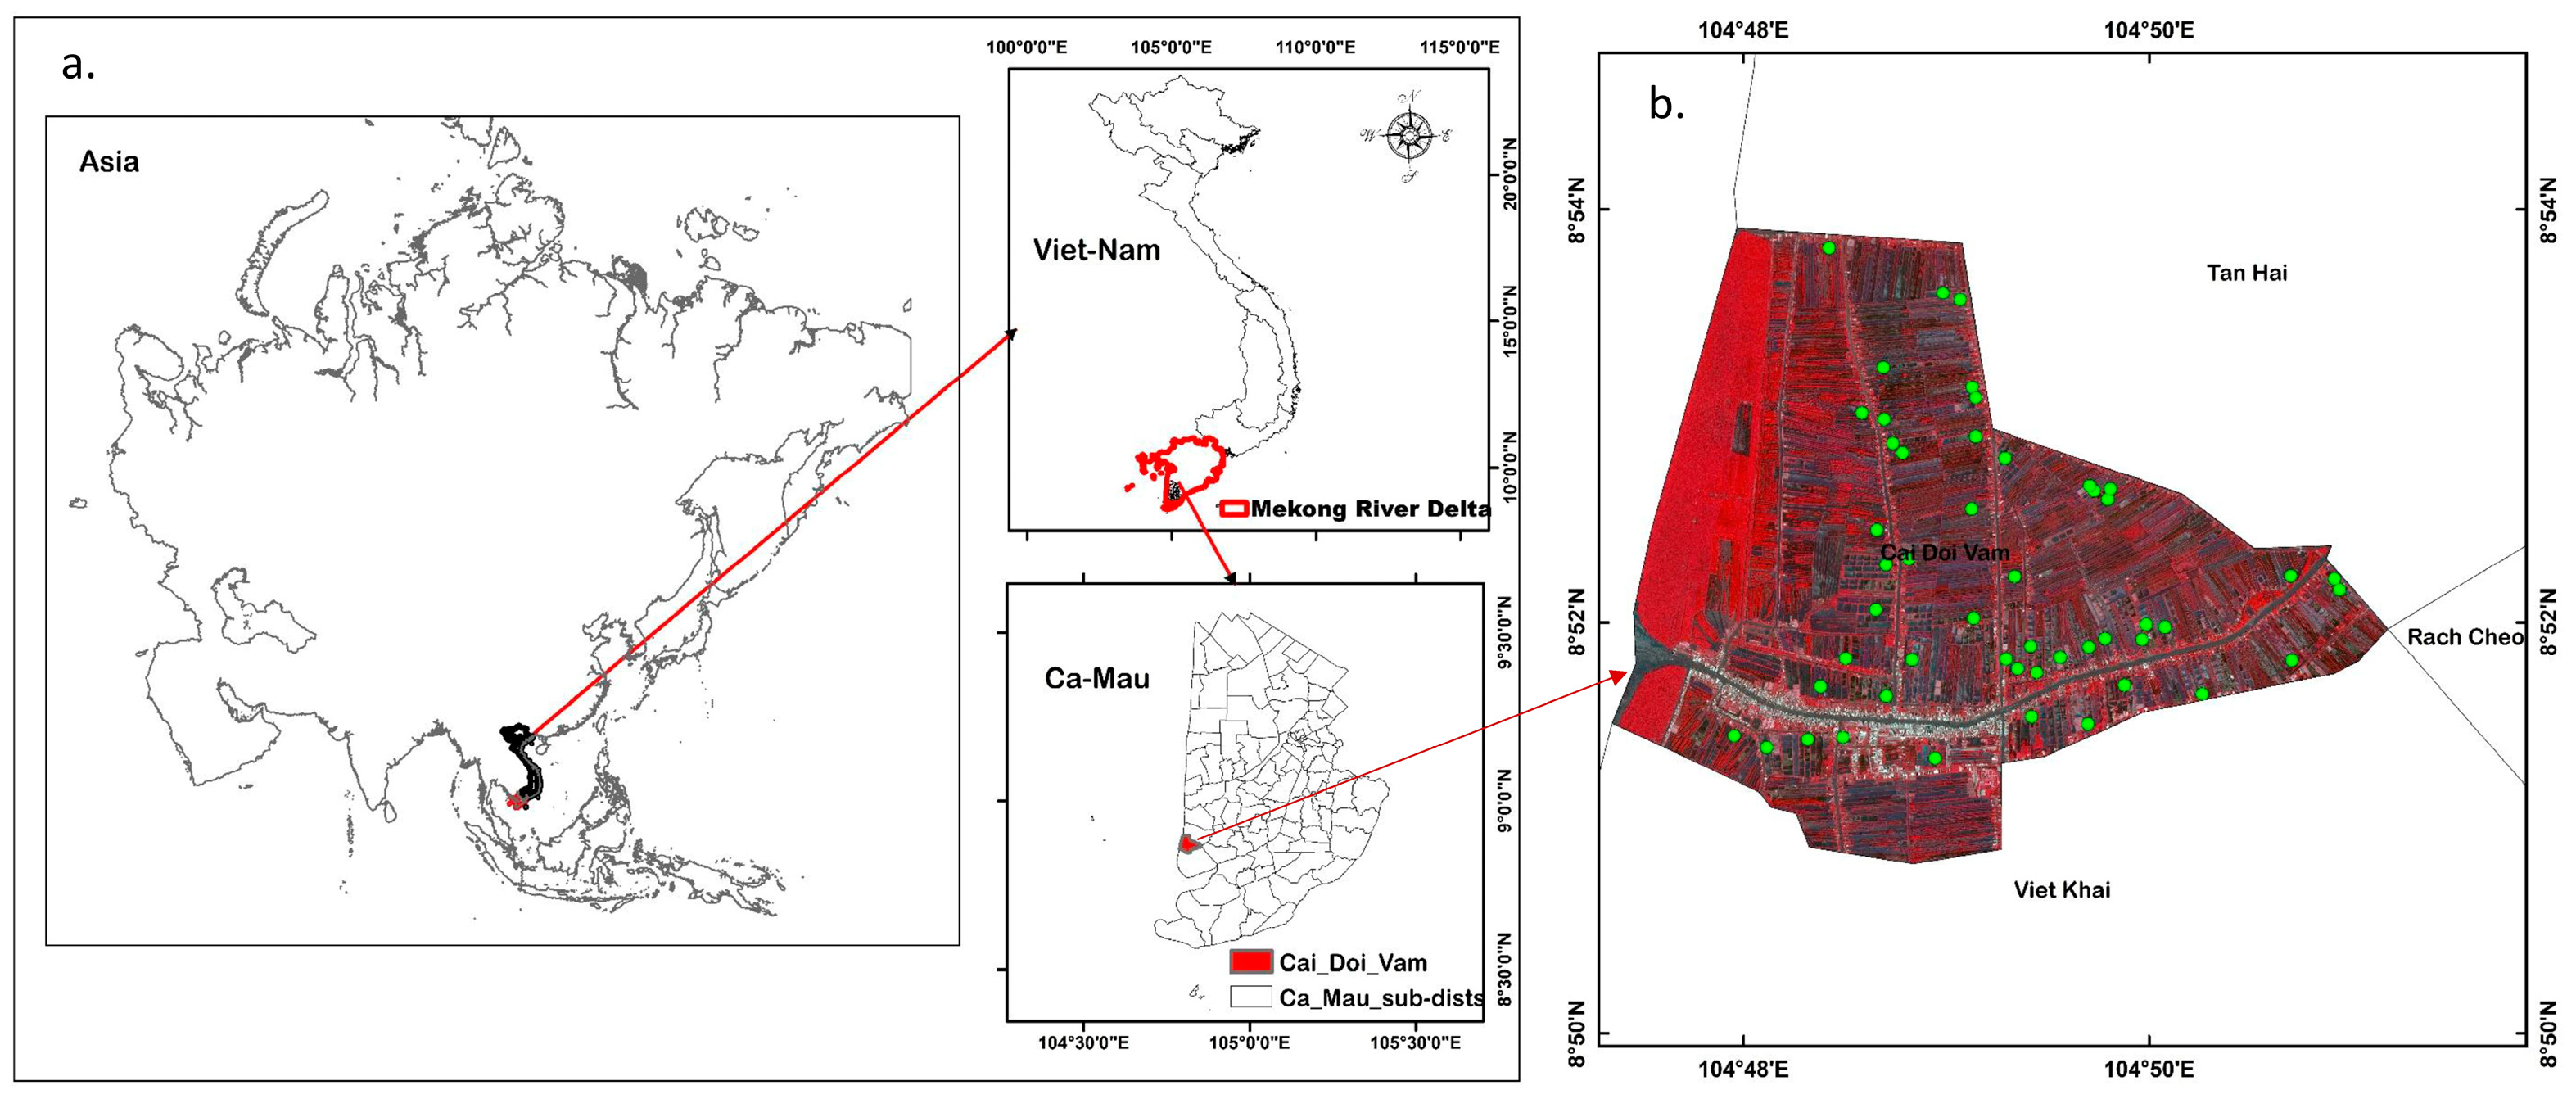
2.1. Study Area
2.2. Satellite Data
2.3. Ground Survey Data
3. Methods and Approaches
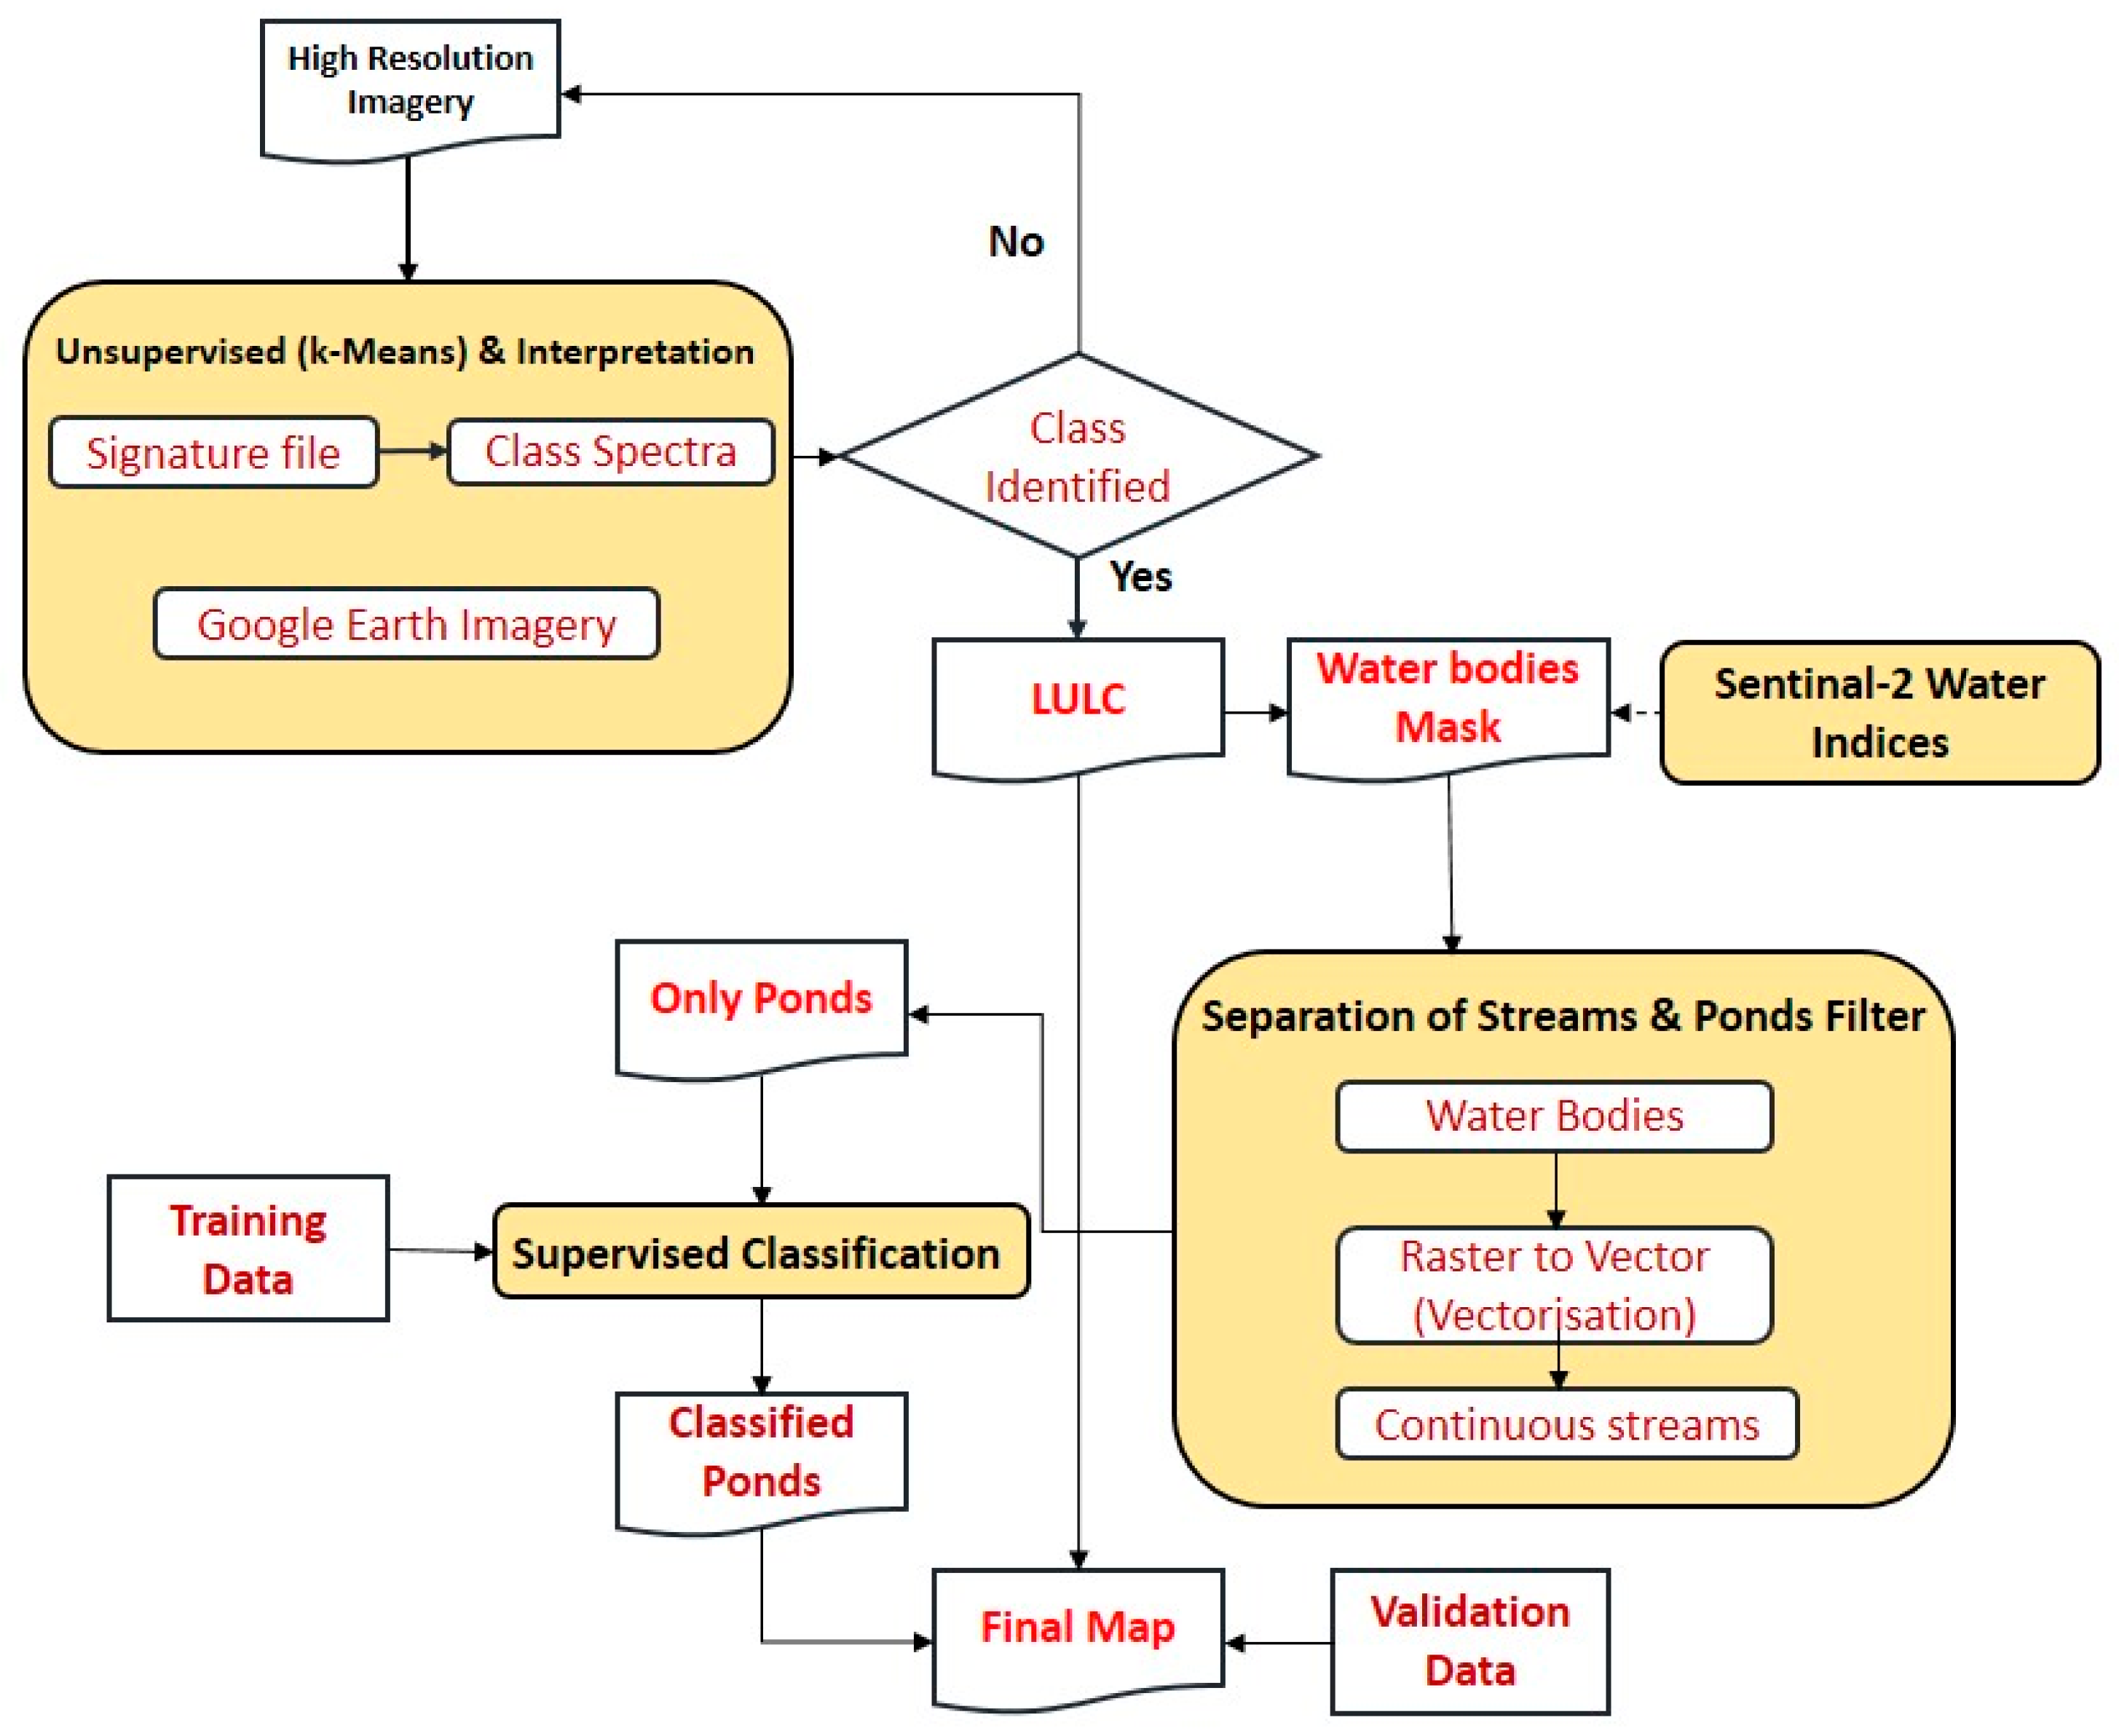
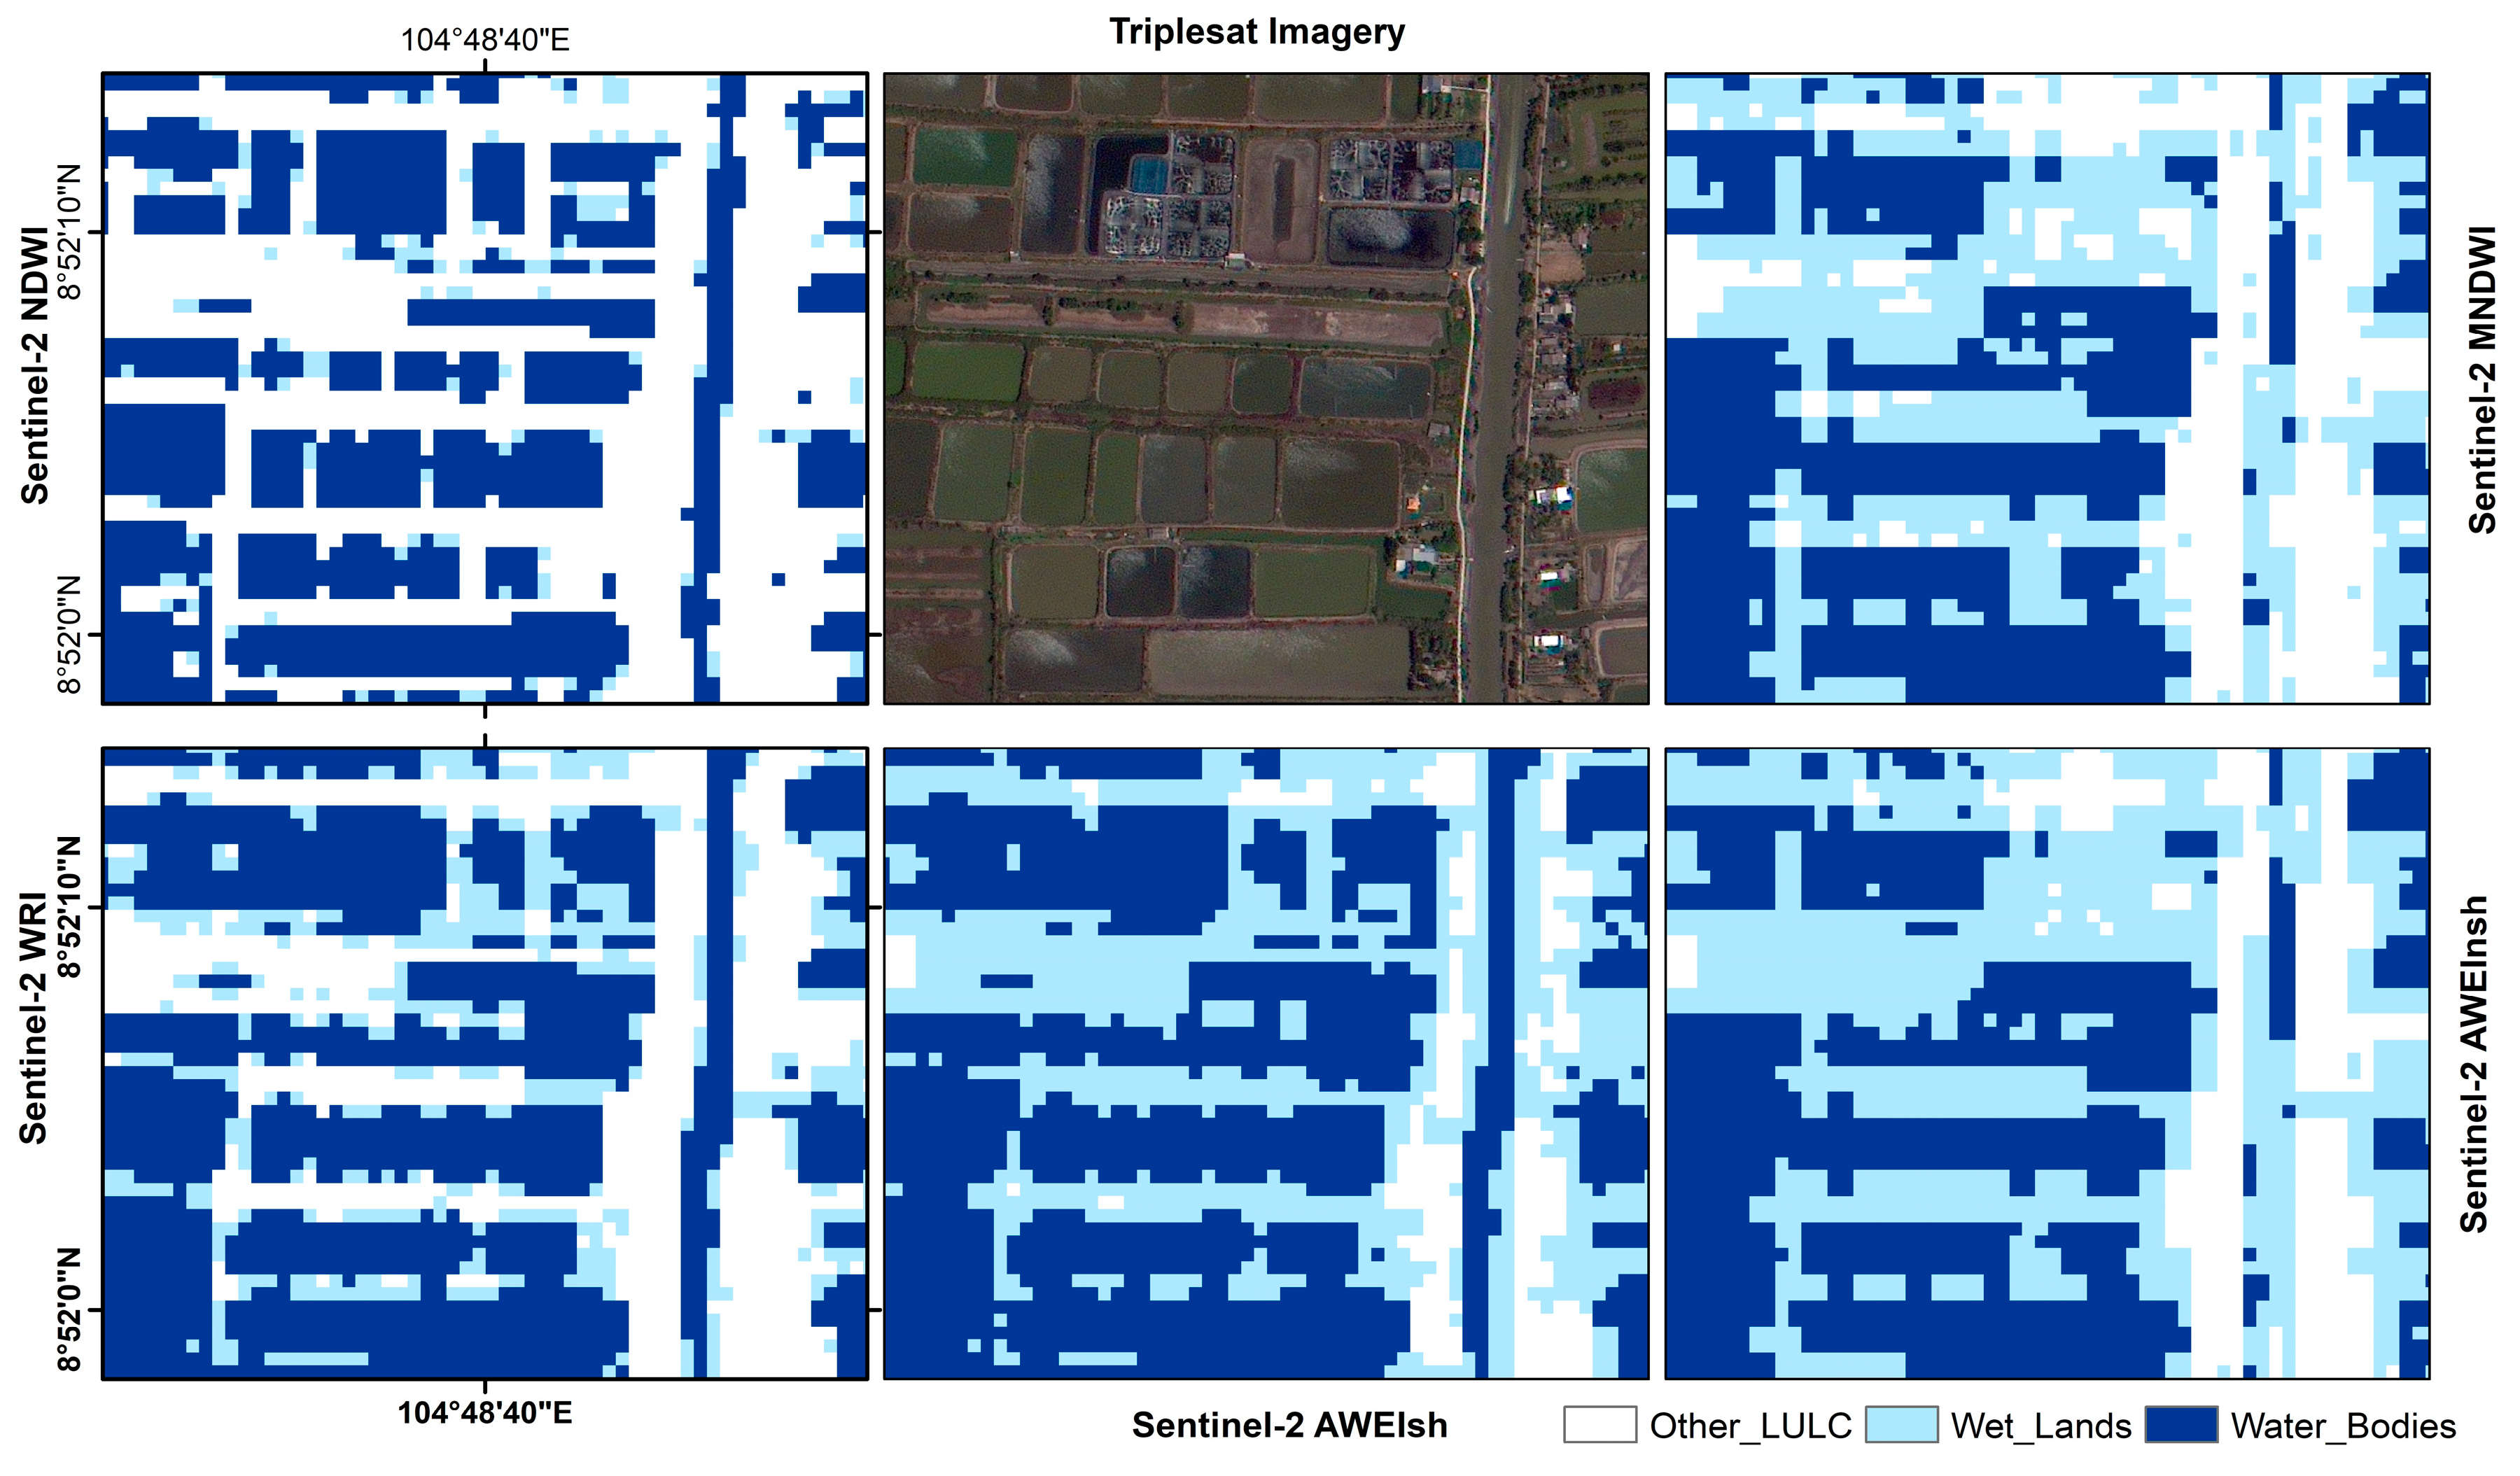
3.1. Wetlands and Land Use Mapping
- “NIR” is the reflectance in the near-infrared band.
- “Red“ is the reflectance in the red band.
- “Green“ is the reflectance in the green band.
- “Blue“ is the reflectance in the blue band.
- “SWIR“ is the reflectance in the shortwave infrared band.
3.2. Separation of Streams Using LULC Vectorization
3.3. Supervised Classification of Ponds to Separate Shrimp Ponds
3.4. Accuracy Assessment
4. Results and Discussion
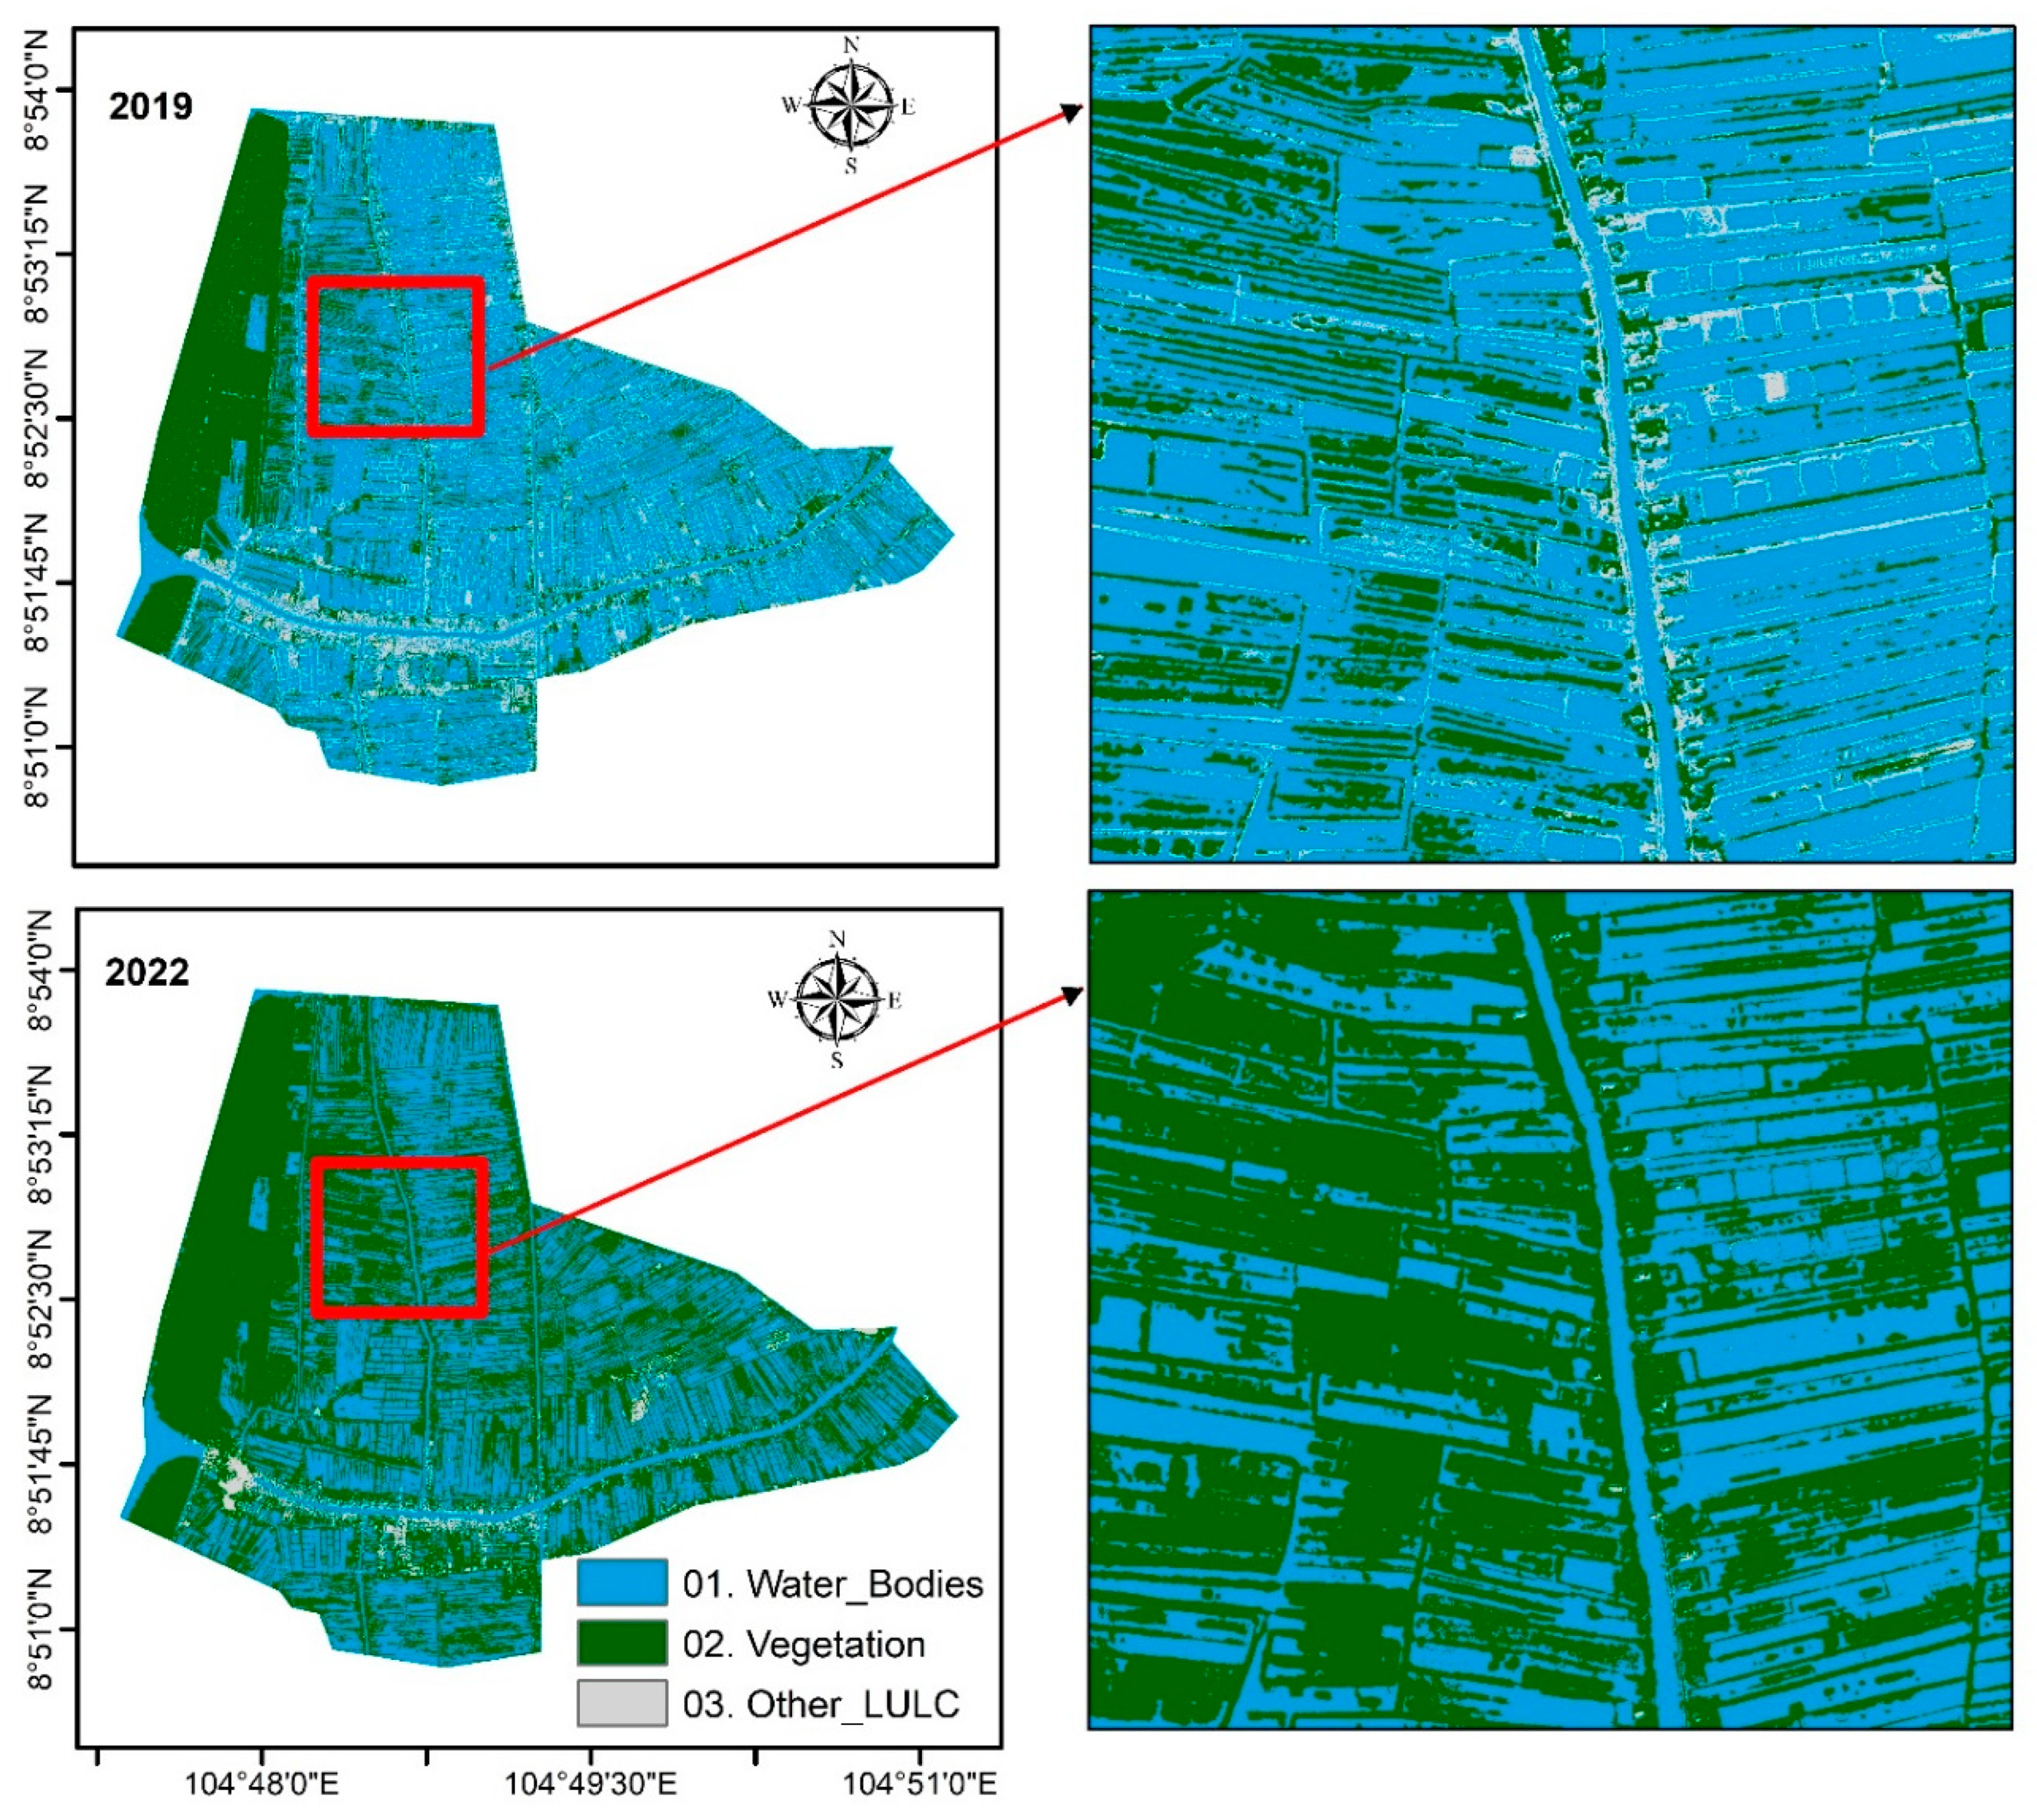
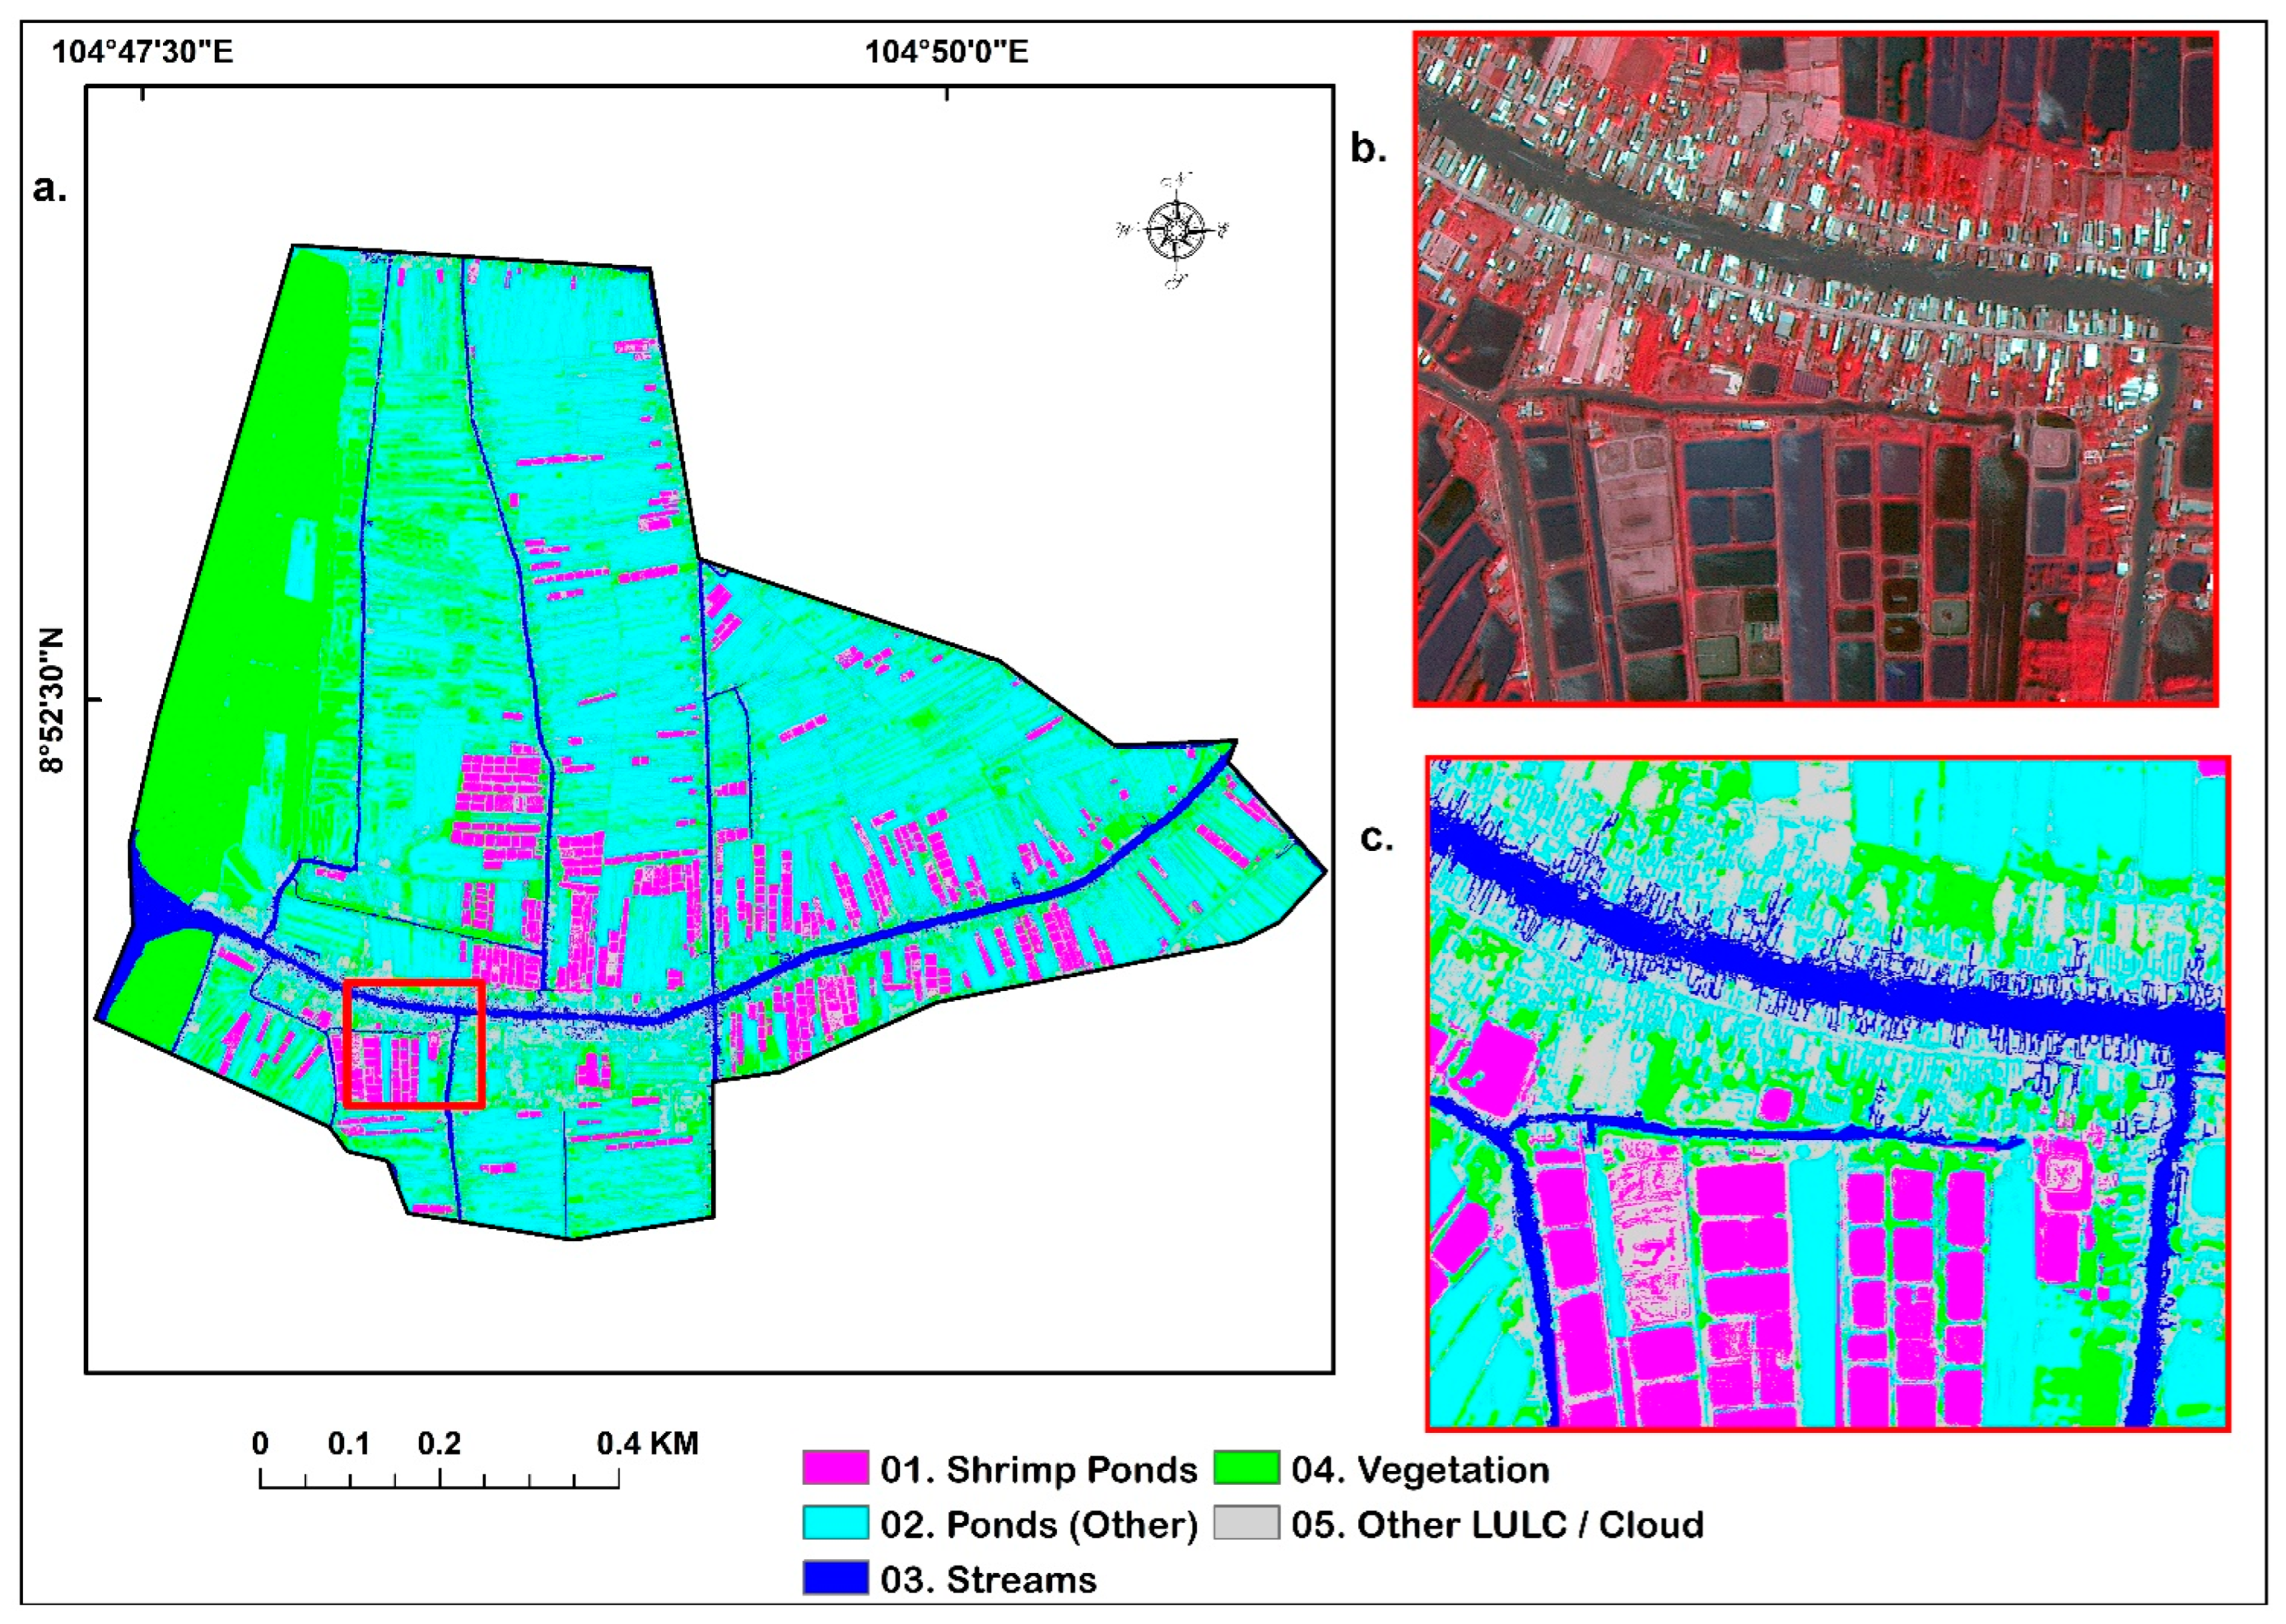
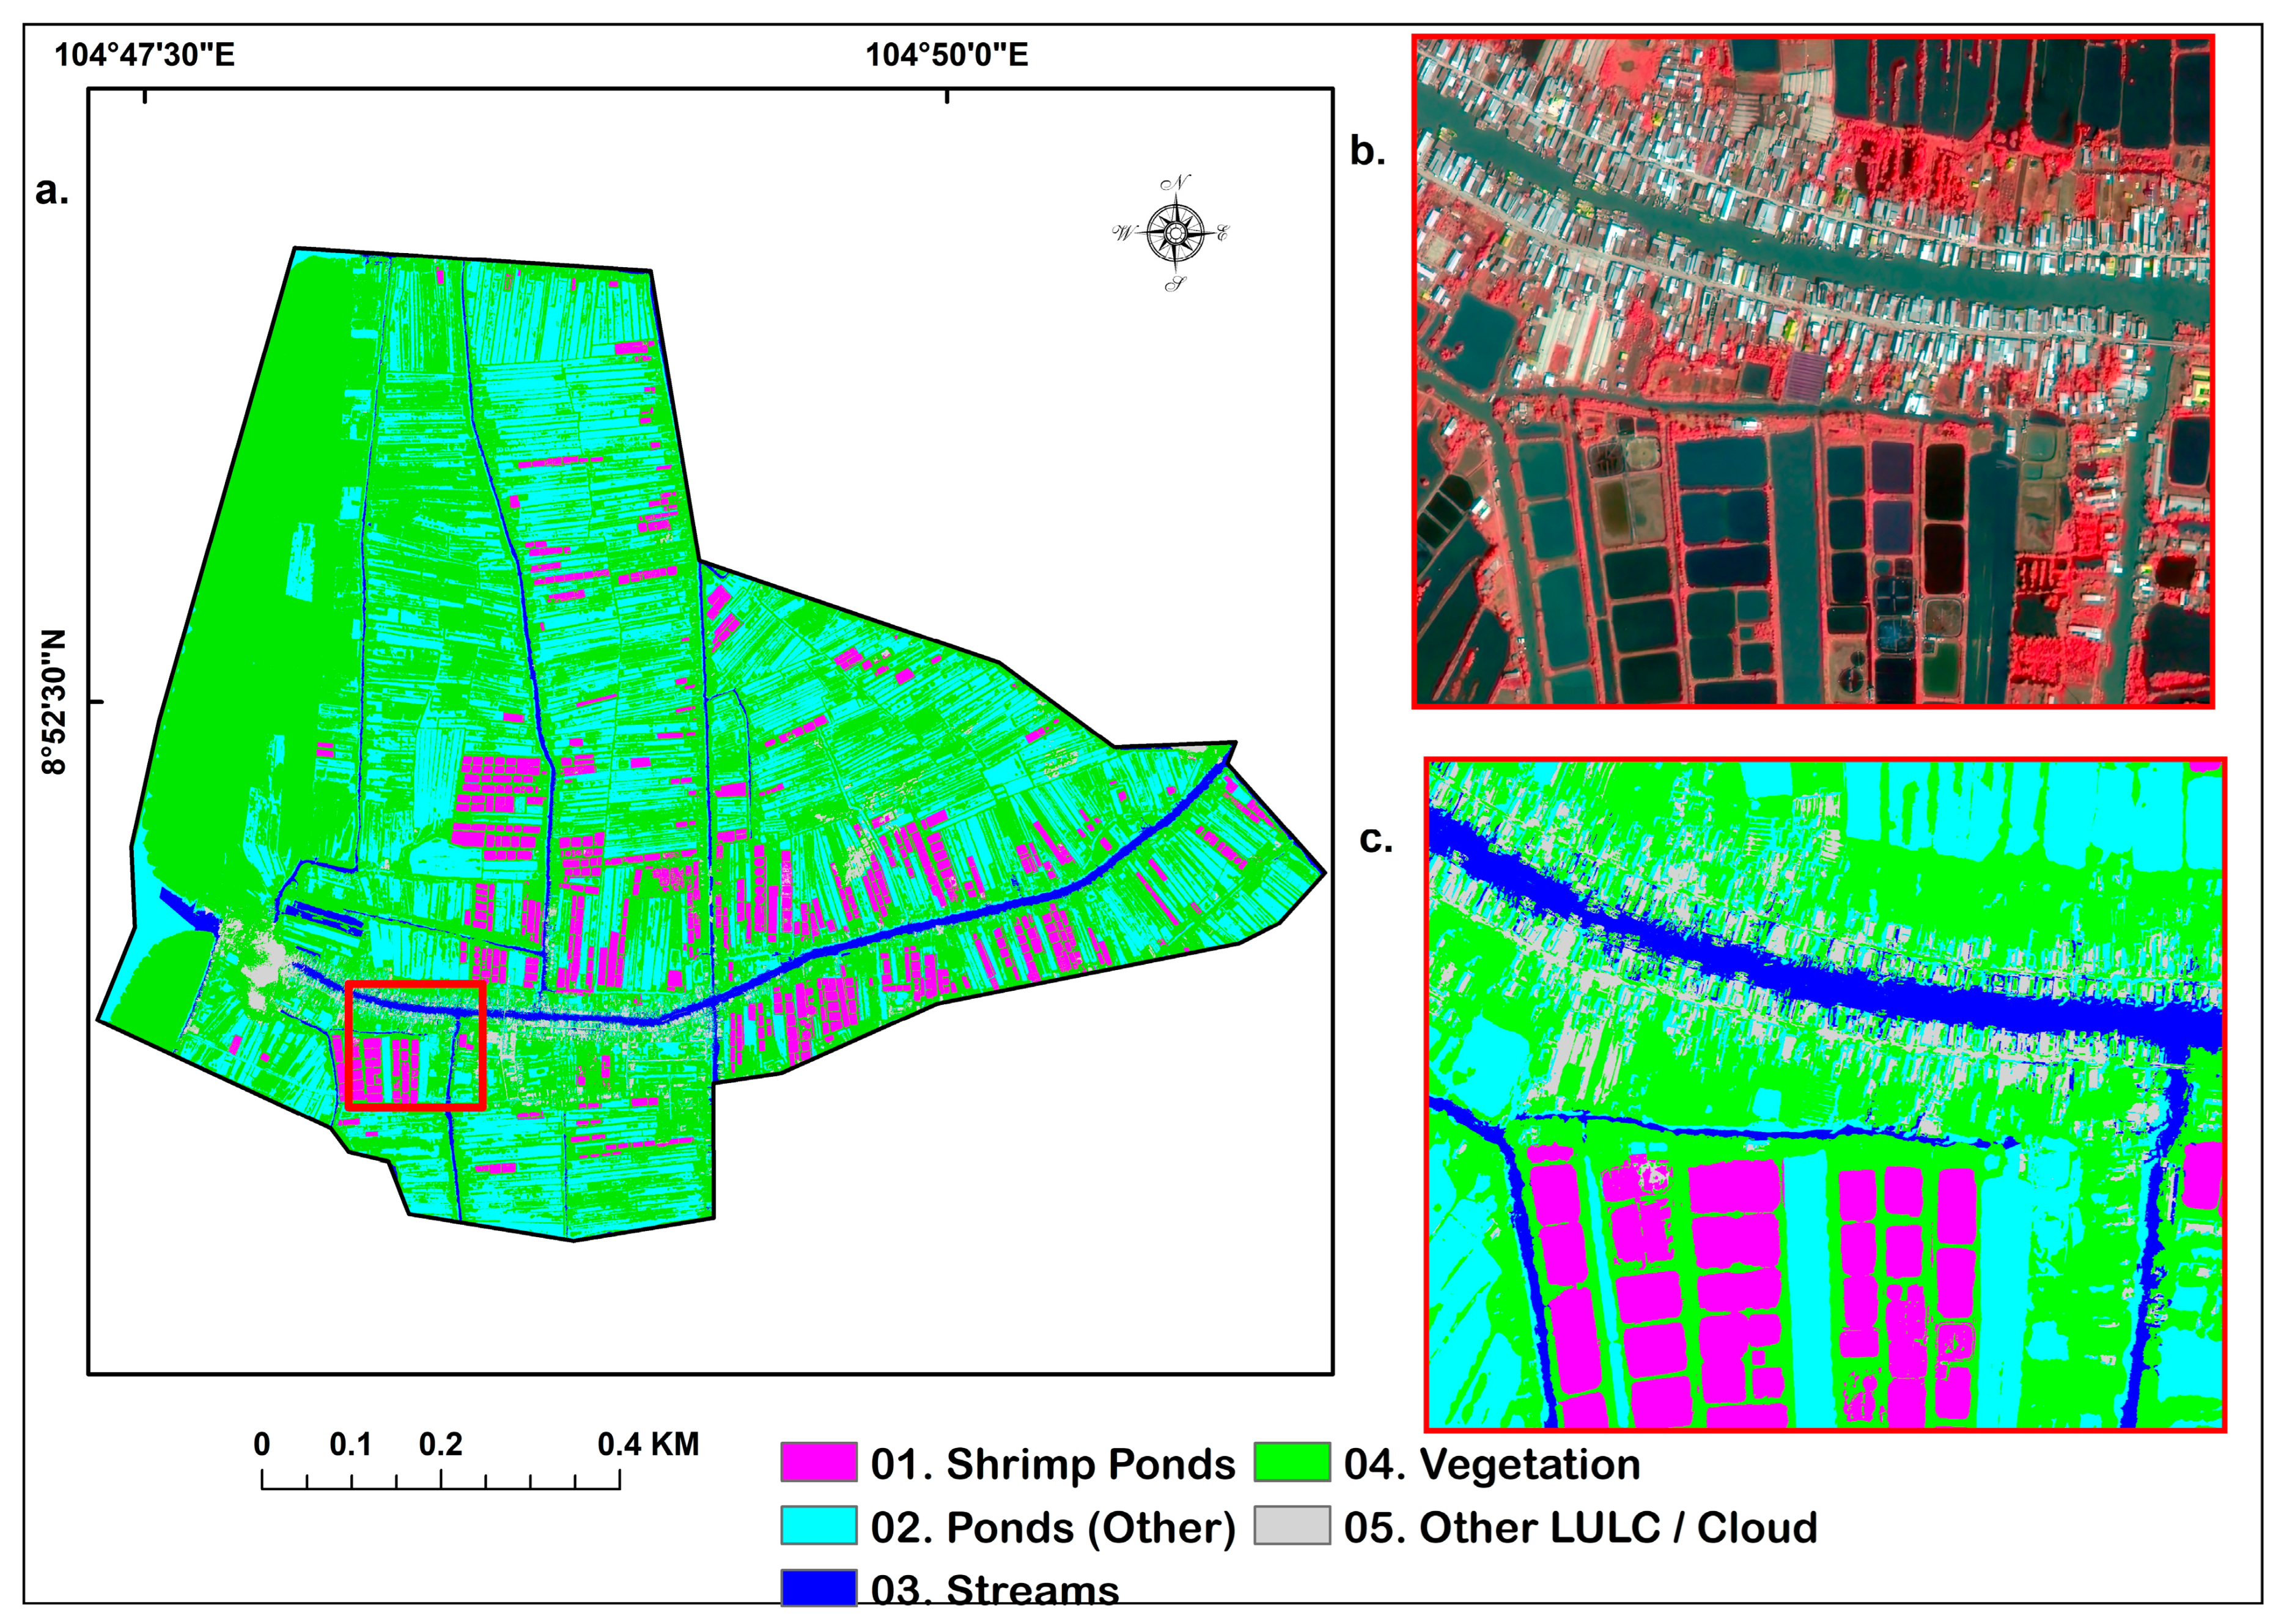
4.1. Spatial Distribution of LULC
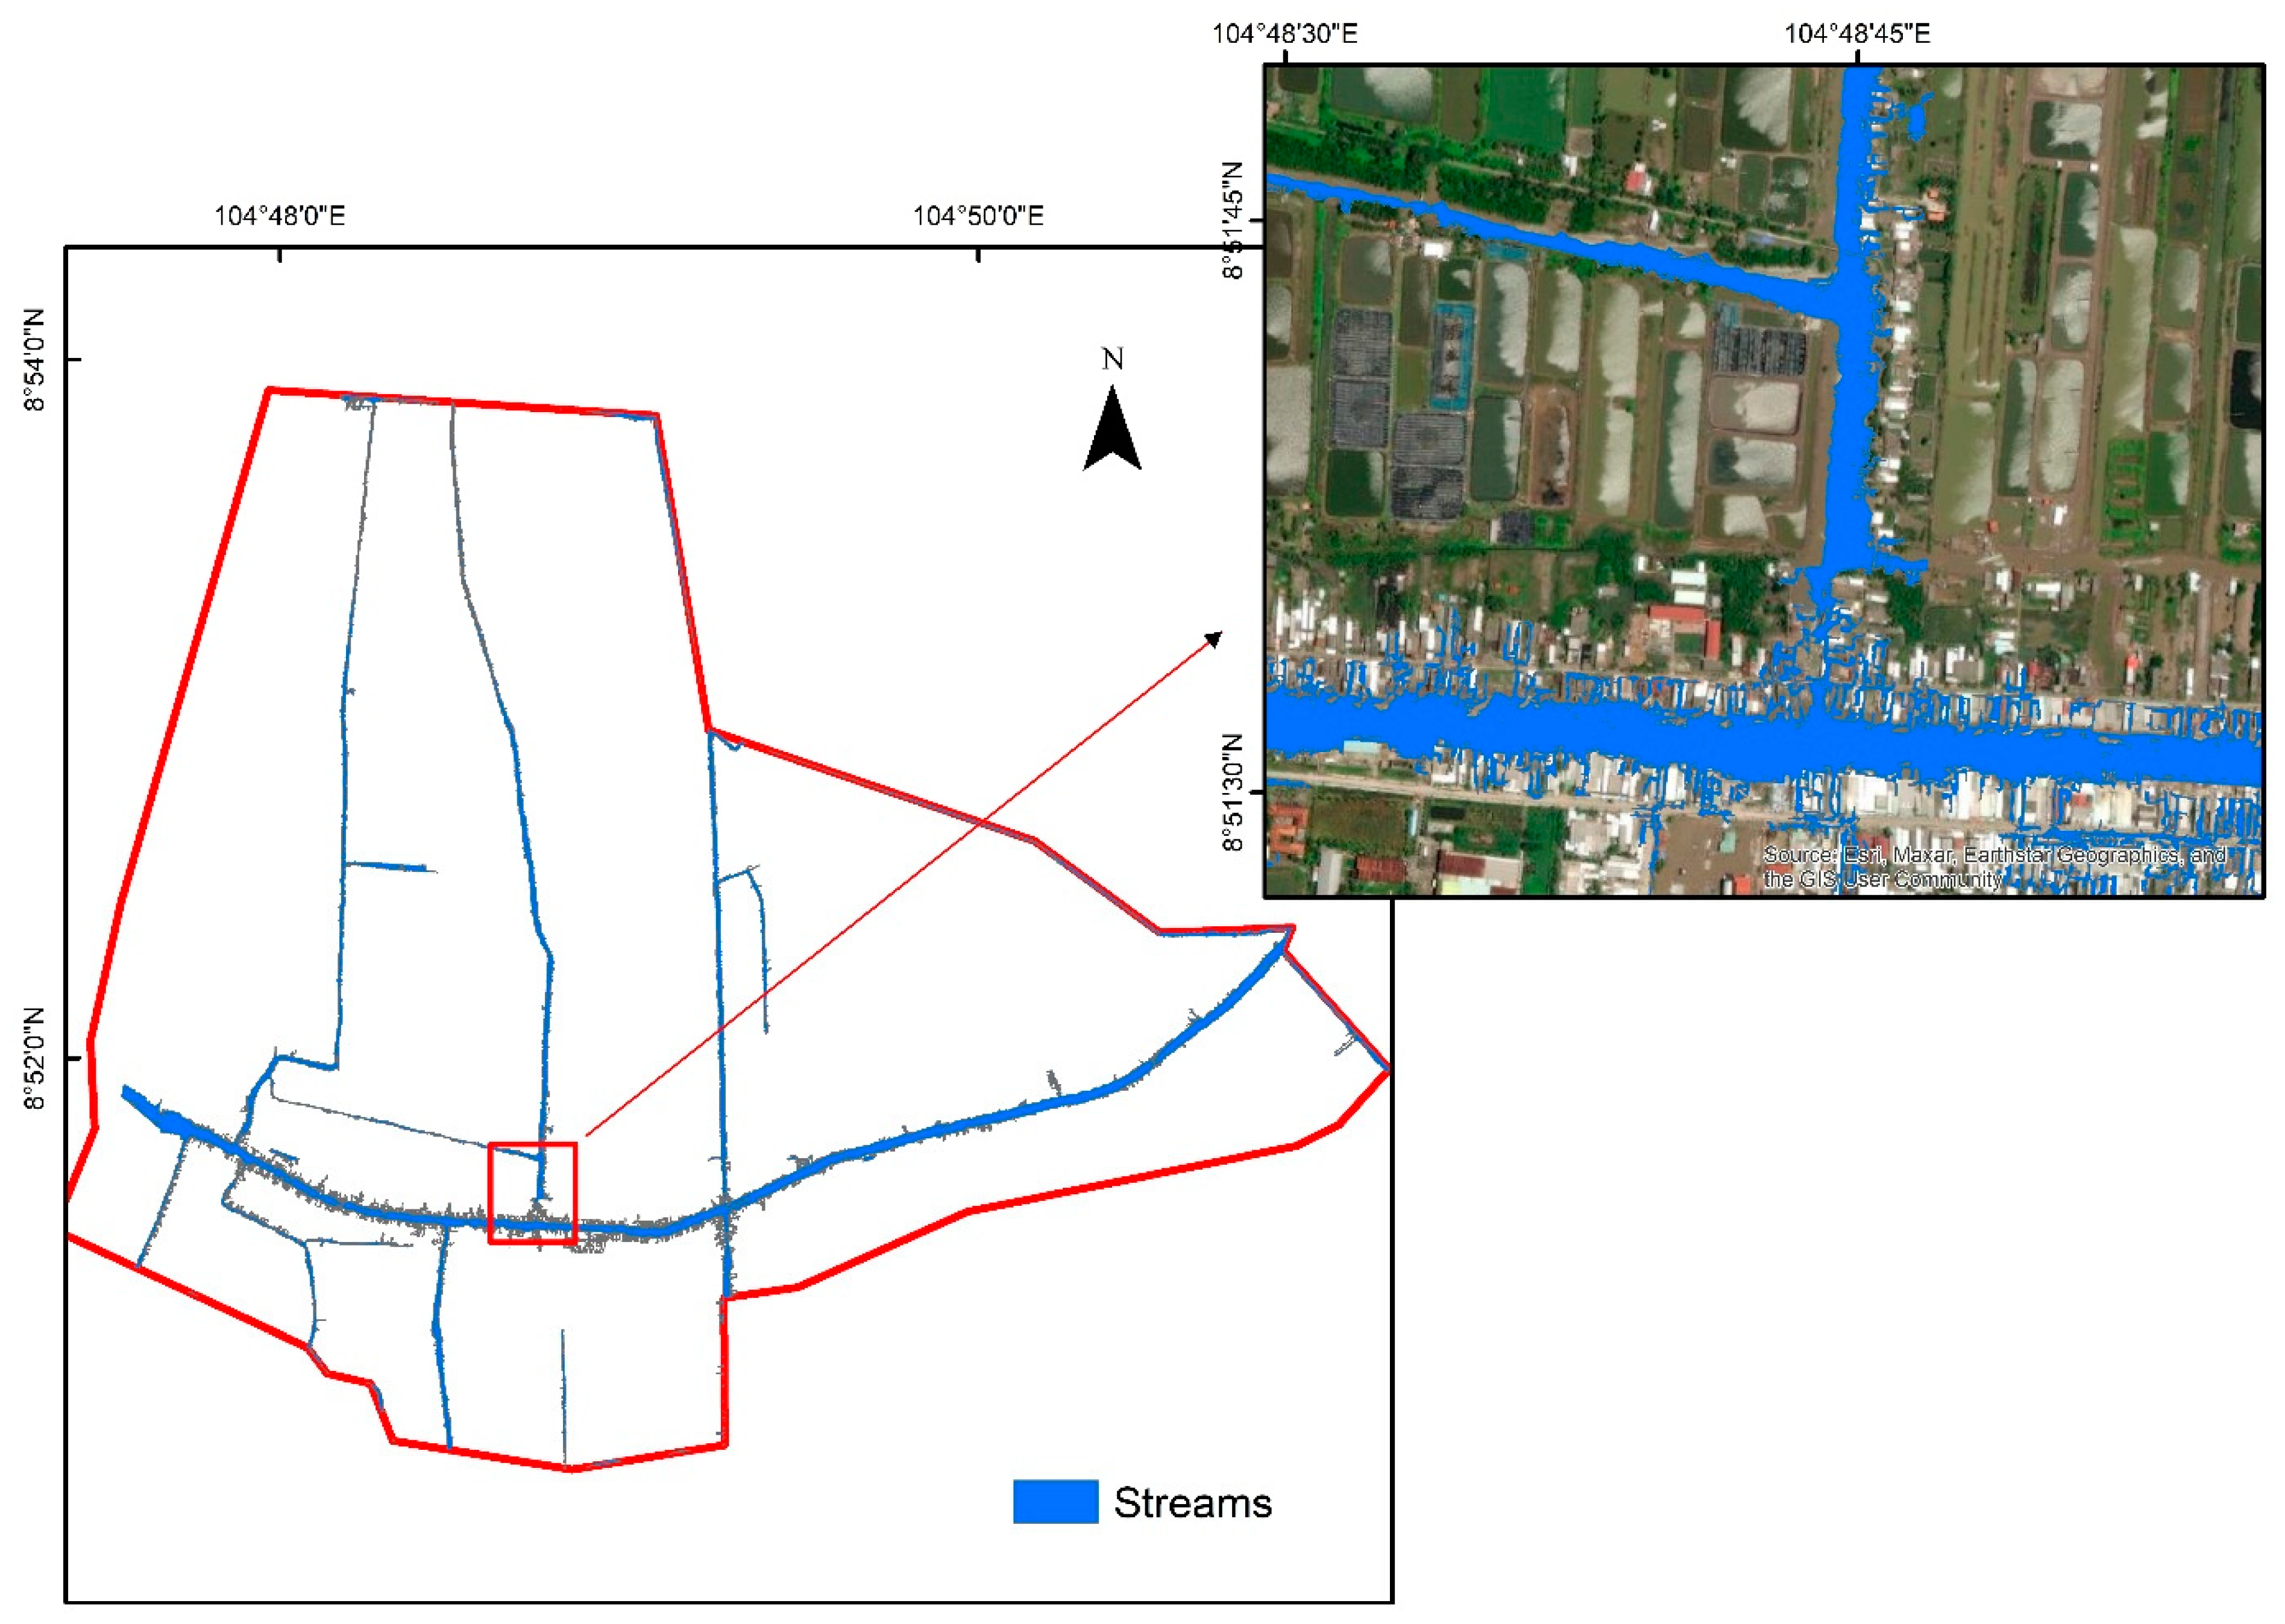
4.2. Streams Vectorization
4.3. Spatial Distribution of Shrimp Ponds/Fishponds
4.4. Accuracy Assessment
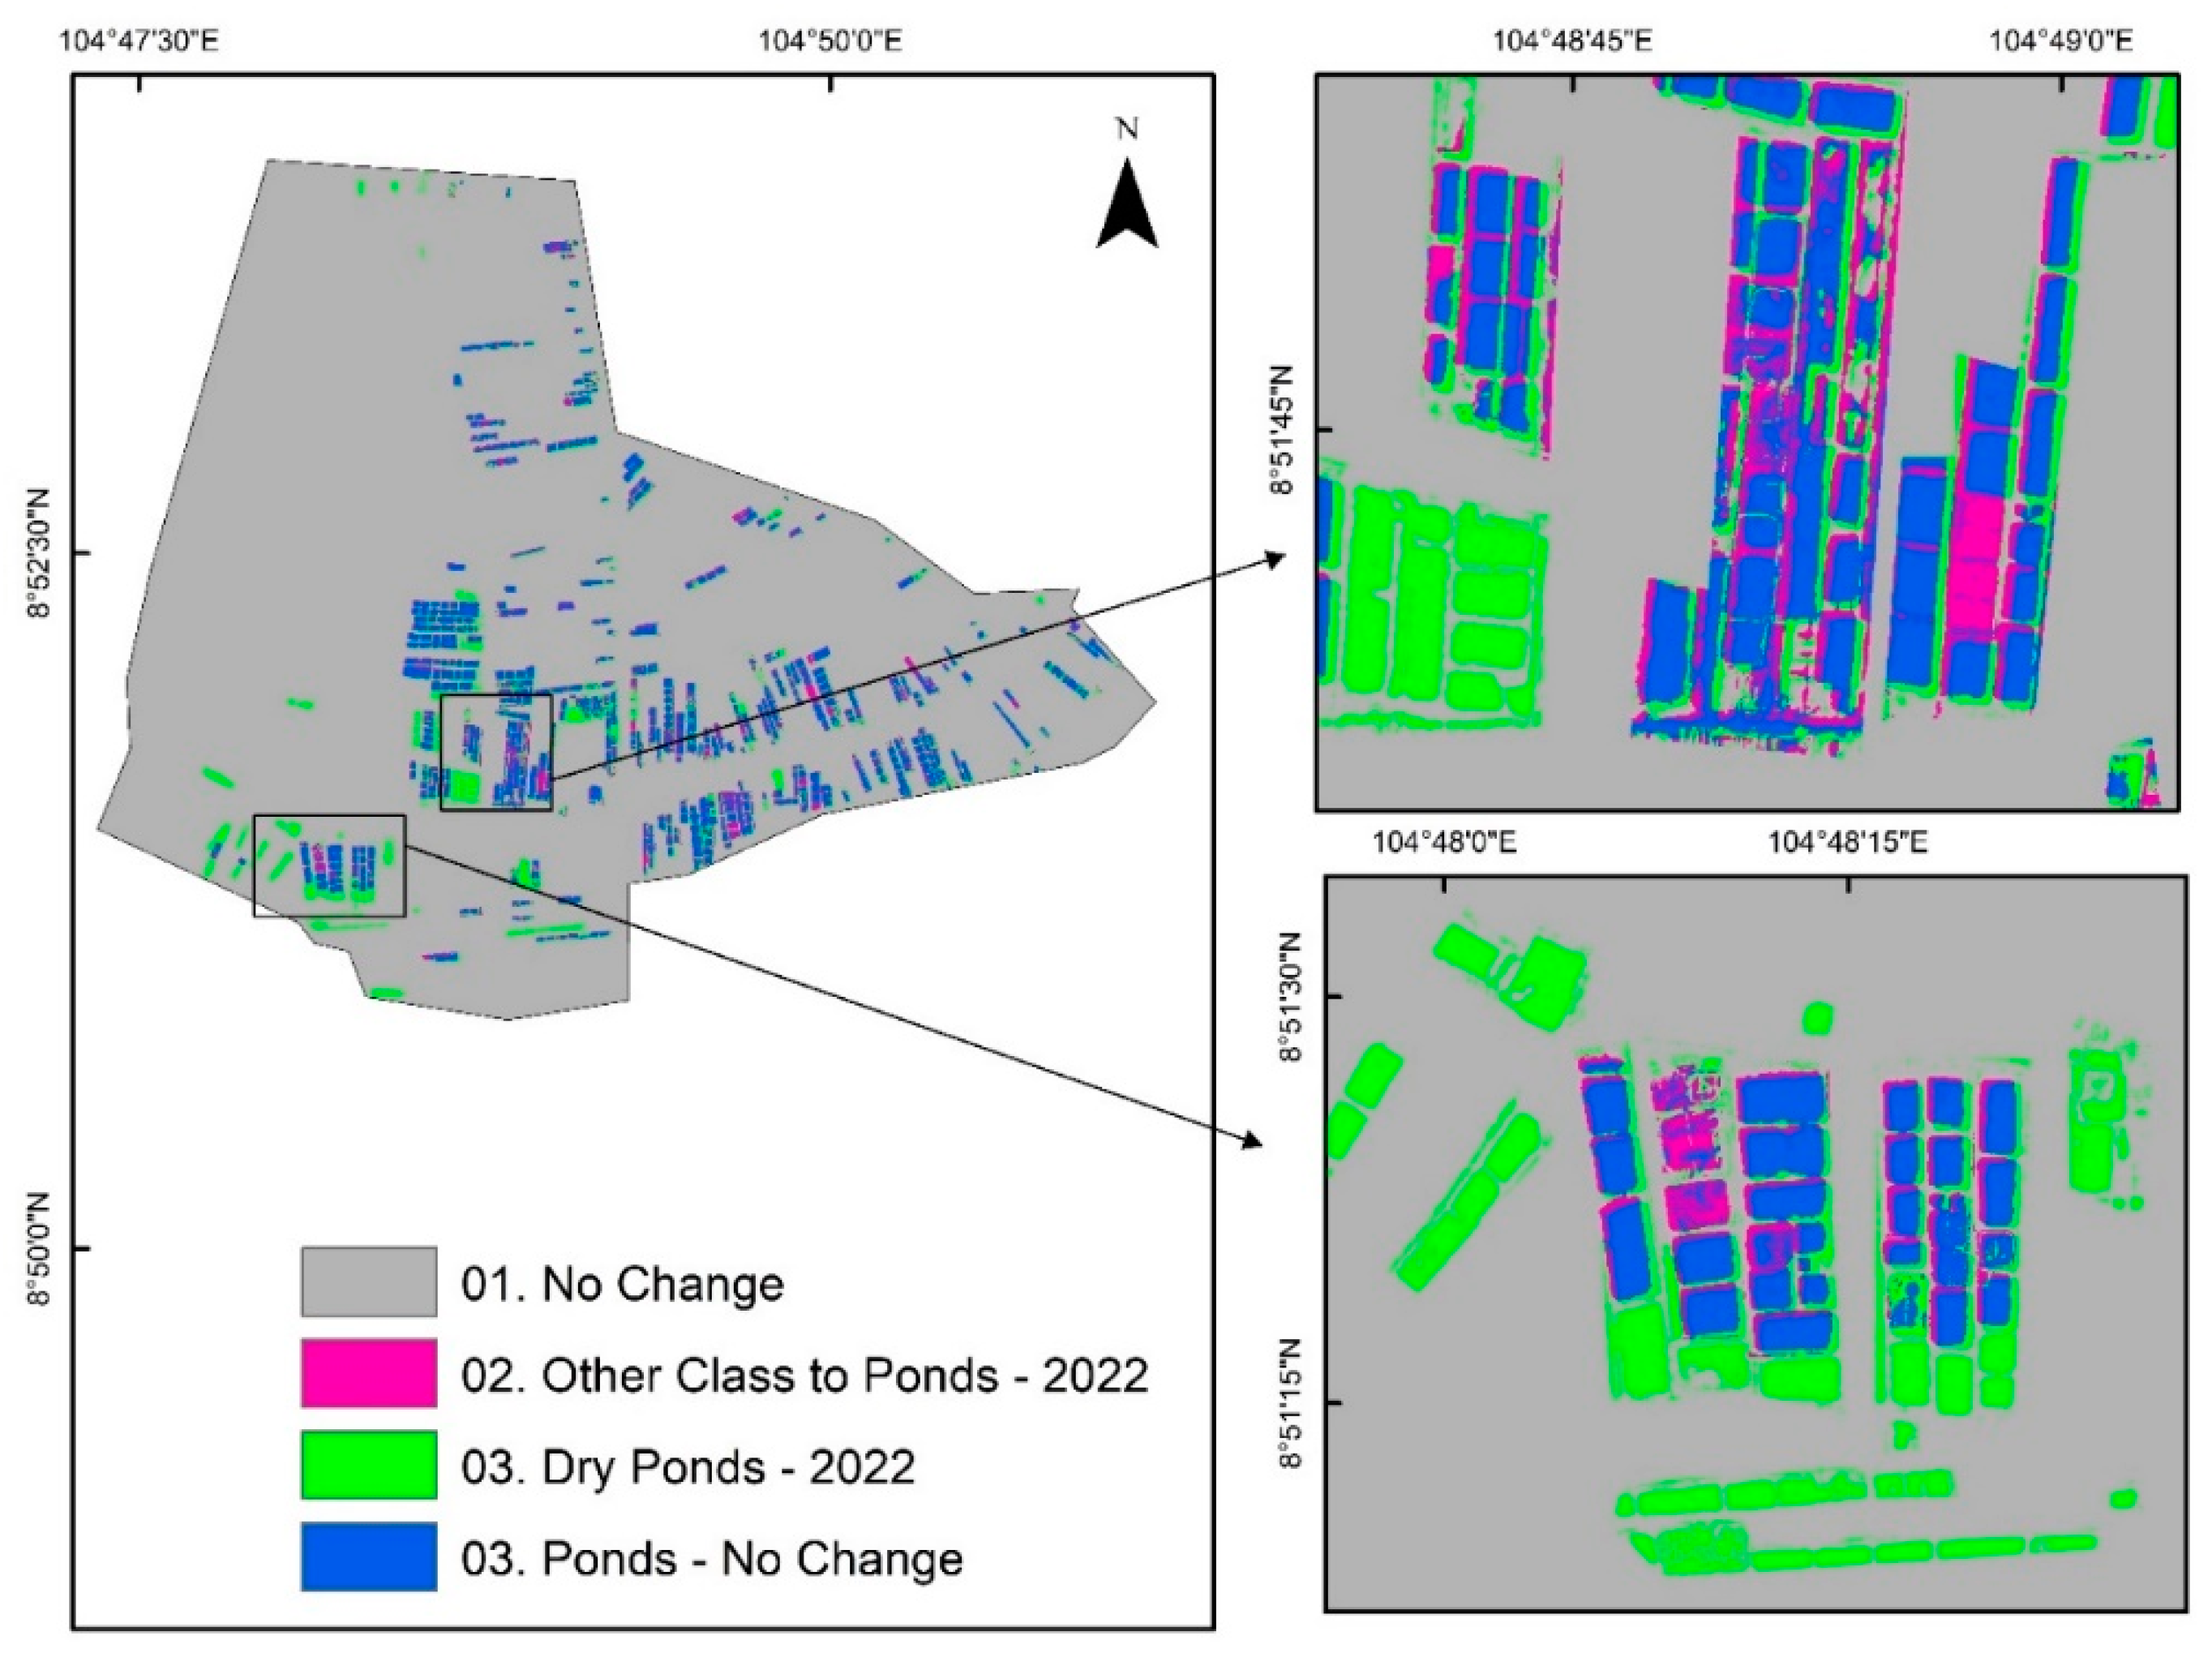
4.5. Change Detection in Shrimp Ponds
4.6. Discussion on Monitoring Shrimp Ponds Using RS Technology
5. Conclusions
Author Contributions
Funding
Institutional Review Board Statement
Informed Consent Statement
Data Availability Statement
Acknowledgments
Conflicts of Interest
References
- Suzuki, A. Rising Importance of Aquaculture in Asia: Current Status, Issues, and Recommendations; Asian Development Outlook Update Background Paper; Asian Development Bank: Manila, Philippines, 2021. [Google Scholar]
- Dhar, U. Asian Development Bank (ADB), Asian Development Outlook 2020: What Drives Innovation in Asia? SAGE Publications Sage India: New Delhi, India, 2021. [Google Scholar]
- Anderson, J.; Valderrama, D.; Jory, D. GOAL 2019: Global Shrimp Production Review; GOAL: Portsmouth, NH, USA, 2019. [Google Scholar]
- Lam, Y.; Winch, P.J.; Alam Nizame, F.; Broaddus-Shea, E.T.; Harun, G.D.; Surkan, P.J. Salinity and food security in southwest coastal Bangladesh: Impacts on household food production and strategies for adaptation. Food Secur. 2022, 14, 229–248. [Google Scholar]
- Parven, A.; Pal, I.; Witayangkurn, A.; Pramanik, M.; Nagai, M.; Miyazaki, H.; Wuthisakkaroon, C. Impacts of disaster and land-use change on food security and adaptation: Evidence from the delta community in Bangladesh. Int. J. Disaster Risk Reduct. 2022, 78, 103119. [Google Scholar]
- Abisha, R.; Krishnani, K.K.; Sukhdhane, K.; Verma, A.K.; Brahmane, M.; Chadha, N.K. Sustainable development of climate-resilient aquaculture and culture-based fisheries through adaptation of abiotic stresses: A review. J. Water Clim. Chang. 2022, 13, 2671–2689. [Google Scholar]
- Shava, E.; Gunhidzirai, C. Fish farming as an innovative strategy for promoting food security in drought risk regions of Zimbabwe. Jàmbá J. Disaster Risk Stud. 2017, 9, 10. [Google Scholar]
- Didar-Ul Islam, S.; Bhuiyan, M.A.H. Impact scenarios of shrimp farming in coastal region of Bangladesh: An approach of an ecological model for sustainable management. Aquac. Int. 2016, 24, 1163–1190. [Google Scholar]
- Loc, H.H.; Lixian, M.L.; Park, E.; Dung, T.D.; Shrestha, S.; Yoon, Y.-J. How the saline water intrusion has reshaped the agricultural landscape of the Vietnamese Mekong Delta, a review. Sci. Total Environ. 2021, 794, 148651. [Google Scholar]
- Suzuki, A.; Hoang Nam, V. Better management practices and their outcomes in shrimp farming: Evidence from small-scale shrimp farmers in Southern Vietnam. Aquac. Int. 2018, 26, 469–486. [Google Scholar]
- Tenório, G.S.; Souza-Filho, P.W.M.; Ramos, E.M.; Alves, P.J.O. Mangrove shrimp farm mapping and productivity on the Brazilian Amazon coast: Environmental and economic reasons for coastal conservation. Ocean Coast. Manag. 2015, 104, 65–77. [Google Scholar]
- Wilder, M.; Phuong, N.T. The status of aquaculture in the Mekong Delta region of Vietnam: Sustainable production and combined farming systems. Fish. Sci. 2002, 68 (Suppl. S1), 847–850. [Google Scholar] [CrossRef]
- Sebesvari, Z.; Le, H.T.T.; Van Toan, P.; Arnold, U.; Renaud, F.G. Agriculture and water quality in the Vietnamese Mekong Delta. In The Mekong Delta System; Springer: Dordrecht, The Netherlands, 2012; pp. 331–361. [Google Scholar]
- Braun, G.; Braun, M.; Kruse, J.; Amelung, W.; Renaud, F.; Khoi, C.; Duong, M.; Sebesvari, Z. Pesticides and antibiotics in permanent rice, alternating rice-shrimp and permanent shrimp systems of the coastal Mekong Delta, Vietnam. Environ. Int. 2019, 127, 442–451. [Google Scholar] [PubMed]
- Tan, L.V.; Tran, T.; Loc, H.H. Soil and water quality indicators of diversified farming systems in a saline region of the Mekong Delta, Vietnam. Agriculture 2020, 10, 38. [Google Scholar] [CrossRef]
- Lee, G.; Suzuki, A.; Vu, H.N. The determinants of detecting veterinary drug residues: Evidence from shrimp farmers in southern Viet Nam. Aquac. Econ. Manag. 2019, 23, 135–157. [Google Scholar]
- Suzuki, A.; Nam, V.H. Blue Revolution in Asia: The Rise of the Shrimp Sector in Vietnam and the Challenges of Disease Control. In Agricultural Development in Asia and Africa: Essays in Honor of Keijiro Otsuka; Springer Nature: Singapore, 2022; pp. 289–303. [Google Scholar]
- Leigh, C.; Stewart-Koster, B.; Van Sang, N.; Van Truc, L.; Hiep, L.H.; Xoan, V.B.; Tinh, N.T.N.; An, L.T.; Sammut, J.; Burford, M.A. Rice-shrimp ecosystems in the Mekong Delta: Linking water quality, shrimp and their natural food sources. Sci. Total Environ. 2020, 739, 139931. [Google Scholar] [PubMed]
- Gentry, R.R.; Froehlich, H.E.; Grimm, D.; Kareiva, P.; Parke, M.; Rust, M.; Gaines, S.D.; Halpern, B.S. Mapping the global potential for marine aquaculture. Nat. Ecol. Evol. 2017, 1, 1317–1324. [Google Scholar]
- Béland, M.; Goïta, K.; Bonn, F.; Pham, T.T.H. Assessment of land-cover changes related to shrimp aquaculture using remote sensing data: A case study in the Giao Thuy District, Vietnam. Int. J. Remote Sens. 2006, 27, 1491–1510. [Google Scholar]
- Gusmawati, N.F.; Zhi, C.; Soulard, B.; Lemonnier, H.; Selmaoui-Folcher, N. Aquaculture Pond Precise Mapping in Perancak Estuary, Bali, Indonesia. J. Coast. Res. 2016, 75, 637–641. [Google Scholar]
- Seto, K.C.; Fragkias, M. Mangrove conversion and aquaculture development in Vietnam: A remote sensing-based approach for evaluating the Ramsar Convention on Wetlands. Glob. Environ. Chang. 2007, 17, 486–500. [Google Scholar]
- Cui, B.; Fei, D.; Shao, G.; Lu, Y.; Chu, J. Extracting raft aquaculture areas from remote sensing images via an improved U-net with a PSE structure. Remote Sens. 2019, 11, 2053. [Google Scholar]
- Ottinger, M.; Clauss, K.; Kuenzer, C. Large-scale assessment of coastal aquaculture ponds with Sentinel-1 time series data. Remote Sens. 2017, 9, 440. [Google Scholar]
- MacAulay, S.; Ellison, A.R.; Kille, P.; Cable, J. Moving towards improved surveillance and earlier diagnosis of aquatic pathogens: From traditional methods to emerging technologies. Rev. Aquac. 2022, 14, 1813–1829. [Google Scholar] [CrossRef]
- Hou, T.; Sun, W.; Chen, C.; Yang, G.; Meng, X.; Peng, J. Marine floating raft aquaculture extraction of hyperspectral remote sensing images based decision tree algorithm. Int. J. Appl. Earth Obs. Geoinf. 2022, 111, 102846. [Google Scholar]
- Gumma, M.K.; Amede, T.; Getnet, M.; Pinjarla, B.; Panjala, P.; Legesse, G.; Tilahun, G.; Akker, E.V.D.; Berdel, W.; Keller, C.; et al. Assessing potential locations for flood-based farming using satellite imagery: A case study of Afar region, Ethiopia. Renew. Agric. Food Syst. 2019, 37, S28–S42. [Google Scholar] [CrossRef]
- Thenkabail, P.S.; Gumma, M.; Fujii, H.; Namara, R. Spatial models for selecting the most suitable areas of rice cultivation in the Inland Valley Wetlands of Ghana using remote sensing and geographic information systems. J. Appl. Remote Sens. 2009, 3, 033537. [Google Scholar] [CrossRef]
- Feyisa, G.L.; Meilby, H.; Fensholt, R.; Proud, S.R. Automated Water Extraction Index: A new technique for surface water mapping using Landsat imagery. Remote Sens. Environ. 2014, 140, 23–35. [Google Scholar]
- Li, J.; Meng, Y.; Li, Y.; Cui, Q.; Yang, X.; Tao, C.; Wang, Z.; Li, L.; Zhang, W. Accurate water extraction using remote sensing imagery based on normalized difference water index and unsupervised deep learning. J. Hydrol. 2022, 612, 128202. [Google Scholar]
- Gumma, M.K.; Panjala, P.; Deevi, K.C.; Bellam, P.K.; Dheeravath, V.; Mohammed, I. Impacts of irrigation tank restoration on water bodies and croplands in Telangana State of India using Landsat time series data and machine learning algorithms. Geocarto Int. 2023, 38, 2186493. [Google Scholar]
- Diniz, C.; Cortinhas, L.; Pinheiro, M.L.; Sadeck, L.; Filho, A.F.; Baumann, L.R.F.; Adami, M.; Souza-Filho, P.W.M. A Large-Scale Deep-Learning Approach for Multi-Temporal Aqua and Salt-Culture Mapping. Remote Sens. 2021, 13, 1415. [Google Scholar]
- Kurekin, A.A.; Miller, P.I.; Avillanosa, A.L.; Sumeldan, J.D.C. Monitoring of Coastal Aquaculture Sites in the Philippines through Automated Time Series Analysis of Sentinel-1 SAR Images. Remote Sens. 2022, 14, 2862. [Google Scholar] [CrossRef]
- Virdis, S.G.P. An object-based image analysis approach for aquaculture ponds precise mapping and monitoring: A case study of Tam Giang-Cau Hai Lagoon, Vietnam. Environ. Monit. Assess. 2014, 186, 117–133. [Google Scholar] [CrossRef] [PubMed]
- Sun, Z.; Luo, J.; Yang, J.; Yu, Q.; Zhang, L.; Xue, K.; Lu, L. Nation-Scale Mapping of Coastal Aquaculture Ponds with Sentinel-1 SAR Data Using Google Earth Engine. Remote Sens. 2020, 12, 3086. [Google Scholar]
- Gumma, M.K.; Takashi, Y.; Panjala, P.; Deevi, K.C.; Inthavong, V.; Bellam, P.K.; Mohammed, I. Assessment of Cropland Changes Due to New Canals in Vientiane Prefecture of Laos using Earth Observation Data. Smart Agric. Technol. 2023, 4, 100149. [Google Scholar]
- Ottinger, M.; Bachofer, F.; Huth, J.; Kuenzer, C. Mapping Aquaculture Ponds for the Coastal Zone of Asia with Sentinel-1 and Sentinel-2 Time Series. Remote Sens. 2021, 14, 153. [Google Scholar] [CrossRef]
- Wang, X.; Xiao, X.; Zou, Z.; Hou, L.; Qin, Y.; Dong, J.; Doughty, R.B.; Chen, B.; Zhang, X.; Chen, Y.; et al. Mapping coastal wetlands of China using time series Landsat images in 2018 and Google Earth Engine. ISPRS J. Photogramm. Remote Sens. 2020, 163, 312–326. [Google Scholar]
- Chen, B.; Xiao, X.; Li, X.; Pan, L.; Doughty, R.; Ma, J.; Dong, J.; Qin, Y.; Zhao, B.; Wu, Z.; et al. A mangrove forest map of China in 2015: Analysis of time series Landsat 7/8 and Sentinel-1A imagery in Google Earth Engine cloud computing platform. ISPRS J. Photogramm. Remote Sens. 2017, 131, 104–120. [Google Scholar]
- Farda, N. Multi-temporal land use mapping of coastal wetlands area using machine learning in Google earth engine. IOP Conf. Ser. Earth Environ. Sci. 2017, 98, 012042. [Google Scholar] [CrossRef]
- Hardy, A.; Oakes, G.; Ettritch, G. Tropical wetland (TropWet) mapping tool: The automatic detection of open and vegetated waterbodies in Google Earth engine for tropical wetlands. Remote Sens. 2020, 12, 1182. [Google Scholar] [CrossRef]
- Kolli, M.K.; Opp, C.; Karthe, D.; Pradhan, B. Automatic extraction of large-scale aquaculture encroachment areas using Canny Edge Otsu algorithm in Google Earth Engine–the case study of Kolleru Lake, South India. Geocarto Int. 2022, 37, 11173–11189. [Google Scholar] [CrossRef]
- Giri, S.; Samanta, S.; Mondal, P.P.; Basu, O.; Khorat, S.; Chanda, A.; Hazra, S. A geospatial assessment of growth pattern of aquaculture in the Indian Sundarbans Biosphere Reserve. Environ. Dev. Sustain. 2022, 24, 4203–4225. [Google Scholar]
- Peralta, R.V.; Tamondong, A.M. Evaluation of Canny Edge Detection and Muti-Threshold Segmentation Technique for Precise Mapping and Inventory of Aquaculture Ponds in Coastal Areas. 2015. Available online: https://api.semanticscholar.org/CorpusID:26455864 (accessed on 21 June 2023).
- Lacaux, J.; Tourre, Y.; Vignolles, C.; Ndione, J.; Lafaye, M. Classification of ponds from high-spatial resolution remote sensing: Application to Rift Valley Fever epidemics in Senegal. Remote Sens. Environ. 2007, 106, 66–74. [Google Scholar]
- Prasad, K.A.; Ottinger, M.; Wei, C.; Leinenkugel, P. Assessment of coastal aquaculture for India from Sentinel-1 SAR time series. Remote Sens. 2019, 11, 357. [Google Scholar] [CrossRef]
- Islam, M.A.; Thenkabail, P.S.; Kulawardhana, R.W.; Alankara, R.; Gunasinghe, S.; Edussriya, C.; Gunawardana, A. Semi-automated methods for mapping wetlands using Landsat ETM+ and SRTM data. Int. J. Remote Sens. 2008, 29, 7077–7106. [Google Scholar] [CrossRef]
- Chen, Y.; Song, J.; Yan, C.; Hong, X. Effects of submergence stress at the vegetative growth stage on hybrid rice growth and grain yield in China. Chil. J. Agric. Res. 2021, 81, 191–201. [Google Scholar] [CrossRef]
- Minh, H.V.T.; Lavane, K.; Van Ty, T.; Downes, N.K.; Hong, T.T.K.; Kumar, P. Evaluation of the Impact of Drought and Saline Water Intrusion on Rice Yields in the Mekong Delta, Vietnam. Water 2022, 14, 3499. [Google Scholar] [CrossRef]
- Pham, H.T.; Bui, L.T. Mechanism of erosion zone formation based on hydrodynamic factor analysis in the Mekong Delta coast, Vietnam. Environ. Technol. Innov. 2023, 30, 103094. [Google Scholar] [CrossRef]
- Park, E.; Loc, H.H.; Van Binh, D.; Kantoush, S. The worst 2020 saline water intrusion disaster of the past century in the Mekong Delta: Impacts, causes, and management implications. Ambio 2022, 51, 691–699. [Google Scholar] [CrossRef] [PubMed]
- ADB. Climate Risks in the Mekong Delta: Ca Mau and Kien Giang Provinces of Viet Nam; Asian Development Bank: Mandaluyong, Philippines, 2013. [Google Scholar]
- Thenkabail, P.; GangadharaRao, P.; Biggs, T.; Krishna, M.; Turral, H. Spectral matching techniques to determine historical land-use/land-cover (LULC) and irrigated areas using time-series 0.1-degree AVHRR pathfinder datasets. Photogramm. Eng. Remote Sens. 2007, 73, 1029–1040. [Google Scholar]
- Teluguntla, P.; Thenkabail, P.S.; Xiong, J.; Gumma, M.K.; Congalton, R.G.; Oliphant, A.; Poehnelt, J.; Yadav, K.; Rao, M.; Massey, R. Spectral matching techniques (SMTs) and automated cropland classification algorithms (ACCAs) for mapping croplands of Australia using MODIS 250-m time-series (2000–2015) data. Int. J. Digit. Earth 2017, 10, 944–977. [Google Scholar] [CrossRef]
- Congalton, R.G.; Green, K. Assessing the Accuracy of Remotely Sensed Data: Principles and Practices; CRC Press: Boca Raton, FL, USA, 2019. [Google Scholar]
- Congalton, R.G. A review of assessing the accuracy of classifications of remotely sensed data. Remote Sens. Environ. 1991, 37, 35–46. [Google Scholar] [CrossRef]
- Cohen, J. A coefficient of agreement for nominal scales. Educ. Psychol. Meas. 1960, 20, 36–47. [Google Scholar] [CrossRef]
- Veettil, B.K.; Ward, R.D.; Quang, N.X.; Trang, N.T.T.; Giang, T.H. Mangroves of Vietnam: Historical development, current state of research and future threats. Estuar. Coast. Shelf Sci. 2019, 218, 212–236. [Google Scholar] [CrossRef]
- Phan, V.H.; Dinh, V.T.; Su, Z. Trends in Long-Term Drought Changes in the Mekong River Delta of Vietnam. Remote Sens. 2020, 12, 2974. [Google Scholar] [CrossRef]
- Phan, M.H.; Stive, M.J. Managing mangroves and coastal land cover in the Mekong Delta. Ocean Coast. Manag. 2022, 219, 106013. [Google Scholar] [CrossRef]
- Ottinger, M.; Clauss, K.; Kuenzer, C. Opportunities and challenges for the estimation of aquaculture production based on earth observation data. Remote Sens. 2018, 10, 1076. [Google Scholar] [CrossRef]
- Duan, Y.; Tian, B.; Li, X.; Liu, D.; Sengupta, D.; Wang, Y.; Peng, Y. Tracking changes in aquaculture ponds on the China coast using 30 years of Landsat images. Int. J. Appl. Earth Obs. Geoinf. 2021, 102, 102383. [Google Scholar] [CrossRef]
- Alexandridis, T.K.; Topaloglou, C.A.; Lazaridou, E.; Zalidis, G.C. The performance of satellite images in mapping aquacultures. Ocean Coast. Manag. 2008, 51, 638–644. [Google Scholar] [CrossRef]
- Xia, Z.; Guo, X.; Chen, R. Automatic extraction of aquaculture ponds based on Google Earth Engine. Ocean Coast. Manag. 2020, 198, 105348. [Google Scholar] [CrossRef]
- Veettil, B.K.; Quang, N.X.; Trang, N.T.T. Changes in mangrove vegetation, aquaculture and paddy cultivation in the Mekong Delta: A study from Ben Tre Province, southern Vietnam. Estuar. Coast. Shelf Sci. 2019, 226, 106273. [Google Scholar] [CrossRef]
- Lappe, R.; Ullmann, T.; Bachofer, F. State of the Vietnamese coast—Assessing three decades (1986 to 2021) of coastline dynamics using the Landsat archive. Remote Sens. 2022, 14, 2476. [Google Scholar] [CrossRef]
- Xu, Y.; Hu, Z.; Zhang, Y.; Wang, J.; Yin, Y.; Wu, G. Mapping aquaculture areas with Multi-Source spectral and texture features: A case study in the pearl river basin (Guangdong), China. Remote Sens. 2021, 13, 4320. [Google Scholar] [CrossRef]


| Satellite | Bands—Spatial Resolution | Bands | Utilization |
|---|---|---|---|
| DMC3/TripleSat | Pan:0.8 m, Multispectral: 3.2 m | Pan, Blue, Green, Red, NIR | 2019 Shrimp ponds Map |
| Jilin-1KF01A | Pan: 0.75 m, Multispectral: 3 m | Pan, Blue, Green, Red, NIR | 2022 Shrimp Ponds Map |
| Sentinel-2 | B2, B3, B8: 10 m, B11, B12: 20 m | B1-B8, B8a, B9-B12 | Water bodies Mask (through different water Indices) |
| LULC | 2022 (ha) | 2019 (ha) | Change (ha) | % Change |
|---|---|---|---|---|
| Shrimp Ponds | 148.11 | 174.71 | −26.60 | −15.20 |
| Other Ponds | 682.51 | 1020.01 | −337.50 | −33.08 |
| Streams | 67.48 | 109.56 | −42.08 | −38.40 |
| Vegetation | 1210.77 | 560.67 | 650.10 | 115.95 |
| Other LULC | 55.09 | 299.08 | −243.99 | −81.58 |
| LULC Class | Reference Totals | Classified Totals | Number Correct | Producer’s Accuracy | User’s Accuracy | Kappa Coefficient |
|---|---|---|---|---|---|---|
| a. 2019 | ||||||
| 01. Shrimp Ponds | 11 | 11 | 10 | 90.91% | 90.91% | 0.8255 |
| 02. Ponds (Other) | 22 | 26 | 22 | 100.00% | 84.62% | |
| 03. Streams | 7 | 6 | 6 | 85.71% | 100.00% | |
| 04. Vegetation | 14 | 11 | 11 | 78.57% | 100.00% | |
| 05. Other LULC | 2 | 0 | 0 | |||
| Totals | 56 | 56 | 49 | |||
| Overall Classification Accuracy | 87.50% | |||||
| b. 2022 | ||||||
| 01. Shrimp Pond | 10 | 9 | 9 | 90.00% | 100.00% | 0.8531 |
| 02. Ponds (Other) | 21 | 20 | 18 | 85.71% | 90.00% | |
| 03. Streams | 6 | 5 | 5 | 83.33% | 100.00% | |
| 04. Vegetation | 16 | 19 | 16 | 100.00% | 84.21% | |
| 05. Other LULC | 2 | 1 | 1 | 50.00% | 100.00% | |
| Totals | 56 | 56 | 50 | |||
| Overall Classification Accuracy | 89.29% | |||||
Disclaimer/Publisher’s Note: The statements, opinions and data contained in all publications are solely those of the individual author(s) and contributor(s) and not of MDPI and/or the editor(s). MDPI and/or the editor(s) disclaim responsibility for any injury to people or property resulting from any ideas, methods, instructions or products referred to in the content. |
© 2023 by the authors. Licensee MDPI, Basel, Switzerland. This article is an open access article distributed under the terms and conditions of the Creative Commons Attribution (CC BY) license (https://creativecommons.org/licenses/by/4.0/).
Share and Cite
Bellam, P.K.; Gumma, M.K.; Panjala, P.; Mohammed, I.; Suzuki, A. Mapping Shrimp Pond Dynamics: A Spatiotemporal Study Using Remote Sensing Data and Machine Learning. AgriEngineering 2023, 5, 1432-1447. https://doi.org/10.3390/agriengineering5030089
Bellam PK, Gumma MK, Panjala P, Mohammed I, Suzuki A. Mapping Shrimp Pond Dynamics: A Spatiotemporal Study Using Remote Sensing Data and Machine Learning. AgriEngineering. 2023; 5(3):1432-1447. https://doi.org/10.3390/agriengineering5030089
Chicago/Turabian StyleBellam, Pavan Kumar, Murali Krishna Gumma, Pranay Panjala, Ismail Mohammed, and Aya Suzuki. 2023. "Mapping Shrimp Pond Dynamics: A Spatiotemporal Study Using Remote Sensing Data and Machine Learning" AgriEngineering 5, no. 3: 1432-1447. https://doi.org/10.3390/agriengineering5030089