
Spatiotemporal Dynamics of Land Use and Land Cover through Physical–Hydraulic Indices: Insights in the São Francisco River Transboundary Region, Brazilian Semiarid Area
 ,
,  , , ,
, , ,
Abstract
:1. Introduction
2. Materials and Methods
2.1. Characterization of the Study Site
2.2. Remote Sensing Data
2.3. Rainfall Data
2.4. Land Use and Land Cover Classifications
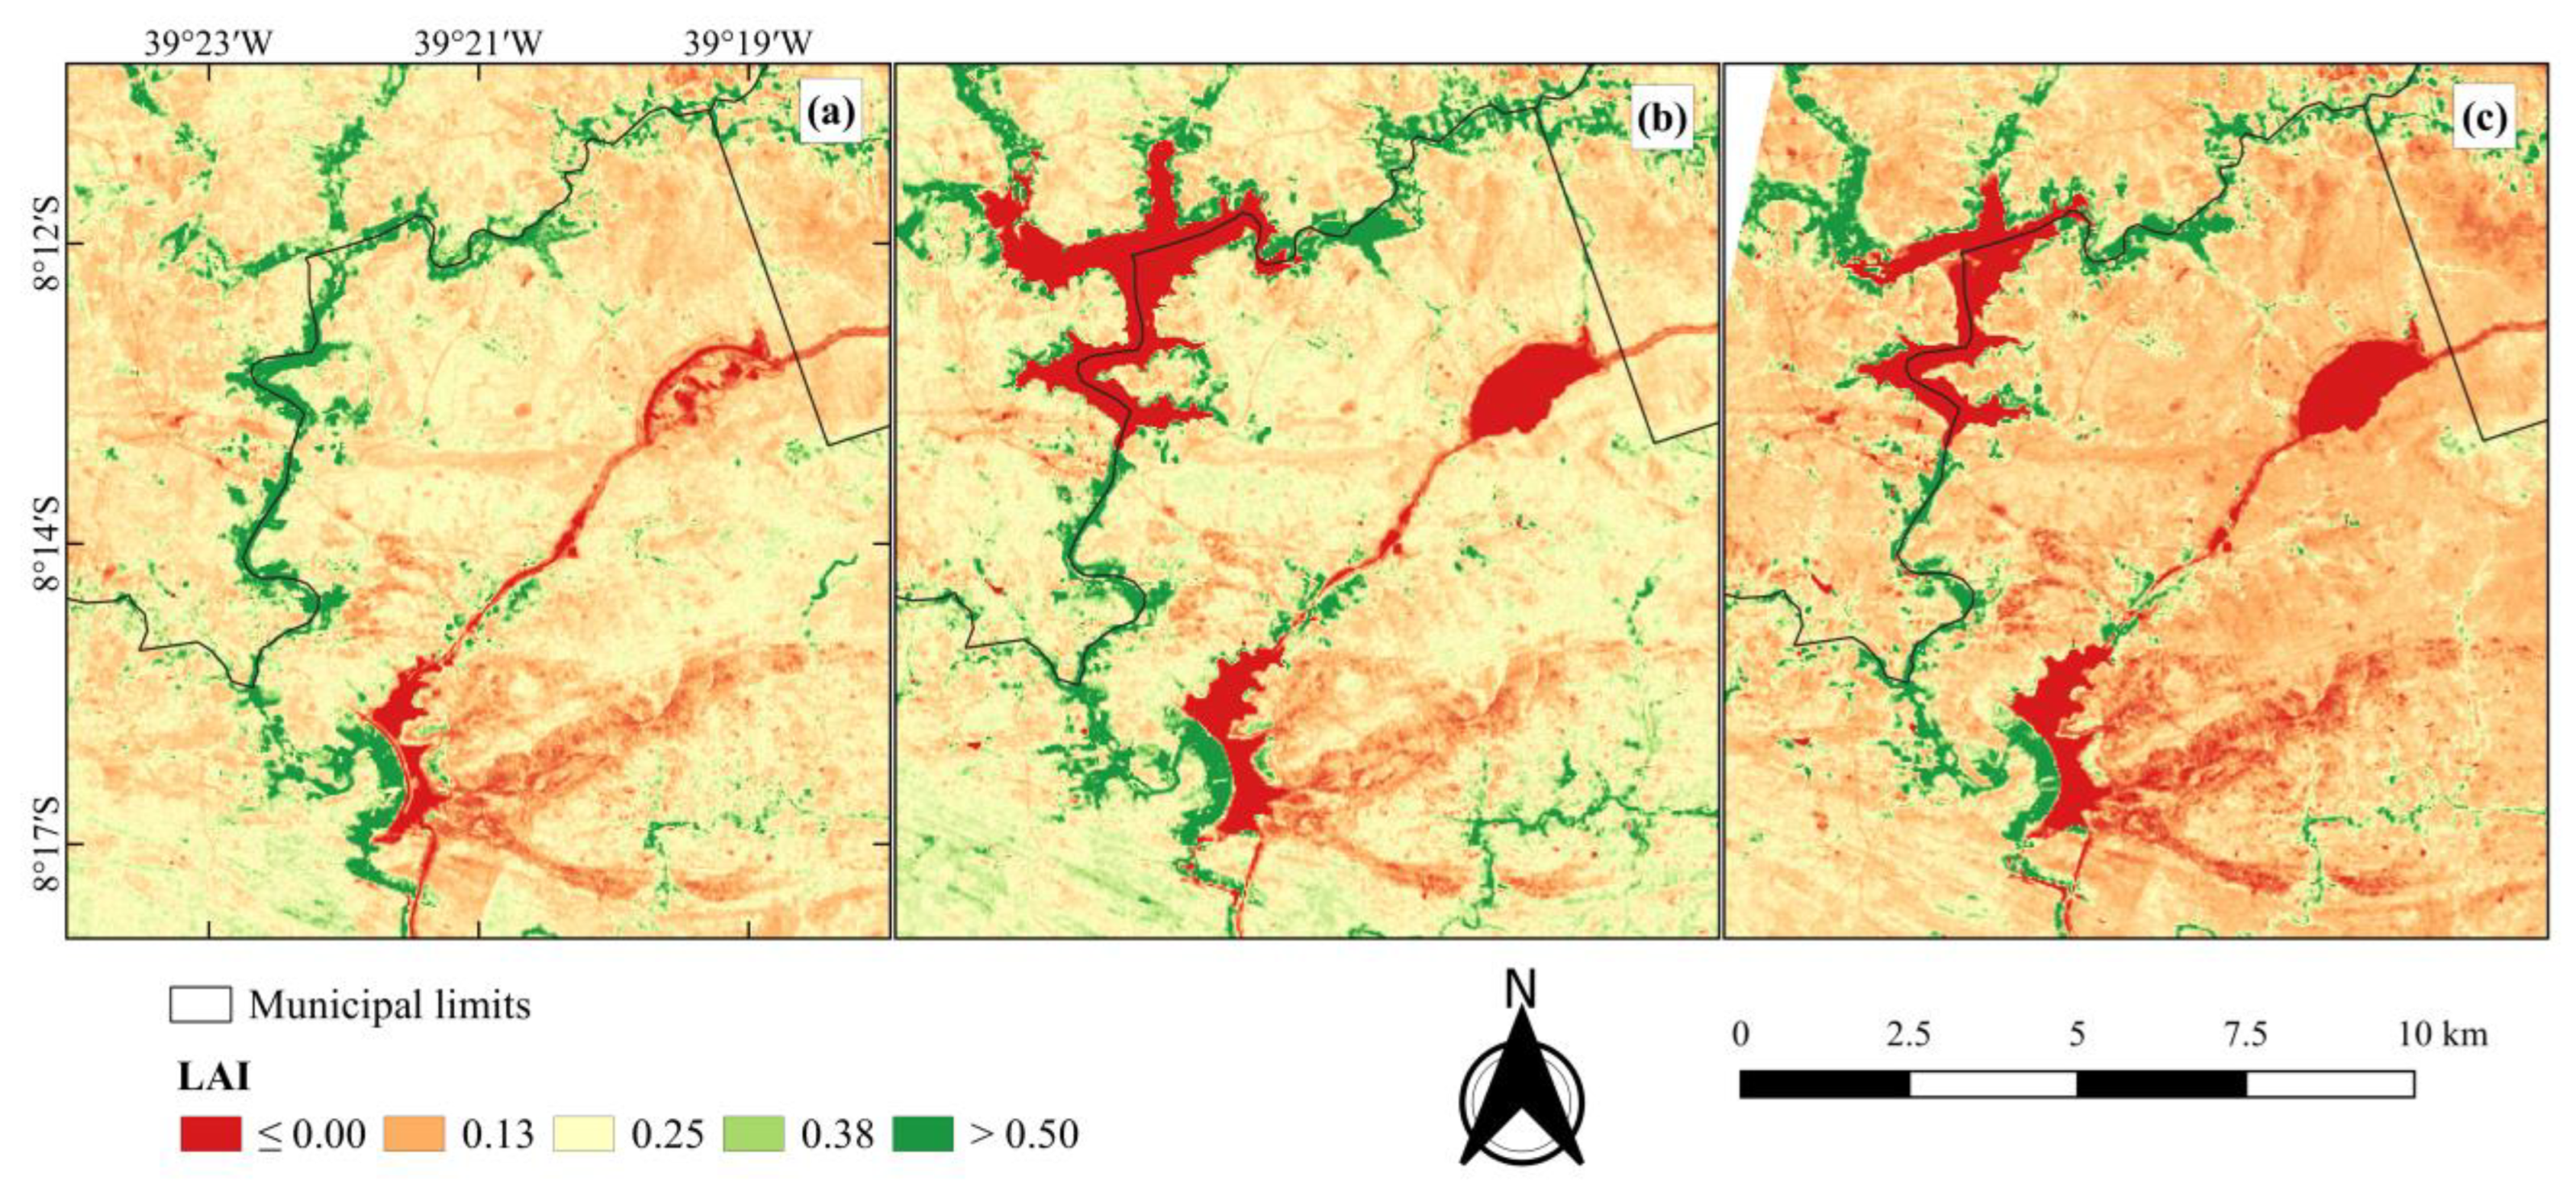
2.5. Calculation of Water and Vegetation Indices
2.6. Image Processing and Statistical Analysis
3. Results
4. Discussion
5. Conclusions
Author Contributions
Funding
Institutional Review Board Statement
Informed Consent Statement
Data Availability Statement
Acknowledgments
Conflicts of Interest
References
- Hu, J.; Yang, Z.; Hou, C.; Ouyang, W. Compound Risk Dynamics of Drought by Extreme Precipitation and Temperature Events in a Semi-Arid Watershed. Atmos. Res. 2023, 281, 106474. [Google Scholar] [CrossRef]
- Dong, T.; Liu, J.; Liu, D.; He, P.; Li, Z.; Shi, M.; Xu, J. Spatiotemporal Variability Characteristics of Extreme Climate Events in Xinjiang during 1960–2019. Environ. Sci. Pollut. Res. 2023, 30, 57316–57330. [Google Scholar] [CrossRef]
- de Brito, C.S.; da Silva, R.M.; Santos, C.A.G.; Brasil Neto, R.M.; Coelho, V.H.R. Monitoring Meteorological Drought in a Semiarid Region Using Two Long-Term Satellite-Estimated Rainfall Datasets: A Case Study of the Piranhas River Basin, Northeastern Brazil. Atmos. Res. 2021, 250, 105380. [Google Scholar] [CrossRef]
- Refati, D.C.; da Silva, J.L.B.; Macedo, R.S.; Lima, R.d.C.C.; da Silva, M.V.; Pandorfi, H.; Silva, P.C.; de Oliveira-Júnior, J.F. Influence of Drought and Anthropogenic Pressures on Land Use and Land Cover Change in the Brazilian Semiarid Region. J. S. Am. Earth Sci. 2023, 126, 104362. [Google Scholar] [CrossRef]
- Montenegro, A.A.d.A.; Abrantes, J.R.C.B.; de Lima, J.L.M.P.; Singh, V.P.; Santos, T.E.M. Impact of Mulching on Soil and Water Dynamics under Intermittent Simulated Rainfall. Catena 2013, 109, 139–149. [Google Scholar] [CrossRef]
- Peña-Angulo, D.; Nadal-Romero, E.; González-Hidalgo, J.C.; Albaladejo, J.; Andreu, V.; Barhi, H.; Bernal, S.; Biddoccu, M.; Bienes, R.; Campo, J.; et al. Relationship of Weather Types on the Seasonal and Spatial Variability of Rainfall, Runoff, and Sediment Yield in the Western Mediterranean Basin. Atmosphere 2020, 11, 609. [Google Scholar] [CrossRef]
- da Silva, M.V.; Pandorfi, H.; de Almeida, G.L.P.; de Lima, R.P.; dos Santos, A.; Jardim, A.M.d.R.F.; Rolim, M.M.; da Silva, J.L.B.; Batista, P.H.D.; da Silva, R.A.B.; et al. Spatio-Temporal Monitoring of Soil and Plant Indicators under Forage Cactus Cultivation by Geoprocessing in Brazilian Semi-Arid Region. J. S. Am. Earth Sci. 2021, 107, 103155. [Google Scholar] [CrossRef]
- da Silva, M.V.; Pandorfi, H.; Lopes, P.M.O.; da Silva, J.L.B.; de Almeida, G.L.P.; Silva, D.A.d.O.; dos Santos, A.; Rodrigues, J.A.d.M.; Batista, P.H.D.; Jardim, A.M.d.R.F. Pilot Monitoring of Caatinga Spatial-Temporal Dynamics through the Action of Agriculture and Livestock in the Brazilian Semiarid. Remote Sens. Appl. Soc. Environ. 2020, 19, 100353. [Google Scholar] [CrossRef]
- da Silva, J.L.B.; Moura, G.B.d.A.; da Silva, M.V.; Lopes, P.M.O.; Guedes, R.V.d.S.; e Silva, Ê.F.d.F.; Ortiz, P.F.S.; Rodrigues, J.A.d.M. Changes in the Water Resources, Soil Use and Spatial Dynamics of Caatinga Vegetation Cover over Semiarid Region of the Brazilian Northeast. Remote Sens. Appl. Soc. Environ. 2020, 20, 100372. [Google Scholar] [CrossRef]
- Barbosa, H.A.; Kumar, T.V.L. Influence of Rainfall Variability on the Vegetation Dynamics over Northeastern Brazil. J. Arid Environ. 2016, 124, 377–387. [Google Scholar] [CrossRef]
- Vieira, R.M.D.S.P.; Tomasella, J.; Barbosa, A.A.; Martins, M.A.; Rodriguez, D.A.; Rezende, F.S.D.; Carriello, F.; Santana, M.D.O. Desertification Risk Assessment in Northeast Brazil: Current Trends and Future Scenarios. Land Degrad. Dev. 2021, 32, 224–240. [Google Scholar] [CrossRef]
- Bezerra, F.G.S.; Aguiar, A.P.D.; Alvalá, R.C.S.; Giarolla, A.; Bezerra, K.R.A.; Lima, P.V.P.S.; do Nascimento, F.R.; Arai, E. Analysis of Areas Undergoing Desertification, Using EVI2 Multi-Temporal Data Based on MODIS Imagery as Indicator. Ecol. Indic. 2020, 117, 106579. [Google Scholar] [CrossRef]
- Moura, M.M.; Walter, L.S.; Lins, T.R.d.S.; Araujo, E.C.G.; da Cunha Neto, E.M.; Santana, G.M.; Brasil, I.D.S.; Silva, T.C. Temporal Analysis of Desertification Vulnerability in Northeast Brazil Using Google Earth Engine. Trans. GIS 2022, 26, 2041–2055. [Google Scholar] [CrossRef]
- Vieira, R.M.d.S.P.; Sestini, M.F.; Tomasella, J.; Marchezini, V.; Pereira, G.R.; Barbosa, A.A.; Santos, F.C.; Rodriguez, D.A.; do Nascimento, F.R.; Santana, M.O.; et al. Characterizing Spatio-Temporal Patterns of Social Vulnerability to Droughts, Degradation and Desertification in the Brazilian Northeast. Environ. Sustain. Indic. 2020, 5, 100016. [Google Scholar] [CrossRef]
- Albuquerque, P.I.D.M.; Rodrigues, J.P.B.; Peixoto, F.D.S.; Miranda, M.D.P. Sensoriamento Remoto Aplicado Em Indicadores de Desertificação No Municipio de Parelhas—RN. Rev. Geogr. 2020, 37, 241. [Google Scholar] [CrossRef]
- da Silva, M.V.M.; Lima, C.E.S.; Silveira, C.d.S. Impact of Climate Change and Consumptive Demands on the Performance of São Francisco River Reservoirs, Brazil. Climate 2023, 11, 89. [Google Scholar] [CrossRef]
- Melo, L.d.M.d.; Pessoa, M.M.d.L.; Silva, E.A.; Chaves, L.D.F.d.C. Landscape Change with the Transposition of the São Francisco River, in the Domain Caatinga, Pernambuco. Floresta 2021, 51, 648. [Google Scholar] [CrossRef]
- Instituto de Pesquisa Econômica Aplicada (IPEA). Transposição Do Rio São Francisco: Análise de Oportunidade Do Projeto; IPEA: Rio de Janeiro, Brazil, 2011; ISBN 1415-4765. [Google Scholar]
- Ministério do Desenvolvimento Regional (MDR). Projeto de Integração Do Rio São Francisco. Available online: https://www.gov.br/mdr/pt-br/assuntos/seguranca-hidrica/projeto-sao-francisco (accessed on 10 December 2022).
- Silva, J.L.B.; Moura, G.B.A.; Silva, Ê.F.F.; Lopes, P.M.O.; Silva, T.T.F.; Lins, F.A.C.; Silva, D.A.O.; Ortiz, P.F.S. Spatial-Temporal Dynamics of the Caatinga Vegetation Cover by Remote Sensing in Municipality of the Brazilian Semi-Arid. Rev. Bras. Ciências Agrárias—Braz. J. Agric. Sci. 2019, 14, 1–10. [Google Scholar] [CrossRef] [Green Version]
- Lins, F.A.C.; Araújo, D.C.D.S.; Da Silva, J.L.B.; Lopes, P.M.O.; Oliveira, J.D.A.; Gomes da Silva, A.T.C.S. Estimativa de Parâmetros Biofísicos e Evapotranspiração Real No Semiárido Pernambucano Utilizando Sensoriamento Remoto. Irriga 2017, 1, 64–75. [Google Scholar] [CrossRef]
- Souza, C.M.; Shimbo, J.Z.; Rosa, M.R.; Parente, L.L.; Alencar, A.A.; Rudorff, B.F.T.; Hasenack, H.; Matsumoto, M.; Ferreira, L.G.; Souza-Filho, P.W.M.; et al. Reconstructing Three Decades of Land Use and Land Cover Changes in Brazilian Biomes with Landsat Archive and Earth Engine. Remote Sens. 2020, 12, 2735. [Google Scholar] [CrossRef]
- Perez-Marin, A.M.; Cavalcante, A.M.B.; Medeiros, S.S.; Tinoco, L.B.M.; Salcedo, I.H. Núcleos de Desertificação No Semiárido Brasileiro: Ocorrência Natural Ou Antrópica? Parcer. Estratégicas-CGEE 2012, 17, 87–106. [Google Scholar]
- Brito, P.V.D.S.; Morais, Y.C.B.; Ferreira, H.D.S.; da Silva, J.F.; Galvíncio, J.D. Análise Comparativa Da Umidade Da Vegetação de Áreas de Caatinga Preservada, Agricultura Irrigada e Sequeiro. J. Environ. Anal. Prog. 2017, 2, 493–498. [Google Scholar] [CrossRef] [Green Version]
- Orusa, T.; Cammareri, D.; Borgogno Mondino, E. A Scalable Earth Observation Service to Map Land Cover in Geomorphological Complex Areas beyond the Dynamic World: An Application in Aosta Valley (NW Italy). Appl. Sci. 2022, 13, 390. [Google Scholar] [CrossRef]
- Pielke, R.A.; Pitman, A.; Niyogi, D.; Mahmood, R.; McAlpine, C.; Hossain, F.; Goldewijk, K.K.; Nair, U.; Betts, R.; Fall, S.; et al. Land Use/Land Cover Changes and Climate: Modeling Analysis and Observational Evidence. WIREs Clim. Chang. 2011, 2, 828–850. [Google Scholar] [CrossRef]
- Orusa, T.; Viani, A.; Cammareri, D.; Borgogno Mondino, E. A Google Earth Engine Algorithm to Map Phenological Metrics in Mountain Areas Worldwide with Landsat Collection and Sentinel-2. Geomatics 2023, 3, 221–238. [Google Scholar] [CrossRef]
- Pielke, R.A. Land Use and Climate Change. Science 2005, 310, 1625–1626. [Google Scholar] [CrossRef] [PubMed] [Green Version]
- de Oliveira-Júnior, J.F.; Shah, M.; Abbas, A.; Correia Filho, W.L.F.; da Silva Junior, C.A.; Santiago, D.d.B.; Teodoro, P.E.; Mendes, D.; de Souza, A.; Aviv-Sharon, E.; et al. Spatiotemporal Analysis of Fire Foci and Environmental Degradation in the Biomes of Northeastern Brazil. Sustainability 2022, 14, 6935. [Google Scholar] [CrossRef]
- Pereira, J.D.A.; Cavalcanti, A.K.G.; Pires, A.L.; Rocha Neto, O.; Carvalho, J.V.A.; Santos, L.C.; Coelho, M.S.; Sousa, P.F.d.N. A Utilização de Sensoriamento Remoto Para Visualização de Possíveis Áreas Desertificadas Nos Municípios de Cajazeiras e Coremas, PB. Braz. J. Dev. 2020, 6, 18009–18021. [Google Scholar] [CrossRef]
- Leonardo, H.R.D.A.L.; de Oliveira, L.M.M.; de Oliveira, E.F.; de Almeida, D.N.O.; de Paiva, A.L.R. Geotechnology in the Analysis of Behavior Spectral of Natural Resources in the Semiarid Pernambucano. J. Hyperspectral Remote Sens. 2019, 9, 191. [Google Scholar] [CrossRef]
- Silva, J.R.I.; Montenegro, A.A.d.A.; Farias, C.W.L.d.A.; Jardim, A.M.d.R.F.; da Silva, T.G.F.; Montenegro, S.M.G.L. Morphometric Characterization and Land Use of the Pajeú River Basin in the Brazilian Semi-Arid Region. J. S. Am. Earth Sci. 2022, 118, 103939. [Google Scholar] [CrossRef]
- Xu, H. Modification of Normalised Difference Water Index (NDWI) to Enhance Open Water Features in Remotely Sensed Imagery. Int. J. Remote Sens. 2006, 27, 3025–3033. [Google Scholar] [CrossRef]
- da Silva, J.L.B.; Moura, G.B.d.A.; da Silva, M.V.; de Oliveira-Júnior, J.F.; Jardim, A.M.d.R.F.; Refati, D.C.; Lima, R.d.C.C.; de Carvalho, A.A.; Ferreira, M.B.; de Brito, J.I.B.; et al. Environmental Degradation of Vegetation Cover and Water Bodies in the Semiarid Region of the Brazilian Northeast via Cloud Geoprocessing Techniques Applied to Orbital Data. J. S. Am. Earth Sci. 2023, 121, 104164. [Google Scholar] [CrossRef]
- da Silva, M.V.; Pandorfi, H.; de Oliveira-Júnior, J.F.; da Silva, J.L.B.; de Almeida, G.L.P.; Montenegro, A.A.d.A.; Mesquita, M.; Ferreira, M.B.; Santana, T.C.; Marinho, G.T.B.; et al. Remote Sensing Techniques via Google Earth Engine for Land Degradation Assessment in the Brazilian Semiarid Region, Brazil. J. S. Am. Earth Sci. 2022, 120, 104061. [Google Scholar] [CrossRef]
- Companhia de Pesquisa de Recursos Minerais (CPRM). Serviço Geológico Do Brasil. Projeto Cadastro de Fontes de Abastecimento Por Água Subterrânea: Diagnóstico Do Município de Cabrobó, Estado de Pernambuco; CPRM: Sao Paulo, Brazil, 2005; Volume 22. [Google Scholar]
- Companhia de Pesquisa de Recursos Minerais (CPRM). Projeto Cadastro de Fontes de Abastecimento Por Água Subterrânea: Diagnóstico Do Município de Terra Nova, Estado de Pernambuco; CPRM: Sao Paulo, Brazil, 2005; Volume 20. [Google Scholar]
- Instituto Brasileiro de Geografia e Estatística (IBGE). Panorama Cabrobó. Available online: https://cidades.ibge.gov.br/brasil/pe/cabrobo/panorama (accessed on 5 December 2022).
- Instituto Brasileiro de Geografia e Estatística (IBGE). Panorama Terra Nova. Available online: https://cidades.ibge.gov.br/brasil/pe/terra-nova/panorama (accessed on 5 December 2020).
- Agência Pernambucana de Águas e Clima (APAC). O Projeto de Integração Do Rio São Francisco. Available online: https://www.apac.pe.gov.br/pisf (accessed on 1 June 2023).
- Companhia de Desenvolvimento dos Vales do São Francisco e do Parnaíba (CODEVASF). Projeto São Francisco. Available online: https://www.codevasf.gov.br/linhas-de-negocio/projeto-sao-francisco/o-que-e-o-projeto-de-integracao-do-sao-francisco (accessed on 1 June 2023).
- Alvares, C.A.; Stape, J.L.; Sentelhas, P.C.; Gonçalves, J.L.d.M.; Sparovek, G. Köppen’s Climate Classification Map for Brazil. Meteorol. Z. 2013, 22, 711–728. [Google Scholar] [CrossRef] [PubMed]
- Beck, H.E.; Zimmermann, N.E.; McVicar, T.R.; Vergopolan, N.; Berg, A.; Wood, E.F. Present and Future Köppen-Geiger Climate Classification Maps at 1-Km Resolution. Sci. Data 2018, 5, 180214. [Google Scholar] [CrossRef] [PubMed] [Green Version]
- Instituto Nacional de Meteorologia (INMET). Normais Climatológicas. Available online: https://clima.inmet.gov.br/GraficosClimatologicos/ (accessed on 10 June 2022).
- Soil Survey Staff. Keys to Soil Taxonomy, 9th ed.; US Department of Agriculture: Washington, DC, USA, 2006. [Google Scholar]
- Agência Pernambucana de Águas e Clima (APAC). Ficha Técnica—Reservatório Nilo Coelho. Available online: http://200.238.107.184/images/media/1602286317_nilocoelhoFicha.pdf (accessed on 22 January 2023).
- Agência Pernambucana de Águas e Clima (APAC). Relatório de Situação de Recursos Hídricos Do Estado de Pernambuco 2011/2012. Available online: https://www.lai.pe.gov.br/apac/wp-content (accessed on 16 June 2022).
- United States Geological Survey (USGS). Earth Explorer. Available online: https://earthexplorer.usgs.gov/ (accessed on 1 December 2022).
- Agência Pernambucana de Águas e Clima (APAC). Monitoramento Pluviométrico. Available online: http://old.apac.pe.gov.br/meteorologia/monitoramento-pluvio.php (accessed on 11 October 2022).
- MapBiomas Brazil. Coleção 7.1 Da Série Anual de Mapas de Cobertura e Uso de Solo Do Brasil. Available online: https://mapbiomas.org/colecoes-mapbiomas-1?cama_set_language=pt-BR (accessed on 11 March 2023).
- Rouse, J.W.; Haas, R.H.; Schell, J.A.; Deering, D.W.; Harlan, J.C. Monitoring the Vernal Advancement of Retrogradation of Natural Vegetation; NASA/GSFCT Type II Report; NASA: Washington, DC, USA, 1973.
- Huete, A.R. A Soil-Adjusted Vegetation Index (SAVI). Remote Sens. Environ. 1988, 25, 295–309. [Google Scholar] [CrossRef]
- Allen, R.G.; Tasumi, M.; Trezza, R. Surface Energy Balance Algorithm for Land (SEBAL)—Advanced Training and User’s Manual. Kimberly Ida. Implement. 2002, 1, 98. [Google Scholar]
- Ribeiro, R.B.; Filgueiras, R.; Ramos, M.C.A.; Nascimento, C.R. Análise Temporal Das Variações de Parâmetros Biofísicos Da Cana-de-Açúcar Em Jaíba—MG. Nativa 2015, 3, 150–155. [Google Scholar] [CrossRef] [Green Version]
- Batista, P.H.D.; de Almeida, G.L.P.; da Silva, J.L.B.; Pandorfi, H.; da Silva, M.V.; da Silva, R.A.B.; de Melo, M.V.N.; Lins, F.A.C.; Cordeiro Junior, J.J.F. Short-Term Grazing and Its Impacts on Soil and Pasture Degradation. Dyna 2020, 87, 123–128. [Google Scholar] [CrossRef]
- Barbosa, H.A.; Lakshmi Kumar, T.V.; Paredes, F.; Elliott, S.; Ayuga, J.G. Assessment of Caatinga Response to Drought Using Meteosat-SEVIRI Normalized Difference Vegetation Index (2008–2016). ISPRS J. Photogramm. Remote Sens. 2019, 148, 235–252. [Google Scholar] [CrossRef]
- Tomasella, J.; Vieira, R.M.S.P.; Barbosa, A.A.; Rodriguez, D.A.; Santana, M.d.O.; Sestini, M.F. Desertification Trends in the Northeast of Brazil over the Period 2000–2016. Int. J. Appl. Earth Obs. Geoinf. 2018, 73, 197–206. [Google Scholar] [CrossRef]
- Asner, G.P.; Scurlock, J.M.O.; Hicke, J.A. Global Synthesis of Leaf Area Index Observations: Implications for Ecological and Remote Sensing Studies. Glob. Ecol. Biogeogr. 2003, 12, 191–205. [Google Scholar] [CrossRef] [Green Version]
- Kumar Nayan, N.; Das, A.; Mukerji, A.; Mazumder, T.; Bera, S. Spatio-Temporal Dynamics of Water Resources of Hyderabad Metropolitan Area and Its Relationship with Urbanization. Land Use Policy 2020, 99, 105010. [Google Scholar] [CrossRef]
- Leite, P.A.M.; de Souza, E.S.; dos Santos, E.S.; Gomes, R.J.; Cantalice, J.R.; Wilcox, B.P. The Influence of Forest Regrowth on Soil Hydraulic Properties and Erosion in a Semiarid Region of Brazil. Ecohydrology 2018, 11, e1910. [Google Scholar] [CrossRef]
- Singh, W.R.; Barman, S.; Tirkey, G. Morphometric Analysis and Watershed Prioritization in Relation to Soil Erosion in Dudhnai Watershed. Appl. Water Sci. 2021, 11, 151. [Google Scholar] [CrossRef]
- Bi, L.; Fu, B.L.; Lou, P.Q.; Tang, T.Y. Delineation Water of Pearl River Basin Using Landsat Images from Google Earth Engine. Int. Arch. Photogramm. Remote Sens. Spat. Inf. Sci. 2020, XLII–3/W10, 5–10. [Google Scholar] [CrossRef] [Green Version]
- de Sousa, L.d.B.; Montenegro, A.A.d.A.; da Silva, T.G.F.; de Carvalho, A.A.; da Silva Neto, M.A. Estimativa Da Evapotranspiração Real e Mapeamento de Áreas Cultivadas Em Uma Bacia Do Projeto de Integração Do São Francisco (PISF), Semiárido Pernambucano. Irriga 2021, 26, 565–583. [Google Scholar] [CrossRef]
- Bourke, S.A.; Shanafield, M.; Hedley, P.; Chapman, S.; Dogramaci, S. A Hydrological Framework for Persistent Pools along Non-Perennial Rivers. Hydrol. Earth Syst. Sci. 2023, 27, 809–836. [Google Scholar] [CrossRef]
- De Carvalho Junior, A.P.; de Novais, R.P.; de Oliveira, M.A. A Perenização de Rios Através Da Construção de Açudes Para o Combate à Seca No Semiárido Nordestino. Geopauta 2022, 6, e9401. [Google Scholar] [CrossRef]
- Lopes, A.V.; Dracup, J.A. The Sao Francisco Transboundary Project: Regulation and Sustainability. In Proceedings of the World Environmental and Water Resources Congress 2011, Palm Springs, CA, USA, 22–26 May 2011; American Society of Civil Engineers: Reston, VA, USA, 2011; pp. 2830–2839. [Google Scholar]
- de Sousa, L.d.B.; Montenegro, A.A.d.A.; da Silva, M.V.; Almeida, T.A.B.; de Carvalho, A.A.; da Silva, T.G.F.; de Lima, J.L.M.P. Spatiotemporal Analysis of Rainfall and Droughts in a Semiarid Basin of Brazil: Land Use and Land Cover Dynamics. Remote Sens. 2023, 15, 2550. [Google Scholar] [CrossRef]


| Date | UTM Time | Sun Elevation Angle | Orbit | Point |
|---|---|---|---|---|
| 29 October 2016 | 12:48:21 | 65.9414 | 217 | 66 |
| 17 September 2018 | 12:47:38 | 61.1147 | 216 | 66 |
| 15 October 2019 | 12:42:13 | 65.7611 | 217 | 66 |
| Land Use and Land Cover Classification | 2016 (ha) | 2016 (%) | 2018 (ha) | 2018 (%) | 2019 (ha) | 2019 (%) |
|---|---|---|---|---|---|---|
| Forest Formation | 7.07 | 0.04% | 15.74 | 0.10% | 25.56 | 0.16% |
| Savanna Formation | 7053.07 | 43.68% | 7237.80 | 44.83% | 7503.64 | 46.48% |
| Grassland Formation | 3232.31 | 20.02% | 3759.63 | 23.29% | 3725.85 | 23.08% |
| Pasture | 2495.44 | 15.46% | 3020.41 | 18.71% | 2974.25 | 18.42% |
| Mosaic of Agriculture and Pasture | 3269.79 | 20.25% | 1382.94 | 8.57% | 1327.67 | 8.22% |
| Urban Infrastructure | 29.89 | 0.19% | 30.42 | 0.19% | 30.33 | 0.19% |
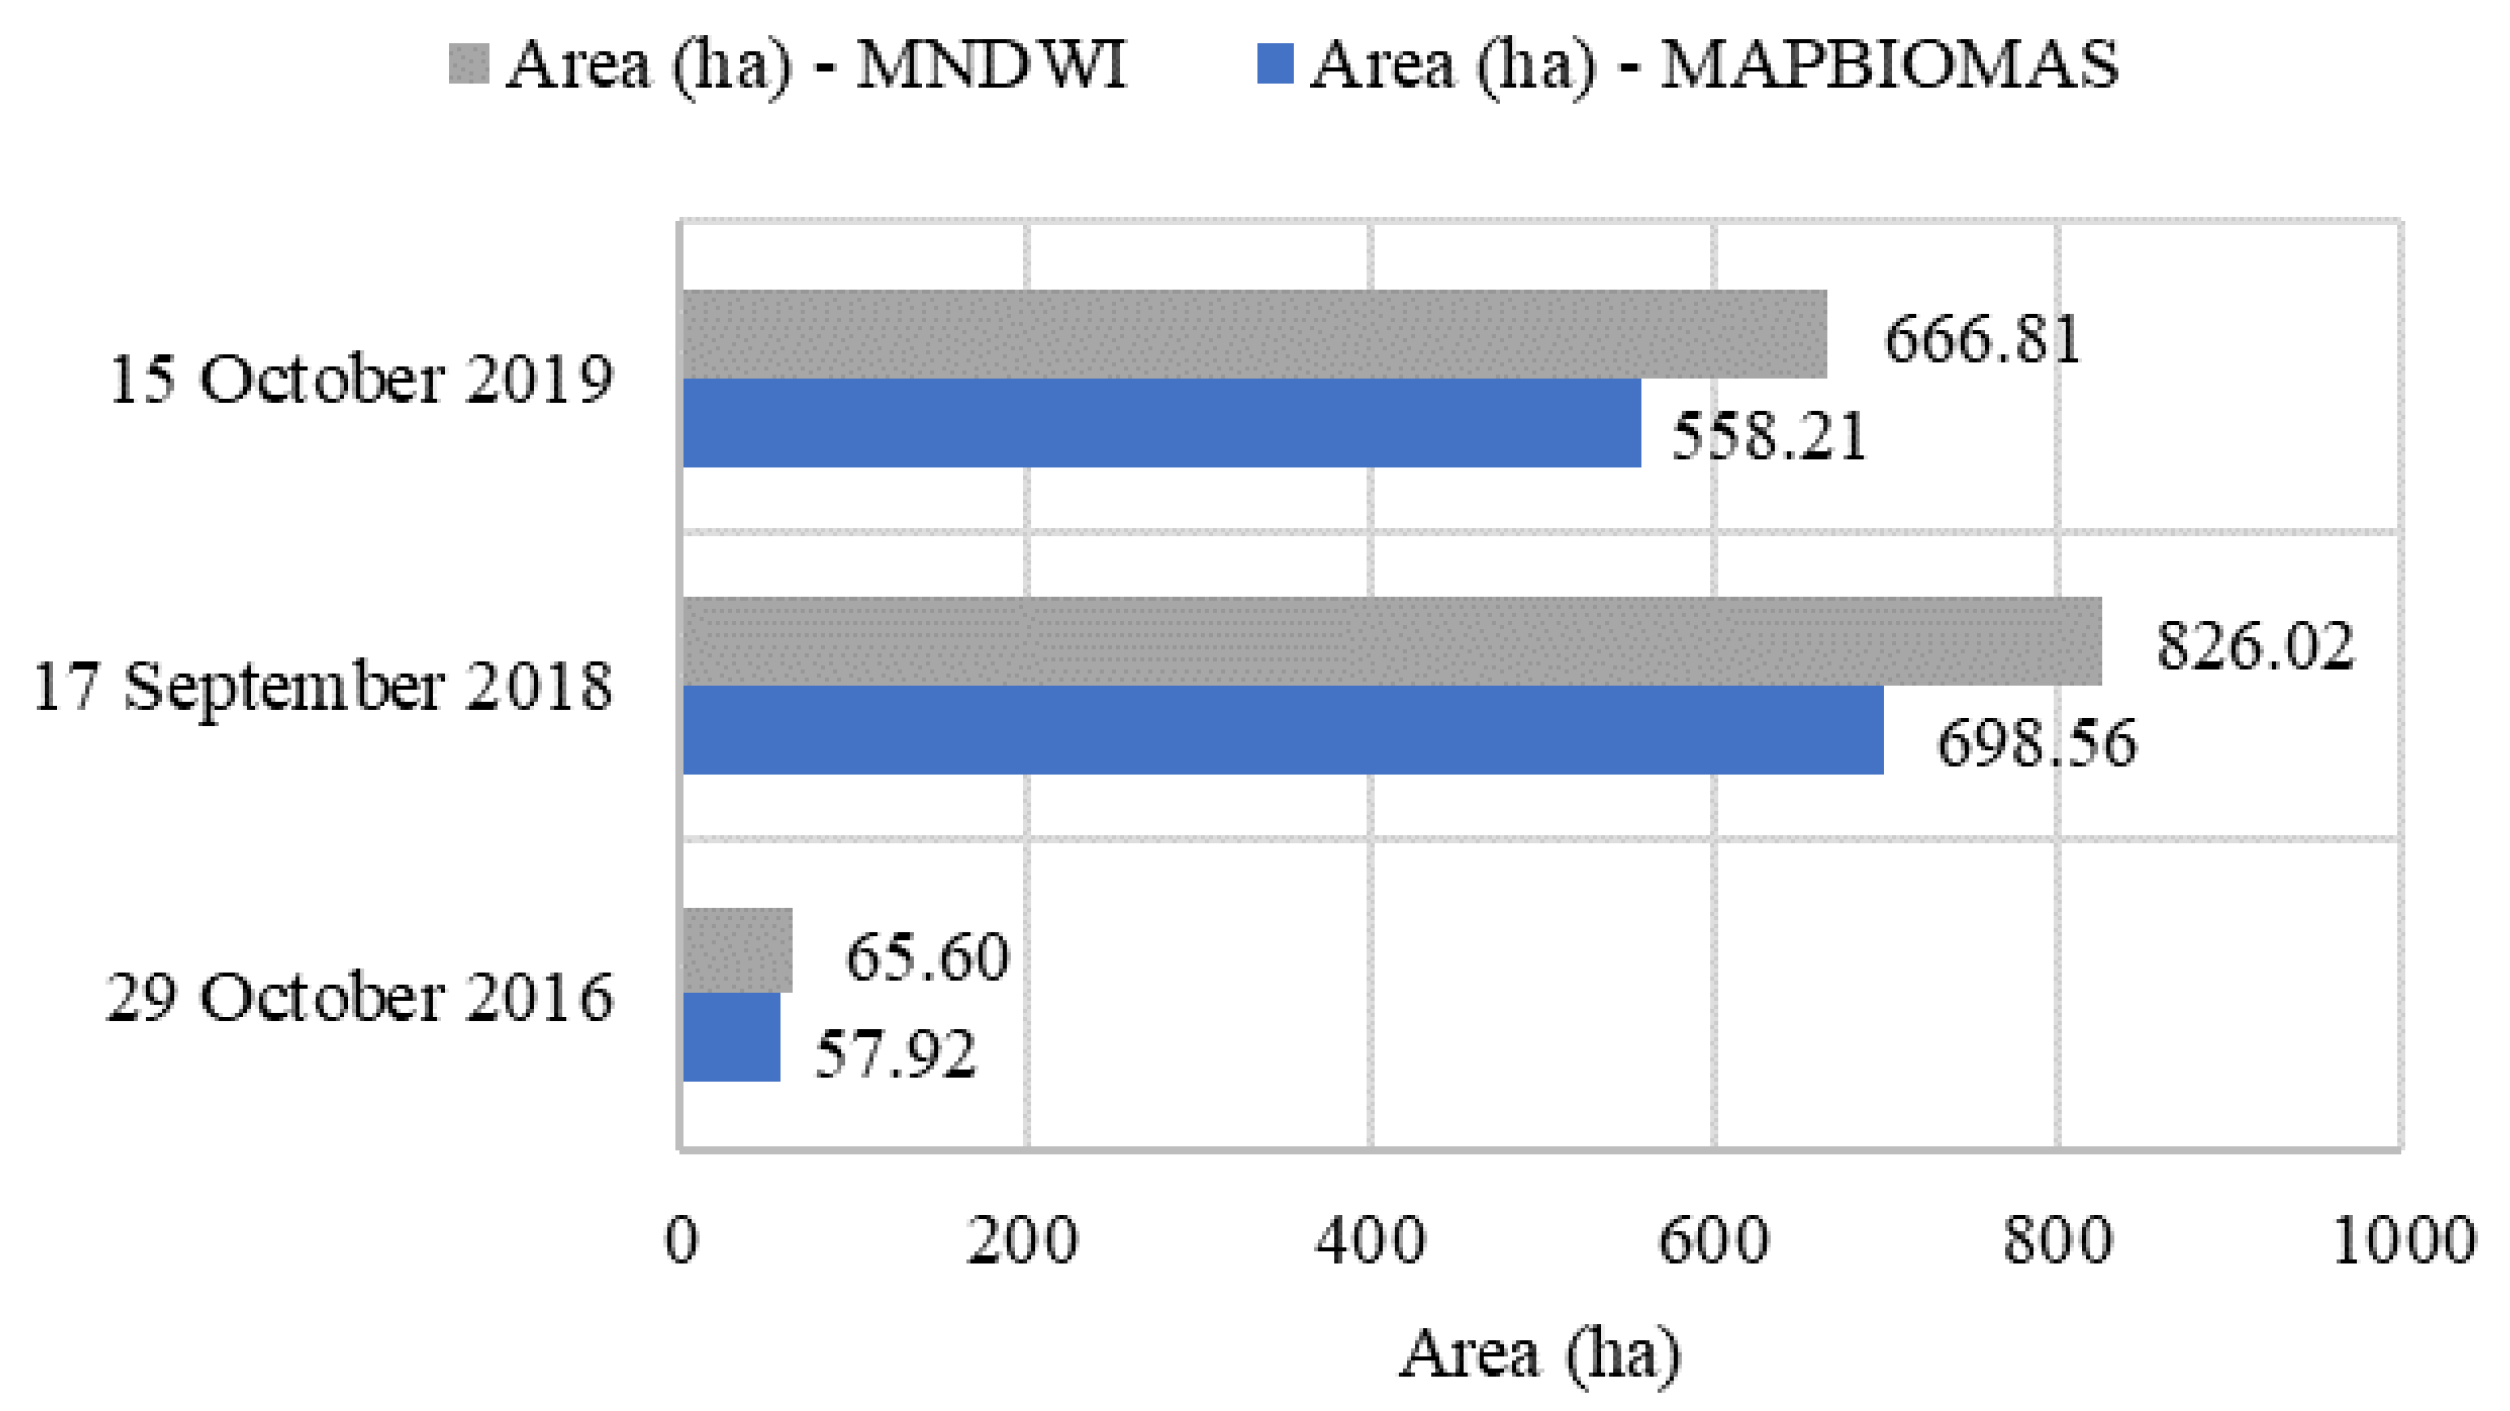
| Water Bodies | 57.92 | 0.36% | 698.56 | 4.33% | 558.21 | 3.46% |
| Date | Minimum | Maximum | Mean | SD 1 | CV 2 (%) |
|---|---|---|---|---|---|
| NDVI | |||||
| 29 October 2016 | −0.483 | 0.953 | 0.356 | 0.086 | 24.22% |
| 17 September 2018 | −0.591 | 0.919 | 0.344 | 0.118 | 34.38% |
| 15 October 2019 | −0.684 | 0.870 | 0.288 | 0.121 | 42.09% |
| LAI | |||||
| 29 October 2016 | −0.377 | 5.800 | 0.237 | 0.145 | 60.95% |
| 17 September 2018 | −0.362 | 4.860 | 0.241 | 0.184 | 76.33% |
| 15 October 2019 | −0.380 | 6.330 | 0.190 | 0.170 | 89.65% |
| MNDWI | |||||
| 29 October 2016 | −0.902 | 0.492 | −0.708 | 0.068 | 9.56% |
| 17 September 2018 | −0.862 | 0.567 | −0.645 | 0.169 | 26.23% |
| 15 October 2019 | −0.734 | 0.641 | −0.581 | 0.168 | 28.97% |
Disclaimer/Publisher’s Note: The statements, opinions and data contained in all publications are solely those of the individual author(s) and contributor(s) and not of MDPI and/or the editor(s). MDPI and/or the editor(s) disclaim responsibility for any injury to people or property resulting from any ideas, methods, instructions or products referred to in the content. |
© 2023 by the authors. Licensee MDPI, Basel, Switzerland. This article is an open access article distributed under the terms and conditions of the Creative Commons Attribution (CC BY) license (https://creativecommons.org/licenses/by/4.0/).
Share and Cite
Sousa, L.d.B.d.; Montenegro, A.A.d.A.; Silva, M.V.d.; Lopes, P.M.O.; Silva, J.R.I.; Silva, T.G.F.d.; Lins, F.A.C.; Silva, P.C. Spatiotemporal Dynamics of Land Use and Land Cover through Physical–Hydraulic Indices: Insights in the São Francisco River Transboundary Region, Brazilian Semiarid Area. AgriEngineering 2023, 5, 1147-1162. https://doi.org/10.3390/agriengineering5030073
Sousa LdBd, Montenegro AAdA, Silva MVd, Lopes PMO, Silva JRI, Silva TGFd, Lins FAC, Silva PC. Spatiotemporal Dynamics of Land Use and Land Cover through Physical–Hydraulic Indices: Insights in the São Francisco River Transboundary Region, Brazilian Semiarid Area. AgriEngineering. 2023; 5(3):1147-1162. https://doi.org/10.3390/agriengineering5030073
Chicago/Turabian StyleSousa, Lizandra de Barros de, Abelardo Antônio de Assunção Montenegro, Marcos Vinícius da Silva, Pabrício Marcos Oliveira Lopes, José Raliuson Inácio Silva, Thieres George Freire da Silva, Frederico Abraão Costa Lins, and Patrícia Costa Silva. 2023. "Spatiotemporal Dynamics of Land Use and Land Cover through Physical–Hydraulic Indices: Insights in the São Francisco River Transboundary Region, Brazilian Semiarid Area" AgriEngineering 5, no. 3: 1147-1162. https://doi.org/10.3390/agriengineering5030073