1. Introduction
Broiler chicken (
Gallus gallus domesticus) production is a competitive meat chain with a short production cycle. It does not present religious limitations and has a low-cost production, attracting consumers from different social classes [
1,
2]. Providing an optimum indoor environment (air quality, temperature, humidity, air velocity, and gas concentration) with the lowest possible cost is essential to improve broiler production [
3].
Air quality plays a vital role in broiler production. Ammonia (NH
3) is aggressive for broilers when trespassing certain limits [
4,
5,
6]. Differences in production management techniques, ambient temperature, and flock density do not explain variations in the concentration of NH
3 in broiler flocks [
7,
8]. However, the current literature has pointed out how ambient humidity and litter management practices are critical factors in generating indoor emissions [
8,
9]. Air movement inside broilers’ houses is essential for maintaining indoor air quality and increasing the birds’ heat loss by convection, increasing beneficial heat exchange [
10].
Indoor climate control requires considerable energy consumption and is fundamental in broiler houses [
11,
12]. It strongly influences the birds’ health, growth, and performance and affects farm profits [
13,
14]. The rearing environmental temperature must be set within the thermal neutral zone to provide appropriate flock productivity [
10]. Similarly, in the comfort temperature zone (CTZ), the energy fraction used by birds for maintaining their homeothermy is at a minimum; therefore, most of the energy supplied by feed is used for growth and meat production. Departure from the temperatures within the CTZ leads to an imbalance in the flocks’ metabolisms, causing negative consequences [
11,
15]. However, most broiler house cooling system controllers are based on dry-bulb temperatures. Martinez et al. [
16] developed a heuristic model relating the broiler rearing environment to dry-bulb temperature, relative humidity, air velocity, and ammonia concentration arrays. The model was centered on flock-based and environmental variables and predicted the suitability of the rearing conditions.
Cutting-edge technology, involving information technology (IT), remote sensing, robotics, cloud computing, Internet of Things (IoT), and Big Data assessment, can improve livestock production, expanding the benefits of rearing environmental control [
17,
18]. Mobile applications (Apps) have been developed lately to help farmers monitor and assess livestock growth and production in real-time as part of the Precision Livestock development [
19,
20,
21]. These Apps include basic statistics tools that provide indicators immediately after flock assessment and potentially calculate changes from previously collected data. Apps allow the input of the main characteristics of housing conditions, flock characteristics, and age at assessment. Data might contain information related to independent variables and the corresponding assessment results when exported. Smartphones are handheld personal computers that have revolutionized communication technologies and information portability [
22]. Currently, practically all people have mobile devices with reasonable processing capacity and access to the Internet, which they use for diverse purposes [
23]. In this scenario, specialist Apps have great potential to improve decision-making in productive systems.
In the current literature, we did not find an App developed for following up on the suitability of flock rearing conditions based on data from broilers and the rearing environment. Therefore, the present study aimed to develop an App to help farmers evaluate the suitability of broiler rearing conditions during the flock’s growth and grade the flock’s performance.
2. Materials and Methods
The present study retrieved data from Brazilian commercial broiler farms that complied with broiler-producing standards and followed the breeders’ recommendations.
In the database, we used historical data from four types of houses named for the lateral closure curtain colors and material (Blue House, Dark House, Solid Wall, and Giant). For each house, 52 measurements were taken twice on the same day (bird age), once in the morning and once in the afternoon. We recorded data in one flock in winter and another in summer and analyzed them. These measurements were taken for ages 21, 28, 35, and 42 days. Since the risk in performance during production in tropical countries is higher after the heating is removed after brooding, we focused our study after the 21st day of growth. A complete description of the experiment, methods, and details of husbandry and management was given in [
16].
2.1. Variable Treatment for App Development
For each group of 52 measurements, we calculated the average of each of the measured quantities per season and per period (morning and afternoon) for the variables carbon dioxide (MCO
2) and ammonia (MNH
3), temperature (MT), air velocity (Mvair), and relative humidity (MU).
Table 1 and
Table 2 summarize the data for 21 days old broilers.
Table 3 is adapted from [
24], provides the comfort temperature for broilers (°C) as a function of age and relative humidity of the environment (%), and was used as the basis for calculating the normalized index of temperature and humidity.
For calculating the niTH index, we considered the range of the CTZ (broiler comfort temperature as a function of the relative humidity) and the mean ambient temperature (mt) as shown in Equation (1):
where CTZ = broiler comfort temperature as a function of the relative humidity, mt = mean ambient temperature (°C), and abs=absolute value.
When relative humidity is < 40% or > 80%, then niTH = -1. Such a scenario already classifies the housing environment as inadequate. In
Table 4,
Table 5,
Table 6,
Table 7 and
Table 8, we present the normalization of environmental control indices for each measured variable.
2.1.1. Description of the Normalized Index for Ammonia Concentration (niNH3)
The normalized index for ammonia concentration was found based on the intervals of the values recorded in each of the four houses (
Table 4).
2.1.2. Description of the Normalized Index for Velocity Air (niVar)
Analogously, from the air velocity data for all the houses, intervals of air velocity as a function of the age of the birds were obtained, which are shown in
Table 5.
2.1.3. Description of the Normalized Index for Carbon Dioxide (niCO2)
The normalized index of CO
2 (niCO
2) ranges was calculated in the same way using normalized values of the CO
2 concentration from the four houses and are shown in
Table 6.
2.1.4. Calculation of the Normalized Performance Index (PI)
With the normalized indices considering the growth period from 21 to 42 d-old broilers, weighting was carried out to obtain a situation index that would categorize the situation of the housing environment.
Table 7 and
Table 8 describe the meanings of the normalized indices used in calculating the PI described in
Table 9.
Equation (2) is the sum of the weights associated with each normalized index and constitutes the denominator of Equation (3), which is a weighted average of the indices as a function of the weights. These weights allowed us to calibrate the performance index in such a way that it was more suited to, for example, the breed of birds.
where sumweight is the sum of the normalized weights and wTH, wNH
3, wCO
2, and wVar are the weights associated with the normalized indices described in
Table 8.
where niTH, niNH
3, niCO
2, and niVar are the normalized indices described in
Table 7.
Table 9 shows the values for the performance index (PI).
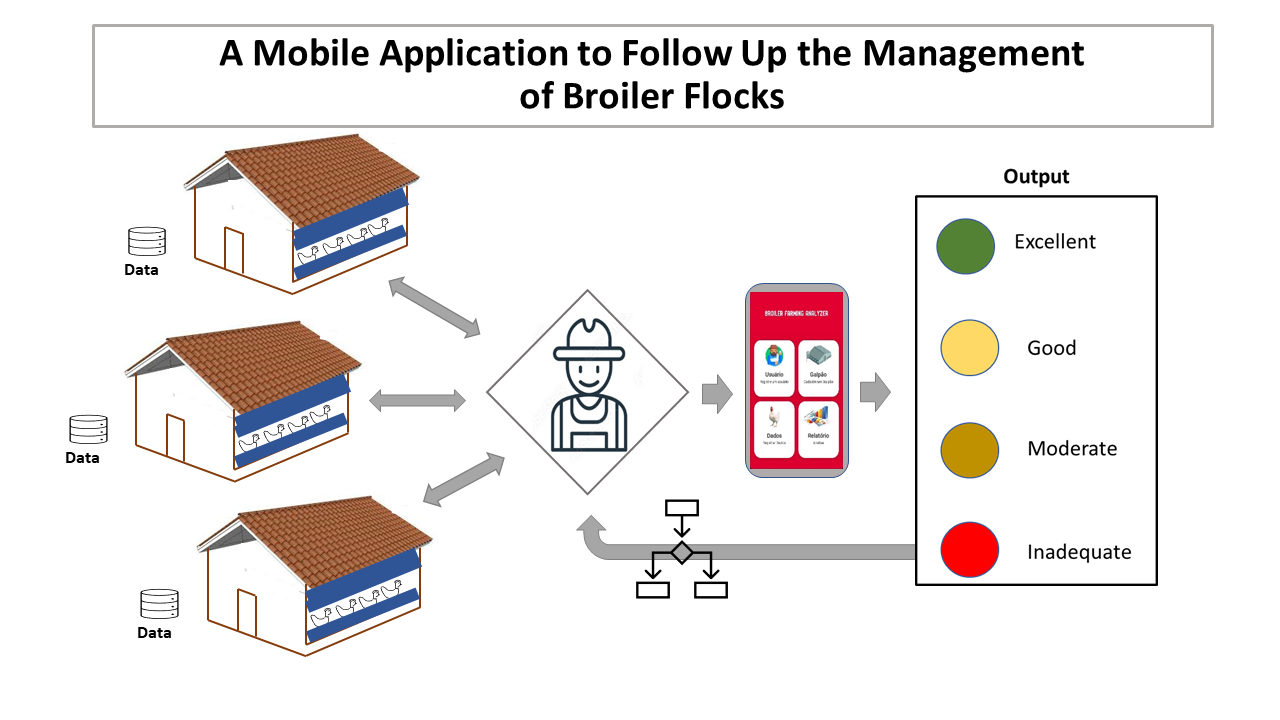
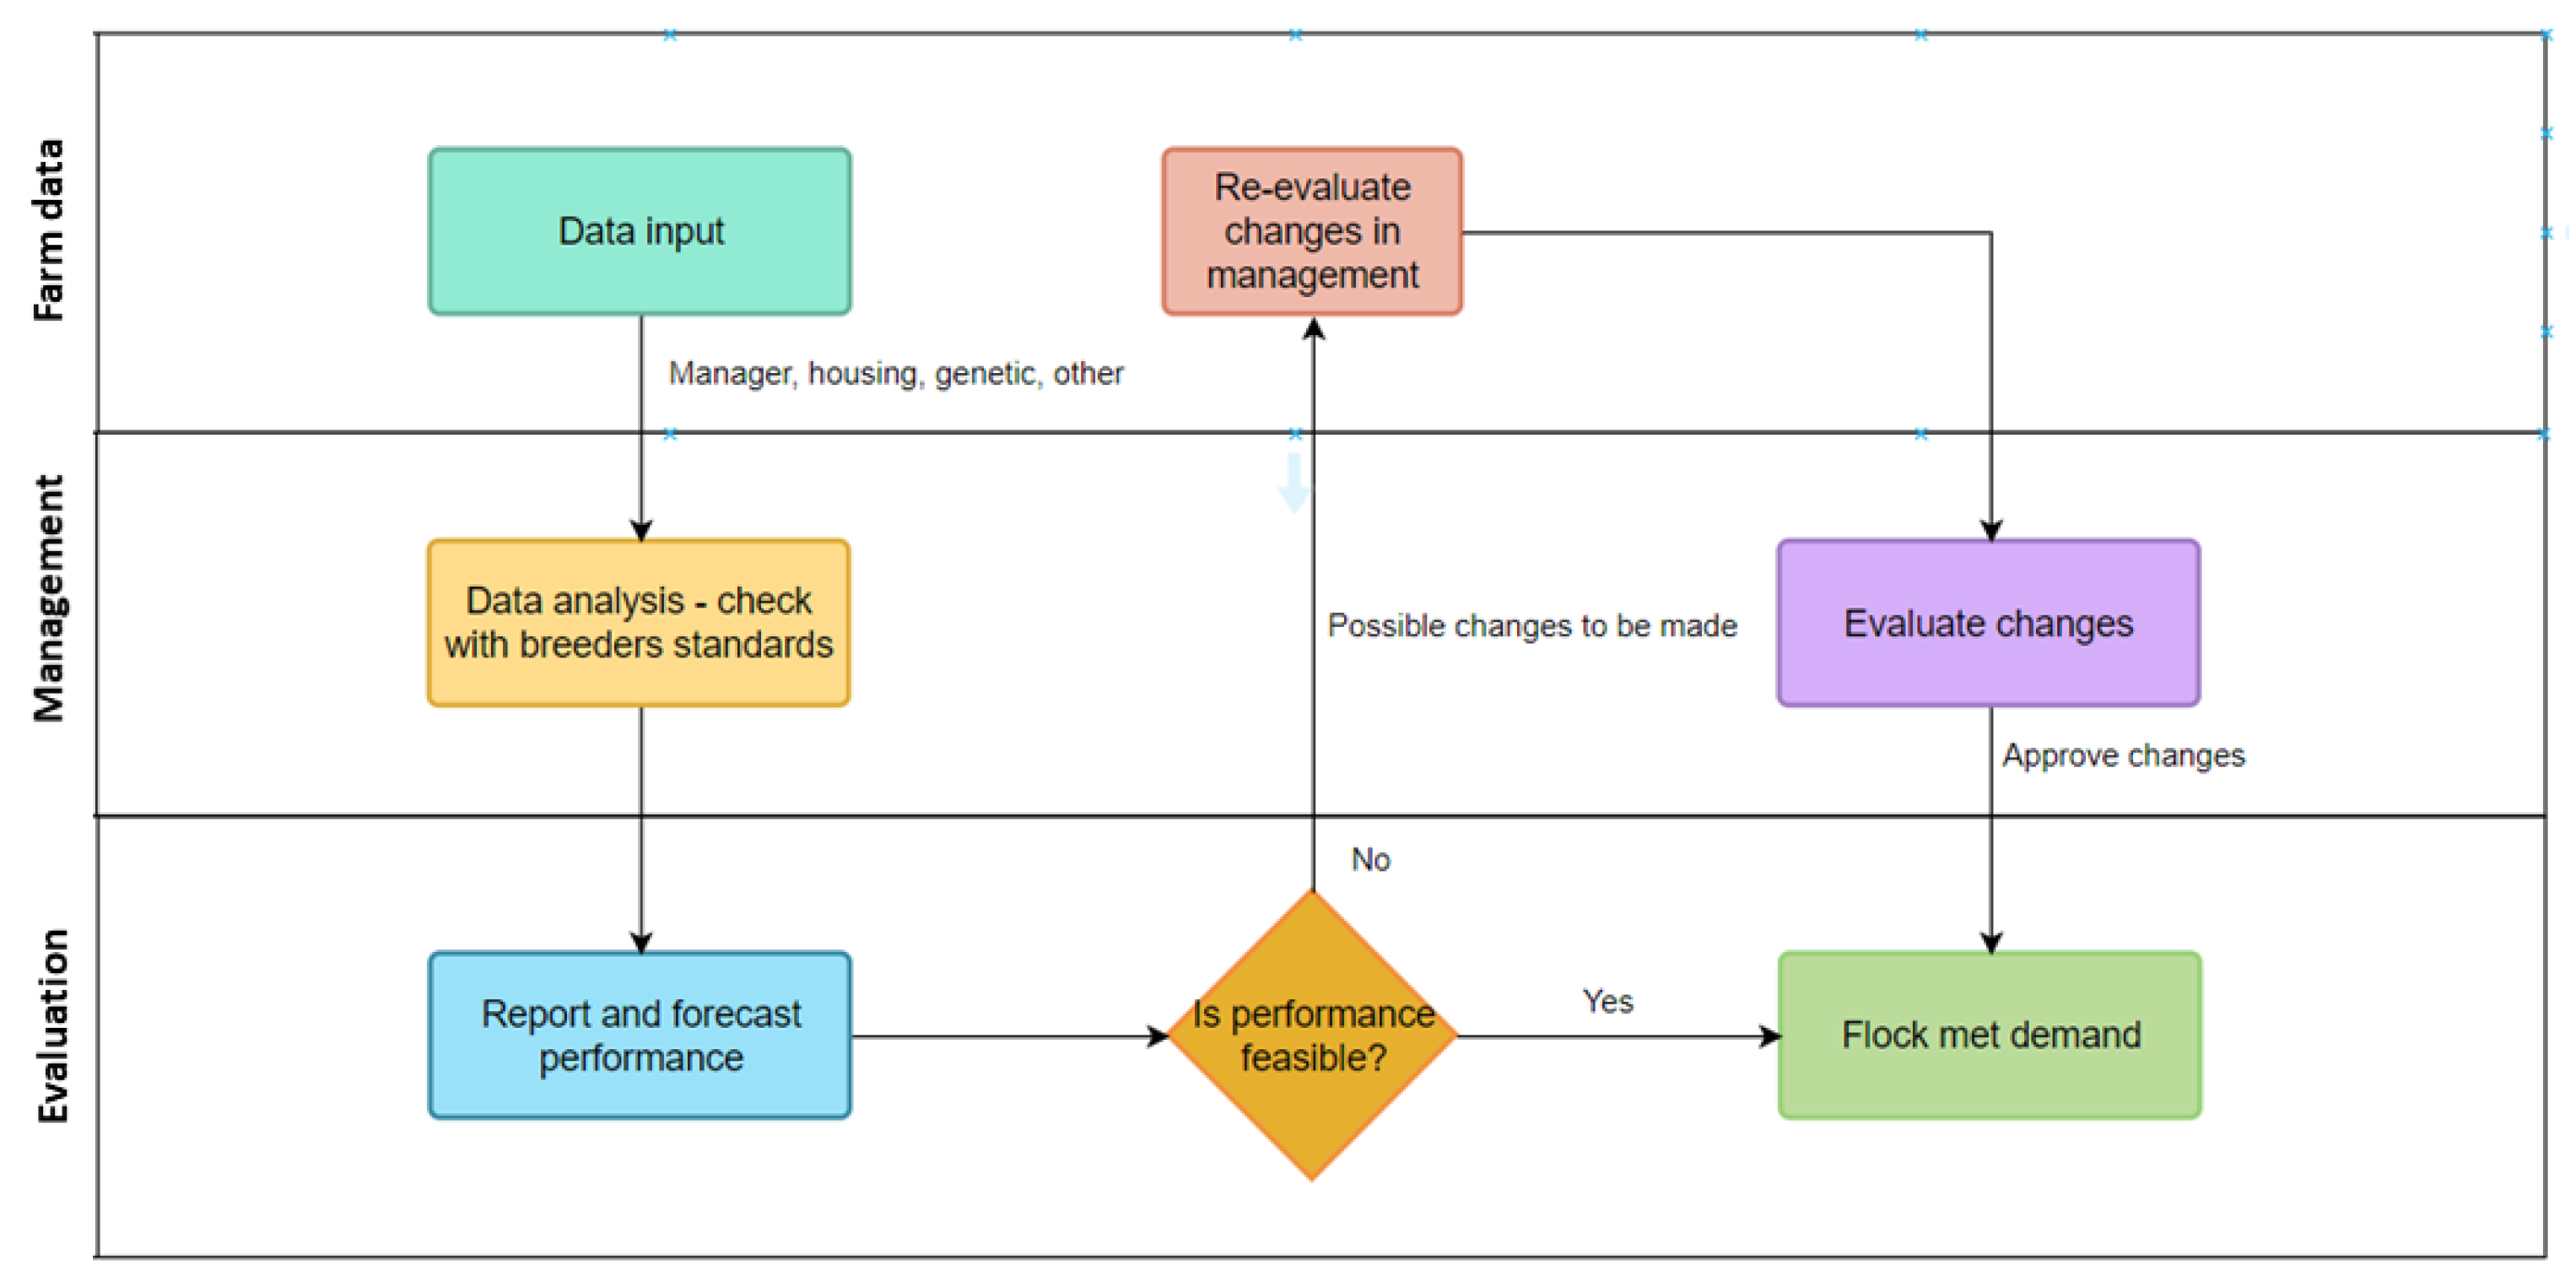
Figure 1 illustrates a flowchart of the steps of data input, management approach, and flock evaluation.
The language in which the application was developed was Python. This language has a vast library of ready-made functions and extensive literature to support it [
25,
26,
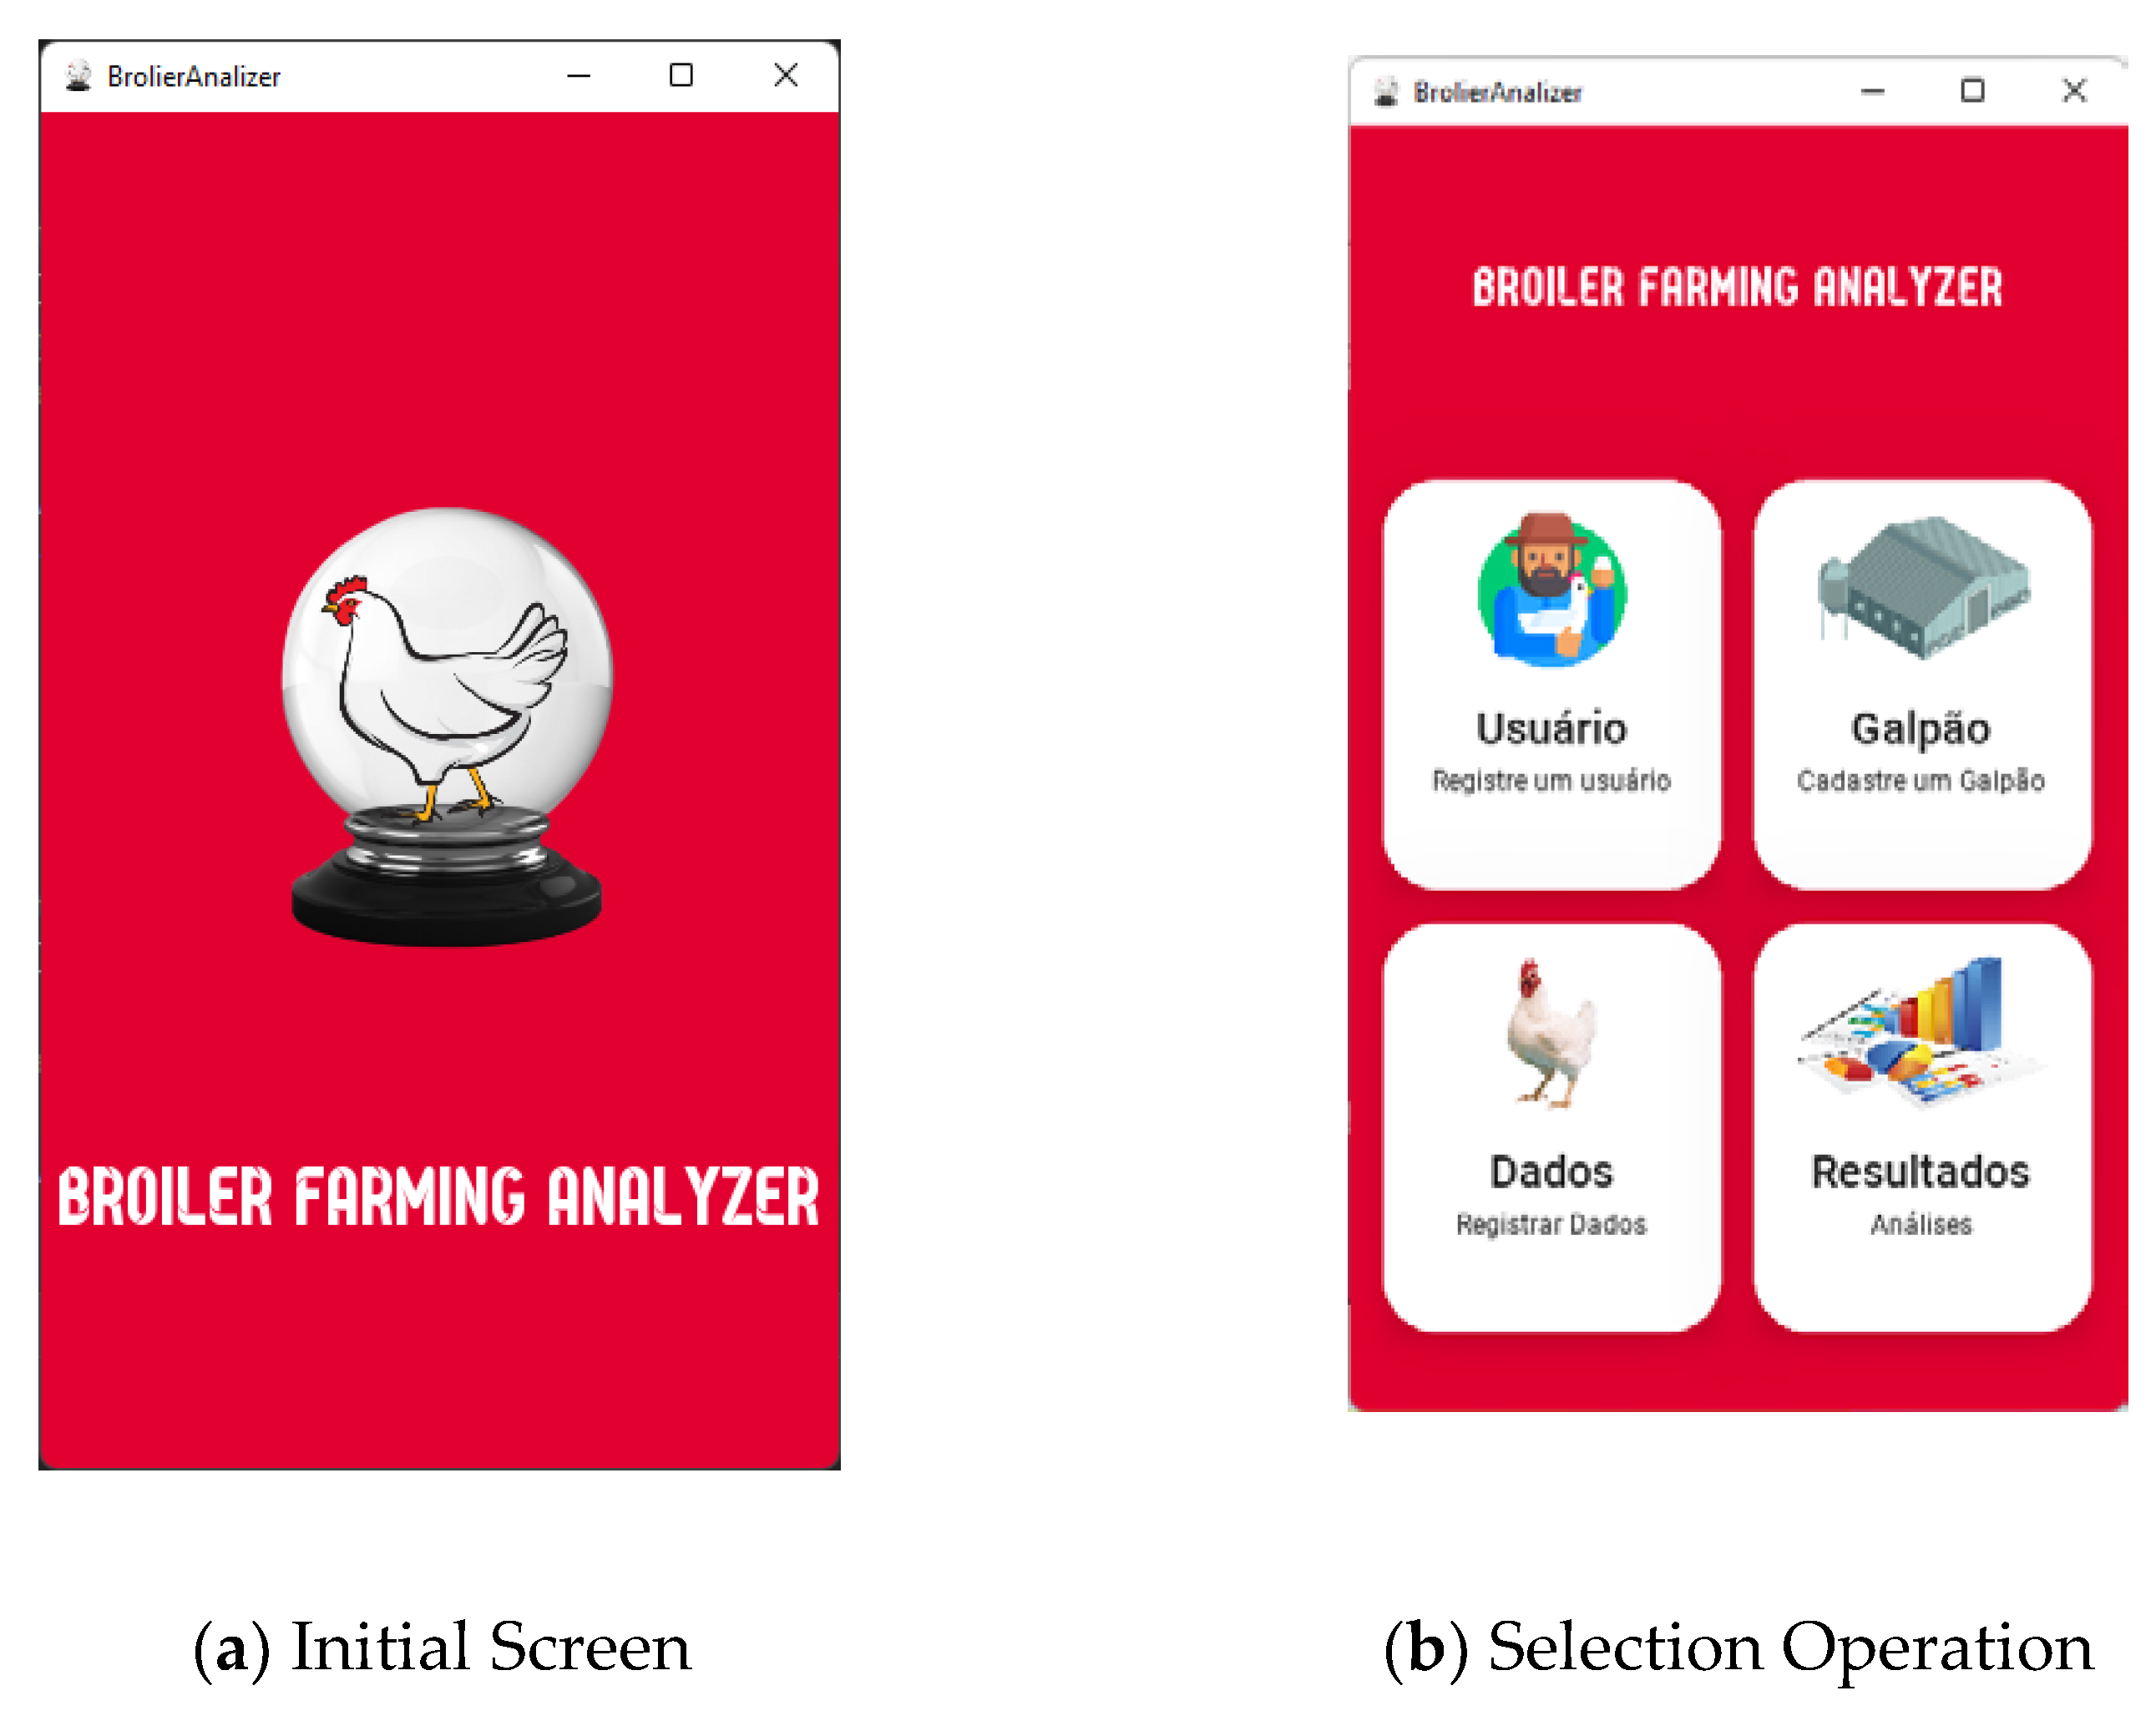
27]. It provided us with a great arsenal to perform data analysis in many possible ways. For the graphical interface, we selected a Kivy and KivyMD framework. Kivy is a free and open-source Python framework for developing mobile Apps and other multitouch application software with a natural user interface (NUI). It is distributed under the terms of the MIT License and can run on Android, iOS, Linux, macOS, and Windows. KivyMD is a collection of material design-compliant widgets for use with Kivy [
28].
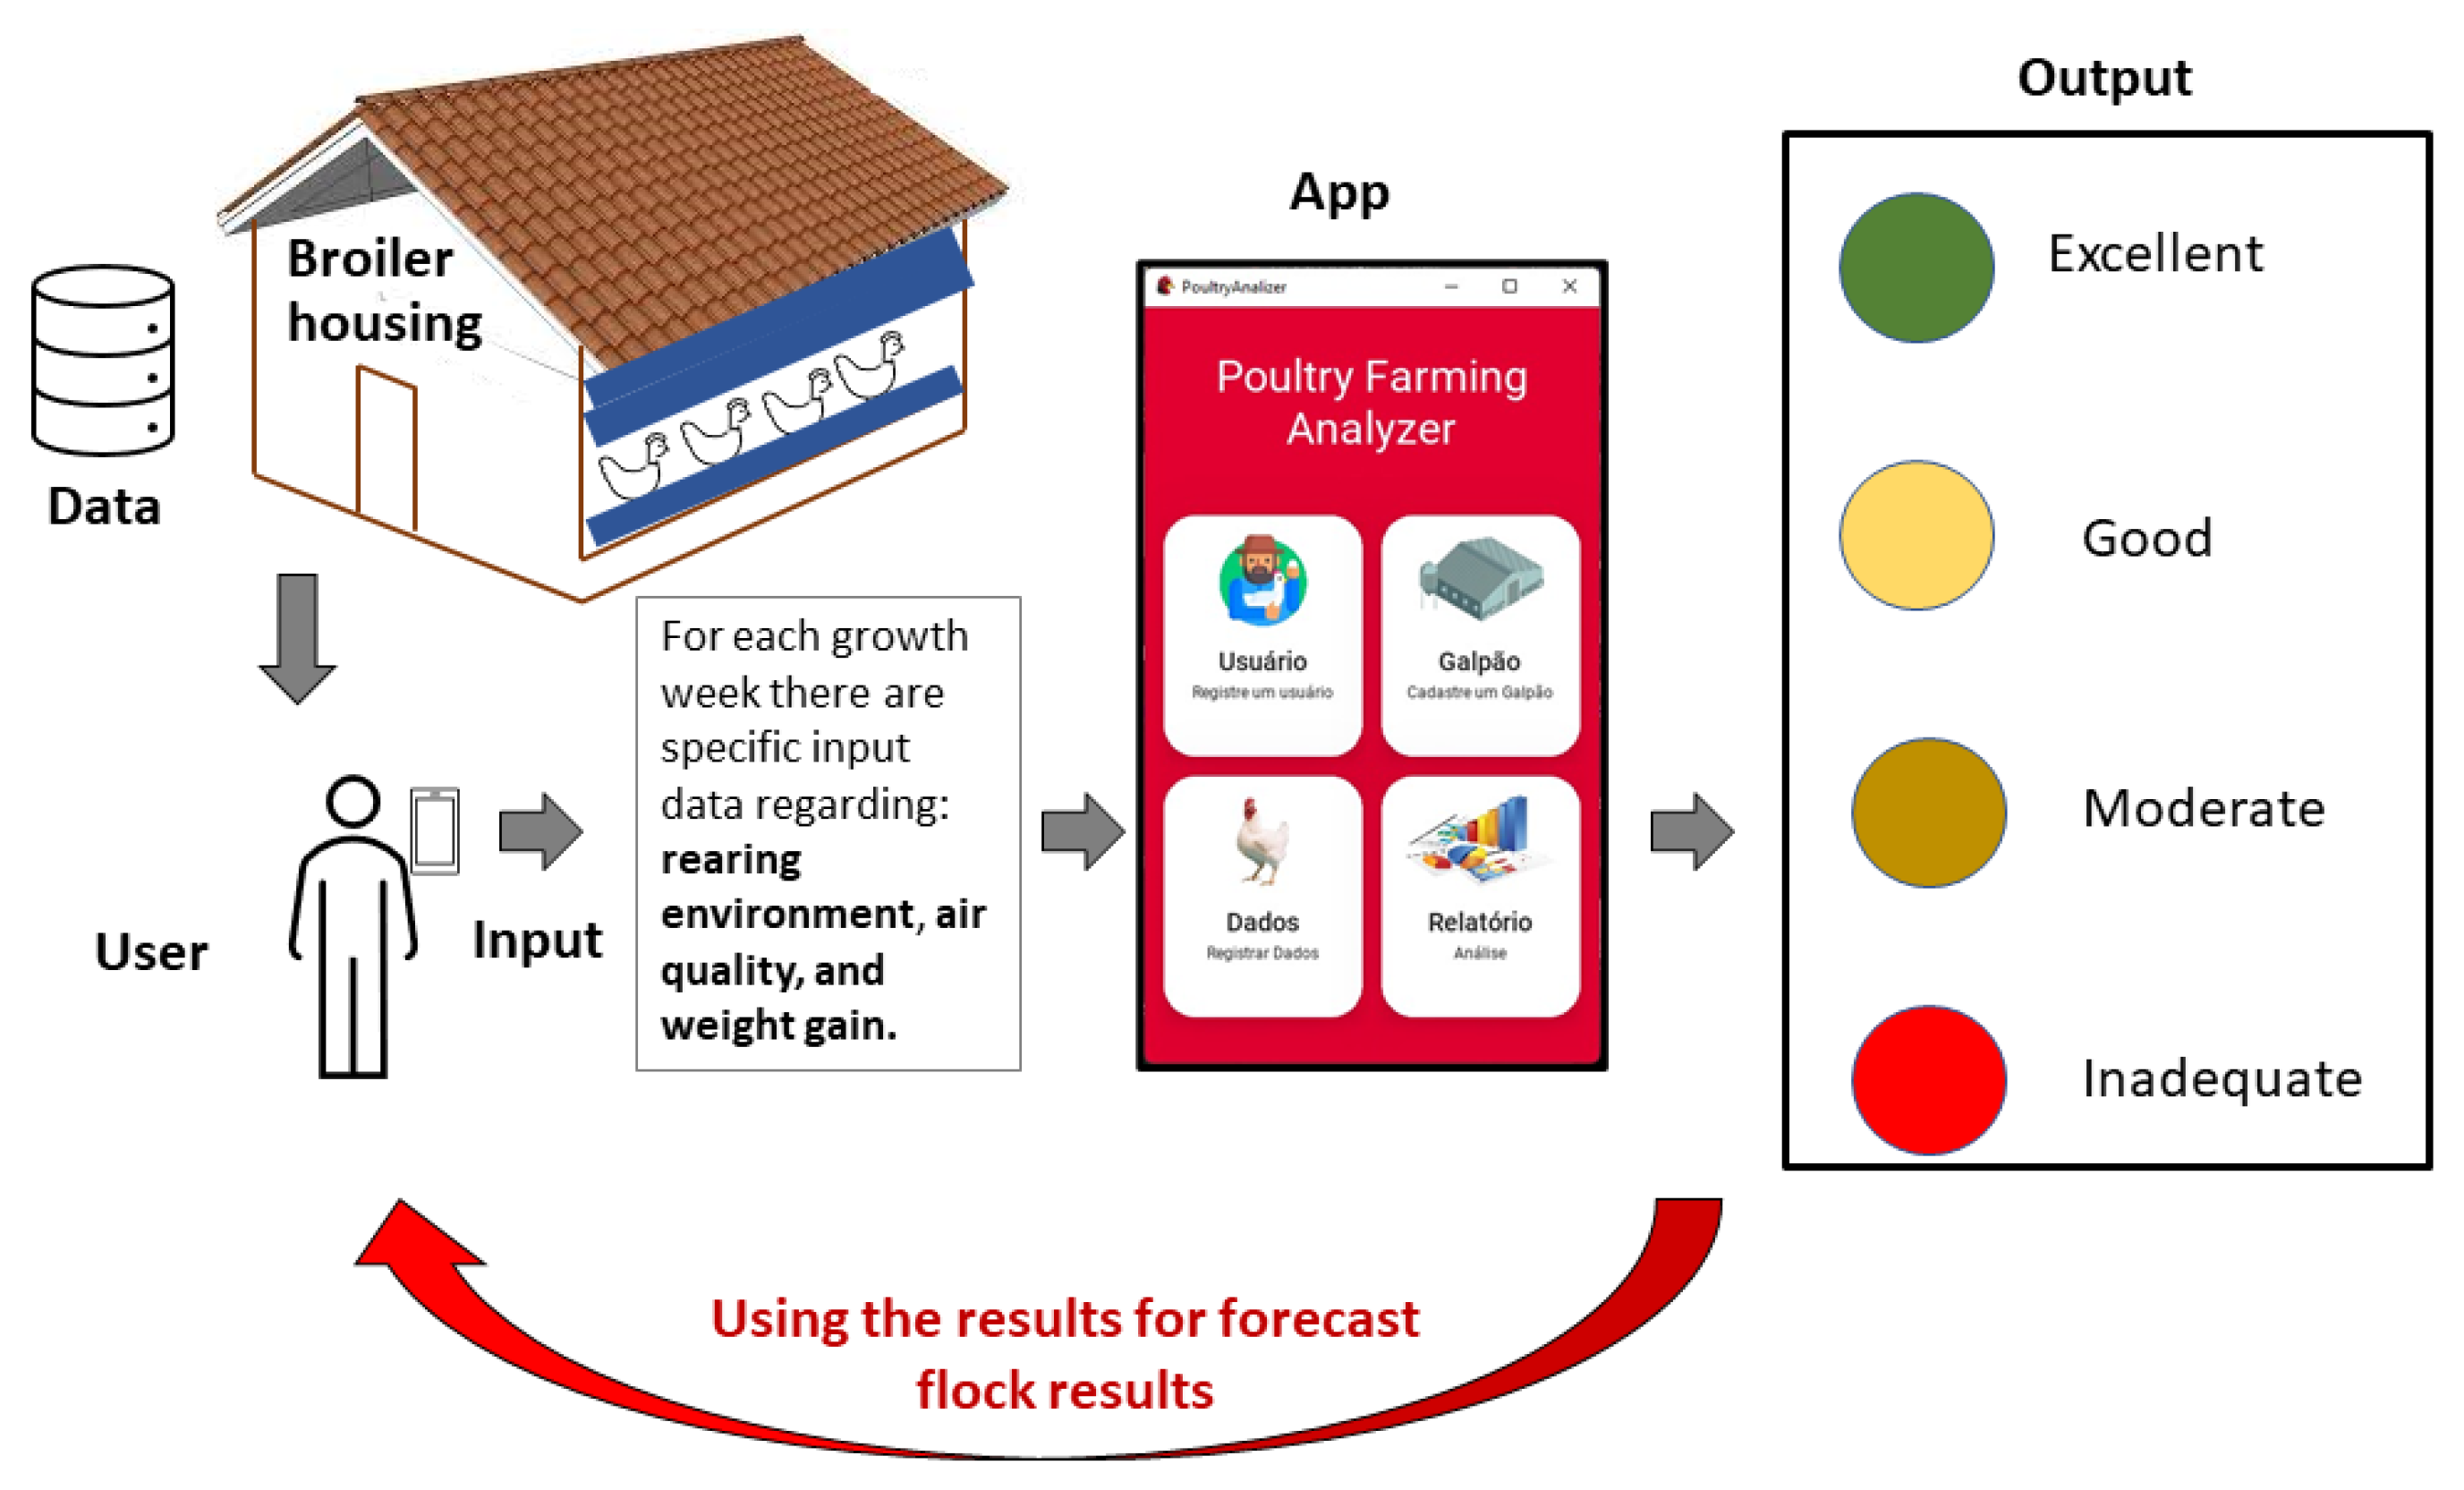
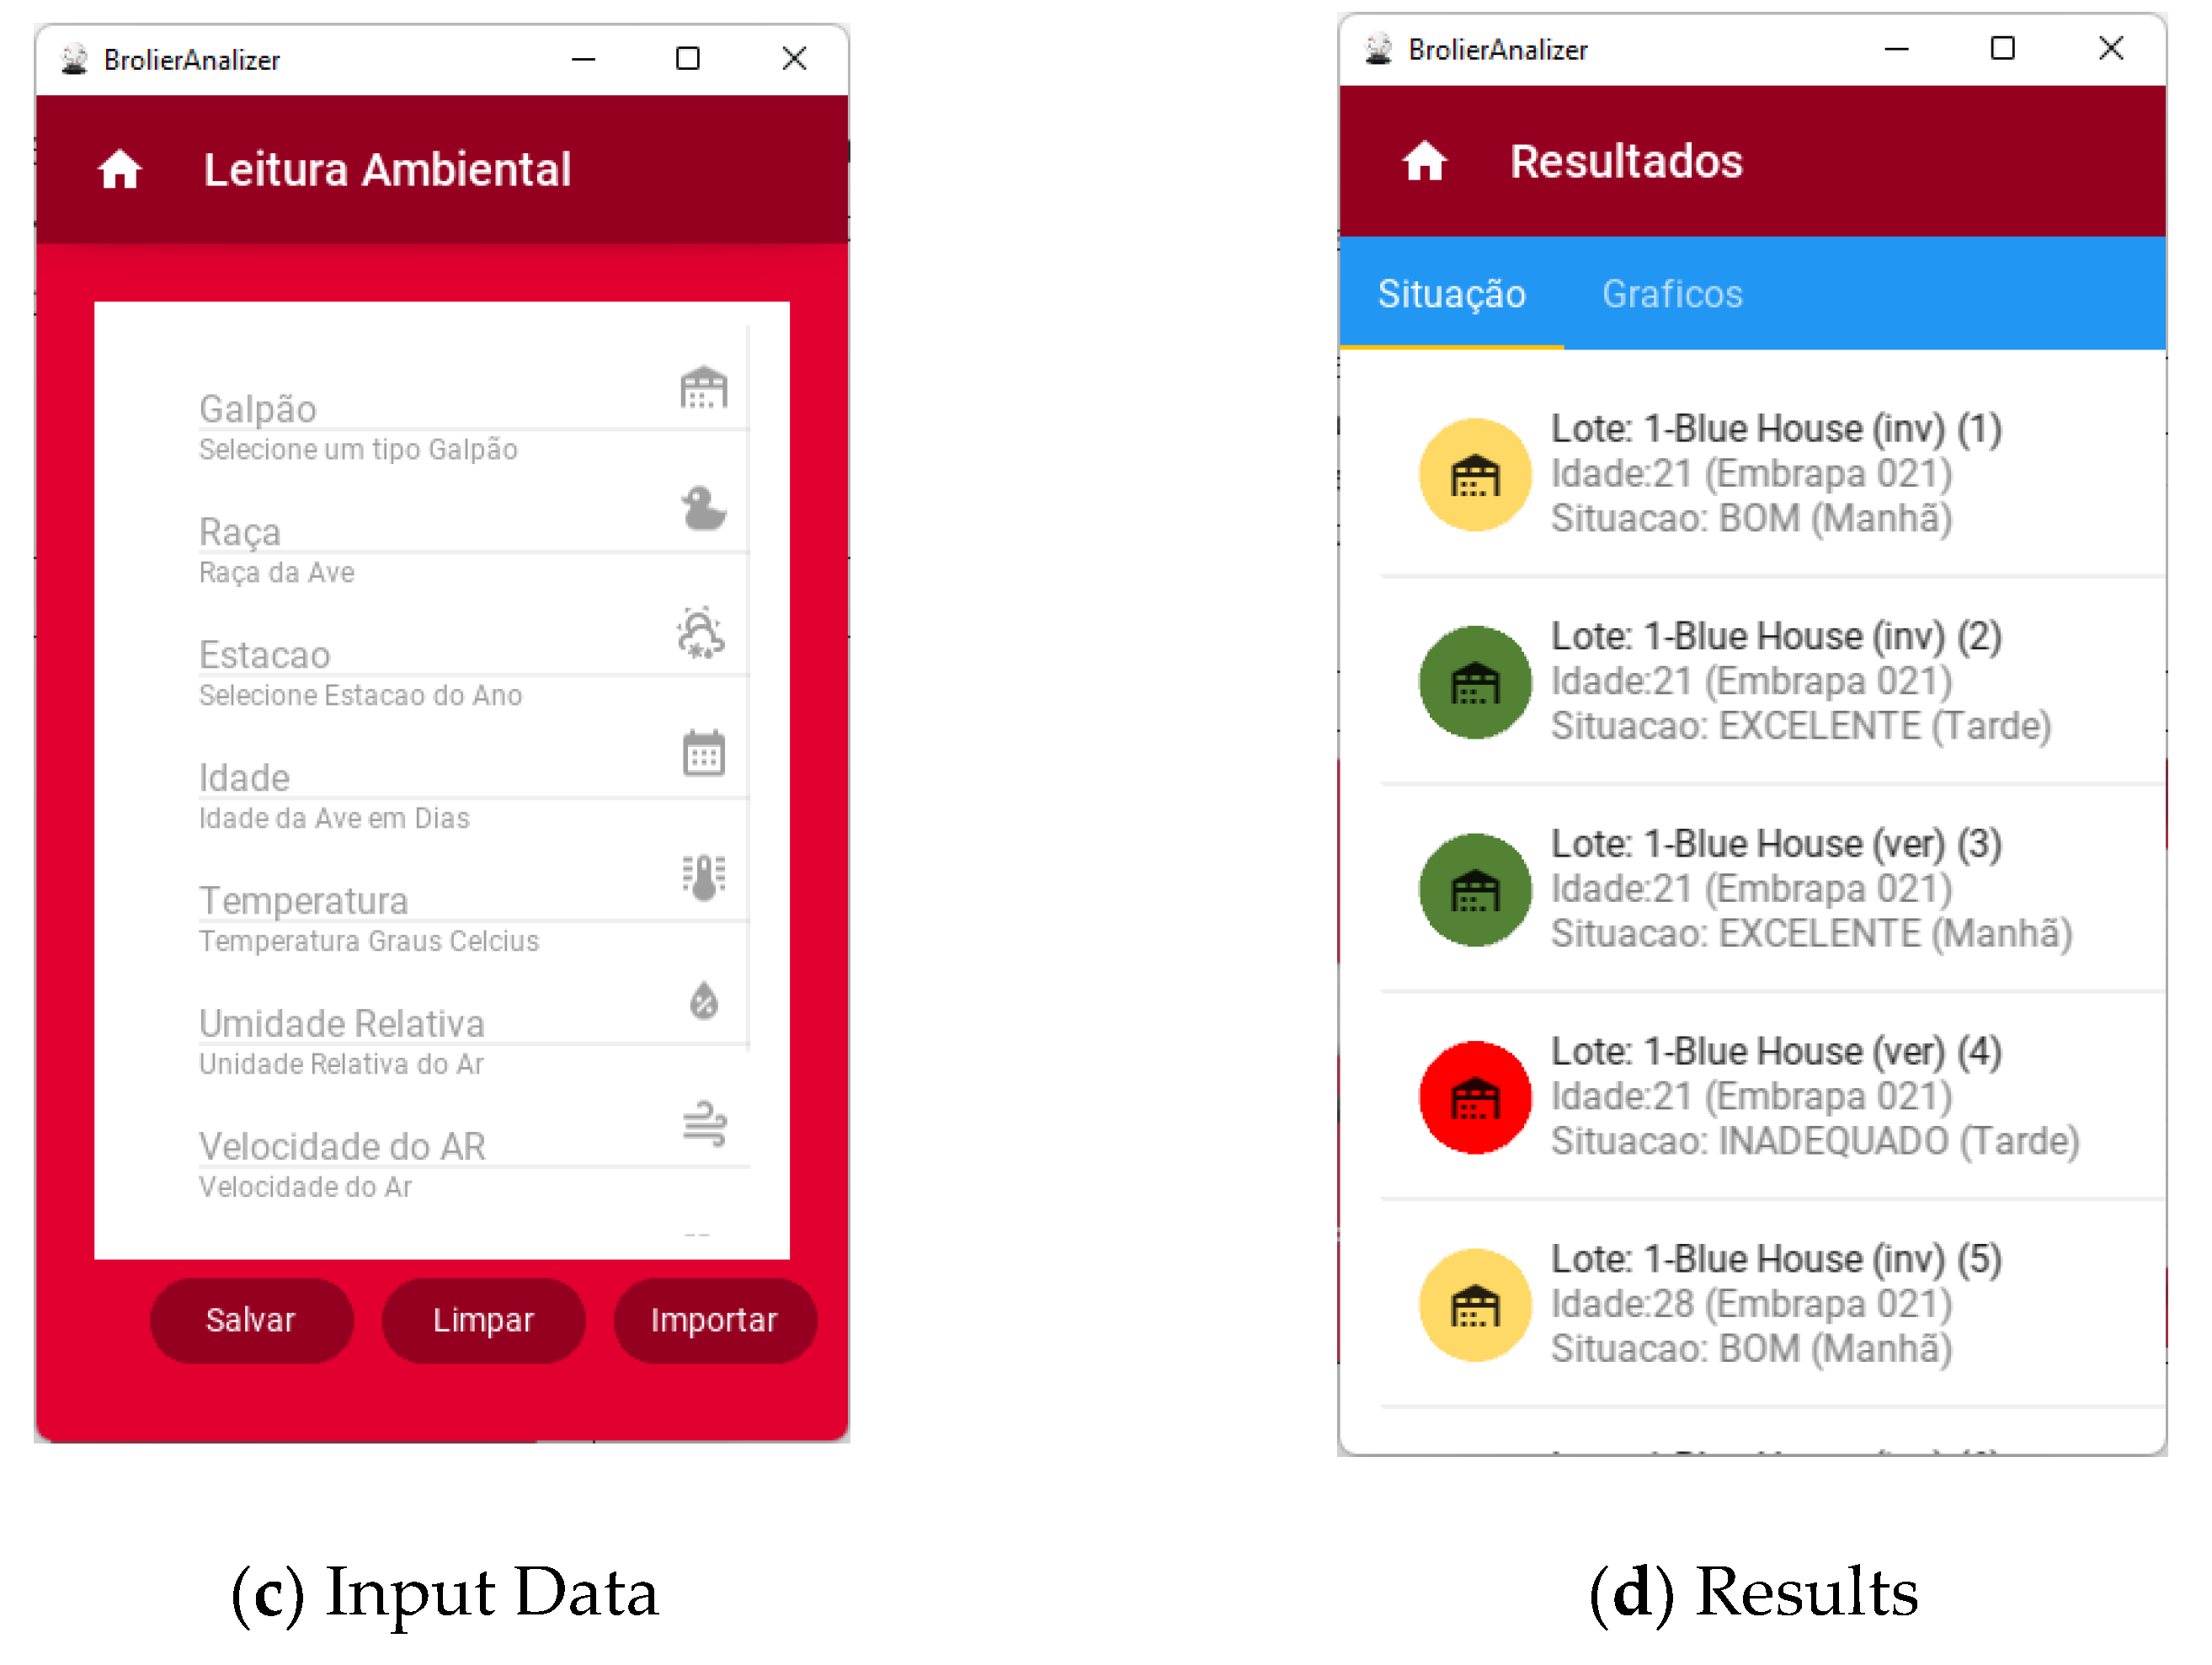
Input data (
Table 10) can be supplied to the application manually or by an Excel spreadsheet. These data are stored in a database with SQLite and an on-file database.
2.2. Schematic of the App Functions
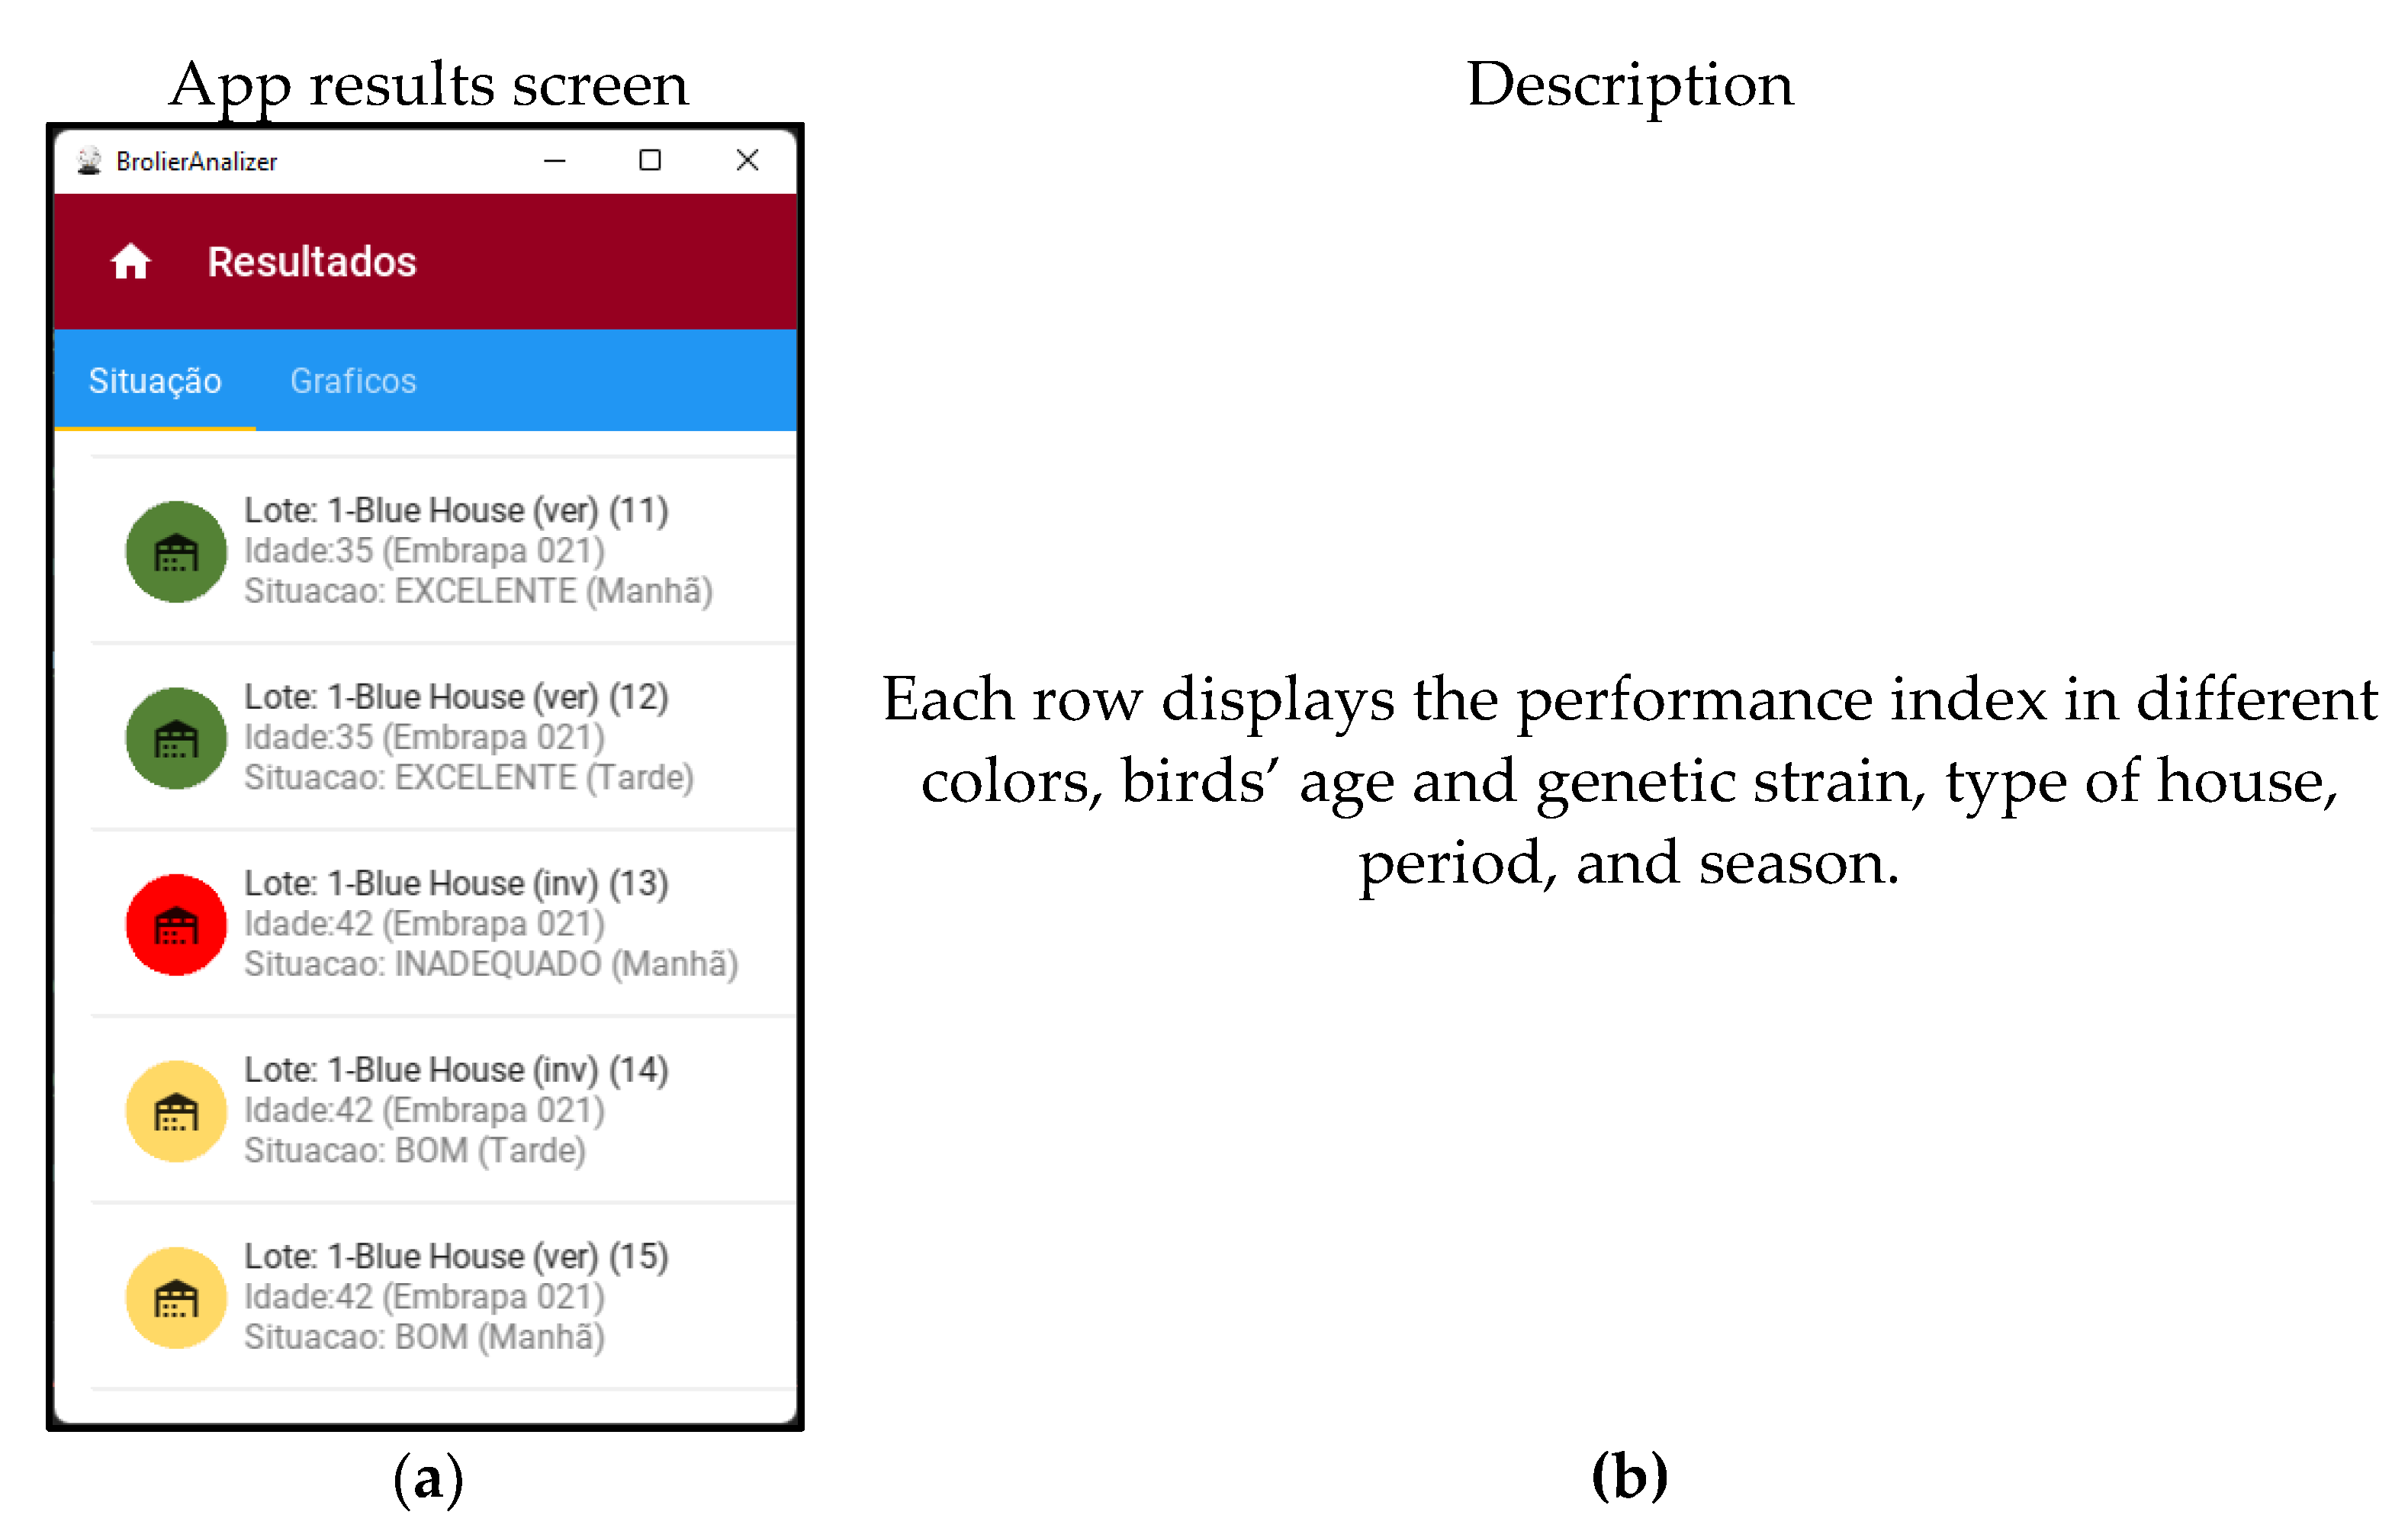
The application receives information from the environment in two ways. One way is manual input, wherein a user provides the data, and the other is by loading an imported Excel spreadsheet. After the data input, the data can be observed in reports shown on the App screen.
Figure 2 shows how the App operates using the housing environment and flock data, interactions with the user, a visualization of the App screen, and the possible outputs. The App was initially developed for Brazilian users; therefore, the input and output results are written in Portuguese.
4. Discussion
The present study proposed a mobile application using Python to follow up and forecast the performance of a broiler flock given the type of housing and rearing environmental conditions. This study used a robust database from four different types of houses and rearing environmental variables assessed.
When negative values were found for the Performance Index, it was an indication that variables were above or below the thermoneutral limits found in the literature [
5,
7,
27,
28,
29,
30].
By finding a set of parameters that led to a model, we could forecast whether the broiler chickens are reared adequately on farms. Although other attempts to automatically grade broiler performance have been reported in the current literature [
19,
20], the previous studies did not encompass flock evaluation in a broader aspect as we did. Since the present results were derived from historical field data, the forecast was more related to actual data, differing from experimental tests [
31]. Silva et al. [
32] proposed an App that assessed compliance with good practices of broiler production. Such an initiative would allow a farmer to audit a flock, controlling continuously how equipment and management were kept during the grow-out period.
In the present proposed mobile application, we forecasted in real-time and had an output response that gave a hint on how the flock was performing. We foresee the use of the App for farmers performing self-audits. By making a proper decision on time, a farmer might correct unhelpful trends, reducing or avoiding flock losses. Such a move can be made by simulating the input with changes in the ventilation rate, for instance, and confirming whether that input changed the final PI. If a broiler farm had a higher degree of technology applied, such as automated control panels, we believe that the App could be uploaded directly from the used systems and provide a response in real-time. However, this adaptation still needs to be upgraded.
The field of precision livestock farming has grown substantially in the last years [
18,
19,
21]. The possibility of using automated models should significantly improve quality control in animal production. Further tool development will be required to guarantee efficient applications for farmer-support tasks.
An automatic survey of facilities’ internal environmental conditions could be motivated by the systematic use of the App to assist decision making and real-time alarm. Our results showed that the App allowed the indication of flock performance using environmental data. The App assisted the process of visualizing the compliance of the rearing conditions, allowing farmers to take action. This action could make it possible to better understand the management and control practices of a farm’s environment, helping the development of new technologies that would effectively add value to the production chain. Future connection to appropriate sensors and actuators might allow complete integration with open-source electronic components.
5. Conclusions
We developed a mobile application to help farmers evaluate the suitability of broiler rearing conditions during a flock’s growth and grade the flock using a performance index. We believe such a tool could help broiler farmers follow up on their flocks and help decision making during growth in real-time.
For people who enjoy having a second opinion, the mobile application could serve as a random inspection by solely manual input, even for farms with a high degree of automation. However, the mobile application should be mainly used by small- and medium-sized poultry farmers in tropical regions who do not have access to high automation technology in their aviaries.


 ,
, 


