1. Introduction
Building and civil infrastructure assets have been managed using a database since 1970 and with the aid of Building Information Modeling (BIM) since 1992 for value engineering and as-built information. The imperative for embracing digital twinning becomes evident in the aftermath of the 2007 Minneapolis Interstate 35W Bridge Collapse, a catastrophic event that claimed 13 lives and injured 145. This tragic incident underscores the critical need for spatiotemporal analysis and societal impact studies, highlighting deficiencies not only in extracting overlooked design information from BIM but also in the incapacity of BIM alone to assess the adequacy of bridge members. The urgency to adopt the digital twin (DT) model is amplified as the nation’s infrastructure is aging, demanding more frequent condition assessment and maintenance, particularly in the face of accelerating climate changes and increasing natural disasters.
The idea of DTs under the name of “Mirror Worlds” was first envisioned in the 1991 book
Mirror Worlds by David Gelernter [
1]. The DT model was introduced in 2002 under the name of the virtual twin by Michael Grieves as a concept of Product Lifecycle Management (PLM) [
2]. The model was finally referred to as a DT by John Vickers in the 2010 National Aeronautics and Space Administration (NASA) Roadmap Report [
3]. The early development of DTs and their applications in PLM and aerospace engineering [
4], mainly for monitoring purposes, was extended to the areas of design and production engineering [
5] and architecture, engineering, construction, and facility management [
6]. In these extended areas, DTs began to be connected to societies and built environments [
7].
In 2017, the United Kingdom (UK) National Infrastructure Commission launched a national DT initiative as envisioned in their
Data for the Public Good report [
8]. During the evolution of their DT initiative, the UK construction industry alone saved USD 1.1 billion in 2014 just by sharing information. Ever since, the concept and development of DTs has been significantly advanced worldwide, as demonstrated by an increase in publications (that mentioned “digital twin” in their titles) to more than 1,200 since 2018 [
9]. The value delivery of digital twins for smart cities was summarized in the first book
Digital Twin Technologies and Smart Cities [
10]. The second book
Digital Twins in the Built Environment: Fundamentals, Principles, and Applications [
9] provides a holistic view of DTs from an asset level to a city level.
Most, if not all, of prior studies on DTs have concentrated on a single function, either computational or informational, within a specific discipline such as civil engineering or architecture. For example, DTs have been viewed as a computational platforms for finite element models updating in a probabilistic context [
11], and as information platforms for BIM updating [
12]. While these advancements in their respective research fields are intriguing, the broader impact of these isolated applications of DTs is likely constrained.
The goal of this study is to empower DTs with a layered integration of multifunctional models in the built environment, creating a cyber–physical–social (CPS) system encompassing buildings, infrastructure, and the associated community. Depending on the specific value-driven use cases of interest, a DT can be tailored through various facets and phases of a physical twin with the following specific objectives:
Develop a rapidly implementable framework of DT modules in hierarchical tiers tailored for a campus-like environment;
Enable a digital duplication of real-world construction of partially completed buildings with spatiotemporal analysis in multiple scales;
Integrate computational and informational models into a CPS system for asset lifecycle management;
Evaluate the structural and nonstructural behavior of buildings under earthquake loads to address post-earthquake resilience of the affected community;
Demonstrate and quantify the values of a DT through a straightforward indicator that is easy to determine.
This paper is an extension of the early version published in the proceedings of the 14th International Workshop of Structural Health Monitoring [
13], Stanford, California on 12–14 September 2023. The rest of the paper is organized as follows. In
Section 2, an in-depth exploration of the proposed DT framework within the built environment is presented. This section critically examines its role within the realms of PLM and asset lifecycle management (ALM). Upon identifying existing limitations, a novel definition for the concept of DT in the context of ALM is introduced, along with a new concept of the degree of digital twinning (DODT) to quantify DT values. The spatial and temporal hierarchy and architecture within modulated DTs at regional, asset, and system levels are presented.
Section 3 outlines the necessity of a novel approach to DTs, emphasizing the enhancement of infrastructure management at the asset level through the hybridization of various models. Moving to
Section 4, the paper demonstrates how a DT can be effectively utilized to realize potential benefits and bring transformative impacts on asset management and regional planning. A campus environment serves as a case study, and numerous concrete examples of DODTs are provided. Finally,
Section 5 wraps up the study by addressing limitations and offering insights into prospects.
2. DT Framework in the Built Environment
2.1. DT in the Context of PLM and ALM
The DT concept originated from the modeling of PLM that handles a product as it moves through the stages of its life. The lifecycle of a product starts when a product is introduced to consumers into the market and ends when it is removed from the shelves. Due to the availability of commercial products in large quantities and short term at relatively low costs, the integration of multiple products into a new system product can easily be viewed as an intended physical prototype. The DT of the system is used to ensure all component products fit together before investing a new system product line in a physical factory. This is a valuable design attribute of DTs in the era of digital manufacturing in addition to real-time monitoring as envisioned originally.
On the other hand, ALM for large-scale buildings and infrastructure works differently. A set of strategies (e.g., maintenance, rehabilitation, and replacement) is organized and implemented with the intent of preserving and extending the service life of public infrastructure assets, such as roads, bridges, and railways. Unlike commercial products, infrastructure assets are often unique for both esthetical and functional purposes and require capital investment over a long time. As such, the attractive attribute of DTs for product assembly in manufacturing may have no equivalence in infrastructure asset management. For buildings and infrastructure management, computational mechanics modeling is desirable, as their physical and functional conditions affect the decision-making in asset management strategies. In addition, using sensing data alone to assess their conditions is costly due to their large scale, and may even be impossible for assessing hidden deterioration. Model updating with limited sensor data is one of the effective ways to provide the needed condition assessment capability.
The above difference between PLM and ALM determines the way in which DTs are applied effectively in the built environment. To start with, the definition of DTs must be modified from those targeted at applications in manufacturing. In the past decade, 29 definitions of DTs were used in academia, industry, government, and software sources [
14]. In the built environment, the term DT has been used mainly in three ways [
15]: (1) modifying the original definition of DT to reflect a realistic digital representation of assets, processes, or systems; (2) extending BIM to enable real-world data capture and feedback or completely replacing BIM; and (3) formulating a closed-loop digital–physical system for built asset delivery and operation. In general, a DT differs from BIM in two distinctive ways: (1) two-way digital threads between a DT and its represented physical asset; and (2) focus on operation and maintenance instead of the entire lifecycle of an asset as BIM encompasses with an emphasis on design and construction. The BIM implementation for operation is also different from a DT’s. While the DT supports the operation of built assets, BIM for facility management focuses on compiling information of the delivered built asset to support inventory and space management, general upkeep, and building services maintenance, which does not result in an accurate replica of the condition and performance of the asset. In other words, BIM is a static representation of a structure that shows how it was designed and built. It does not reflect the temporal changes that take place after its construction. On the other hand, the DT is a dynamic imitation that is continuously updated to reflect the current condition, rate of deterioration, effect of restoration, etc.
2.2. Novel DT Definition in the Context of ALM
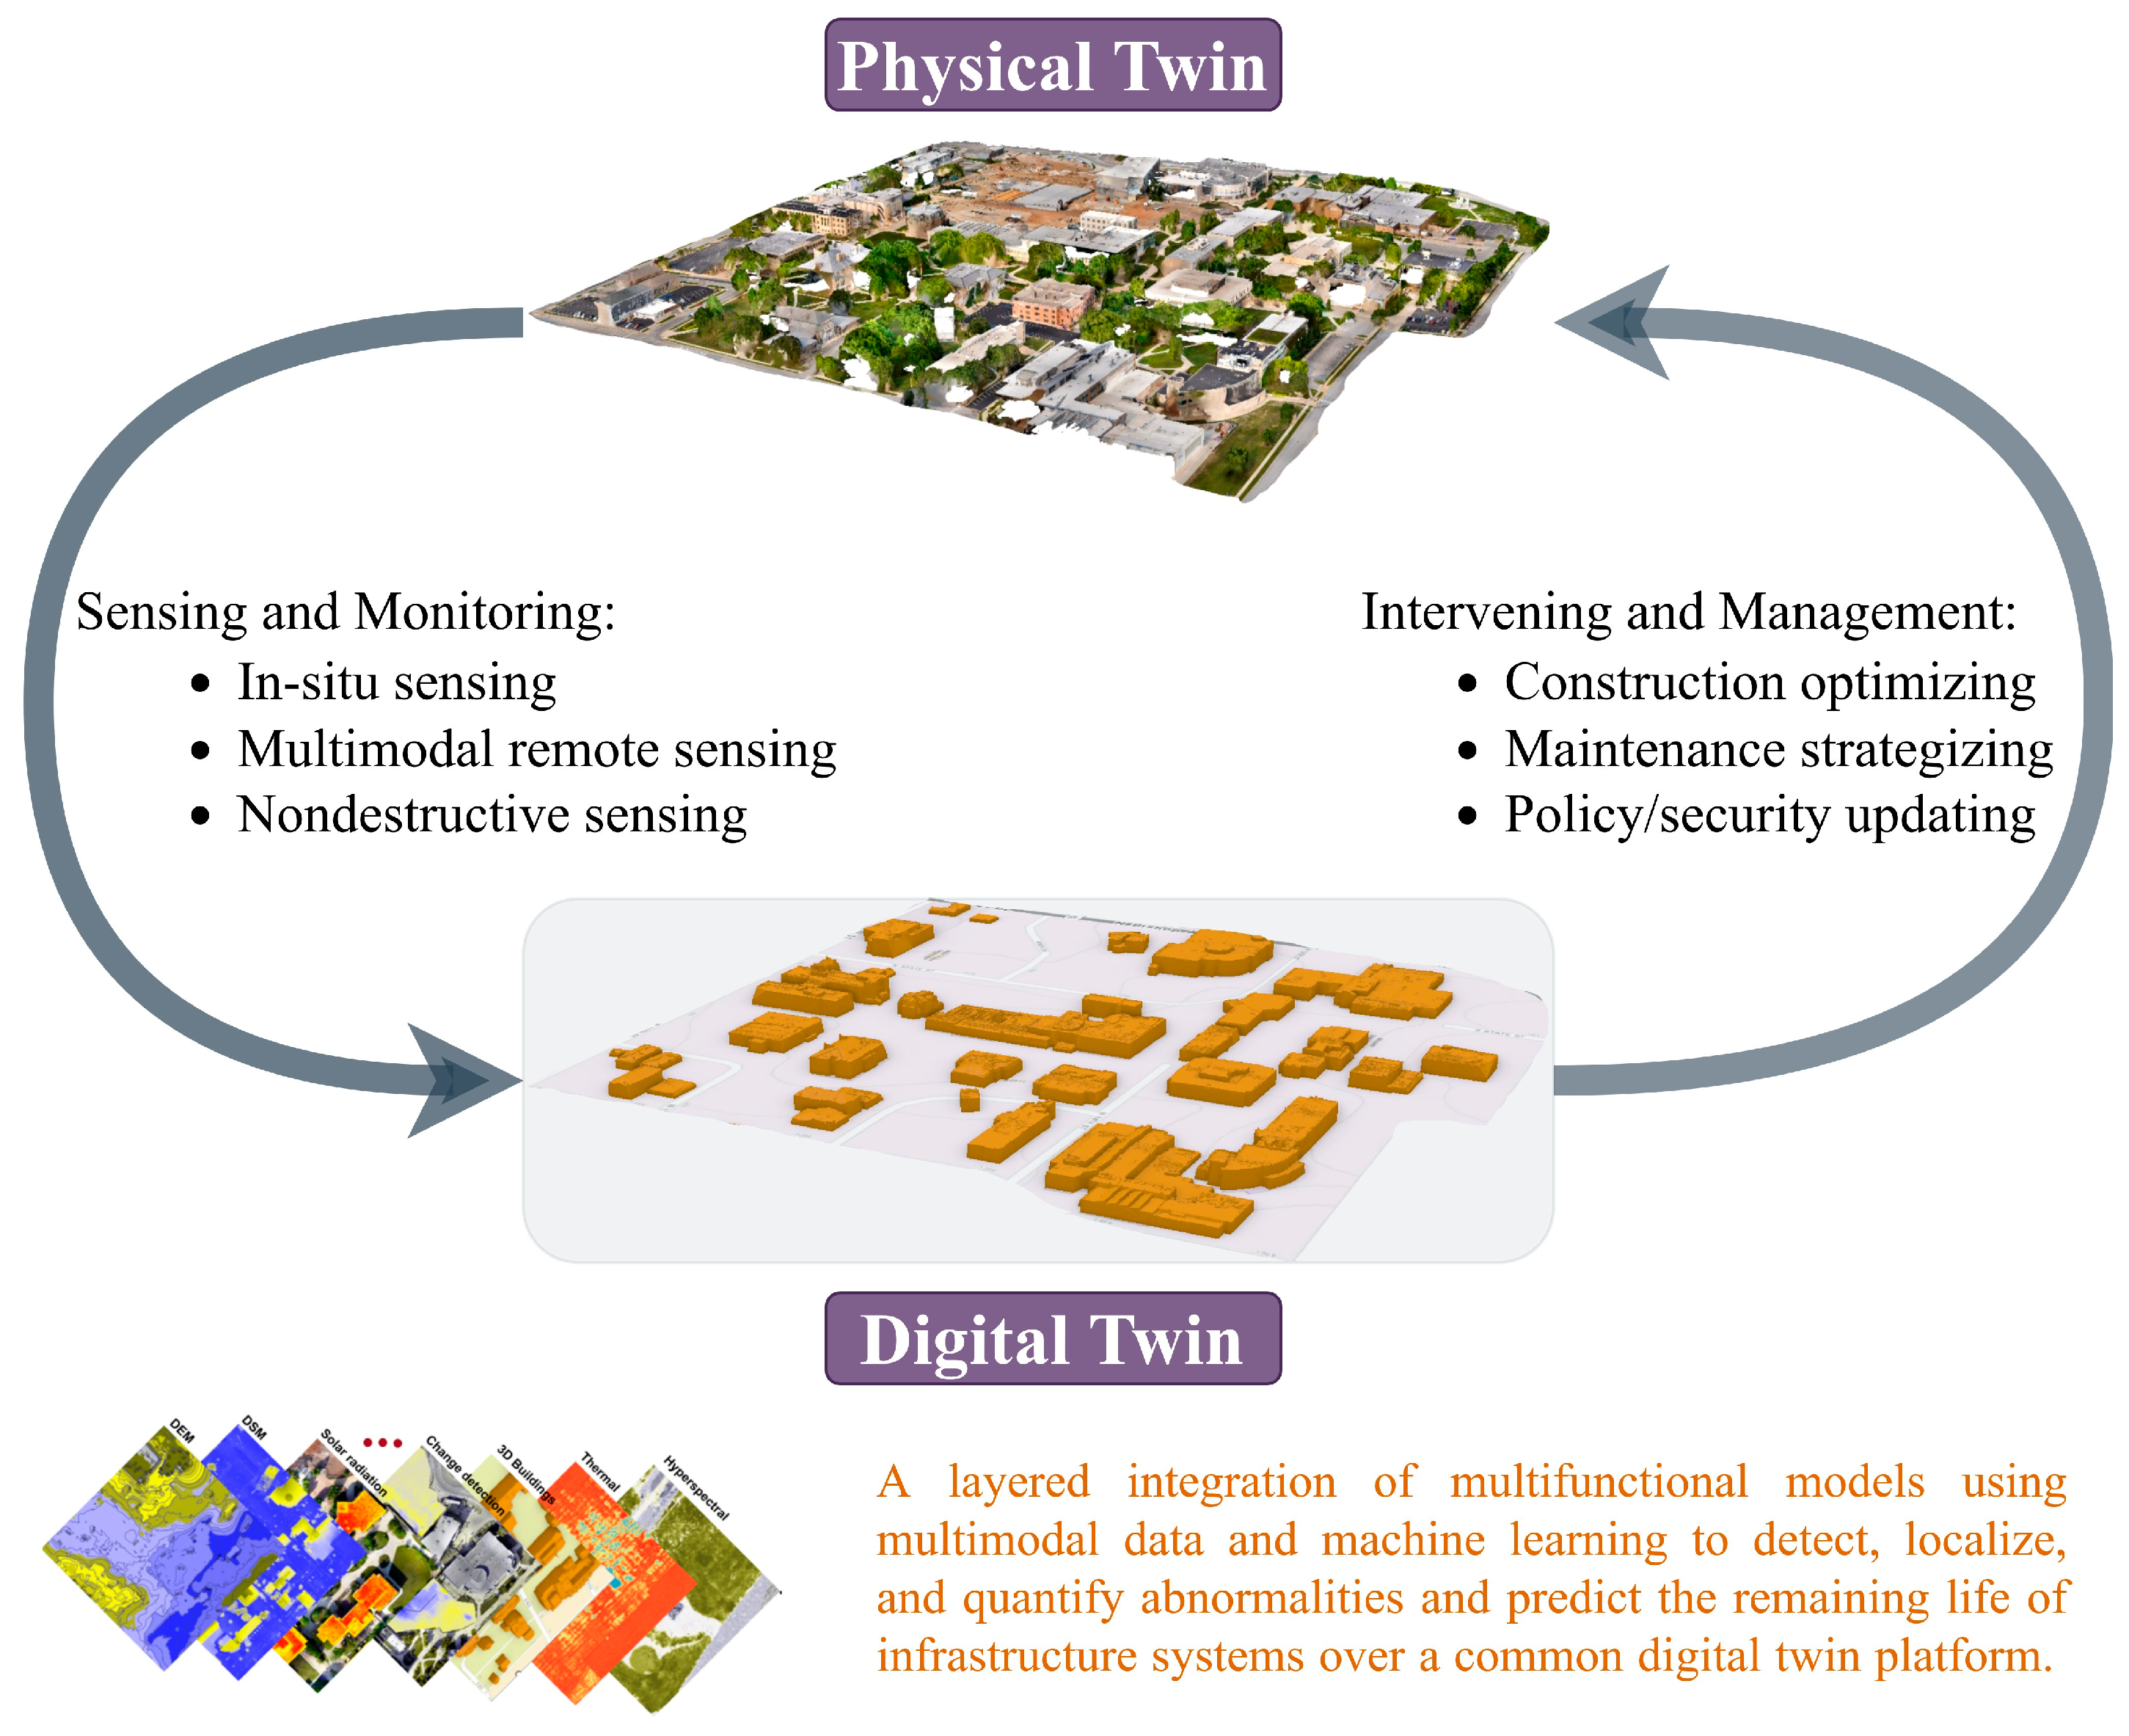
This study consolidates the three uses of the term DT in the literature to propose a novel definition. In this context, a multidimensional DT is defined as
a synergetic, multifunctional, value-added, realistic digital representation of an intended or actual real-world asset, system, or process—a physical twin in the built environment. As schematically shown in
Figure 1, the DT interacts with the physical twin in a closed loop with two digital threads. In the physical-to-digital thread, sensing data and monitoring information obtained from the physical twin can be used to update the digital representation. In the digital-to-physical thread, intervening strategies developed and optimized through scenario studies on the DT can help understand the outcomes of multi-faceted decision-making before they are implemented on the physical twin. On the digital platform, the collected multimodal data from sensors and tests will be fused and evaluated to detect, locate, and quantify abnormalities as well as to predict the remaining life of the physical twin using advanced deep learning-based data analytics [
16].
2.3. Degree of Digital Twinning (DODT)
The state-of-the-art developments in DT technology are primarily focused on digital and physical twinning in computational mechanics or information only. Our value-added solution expands the current single function paradigm to multiple functions. To quantify the values of a DT, the cost saving enabled by the DT is the most widely used indicator. However, this indicator requires the collection and use of a wealth of information that is difficult to acquire. In this study, a new concept of DODT is introduced as a revolutionary metric to simplify the estimation of the value of a DT by the number of digital models and feature mappings enabled and shared by the common DT platform to address societal needs in multiple disciplines, such as engineering, architecture, security, and social and political sciences. In the context of determining DODT, digital models are defined as a three-dimensional (3D) representation of agents (e.g., person or vehicle) and structures (e.g., buildings and infrastructure), including structural and nonstructural components. Concrete examples of DODTs are elaborated on in
Section 4, with a focus on campus-scale digital twin applications.
2.4. Connections, Hierarchy, and Architecture of Modulated DTs
The CPS infrastructure concept stands as an innovative and emerging paradigm poised to revolutionize the built environment through the delivery of innovative services. It embodies a comprehensive framework that seamlessly integrates three pivotal components: cyber, physical, and social, as detailed in
Table 1. The cyber system provides services to promote economic development and improve the quality of life and human wellbeing. The physical system includes an engineering-to-operation process to ensure safety, functionality, and resilience. The social system describes common traditions, cultures, patterns, and beliefs present in a population group. The main component, key function, and performance evaluation criteria of the three systems are described in
Table 1.
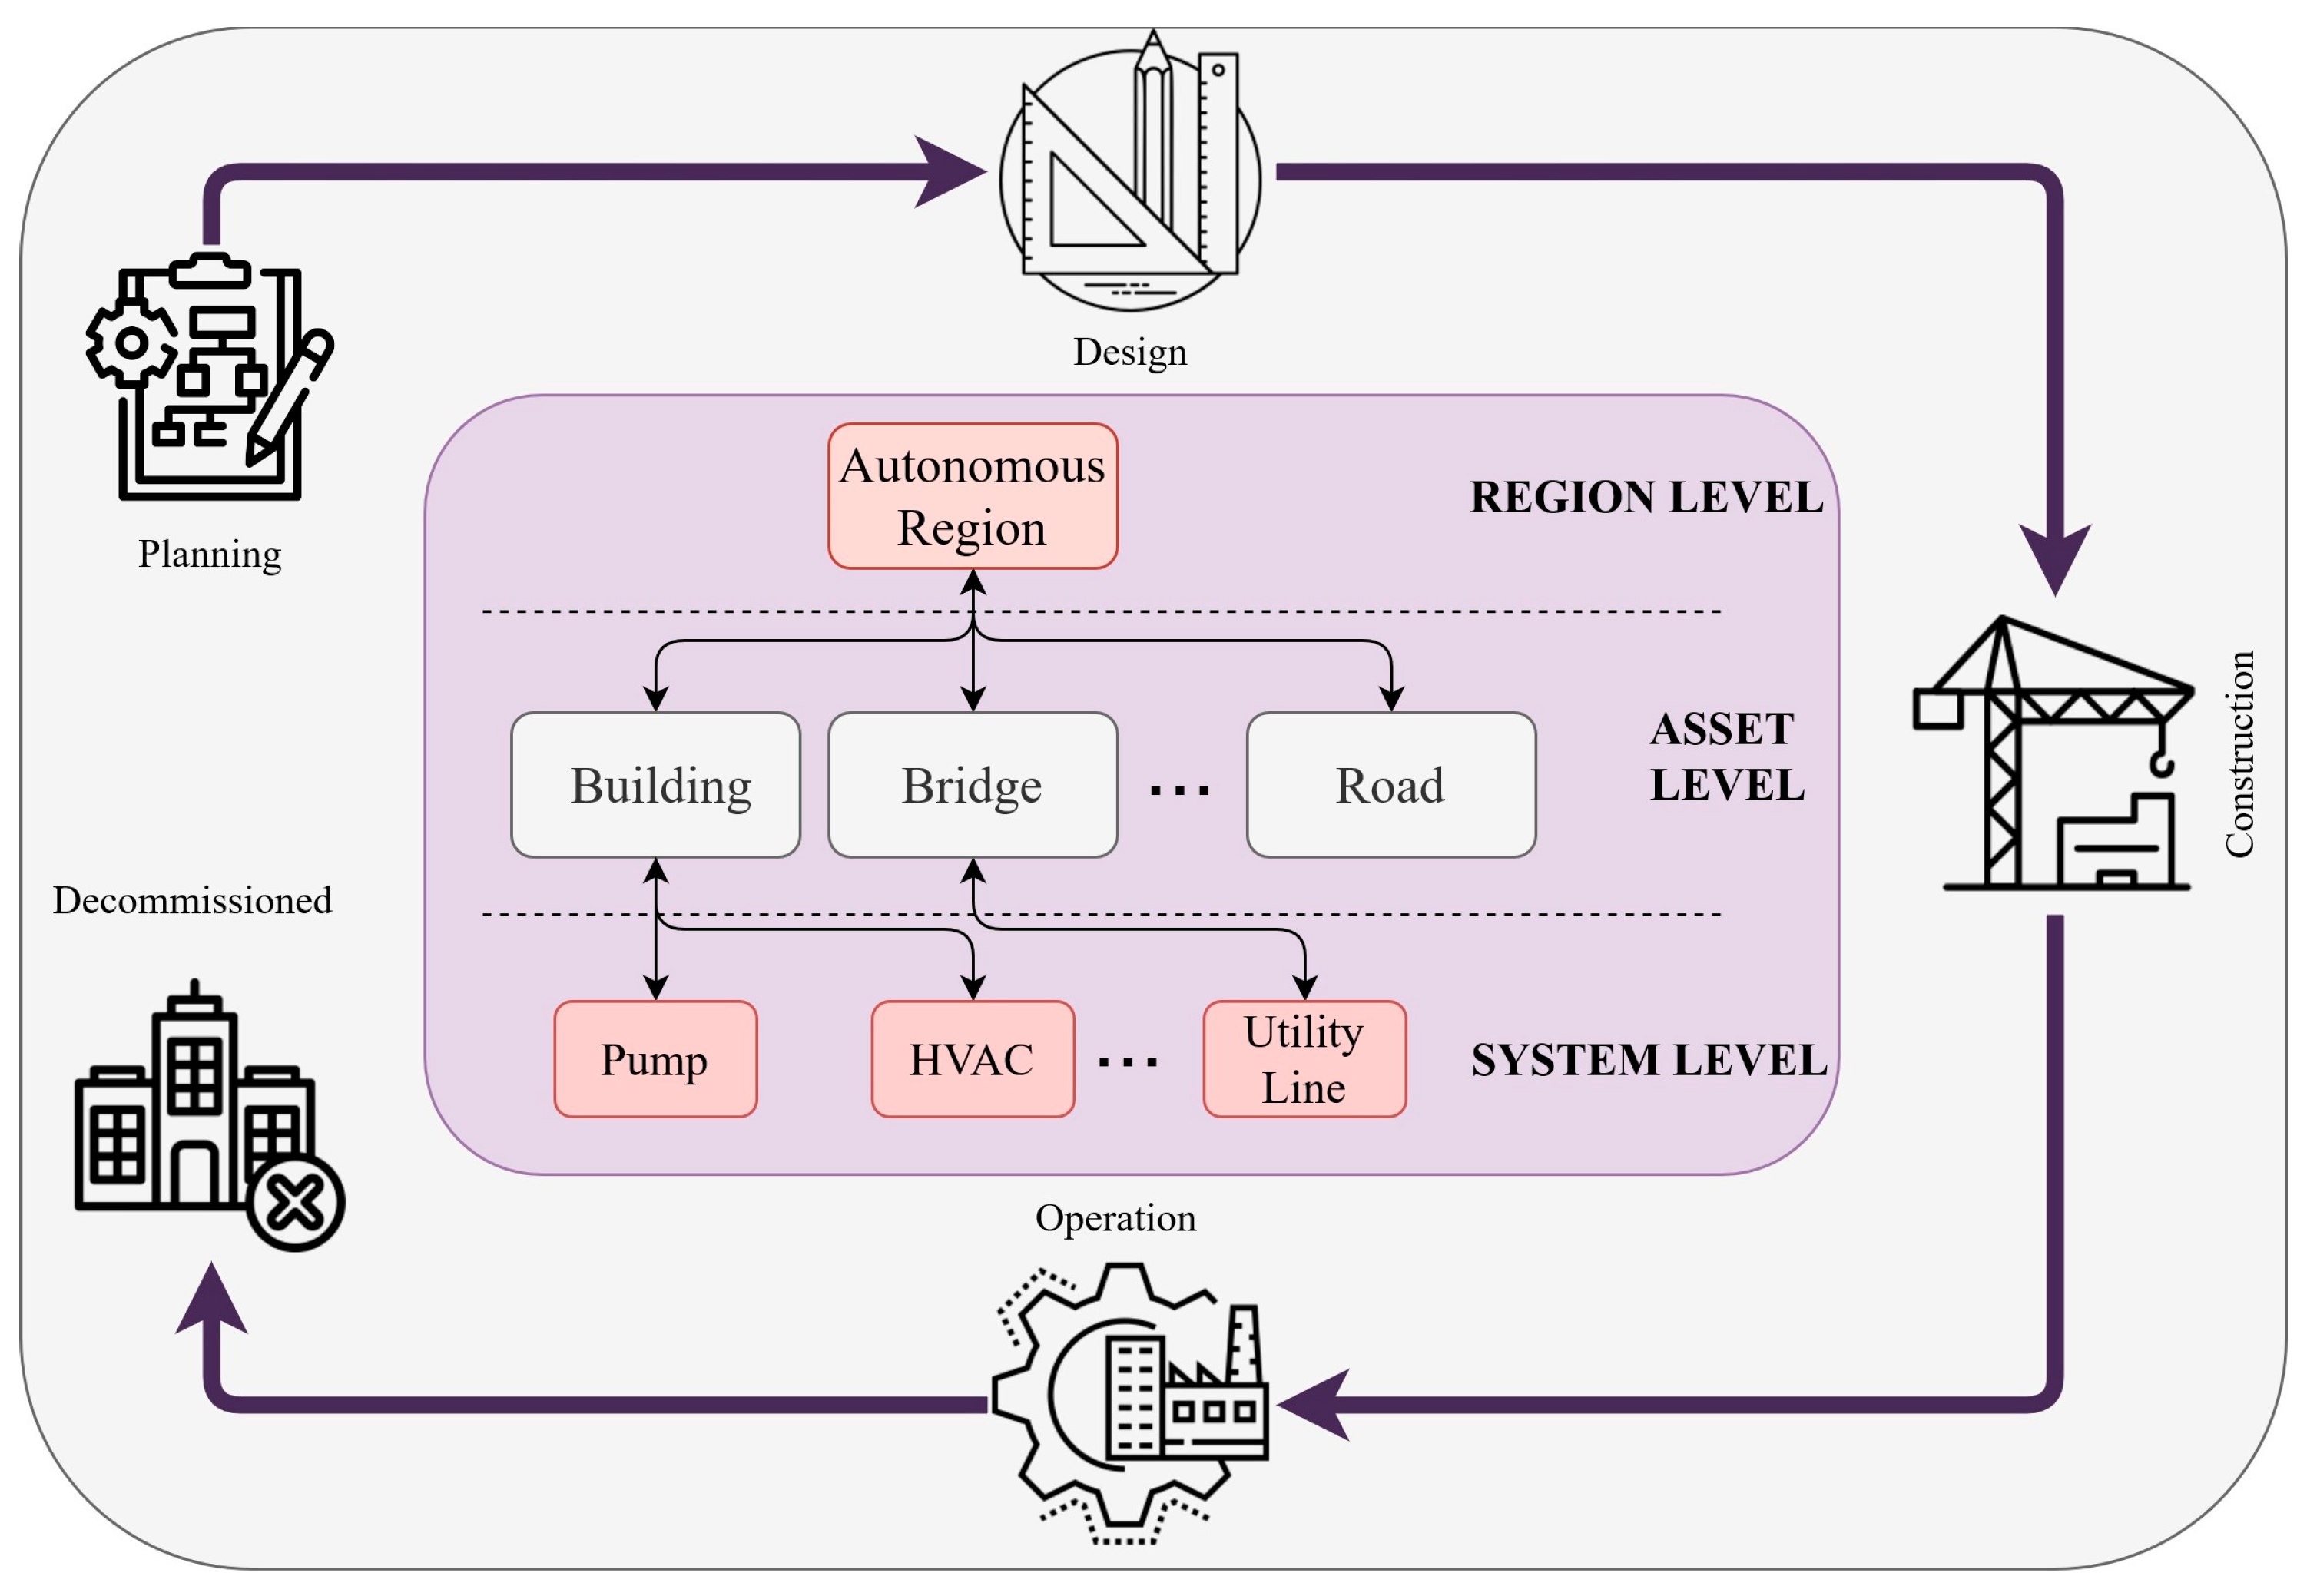
A DT in the built environment can be hierarchically structured in a simplified form as shown in
Figure 2, extending from the regional level down to asset and system levels. Depending on the security demand, the infrastructure at the asset level can be clustered into two segments: (1) an open-sourced segment catering to public buildings and standard infrastructure; and (2) a secured segment designed for information-sensitive buildings and critical infrastructure. Furthermore, the hierarchal asset and system structure undergoes evolution throughout the planning, design, construction, and operational phases.
Much of the current DT research has been focused on information construct [
17]. In the built environment, however, damage assessment of existing infrastructure and design options of new infrastructure are important in the lifecycle management of region assets. Unlike the production application strategy in manufacturing [
15], a creation application strategy is thus needed for buildings and infrastructure.
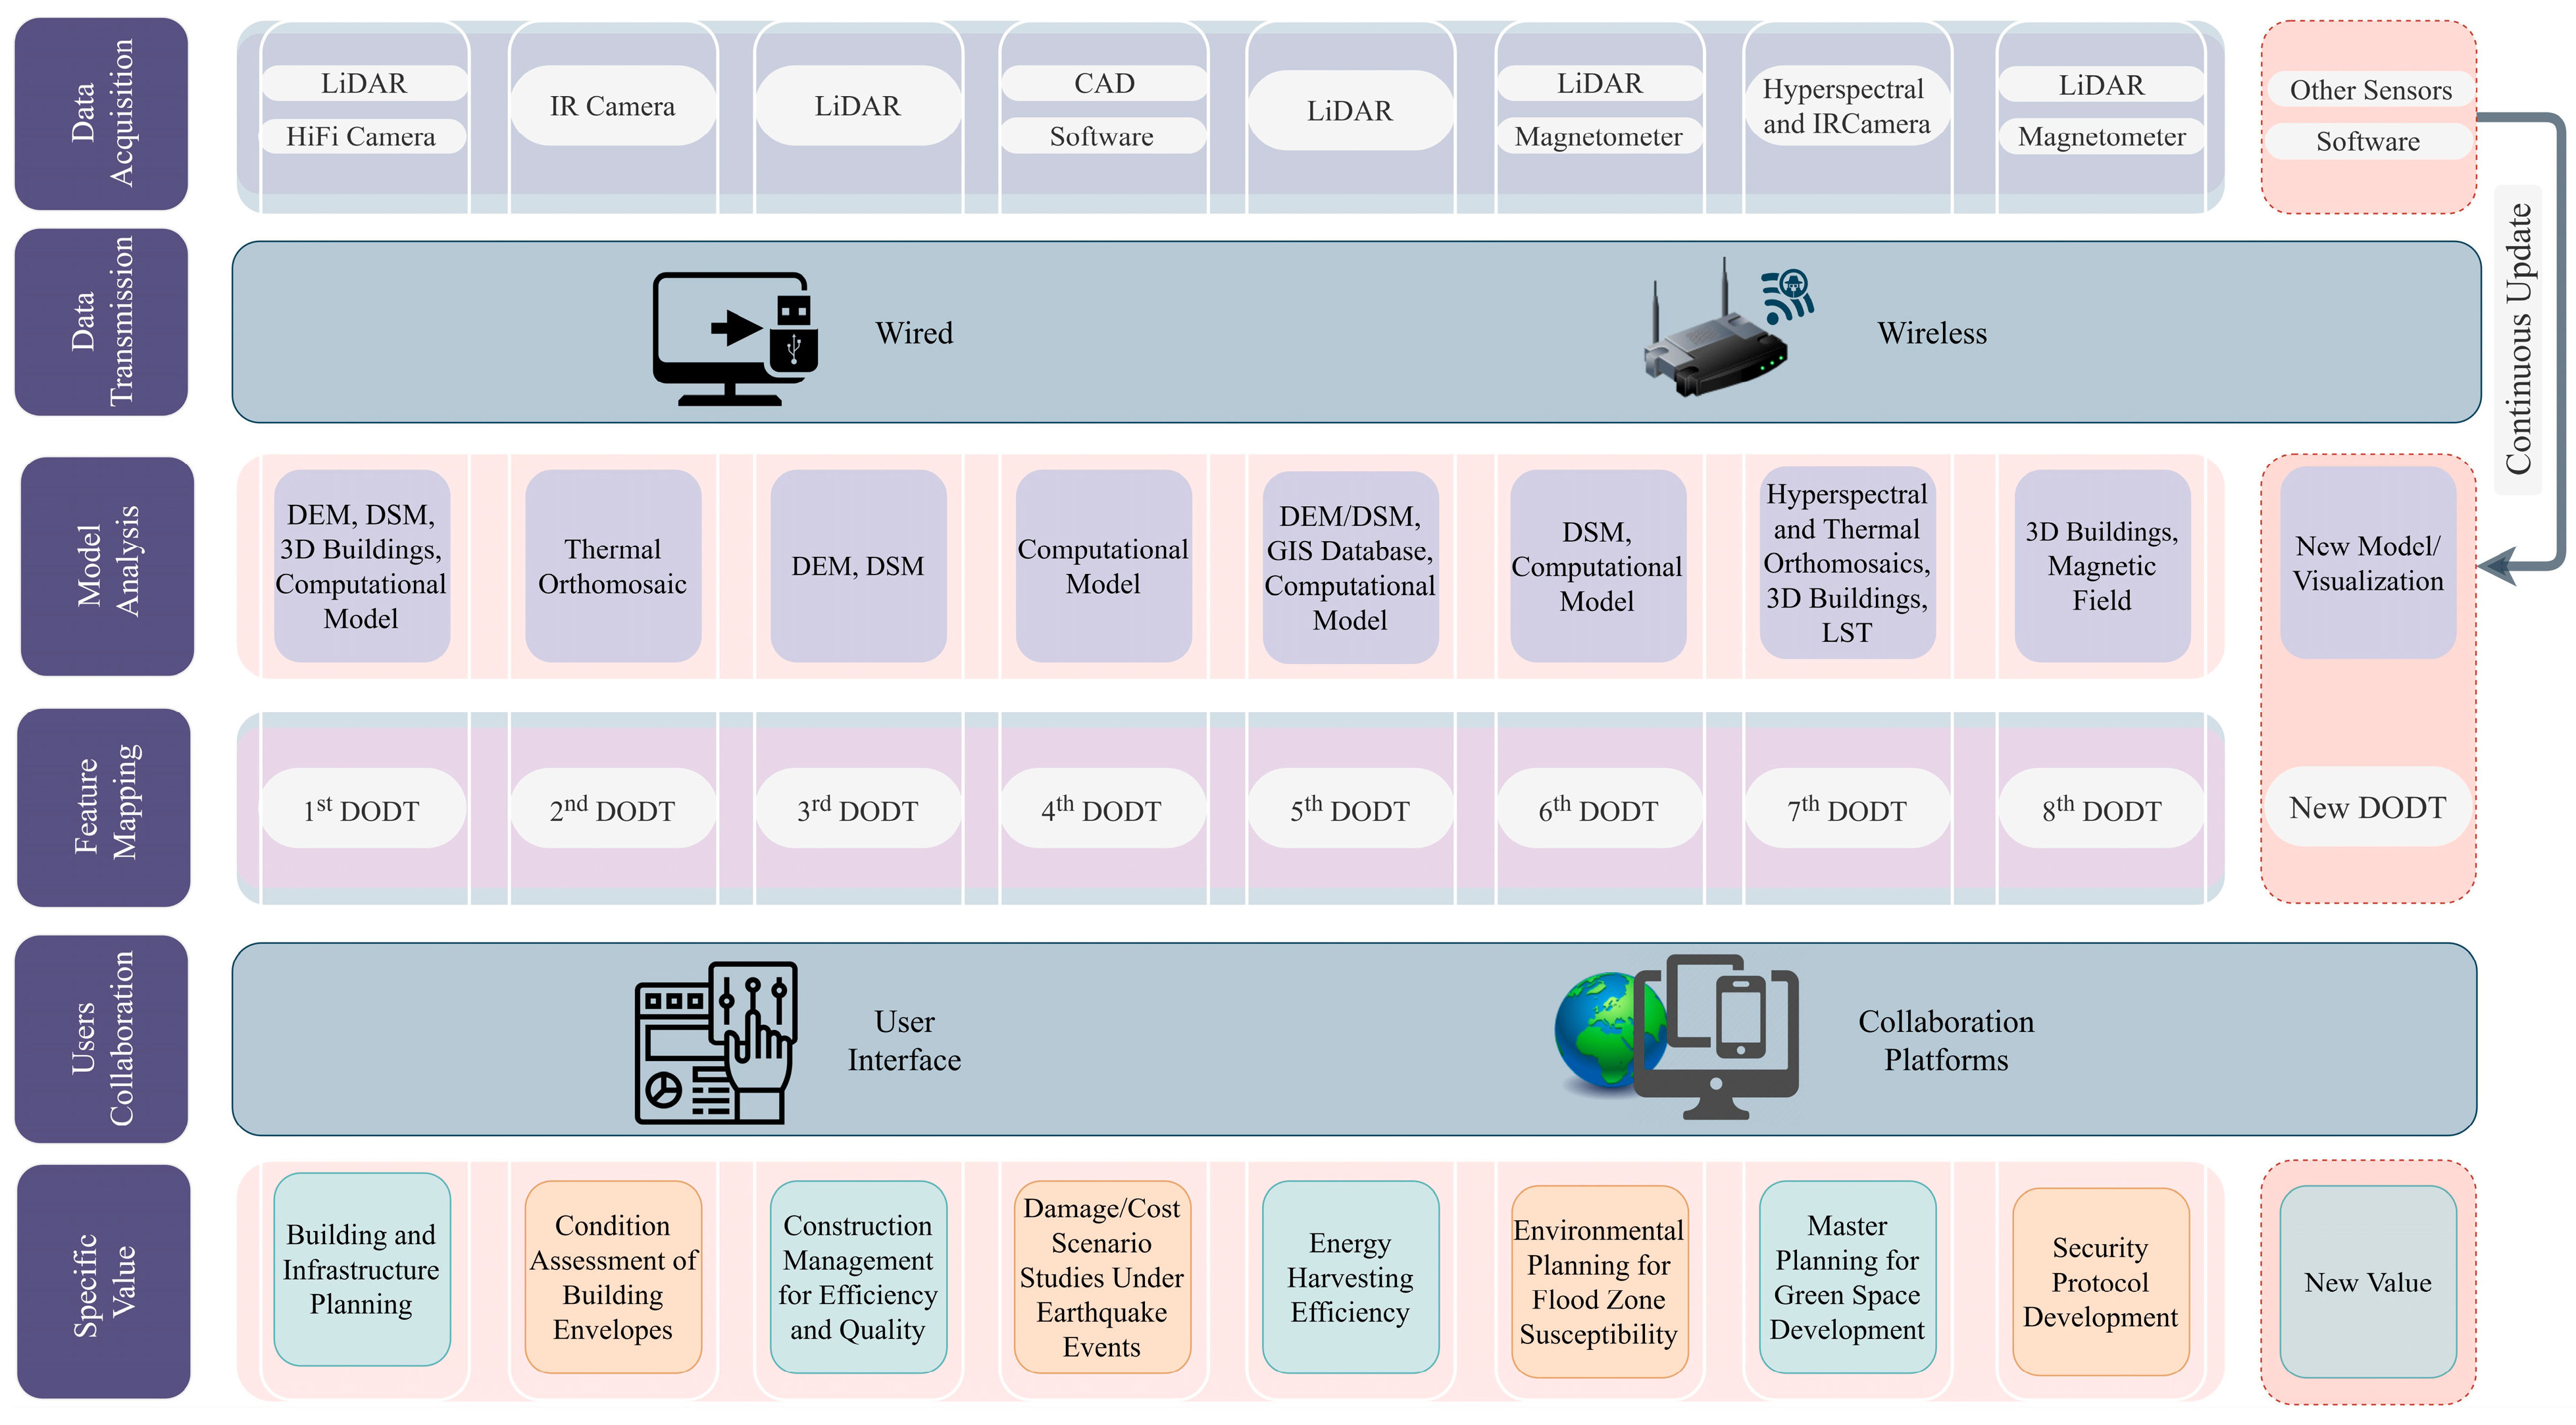
Table 2 presents the system architecture of DTs. It consists of five layers: data acquisition, data transmission, model analysis, feature mapping, and users’ collaboration. First, multimodal data are acquired from remote sensing, in situ sensing, and nondestructive testing. Subsequently, the collected data are transmitted to a DT curation and storage facility in the region. Following this, the received data are analyzed using informational and computational models. Subsequent to the analysis, the features of interest in asset management and regional planning are extracted and presented in mapping formats in the DTs. Finally, the processed features are communicated with end users through visualizations, dashboards, and interfaces to assist in collaboration and informed decision-making.
To exemplify the impact of enhanced DTs at the asset level,
Section 3 presents the two foundational computation platforms that couple information and computation modeling as well as experimental and computational simulation.
Section 4 presents a case study conducted on a campus scale. This case study serves as a tangible demonstration of the practical application of DT principles within conventional infrastructure. By focusing on a specific campus environment, this study showcases how DTs can be effectively employed to realize potential benefits and bring about transformative impacts on system, asset, and regional levels.
3. DT in the Built Environment at Asset and System Levels
While employing computational models is crucial for addressing structural safety concerns, the information modeling of nonstructural components becomes necessary for comprehending the functionalities of a building system. This is underscored by the fact that the integrity of structural components significantly influences the operations of nonstructural elements. Consequently, the synergy of computational and informational modeling is essential for the efficient and effective management of building and infrastructure assets, with updates occurring nearly in real time. As a result, the establishment of two foundational computation platforms is imperative to facilitate the implementation of DTs for both computational and informational modeling:
Spatial connection of structural and nonstructural components. Current computational and informational modeling tasks are performed by two completely isolated technical communities using different approaches. For the development of DTs, the two modeling techniques are transformed into one simple yet effective computational and informational engine to meet the multiple needs in performance evaluation as summarized in
Table 1.
Temporal connection between a built facility/environment and a new facility/environment to be built in part or entirety. This platform plays a critical role in bridging planning, design, construction, and operation of a physical building and infrastructure system.
As previously mentioned, the forefront of DT technology advancement predominantly centers on digital and physical twinning within a single model, such as computational mechanics or information-only domains. To enhance infrastructure lifecycle management at the asset level, it is crucial to integrate computational, informational, and other relevant models. The following two subsections offer practical examples that illustrate the integration of these models.
Section 3.1 focuses on the integration of computational and informational models, while
Section 3.2 centers on the integration of experimental and computational models.
3.1. Coupling of Computational and Informational Models
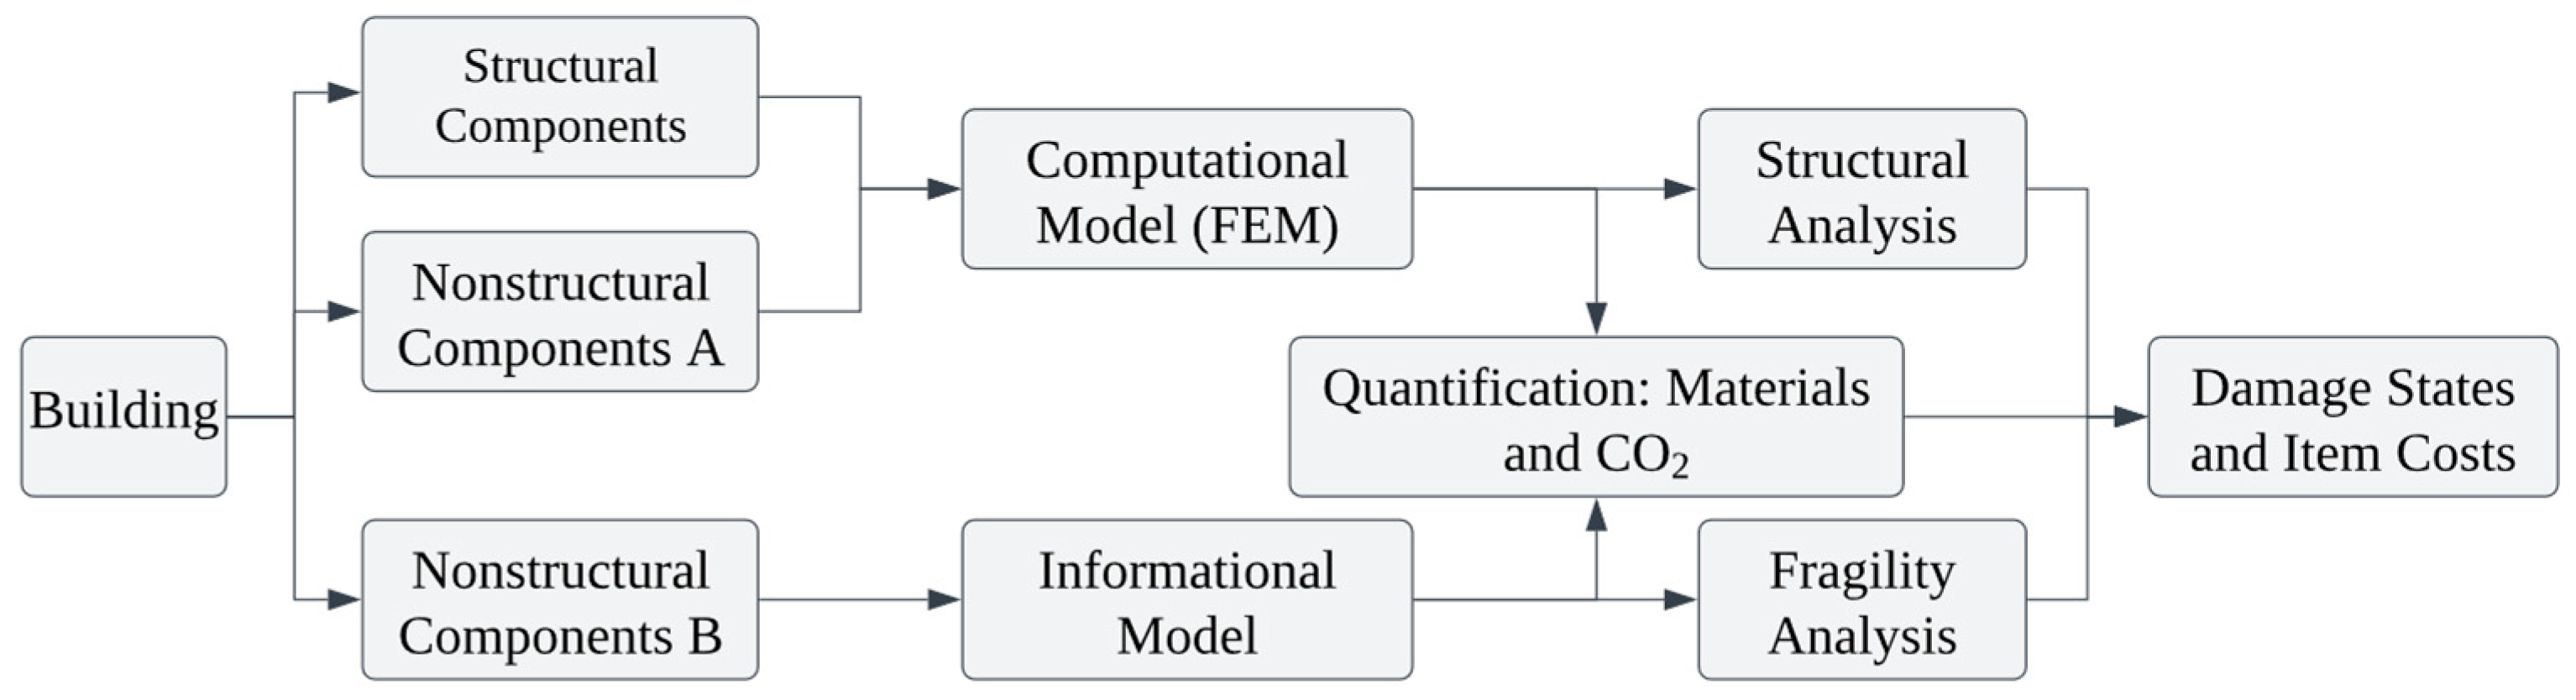
A building consists of structural components that primarily resist loading and nonstructural components that support building operation. The nonstructural components are further divided into two groups: A and B. Group A includes the pipeline system, hydraulic elevator system, and beams in the ceiling system, which interact significantly with their supporting structural components. Group B consists of the non-beam ceiling system, glazing system, and drywall partitions, which have negligible interaction with structural components.
Figure 3 shows a workflow diagram of the coupled computational and informational modeling to determine the probability of damage states and item costs in structural and nonstructural components. The computational and informational models are integrated into a seamless platform of fiber elements to address both mechanical behaviors (i.e., stress and strain at material levels) using OpenSees computational software, and functional value properties (i.e., integrity and cost at component or system levels) using informational interrelation. To maintain simplicity and efficiency, macro-scale models are introduced for nonstructural components and meso-scale models are used for structural components. Specifically, the structural components and Group A nonstructural components are represented by fiber elements in a finite element model (FEM) and analyzed under external loading (earthquake) to evaluate the building responses and damage states. Group B nonstructural components are represented by their informational model for lumped effects to estimate their damage states from respective fragility curves based on the overall performance of the building.
In Group A nonstructural components, the pipeline system was meticulously modeled to reflect the pinching behavior of joints along with their supporting hangers and wire restrainers. Similarly, the hydraulic elevator system was modeled to capture primary types of damage that potentially affect the performance of chassis, cabin, and main supporting cylinder. The beams in the ceiling system were modeled to account for their stiffness and strength effects on the building responses. In Group B nonstructural components, the non-beam ceiling system was modeled in a lumped sum for various failure modes such as the dislodgement of ceiling tiles, loss of connections along the edges, and vertical movement. These types of damage were comprehensively assessed and quantified through the utilization of fragility curves. The informational model for Group B nonstructural components and the size information of the computational model for Group A nonstructural components and structural components include the material data for each component that was used to estimate CO2 emissions resulting from producing these materials. This quantification was finally employed to determine the component costs under scenario damage states. Overall, the coupled computational and informational model offers a comprehensive dataset detailing the post-earthquake condition of building components and the environmental impact of the materials utilized in the construction of the building.
To have a reference case for comparison, a code-conforming, four-story, benchmark RC moment-frame building in Los Angeles [
18] is considered as an illustrative example. The building consists of four RC moment-resisting frames along the four sides of its perimeter to resist lateral loads in two orthogonal directions. The building has four bays in the north-south direction and six bays in the east-west direction. Each bay is 9.14 m (30 ft) long. Each floor of the four-story building is a solid 203 mm (8 in)-deep slab with a #13 (#4) post-tensioned reinforcement bar per foot. All columns rest on footings that are designed based on the bearing strength of the soil. The benchmark building supports pipelines, ceilings, drywall partitions, hydraulic elevators, and glazing system. For example, the piping system consists of 683 m (2241 ft) on the first floor and 737 m (2418 ft) on each floor above. It includes two different diameters of pipe: 102 mm (4 in) for the main pipes and 25 mm (1 in) for other pipes. The pipeline is supported on the floors through vertical hangers, each 559 mm (22 in) long and 9.5 mm (3/8 in) in diameter, and is restrained laterally and longitudinally by a bracing system. In this study, the nonlinear behaviors of concrete and steel materials are modeled. The piping system is considered as nonstructural component A while the ceiling system is nonstructural component B.
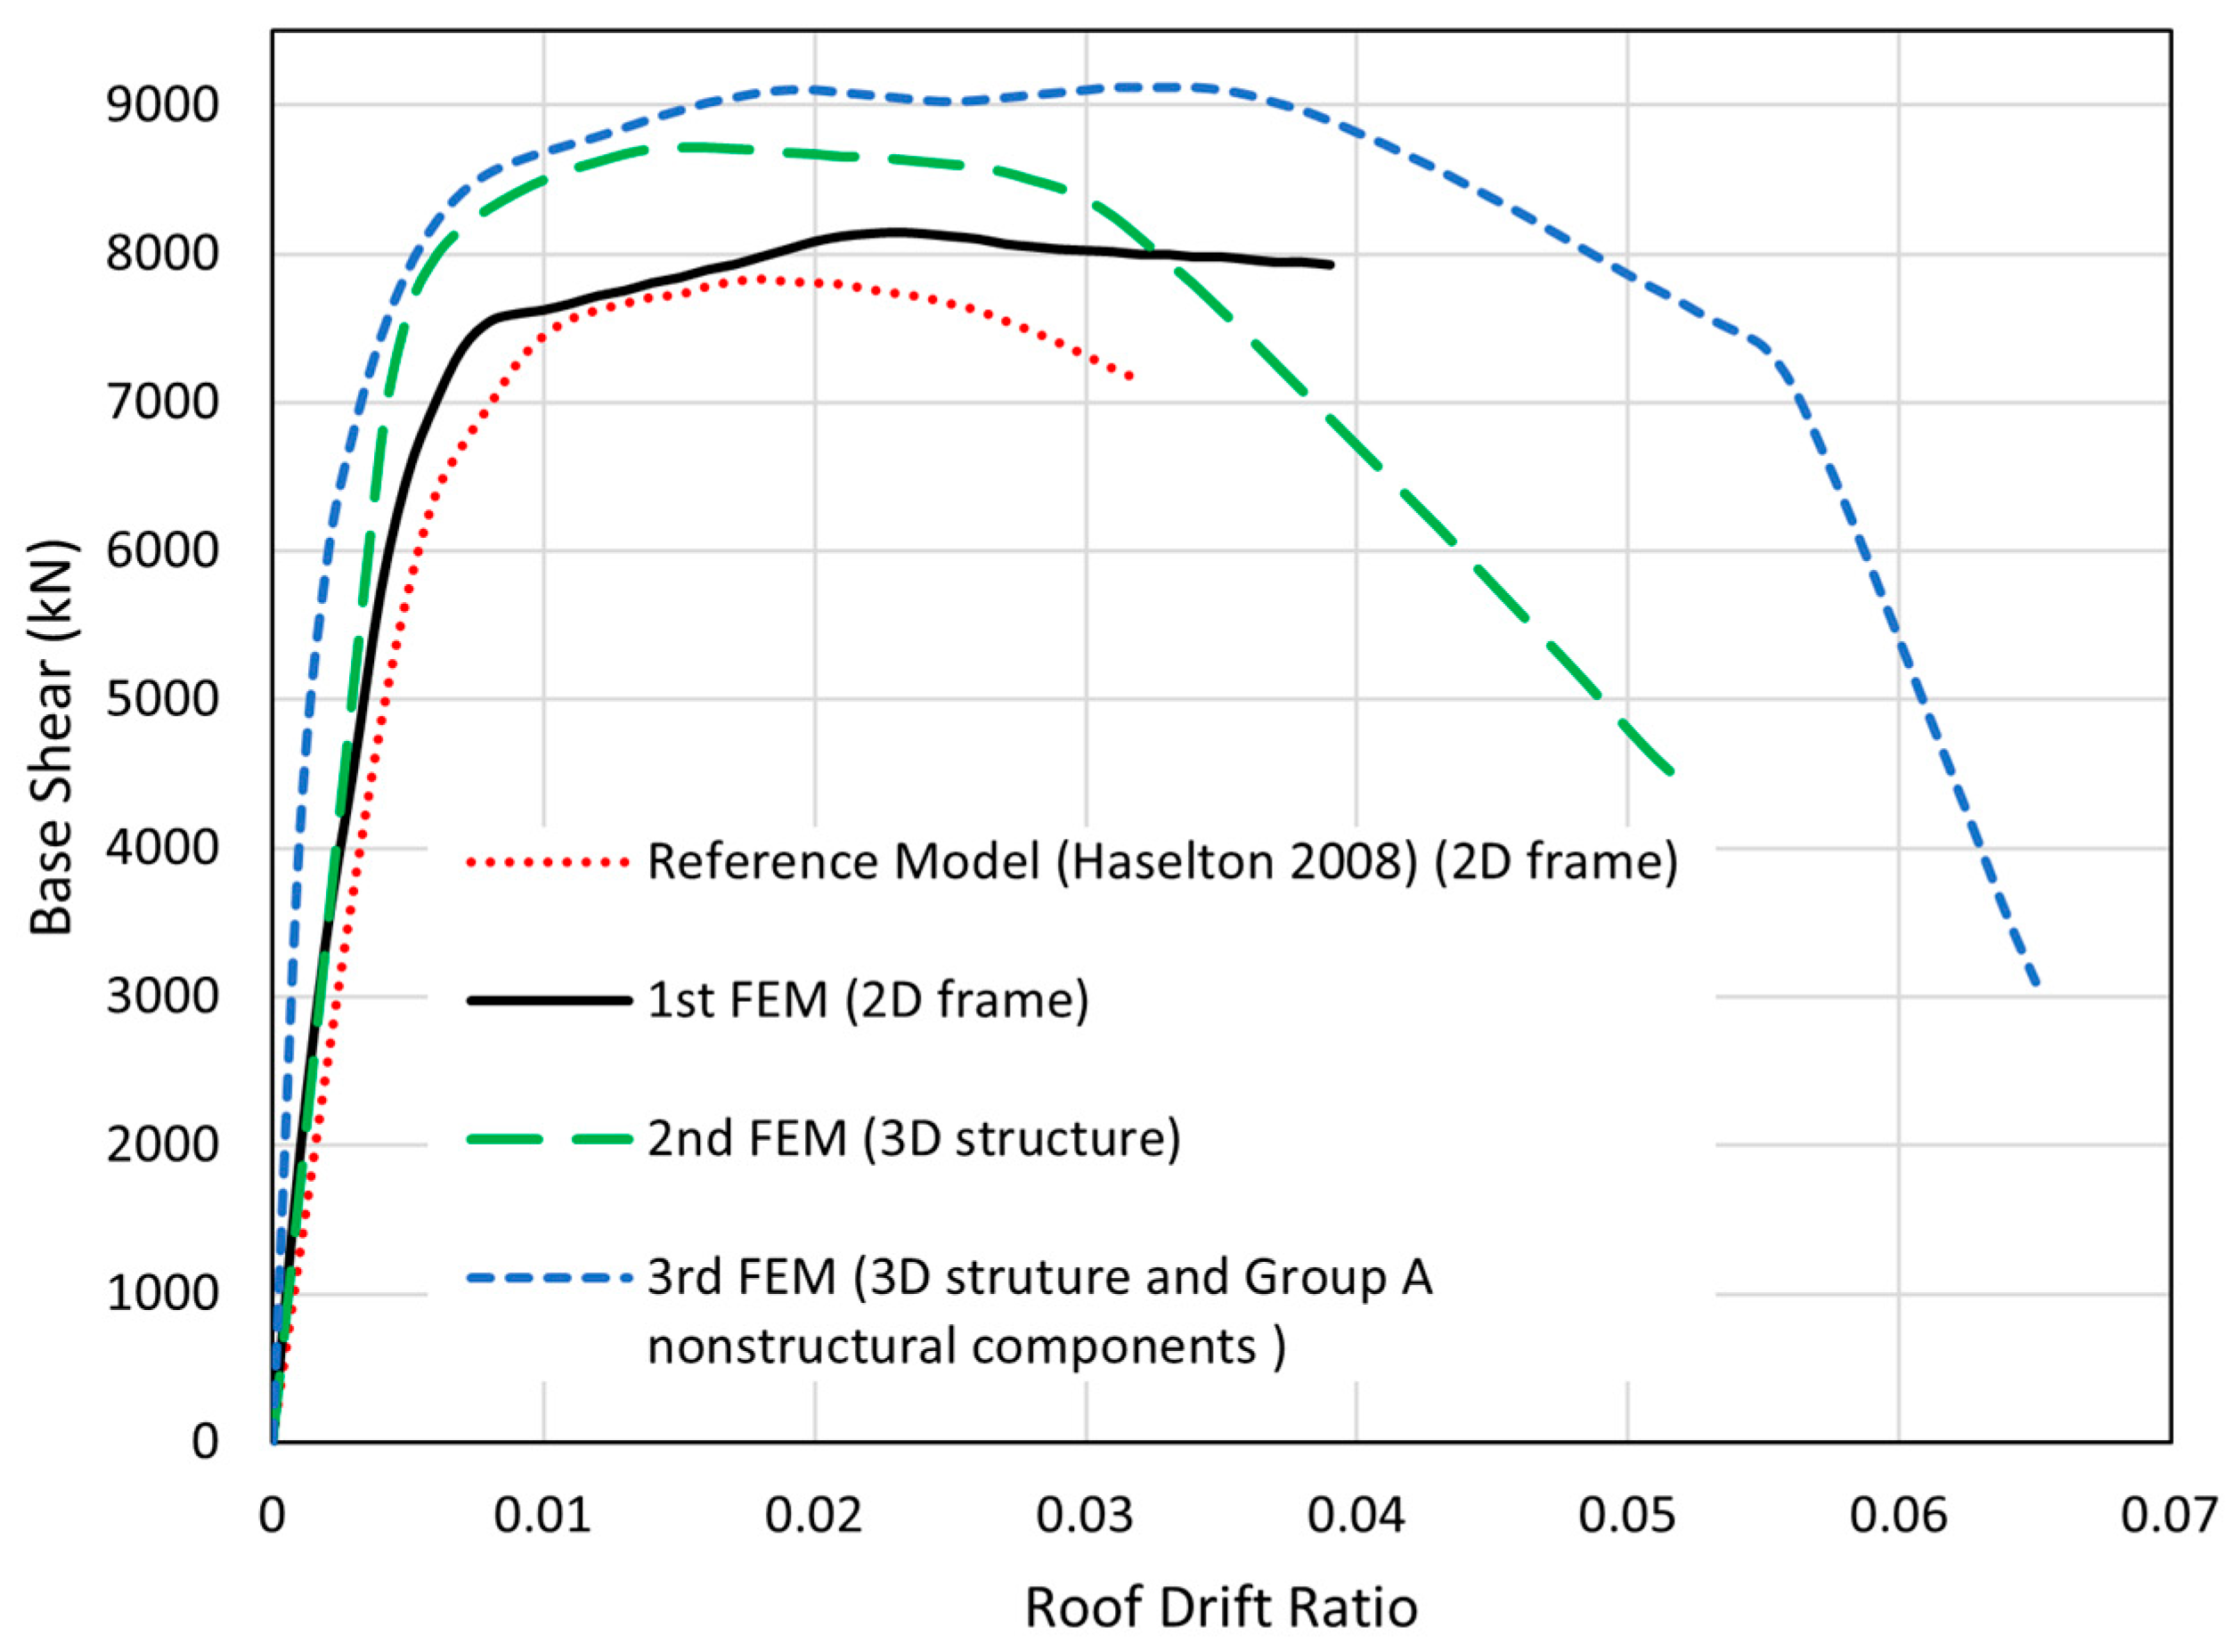
Three computational FEMs were developed and compared with the model in the reference paper [
18] to understand the effect of changes in analysis scale on the accuracy of results. The first model was a 2D model for the moment-resisting frame to make it comparable with the model in [
18]. The second model was a 3D model of structural components only, without including nonstructural components. The third model takes into consideration both structural and group A of nonstructural components (pipeline system, hydraulic system, and beams in ceiling system) to understand the effect of modeling the nonstructural components in the pushover analysis.
Figure 4 presents the base shear as a function of the roof drift ratio. The variance in outcomes between the model proposed by [
18] and the 2D structure model employed in this study is relatively minor concerning drift and maximum base shear. Specifically, the difference in maximum base shear amounts to 3.9%. In contrast, the difference between the 2D and 3D structure models is notably substantial. This discrepancy is attributed to the influence of slab stiffness on the building’s performance. The comprehensive 3D model that involved structural and group A nonstructural components diverges significantly from the second model in terms of long-range ductility due to the enhanced redundancy level within the model, coupled with the ceiling system’s role in facilitating partial bracing development.
3.2. Hybridization of Experimental and Computational Models
Buildings and civil infrastructure are commonly instrumented with accelerometers for monitoring structural behavior. However, this method has two notable drawbacks. Firstly, the extensive processing of acceleration measurements is required to derive data related to structural behavior, such as crack width and steel mass loss. This intricate mathematical process often serves as a barrier to the widespread adoption of sensing technologies. Secondly, the deployment of accelerometers relies on the configuration of an entire structure, making it unsuitable for adaptability to partially erected structures or entirely new constructions.
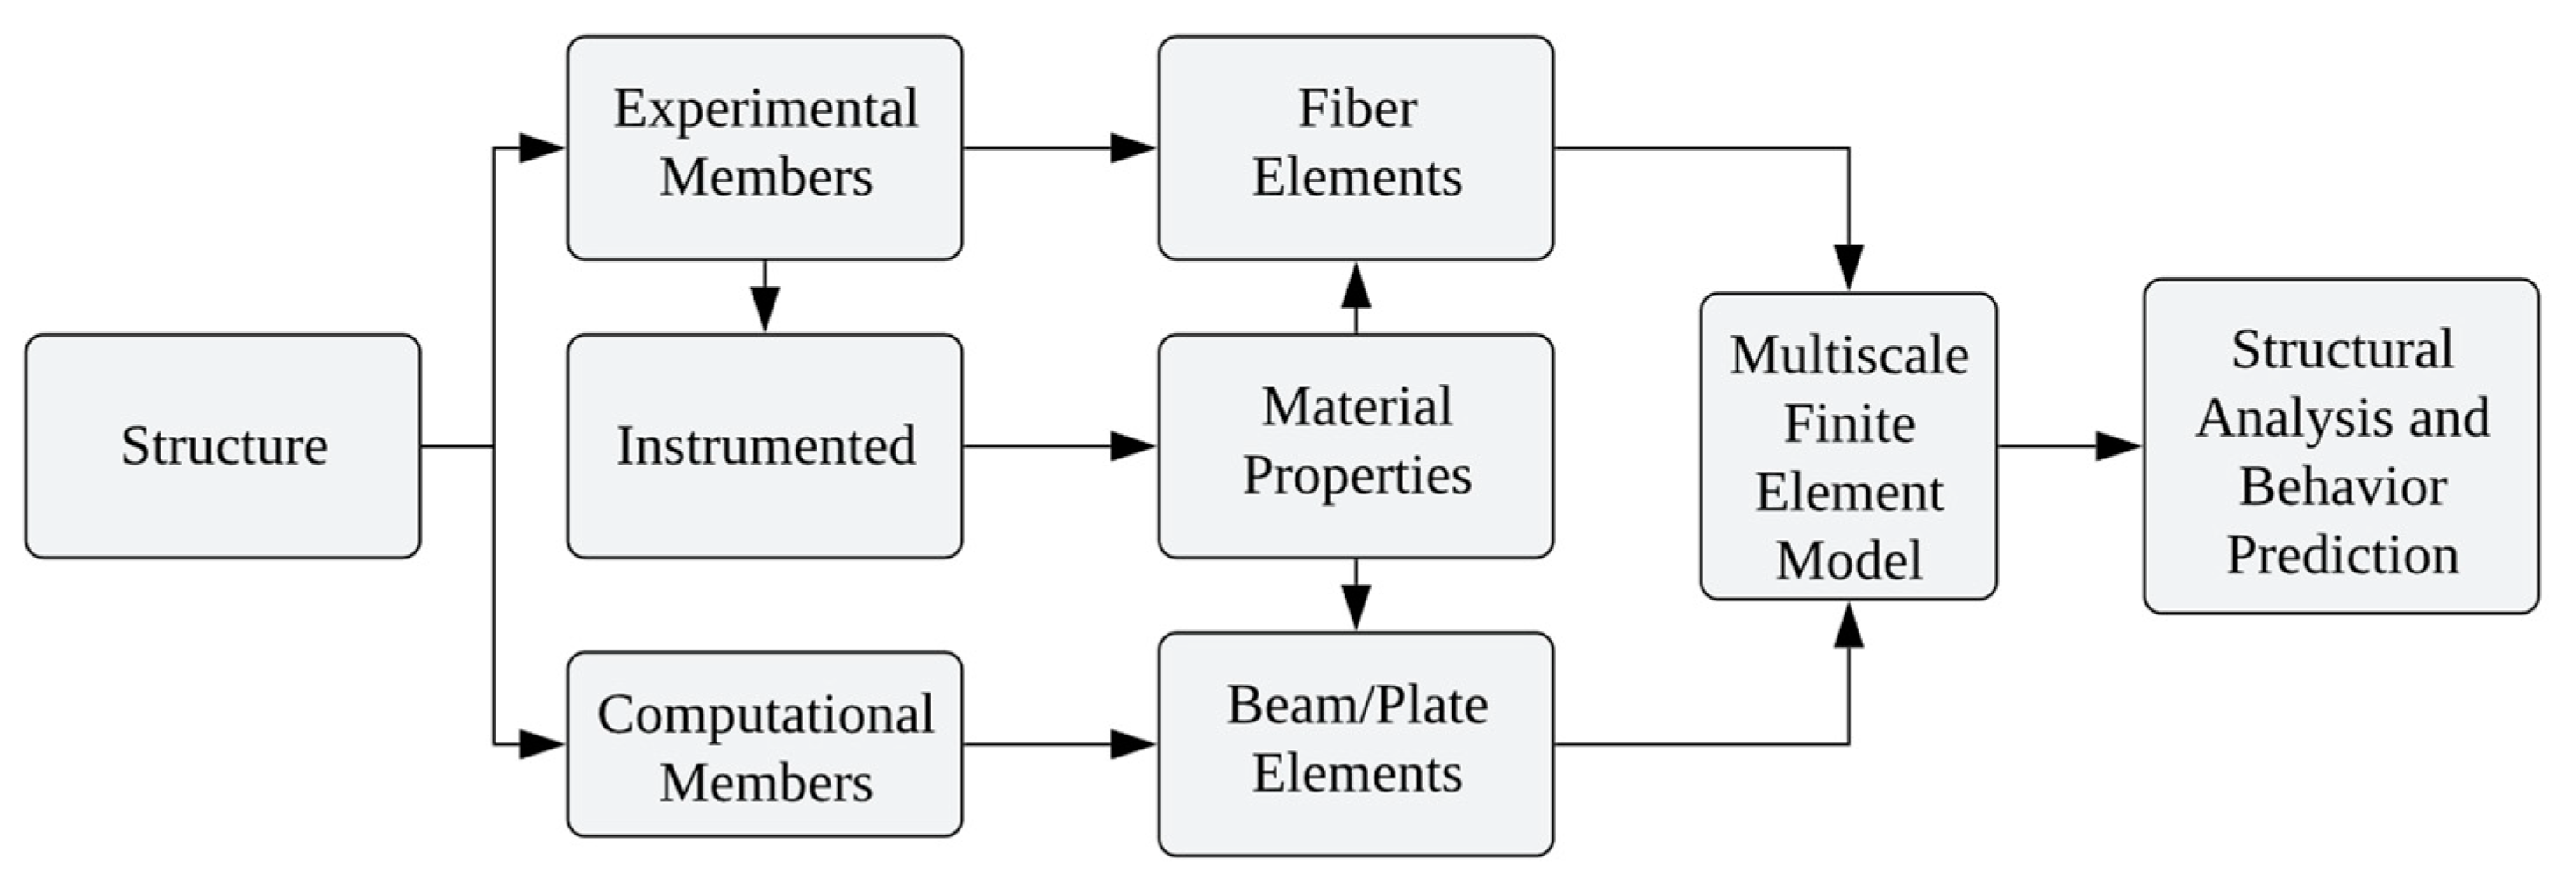
In practice, all stories of a building are typically built with the same materials using the same erection process of prefabricated components during construction. The first story, resting on a rigid base, is often subjected to a larger drift than the second and above. Thus, a novel strategy of hybridizing experimental and computational modeling is proposed in this study, as shown in
Figure 5. A structure is divided into two groups: experimental members in the first story and computational members above the first story. The experimental members are modeled by fiber elements and instrumented to measure the load-displacement response of the first story. The material properties extracted from the load-displacement curve are transferred in real time to update the FEM modeling and evaluation of the above stories using computational simulations. This hybrid experimental and computational treatment is compatible with the sequence of construction of a new building. This hybrid modeling strategy bridging existing to new constructions is also more accurate than conventional models. For a four-story, two-bay steel building structure, the hybrid treatment proved to be at least 25% more accurate than those simulations, even from a post-earthquake calibrated model [
19].
As highlighted in
Section 3.1 and
Section 3.2, the coupling of models facilitates the creation of two foundational platforms. Combining computational and informational models results in a streamlined and powerful computational and informational engine that addresses diverse requirements, offering a spatial connection between structural and nonstructural components. Similarly, integrating experimental and computational models establishes a temporal connection between an existing facility and a new facility under construction. Ultimately, the hybridization of these models produces outcomes that surpass initial expectations when compared to the use of separate models, substantiating the effectiveness of the DT approach proposed in this study.
4. DT in the Built Environment at the Region Level
The Missouri University of Science and Technology (S&T) campus serves as a case study for implementing a DT to unlock potential benefits and create transformative impacts on asset management and regional planning. Covering over 1,214,000 m2 (300 acres) of land, the main campus spans ten streets in the north-south direction and another ten streets in the east-west direction. The campus has both existing buildings and new buildings under construction as well as one pedestrian concrete bridge. Its surrounding area has four steel-girder highway bridges and one steel truss pedestrian bridge.
The DT development team has collected campus data biweekly since 19 March 2023, using three heavy-duty drones: Headwall M600, Geodetics M600, and Missouri S&T Octocopter. The Headwall M600 Pro Drone is equipped with a dual-sensor infrared camera (FLIR: Duo Pro R 640 × 512), a hyperspectral camera (Headwall: Naon-Hyperspec
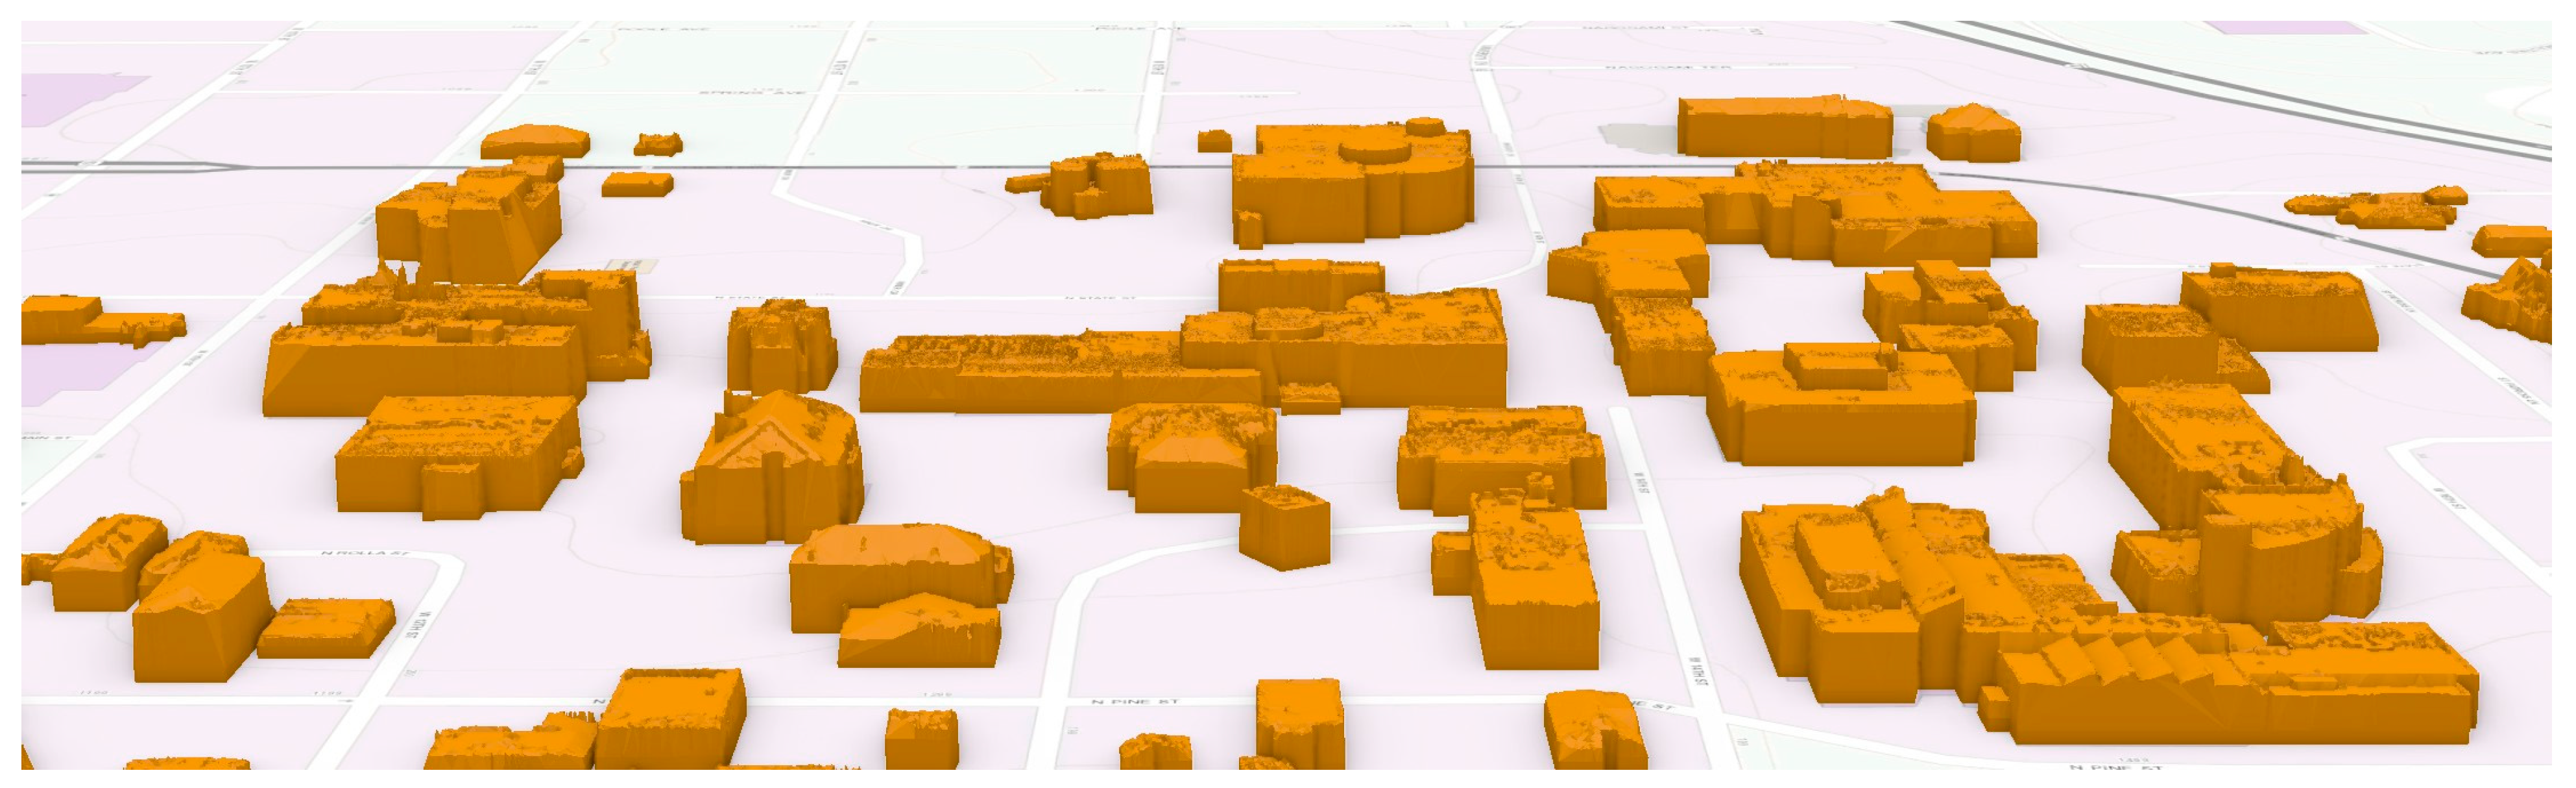
® VNIR), and a Light Detection And Ranging (LiDAR) scanner (Velodyne: Puck Lite). The Geodetics M600 Pro Drone is equipped with a 4k camera (Sony: A6000) and a LiDAR scanner (Velodyne: VLP-32C). The Missouri S&T octocopter is equipped with a three-axis magnetometer (STL: DM-50). The RGB image gives general features of the campus. The thermal image shows the temperature distribution around various buildings, offering valuable insights into their energy efficiency and insulation effectiveness. It can also be useful for detecting subsurface defects on roofs and roads. The LiDAR points with 3D coordinates allow a 3D reconstruction of building elevation models as a common DT platform for the visualization and presentation of features of interest, as shown in
Figure 6. This can provide useful information to monitor the progress of any ongoing construction or other structural changes taking place on the campus. The hyperspectral image sheds light on the health condition of campus landscapes and the types of construction materials. The magnetic field allows aerial navigation study for magnetic interference and underground exploration for metal structures. The magnetometer can be conveniently substituted with any other subsurface imaging system, such as ground penetrating radar and impact echo, without any loss of generality.
In this study, the DT expands beyond individual building assets to encompass the entire campus, including buildings, green areas, underground utilities, and other components. This broader scope is termed the DT at the regional level, emphasizing the scale of analysis. However, a closer examination indicates that the DT modules for buildings are at the asset level, while drainage systems can be categorized at the system level. This interconnectedness illustrates the hierarchical relationship between various levels of analysis as illustrated in
Figure 2.
4.1. Workflow to Realize Multiple DODTs and Values
As indicated in
Table 2, the workflow of creating a digital twin of the Missouri S&T campus is shown in
Figure 7. It starts with gathering data from various sources such as LiDAR, cameras (infrared (IR), hyperspectral, HiFi RGB), IoT sensors, and GIS databases to ensure a comprehensive and accurate representation. These data are then securely transmitted through robust protocols to a centralized or cloud-based storage platform on which the campus DT is hosted. The LiDAR data are used to generate a digital elevation model (DEM) and a digital surface model (DSM), representing terrain and surface features, including buildings. The process of developing DEM and DSM is explained in
Section 4.7. Building extraction is then performed to isolate structures and their features from the DSM. Subsequently, these extracted building footprints are transformed into 3D models using various modeling techniques in the GIS platform. These 3D models are carefully integrated, georeferenced, and aligned within the campus DT, ensuring spatial accuracy and seamless integration. The models are continuously refined and enriched with real-time data to keep it up to date with the changing campus. Features relevant to the built environment are carefully defined within this model. These defined features enable detailed analysis and scenario simulations, presented as DODT, to support campus planning and sustainable decision-making. The created features encompass a broad array of domains, including infrastructural planning, building envelope diagnosis, construction management, responses to extreme events (earthquakes and floods), energy usage, development of green spaces, and security. The insights obtained from these features are thoughtfully disseminated through intuitive user interfaces, enabling stakeholders to navigate and interrogate the campus DT. Furthermore, creating a collaborative environment is crucial, encouraging the active involvement of various stakeholders and experts to embrace diverse perspectives and expertise, optimizing the campus environment’s functionality.
It is evident from
Figure 7 that the data acquired from an individual sensor are utilized to achieve multiple DODTs. Furthermore, some DODTs are developed using a combination of data from various sensors. Although each sensor’s data are initially used independently, the spatial-enabled nature of the multilayer data makes it straightforward to fuse multiple datasets. Combining these fused data with fresh sensor data has the potential to create new DODTs. Additionally, given that those data are collected biweekly to update the DT, the time series data can track changes and utilize artificial intelligence (AI) and machine learning (ML) algorithms to forecast the future. This foresight enables predictive maintenance, which represents another novel DODT.
Figure 7 also demonstrates the specific values of the campus-scale DT. These values are realized through digital modeling and analysis. The output of each model and analysis provides a distinct value and is thus considered one DODT. A total of eight (first to eighth) DODTs are presented in
Figure 7. The numbering of the DODTs does not denote any particular order or hierarchy; instead, they are listed in alphabetical order of their values as presented below:
Building and infrastructure planning;
Condition assessment of building envelopes;
Construction management for efficiency and quality;
Damage/cost scenario studies under earthquake events;
Energy harvesting efficiency;
Environmental planning for flood zone susceptibility;
Master planning for green space development;
Security protocol development.
4.2. First DODT: Building and Infrastructure Planning
The accurate 3D representation of the campus, where all buildings align with their precise geolocations as depicted in
Figure 6, becomes a powerful tool for meticulous planning and execution of infrastructure projects, encompassing both existing and forthcoming structures within the campus. For existing structures, historic buildings in the campus DT often have no archival information or engineering drawings to track down for engineering project development. For efficient and effective renovations and maintenance, a digital library of the buildings, as shown in
Figure 6, can be created from a realistic 3D representation of aging buildings. Both the outside and inside of buildings can be scanned and replicated in the 3D representation from which future projects can be developed and documented to save project costs.
For forthcoming structures, integrating the 3D model of a new building into the campus DT permits a comprehensive visualization of its potential impact on the existing infrastructure from various perspectives. This detailed visual representation aids in evaluating potential alterations, assessing space utilization, optimizing resource allocation, and ensuring a seamless integration of new constructions into the campus environment. Such modeling facilitates informed decision-making and enables stakeholders to anticipate and address infrastructure challenges proactively, fostering an efficient and sustainable campus development. For example, the DSM can be used directly to determine the heights of various buildings and landmarks. As such, it is a practical tool for enforcing city or town regulations to preserve landmarks by limiting surrounding new constructions to a maximum height in a city or a relative height in a part of the city.
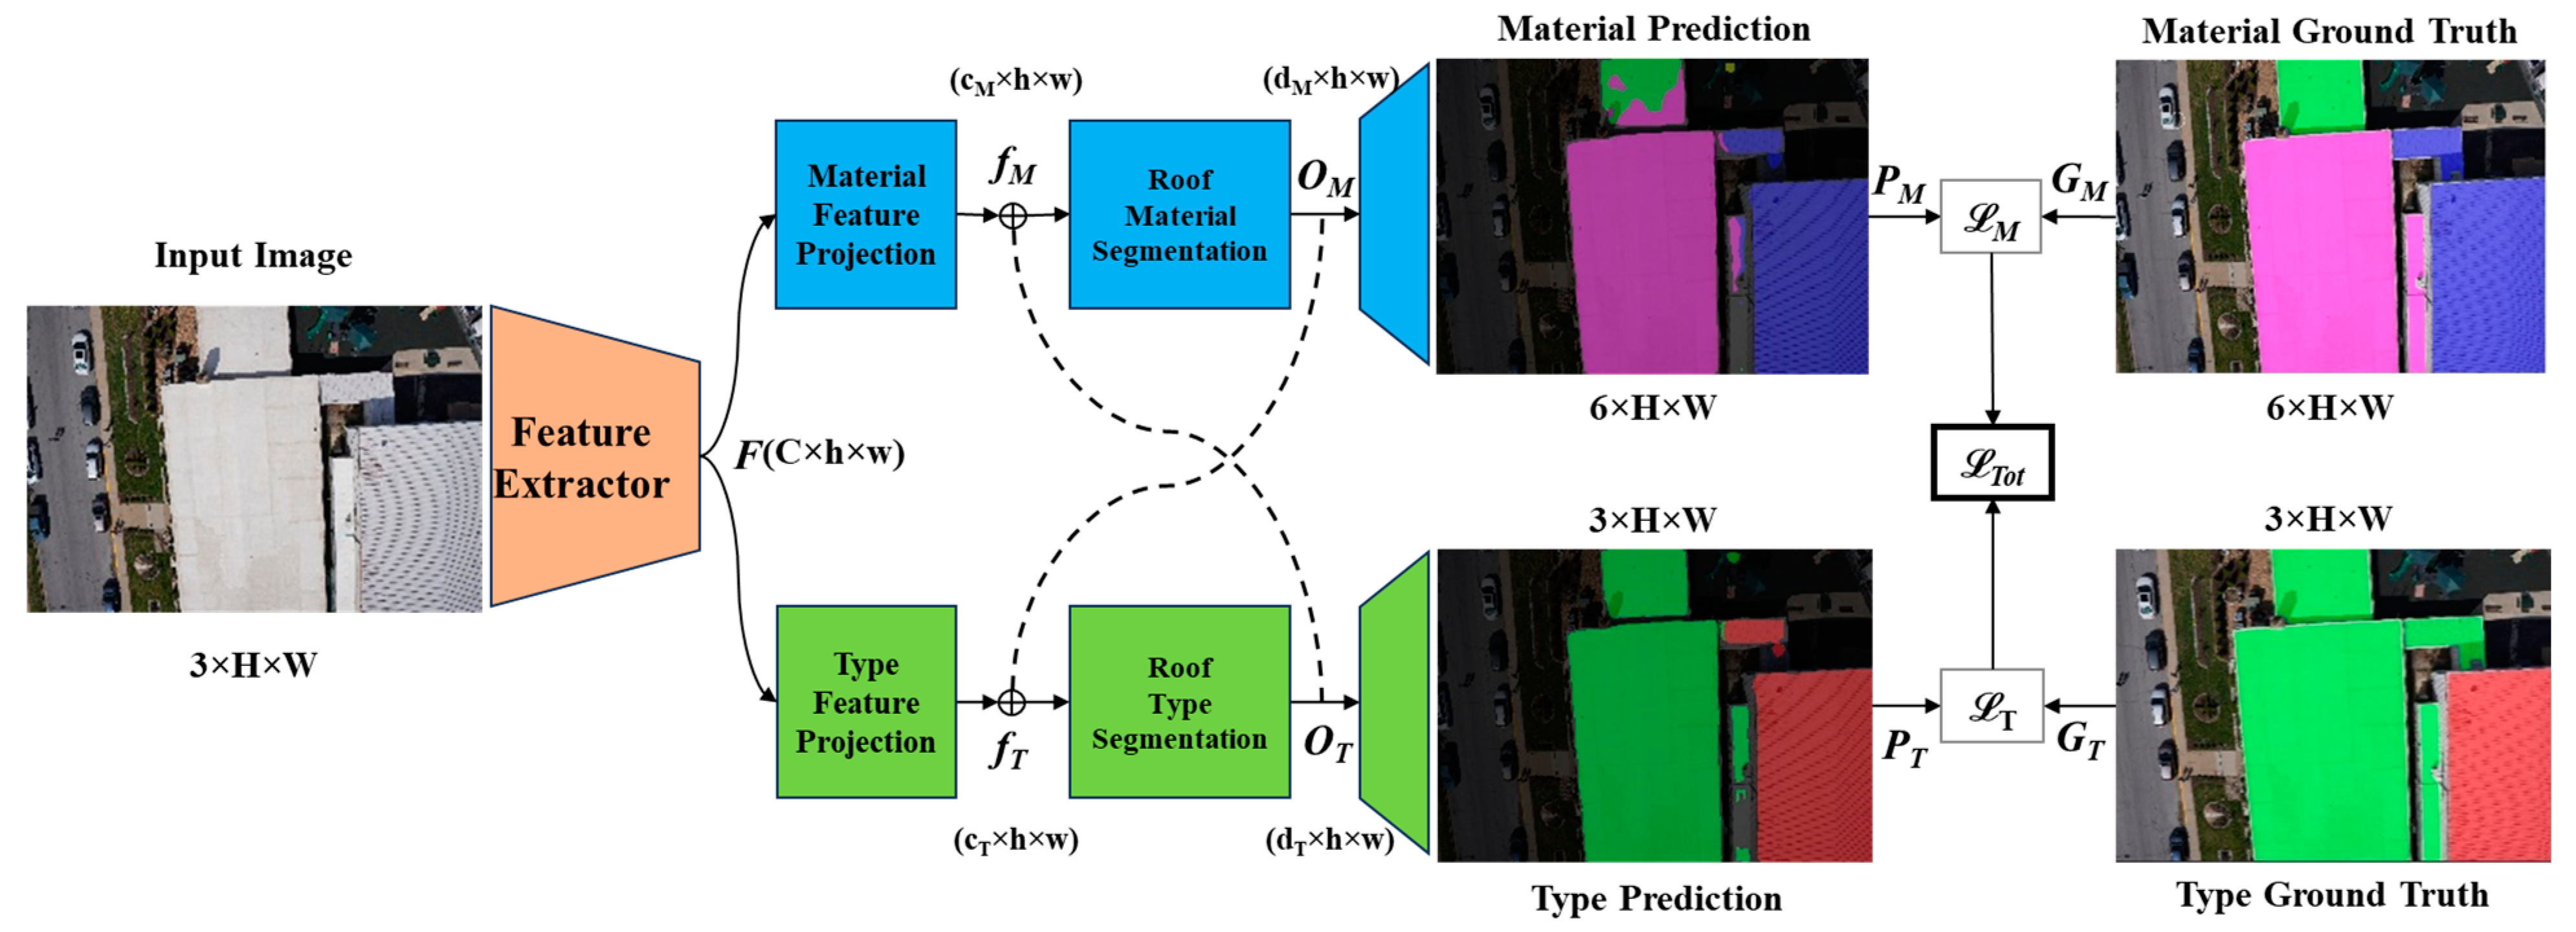
For a large building inventory, two-task machine learning [
20] can be used to automatically classify roof type and material as shown in
Figure 8. For the roof type segmentation task, three classes are defined, namely Background, Slope Roof, and Flat Roof. For the roof material segmentation task, six classes are defined, namely Background, Rubber Slate Tile, Thermoplastic Membrane, Rubber Membrane, Metal, and Concrete. On 23 April 2023, aerial images were taken over the rooftops of the buildings for the purpose of training the machine learning model. The dataset gathered for this study comprises a total of 94 images with a pixel resolution of 6000 × 4000, all meticulously annotated at a pixel level to ensure accuracy in subsequent analysis. The labeling process was conducted using the Image Labeler app in MATLAB, which offers a robust and efficient means of image annotation. These annotated images were then divided into two distinct sets for the purpose of training and testing. The training set encompassed 87 images, while the remaining images were allocated to the testing set.
As shown in
Figure 8, the feature extractor,
F(C×h×w) as a core convolutional neural network (CNN), extracts all the common features that are used for the two tasks. The two tasks are predicted through two coupled feature projections—segmentation branches. The output from the roof material segmentation module is concatenated with the roof type features to provide the roof type awareness to the material segmentation task, or vice versa. The type features,
, and the material features,
, intertwined in
, are decomposed by two projection modules. In both branches, the CNN downsamples the feature embedding
f(c×h×w) to become the class-specific feature map
O(d×h×w) with the same number of channels of defined classes in each branch. Obviously, the number of channels in
and
is larger than that of
and
. The downsampled
and
are projected into two separate score maps to obtain the predictions of roof type and material,
and
, respectively. A total cross-entropy loss function of the two predictions in comparison with their respective ground truths is calculated. The mean intersections of union (mIOU) between the predictions and their ground truths are determined to be 83% and 89% for roof material and type segmentations, respectively. Correspondingly, the accuracies of the roof material and type predictions are 96% and 97%, respectively. It is important to mention here that the above case study only demonstrates proof of concept. Knowing the specific types of roof materials empowers accurate representation and simulation of how different roofing materials behave under various conditions, enabling informed decisions and optimal outcomes in future building and infrastructure projects within the DT. Indeed, the method employed in this example can be expanded to include damage identification and thus create a comprehensive system for assessing the structural condition. This new function will be regarded as a different DODT, as its value differs from that of the current DODT. Additionally, the same framework can be applied to inspect other types of structural systems, including but not limited to walls, beams, columns, and window frames.
4.3. Second DODT: Condition Assessment of Building Envelopes
Building envelopes are one of the most critical components to support a building’s functionality and energy efficiency. This enclosure is not a single element; rather, it constitutes a combined system comprising foundations, roofs, walls, doors, and windows. Utilizing infrared thermography, an imaging technique that translates thermal energy from the infrared band into visible images, proved highly effective and reliable in identifying surface defects such as moisture problems on building envelopes and air leakages in walls or around windows or wall cavities [
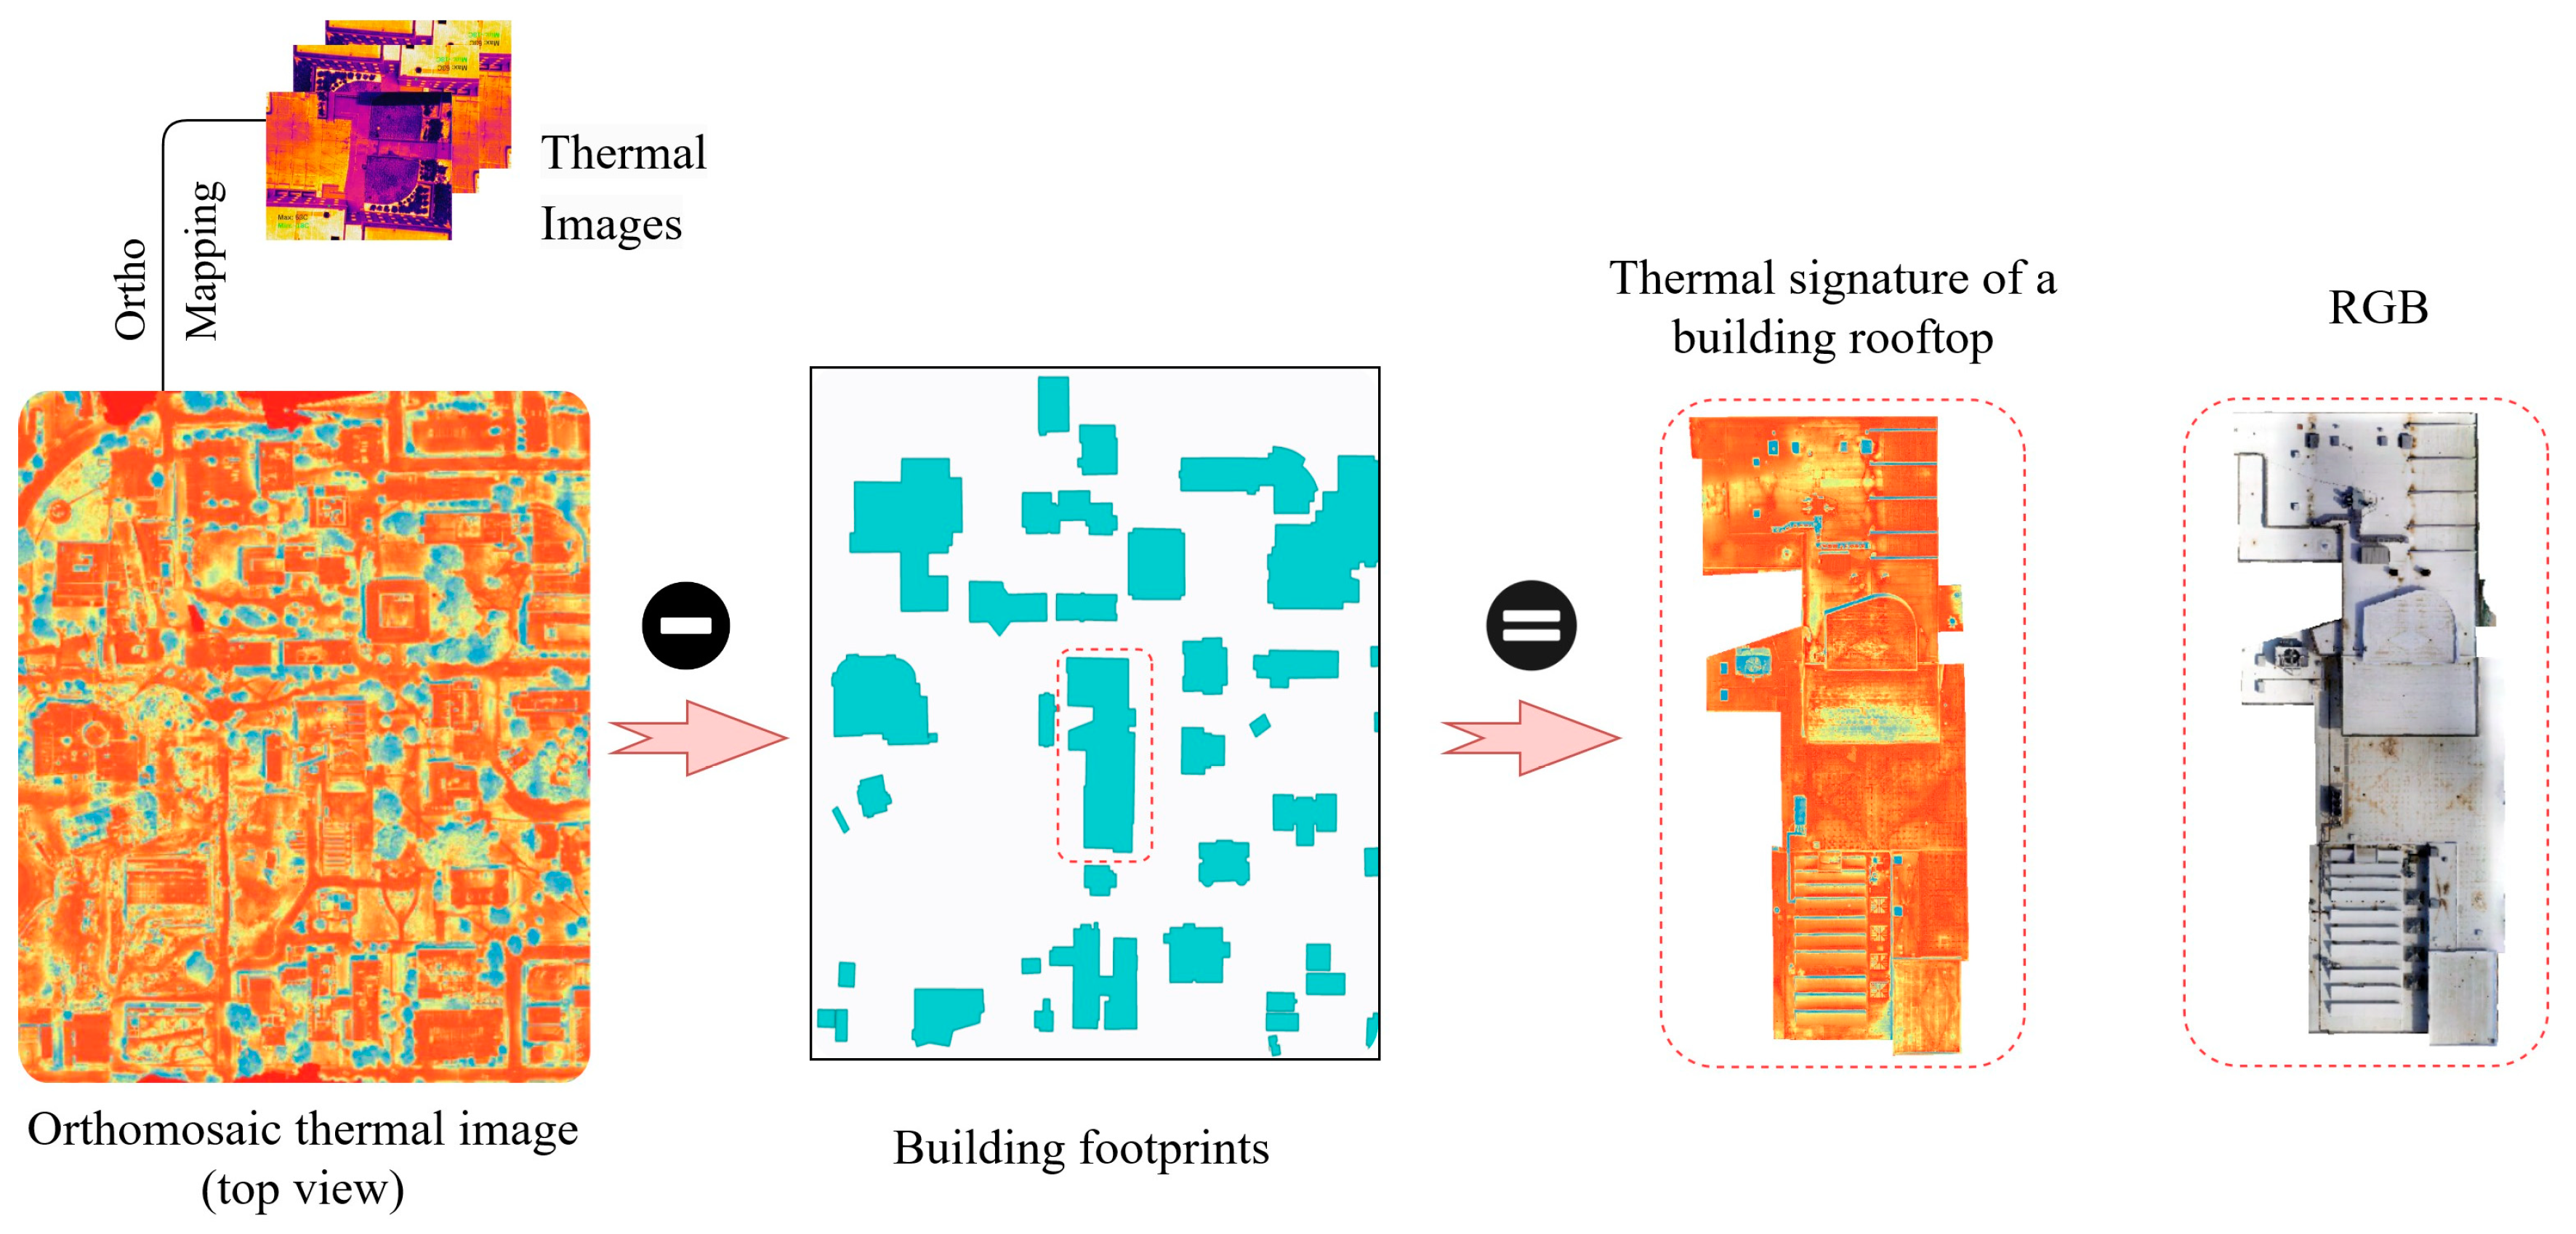
21]. Among these building components, special attention must be paid to the roof due to its constant exposure to harsh weather conditions. In particular, flat roofs are susceptible to problems such as water infiltration when rain and snow accumulate. An aerial inspection conducted with a high-sensitivity IR camera (FLIR: Duo Pro R 640 × 512) attached to an unmanned aerial vehicle (UAV) swiftly and precisely detects wet insulation in flat roofs by leveraging temperature variations between dry and moist areas.
Figure 9 presents the thermal imagery of the roof of Toomey Hall, a building rooftop located at the campus center, along with its corresponding RGB image. The Headwall UAV was utilized for aerial scanning of the campus. The infrared camera continuously streamed real-time radiometric data directly to the ground control station during the flight. Images were captured at a rate of one frame per second at an altitude of approximately 65 m above the ground. Following image capture, a photogrammetric orthorectification process was employed to correct geometric distortion and generate an accurate orthomosaic thermal image. The predefined building footprints, intended for 3D building development, are used to isolate the specific rooftop for enhanced visualization. The color patterns and differences in intensity aid in a rapid condition assessment of the roof and early detection and prevention of damage.
4.4. Third DODT: Construction Management for Efficiency and Quality
A rapid and reliable detection of change in construction sites is paramount in the construction industry due to its significant economic implications. Three-dimensional change detection is especially critical, considering that construction often occurs primarily in the vertical direction, necessitating accurate quantification and comparison against pre-existing design models for effective progression assessment.
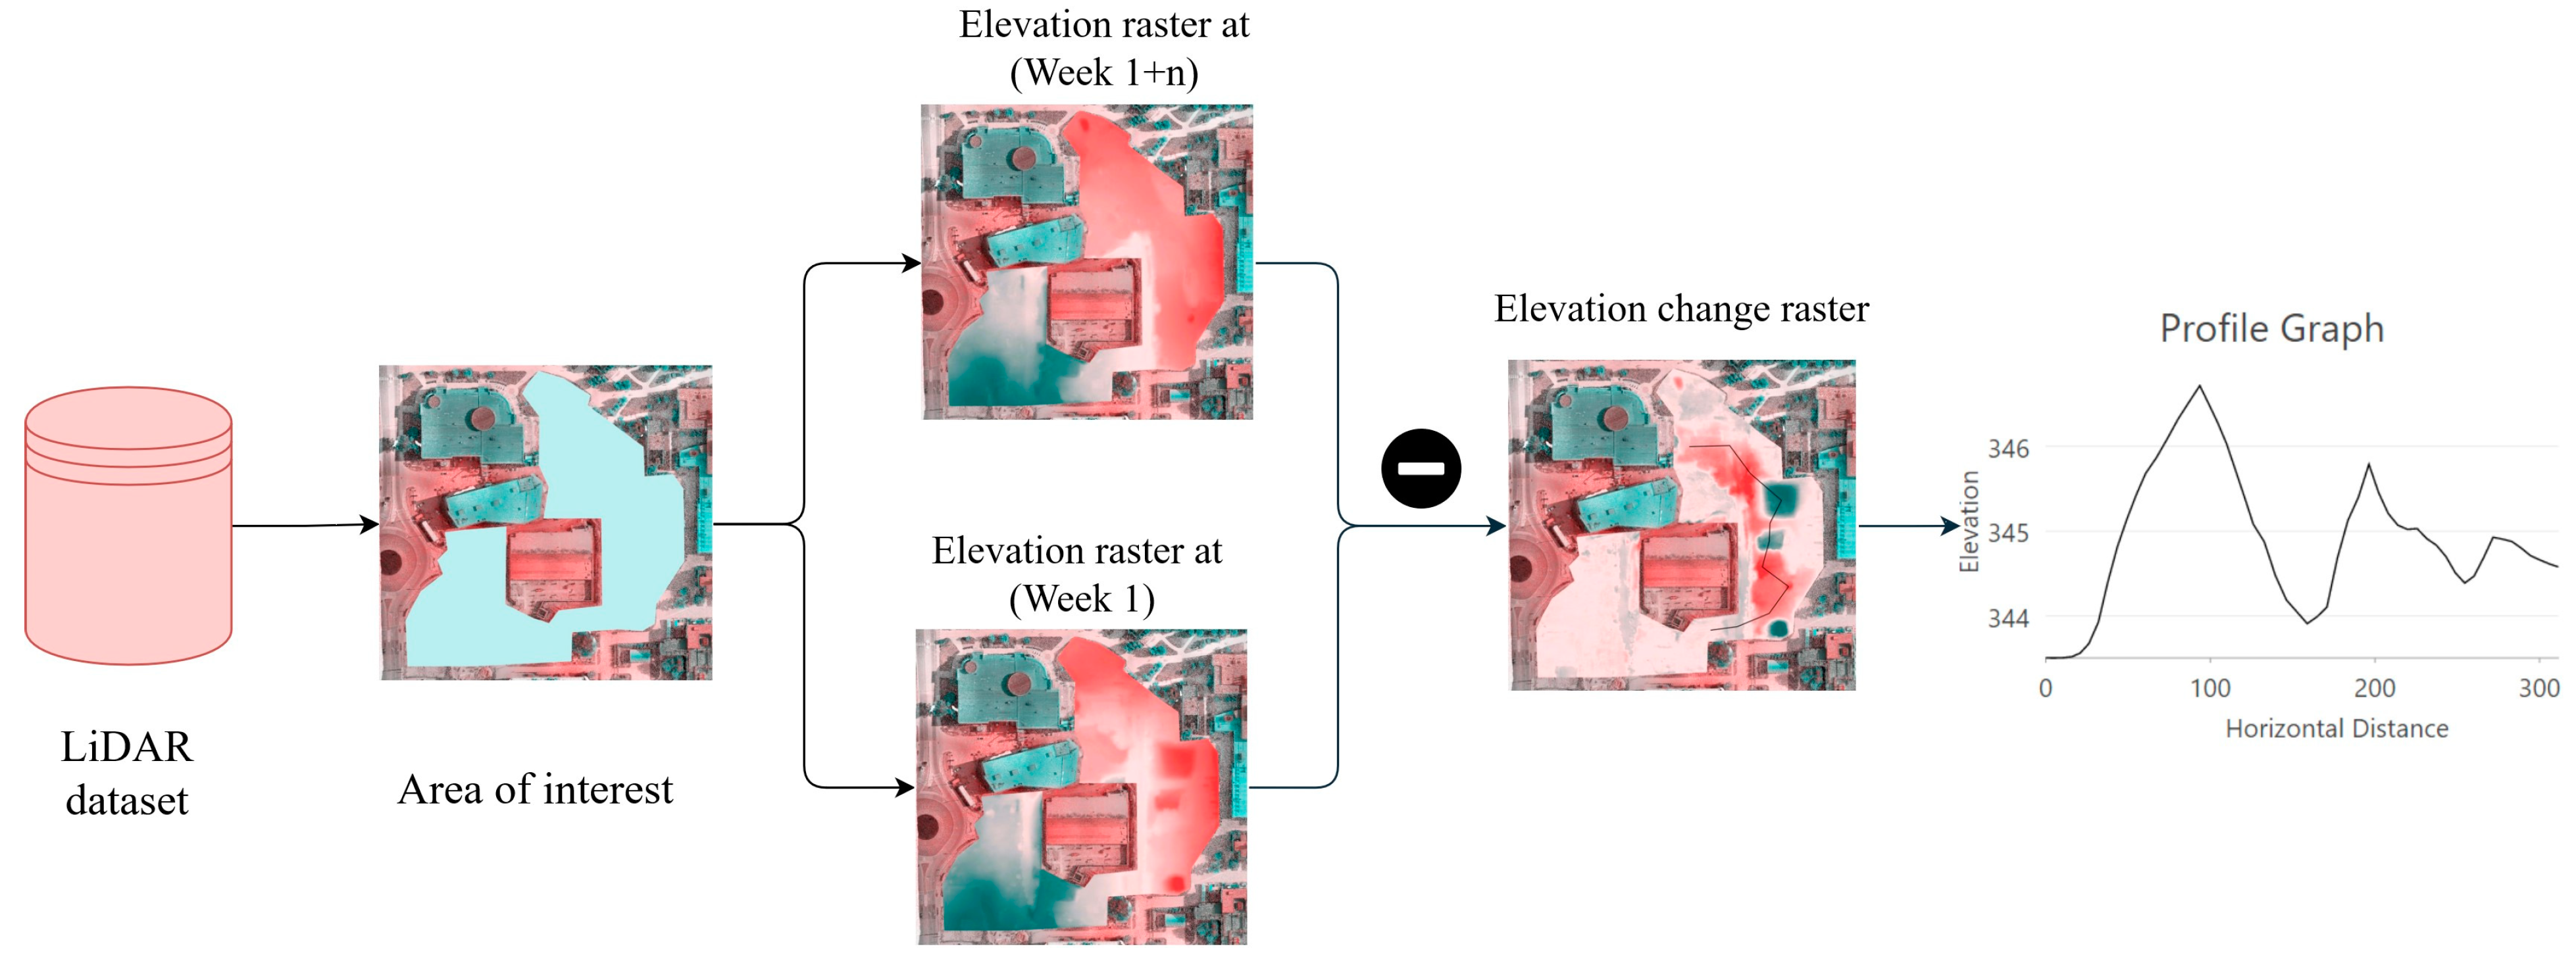
Figure 10 shows a flow diagram to extract the excavation data over time at the Innovation Lab Building on Missouri S&T campus. Two elevation raster images of LiDAR data (DSM) at different times are subtracted to determine the change of elevation at the project site. The excavation along a particular path on the ground is shown as an example. This difference in DSM can be used to help manage construction projects in terms of progress evaluation and future task scheduling to optimize construction performance. Furthermore, understanding the progress of two independent crews on the same project also allows an early detection of misalignment in parts and elements during construction. This early identification is crucial for timely corrective actions, ensuring that the project proceeds smoothly and in alignment with the intended design and construction plan.
4.5. Fourth DODT: Damage/Cost Scenario Studies under Earthquake Events
The integrated informational, computational, and experimental modeling platform enables scenario studies under extreme loads to understand and improve community resilience through targeted planning activities. For example, it is invaluable for emergency planning to support the new construction of critical facilities, such as hospitals, police stations, and fire stations. The coupled computational and informational modeling allows a rapid estimation of the damage to existing buildings and their associated costs in the wake of an earthquake event, which is insightful for post-event emergency response, evacuation, and recovery.
Consider the four-story, benchmark RC moment-frame building [
18] as a new construction project on the Missouri S&T campus.
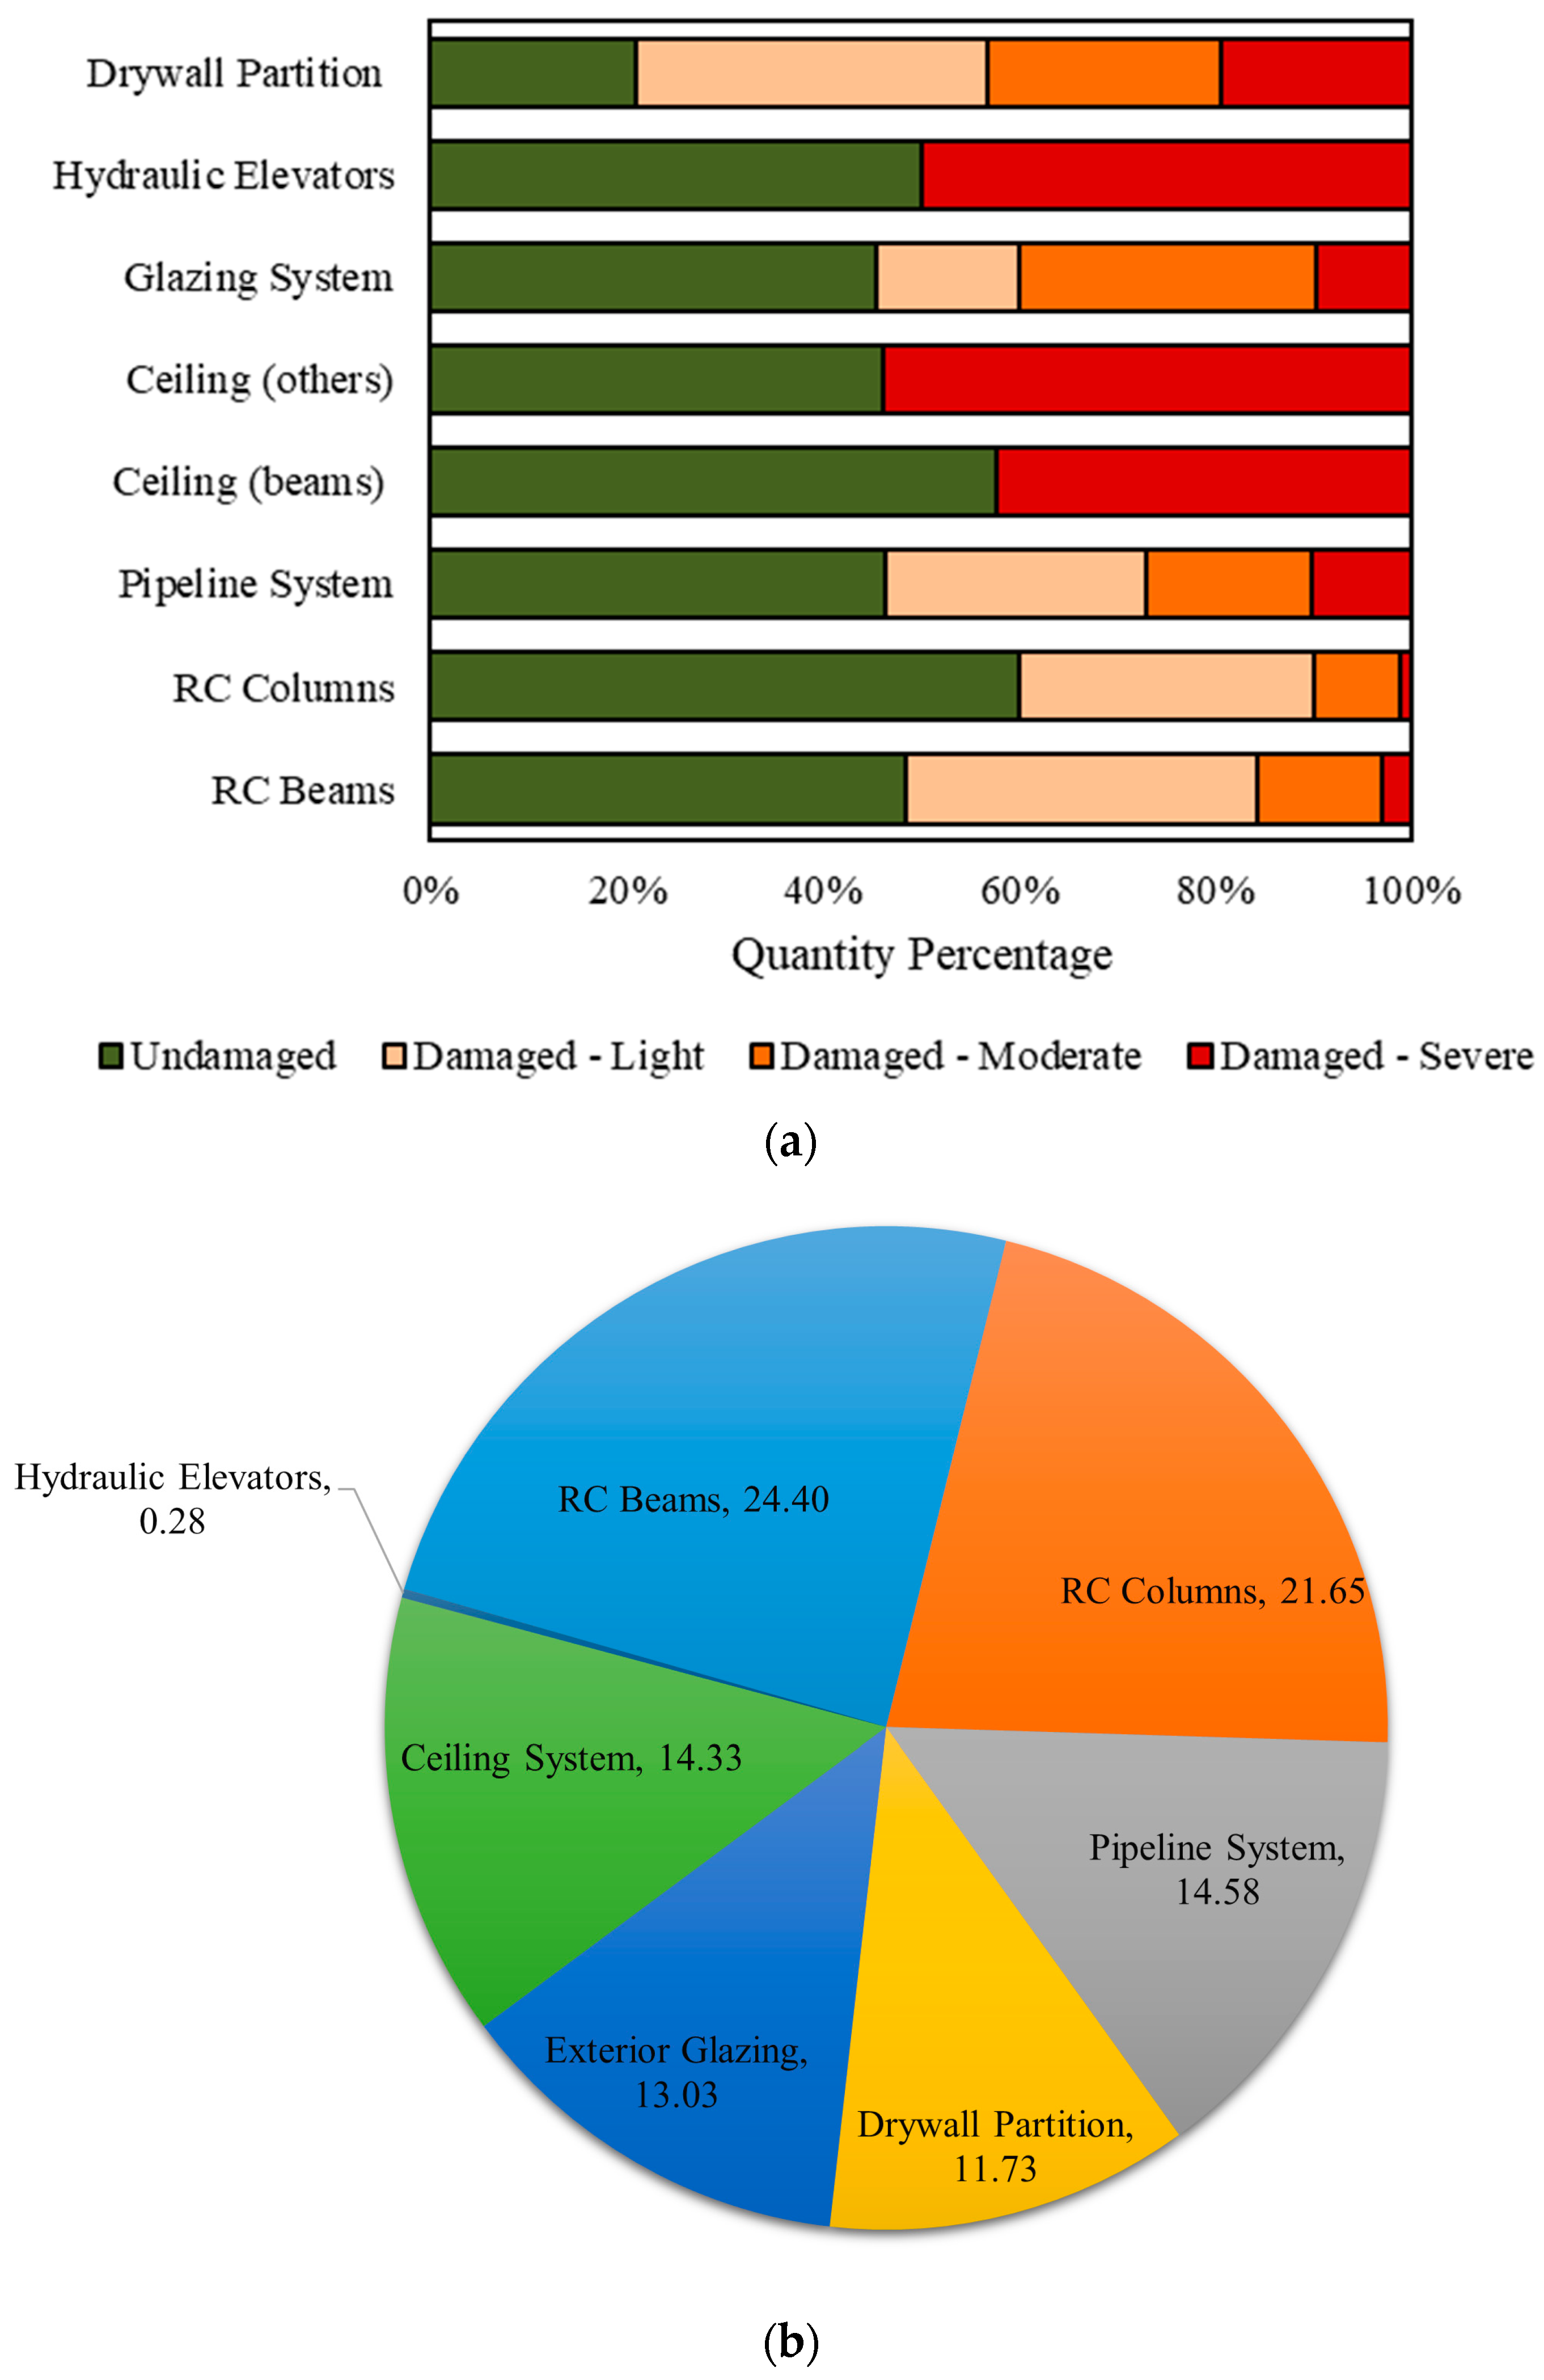
Figure 11 summarizes the percentage of the building damage in four states and component costs (~USD 2.5 total) at respective damage levels under earthquake excitations (i.e., the 1994 Northridge earthquake ground motions). In the case of RC columns and beams, a damage index was applied to establish a unified measure for flexural curvature and shear distortion [
22]. This quantitative damage index enabled the estimation of repair costs for varying levels of damage. Similarly, the Group A nonstructural components (i.e., pipeline systems, ceiling beams, and hydraulic elevator systems) were evaluated for damage based on the rotation in joints and stresses within the supporting framework [
23]. Conversely, the damage states of Group B nonstructural elements were determined from fragility curves at respective damage levels. Repair costs were calculated using the FEMA methodology [
24], which incorporates the dispersion and uncertainty of the unit repair cost. Initial costs were sourced from the literature and adjusted to accommodate inflationary factors. As seen in
Figure 11a, more than 50% of the non-beam supported ceilings and hydraulic elevators experience severe damage. Note that the ceiling (others) and ceiling (beam section) in
Figure 11a are combined and presented as a single category (ceiling system) in
Figure 11b. RC beams and columns constitute 46.15% of repair costs associated with the damage.
4.6. Fifth DODT: Energy Harvesting Efficiency
Incoming solar radiation (insolation), with a continual input of 170 billion megawatts to the Earth, is the primary driver for our planet’s physical and biological processes. Understanding of the insolation at local locations is desirable for designing energy-efficient buildings, sustainable landscapes, and renewable energy systems. On a global scale, the latitudinal gradients of solar radiation caused by the geometry of Earth’s rotation and revolution around the sun are well known. On the local scale, topography is the major factor modifying the distribution of insolation. Variability in elevation, surface orientation (slope and aspect), and shadows cast by topographic features create strong local gradients of insolation [
25]. This leads to high spatial and temporal heterogeneity in local energy, which determines the possible solar radiation to be received and harnessed for the built environment and microenvironmental factors such as soil moisture, and light available for photosynthesis. The DSM processed from LiDAR provides high-resolution topographical information of the campus including the slope and aspect of the building rooftops.
The total solar radiation on the Earth surface is composed of three parts: direct, diffuse, and reflected. Direct radiation reaches the surface in a straight line from the sun without obstruction. Diffuse radiation scatters due to atmospheric elements such as clouds and dust. Reflected radiation bounces off surface features. Unless the ground is covered by heavy snow, the reflected radiation from the ground is negligible. Consequently, total solar radiation is often considered as the sum of direct and diffuse radiation. In this study, an analysis tool based on the algorithms in [
26] is utilized to compute the overall solar radiation across individual rooftops on the campus.
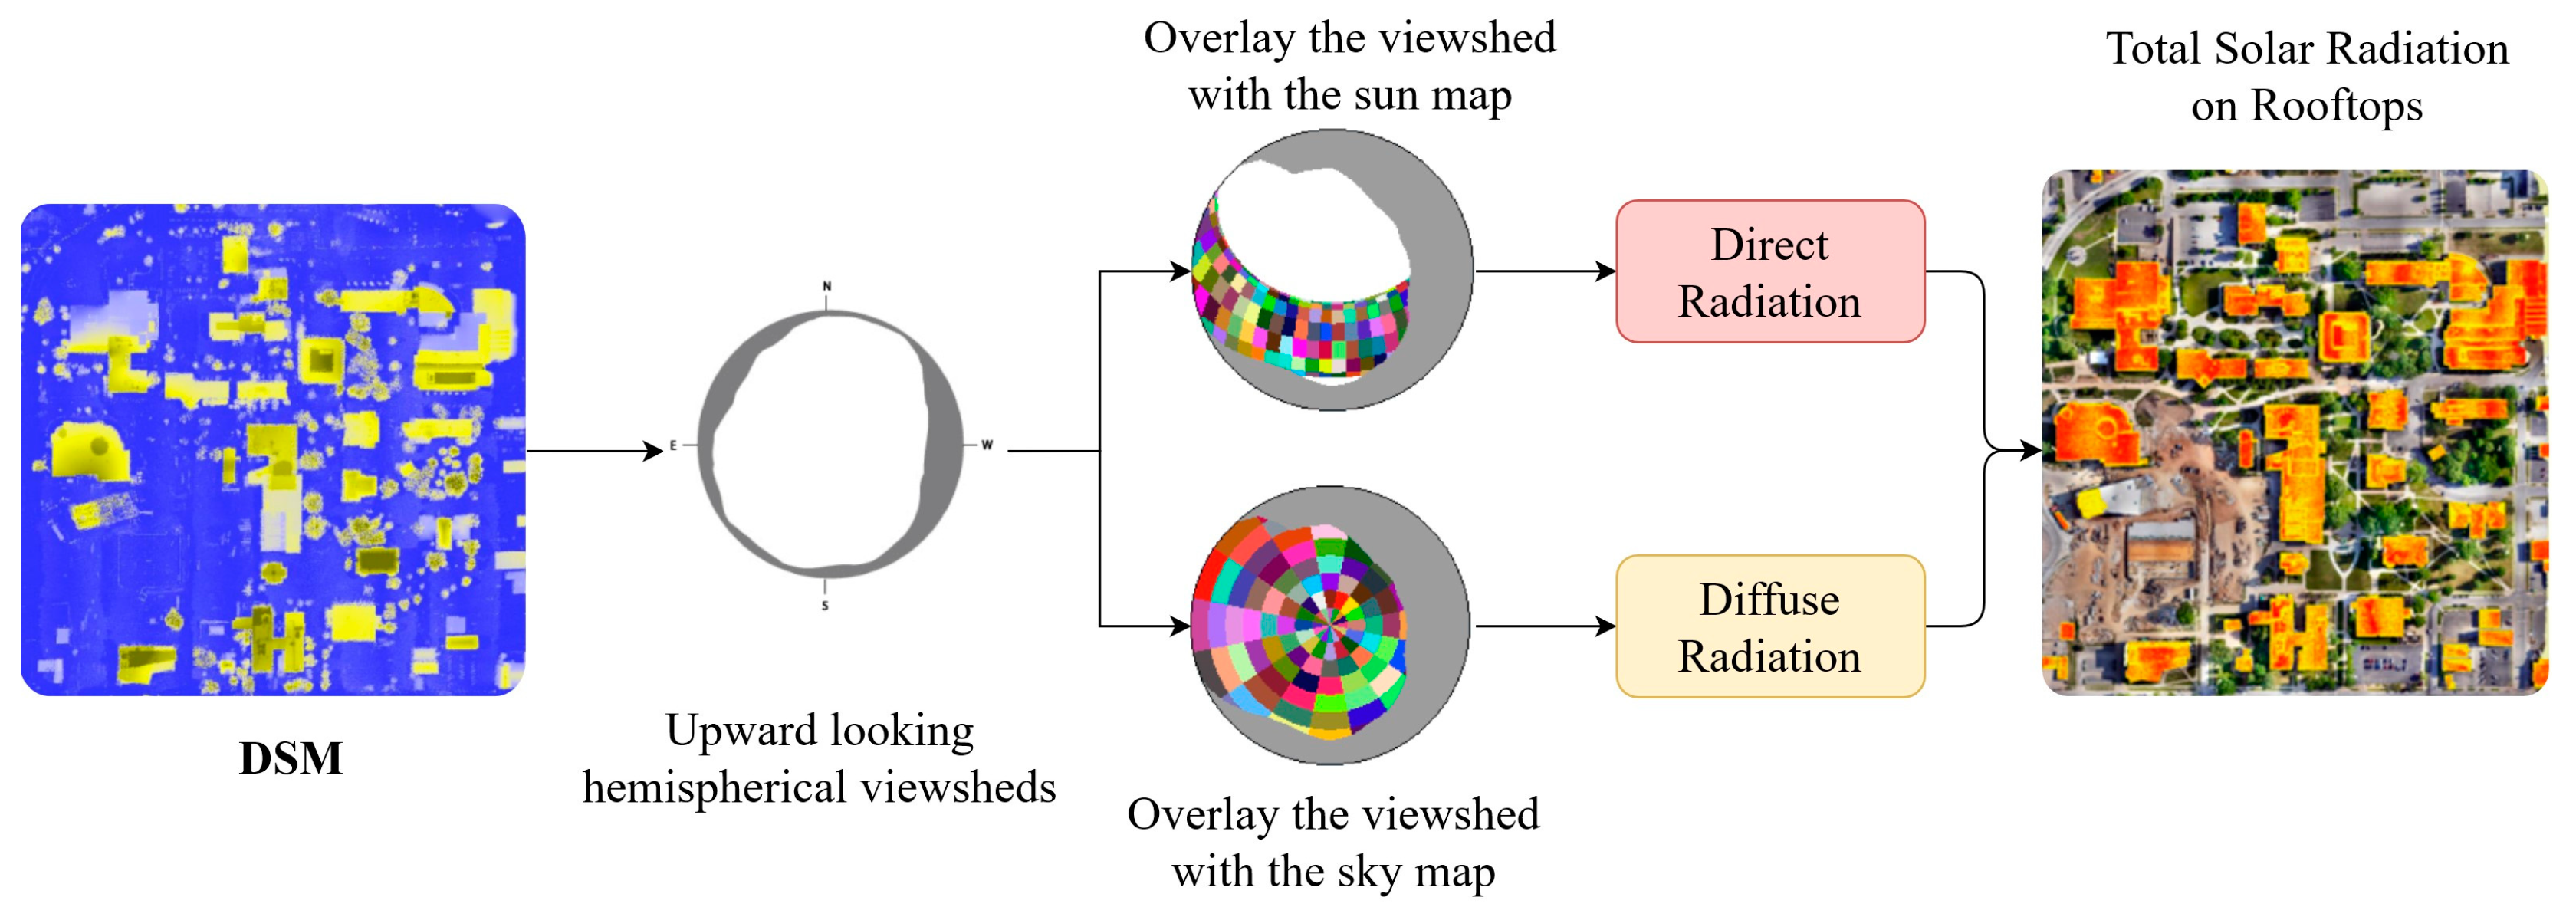
Figure 12 illustrates the process of insolation calculation. The viewshed indicates, through a search in various directions, the visible or concealed areas of the sky due to topography or nearby structures, when observed from a specific point. Upward-facing hemispherical viewsheds are computed for each cell in the input DSM. A sun map is a raster representation that depicts the sun’s apparent path as it changes throughout the hours of the day and days of the year. On the other hand, a sky map portrays a hemispherical view of the entire sky divided into distinct sky sectors. Overlaying the viewshed with the sun map and the sky map provides direct and diffuse radiations, respectively. The combined solar radiation, representing the total radiation received by the campus rooftops (depicted in
Figure 12), is instrumental in estimating solar energy production and determining the optimal placement of solar panels.
4.7. Sixth DODT: Environmental Planning for Flood Zone Susceptibility
A crucial component in the accurate development of a flood model is a high-resolution DEM, which represents the Earth’s topographic surface. This DEM is vital as it governs the direction and speed of water flow [
27].
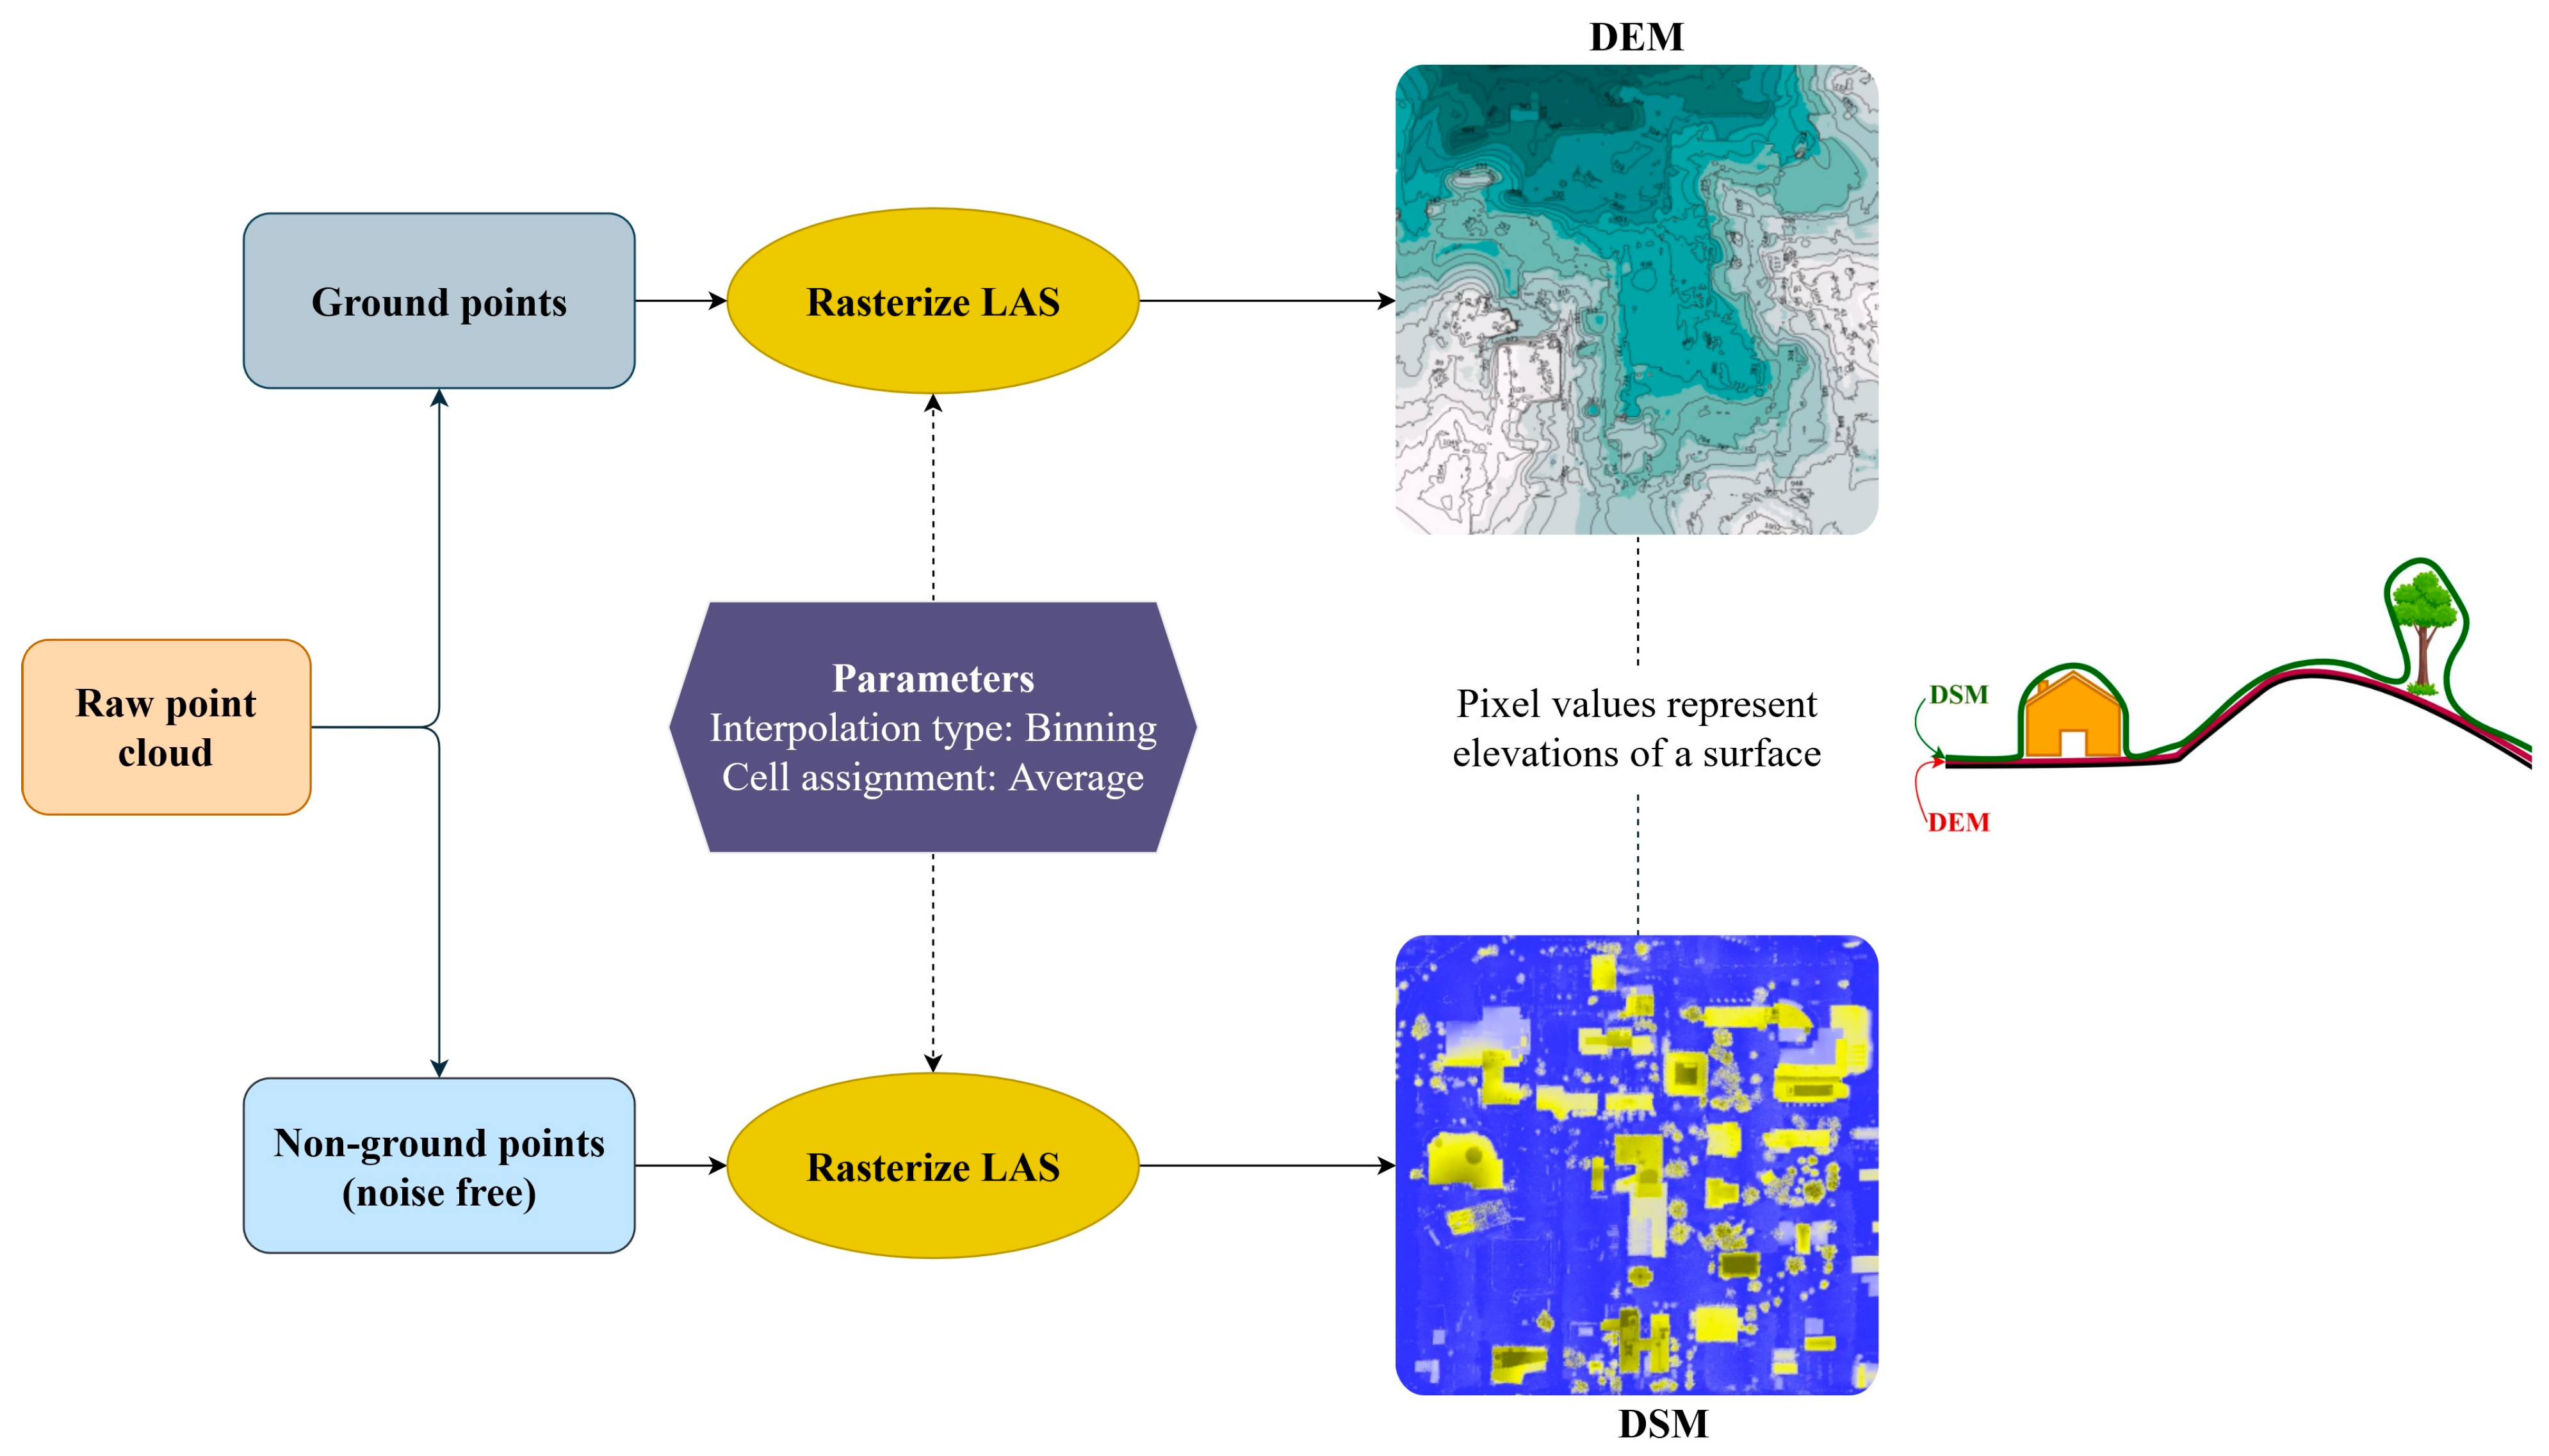
Figure 13 demonstrates the process of generating both the DEM and DSM, which encompass elevations of the Earth’s surface, including both natural terrain and man-made features above the ground. The high-resolution point cloud, obtained from a LiDAR scanner (VLP-32C) with a resolution of 0.04 m, underwent an initial classification into ground and non-ground points using a classifier algorithm in the ArcGIS Pro environment. Subsequently, the non-ground points were filtered to remove any noise. To convert these classified points into a raster format, the binning interpolation method was employed. This method assigned raster values based on the chosen cell assignment type, which, in this case, was set to ‘average’. Consequently, the rasterized ground points constitute the DEM, while the rasterized non-ground points form the DSM.
By integrating data of the campus high-resolution DEM, hyperspectral imagery, and the drainage pipe network, one can significantly enhance the effectiveness of flood vulnerability assessment. The DEM serves as a fundamental representation of the campus’s terrain, offering insights into elevation and contours. This facilitates the identification of flood-prone low grounds. Additionally, it aids in understanding the natural flow of water during flood events. The hyperspectral data (collected for seventh DODT) provides a detailed account of ground features, distinguishing between pervious and impervious surfaces. This distinction is crucial for identifying areas vulnerable to saturation and runoff during flooding. Moreover, comprehending the location and layout of the pipe network is essential for evaluating its influence on floodwater movement and pinpointing potential obstructions during flooding events. This holistic comprehension empowers the development and implementation of effective flood risk reduction and mitigation strategies. These strategies may include improvements to drainage systems or alterations in landscaping, specifically tailored to address the existing features and expansions of the campus, ensuring a proactive approach to flood management.
4.8. Seventh DODT: Master Planning for Green Space Development
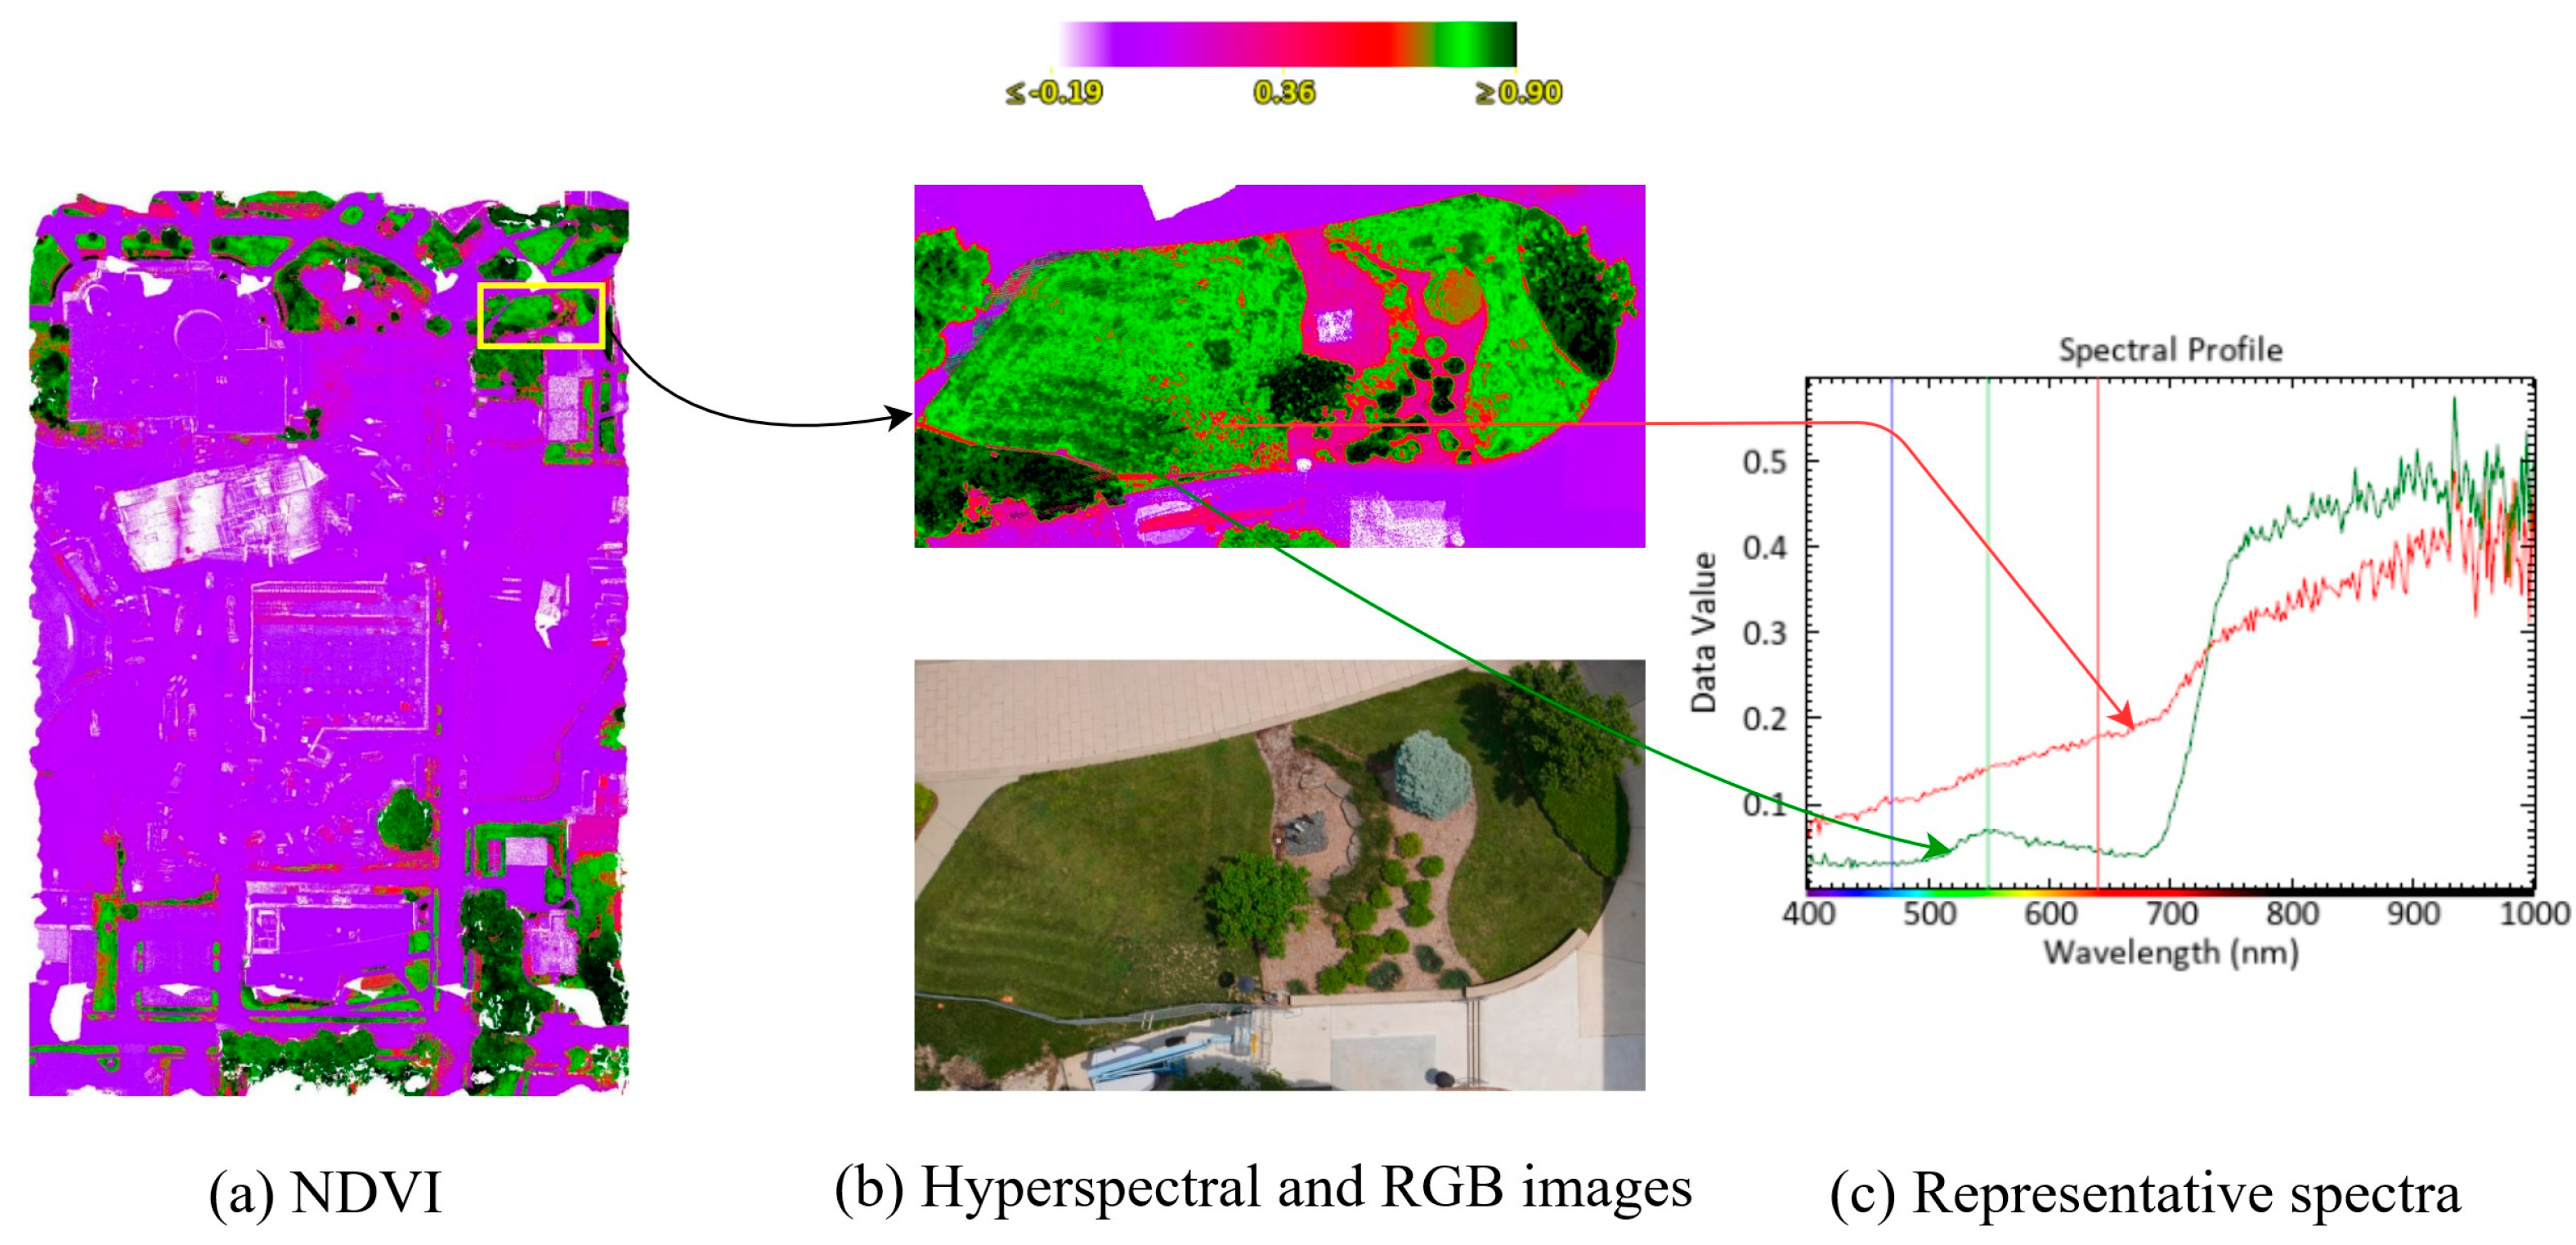
Green spaces offer critical ecosystem services that are closely tied to human wellbeing. Having monitoring systems with a high temporal resolution is essential to monitor the health of vegetated areas and ensure the effectiveness of green infrastructure. Several sensing approaches have been established to assess vegetation health, and hyperspectral sensors are one of these methods. These sensors measure the radiative characteristics of plants across numerous narrow bands continuously, providing extensive spectral data. This richness in spectral information enhances the ability to detect subtle physiological alterations in vegetation. The assessment of vegetation health on the campus utilized a high-resolution hyperspectral camera (Headwall: Nano-Hyperspec
® VNIR) with a wavelength range spanning from 399 nm to 1000 nm, segmented into 273 bands, and a spectral resolution of 2.21 nm. Various Vegetation Indices (VIs) were derived by combining surface reflectance at different wavelengths to evaluate specific vegetation properties. Among these, the Normalized Difference Vegetation Index (NDVI) was prominently utilized for vegetation health assessment [
28]. The NDVI is calculated by combining the NIR-band with the red-band. NDVI values range from −1 to 1, where healthy or dense vegetation predominantly reflects NIR light and absorbs a significant portion of visible light. On the contrary, unhealthy or sparse vegetation reflects a substantial portion of visible light instead of absorbing it.
Figure 14a shows the NDVI map and
Figure 14b presents a close view of a small area clearly indicating spotted red regions due to grass stress as confirmed by comparing with the RGB image. Indeed, hyperspectral imaging can reveal early-stage stress that is imperceptible to the human eye. The spectra in the stressed and healthy grass areas are quite different, as shown in
Figure 14c.
Thermographic methods can also be employed to detect stress in plants by primarily leveraging alterations in land surface temperature (LST), which serve as a significant indicator of stress. For instance, when plants are stressed, small openings called stomata on their leaves, which regulate water loss through transpiration, may close, leading to an elevation in the plant’s temperature. The thermographic data initially used for evaluating the condition of building envelopes (second DODT) can also be repurposed, focusing specifically on vegetation, to enable early detection and mitigation of thermal-related stress. Additionally, LST serves as a typical indicator for evaluating the micro thermal environment. UAV mounted high-resolution infrared cameras can capture thermal data and convert them into LSTs on a block scale, offering high temporal and spatial resolution [
29]. Understanding LSTs ultimately helps in taking action to mitigate the heat island effect on the campus. This includes implementing various strategies such as increasing greenery and incorporating water bodies to reduce heat absorption and retention in campus areas, ultimately resulting in lowered temperatures and improved overall campus climate resilience.
In another perspective, solar radiation emerges as a vital ecological determinant affecting the growth, maturation, and reproduction of plants. In settings with dense urban structures, green spaces can experience notable fluctuations in solar radiation over small areas. The most effective method for choosing suitable plants is centered on the principle of carefully situating trees and plants according to specific site conditions, often summarized as “matching the plant to the site”. Achieving this goal necessitates an accurate evaluation of solar radiation within the green area. Consequently, the computed solar radiation for the fifth DODT can be leveraged by concentrating solely on the solar radiation within the green space.
4.9. Eighth DODT: Security Protocol Development
The 3D digital campus as shown in
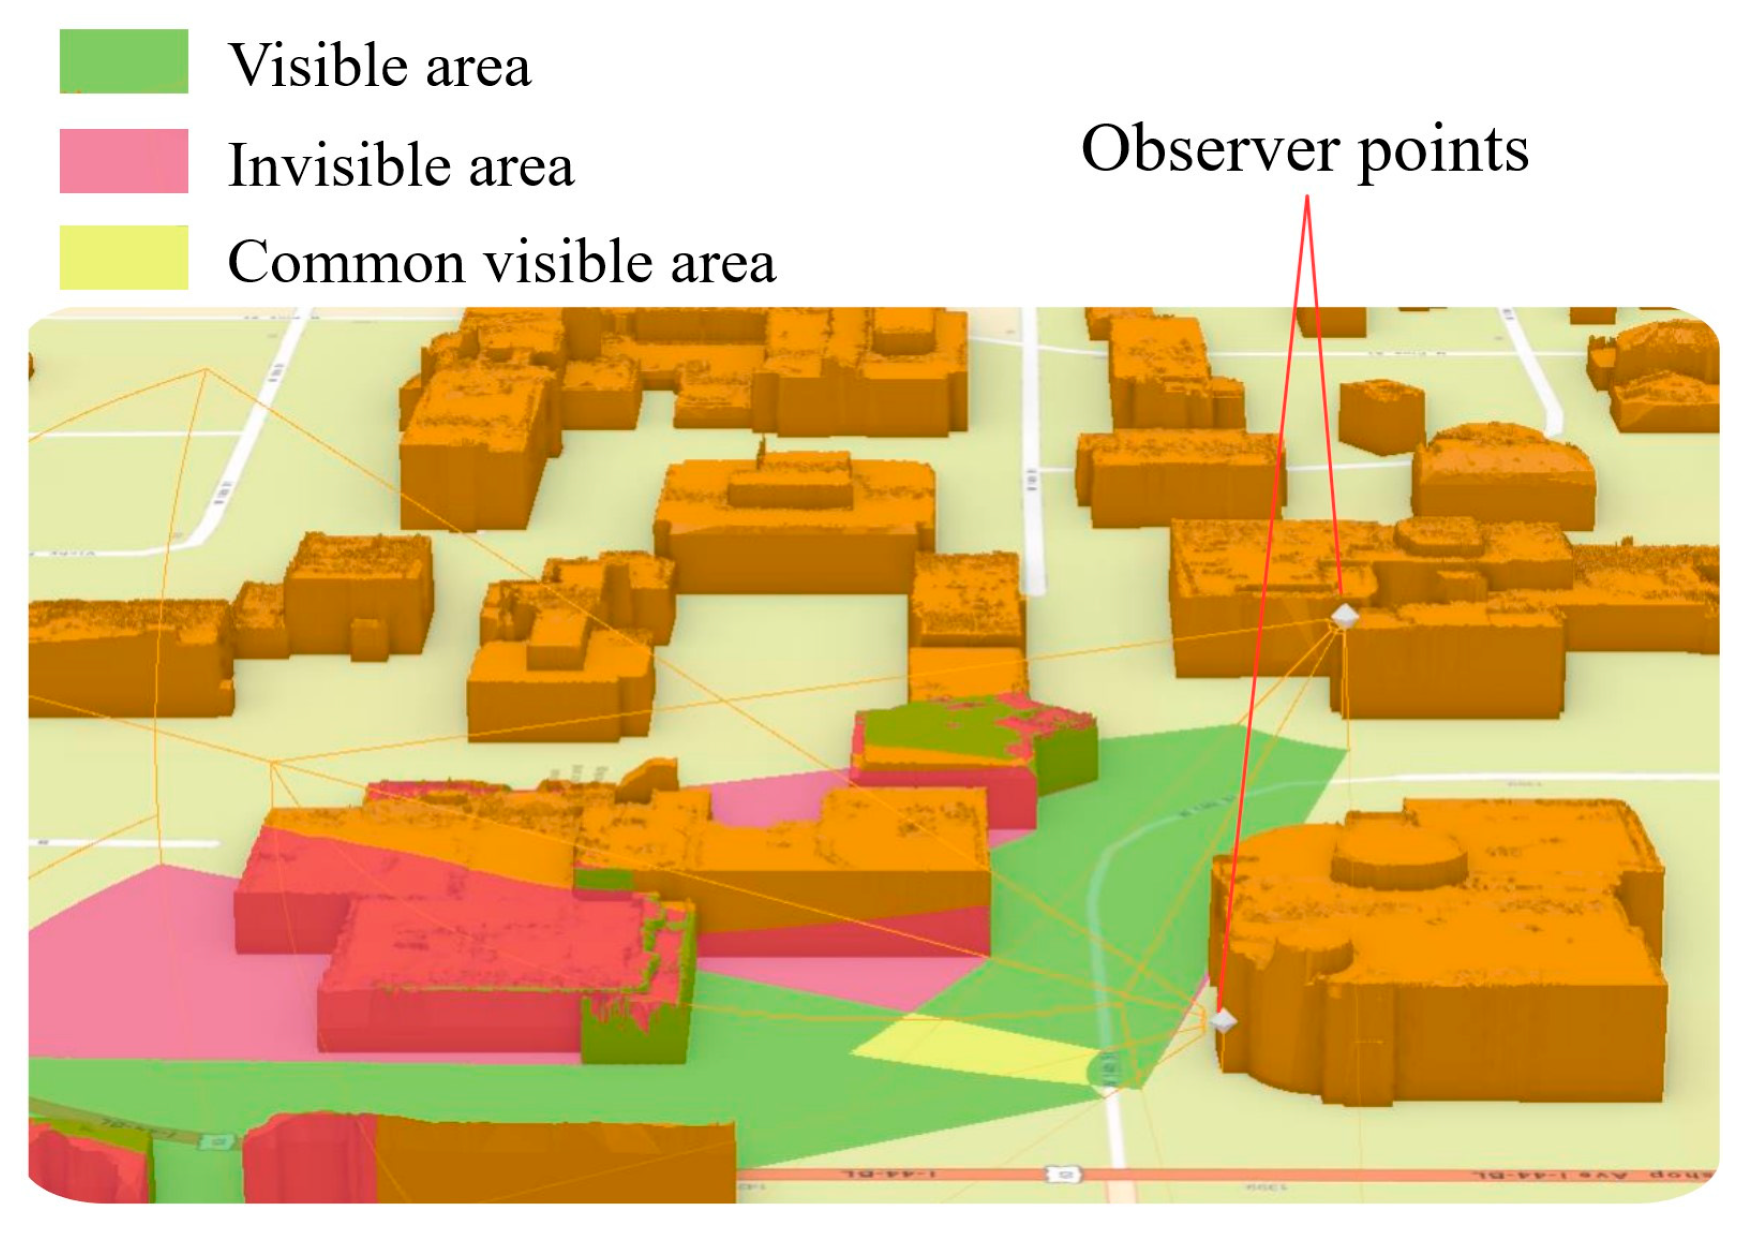
Figure 6 allows a quick determination of the best locations for security camera placement to develop an optimal security protocol. For example,
Figure 15 illustrates two observer points where visible and invisible areas can be determined individually or their common visible area is identified as vantage points. Conducting such an analysis helps guarantee that vital landmarks, signages, and directions are visible from pivotal spots, thereby enhancing the overall user experience for both the campus community and visitors. This visibility assessment not only supports the specific DODT being discussed but also contributes to the success of the fifth DODT and seventh DODT. In the context of fifth DODT, grasping visibility patterns within the digital campus twin allows for the strategic placement of buildings to optimize exposure to sunlight and airflow, thus enhancing energy efficiency and creating a superior indoor environment. By scrutinizing the shadows cast by the buildings, it becomes possible to design green spaces on campus that capitalize on sunlight exposure for plants, thus optimizing their growth and overall health. Consequently, the campus environment achieves a harmonious blend of aesthetics and functionality, indirectly contributing to the realization of the seventh DODT. Essentially, the 3D building models of the campus emerge as an invaluable tool for both current campus planning and future expansion endeavors, providing a comprehensive understanding of spatial considerations and enhancing decision-making processes.
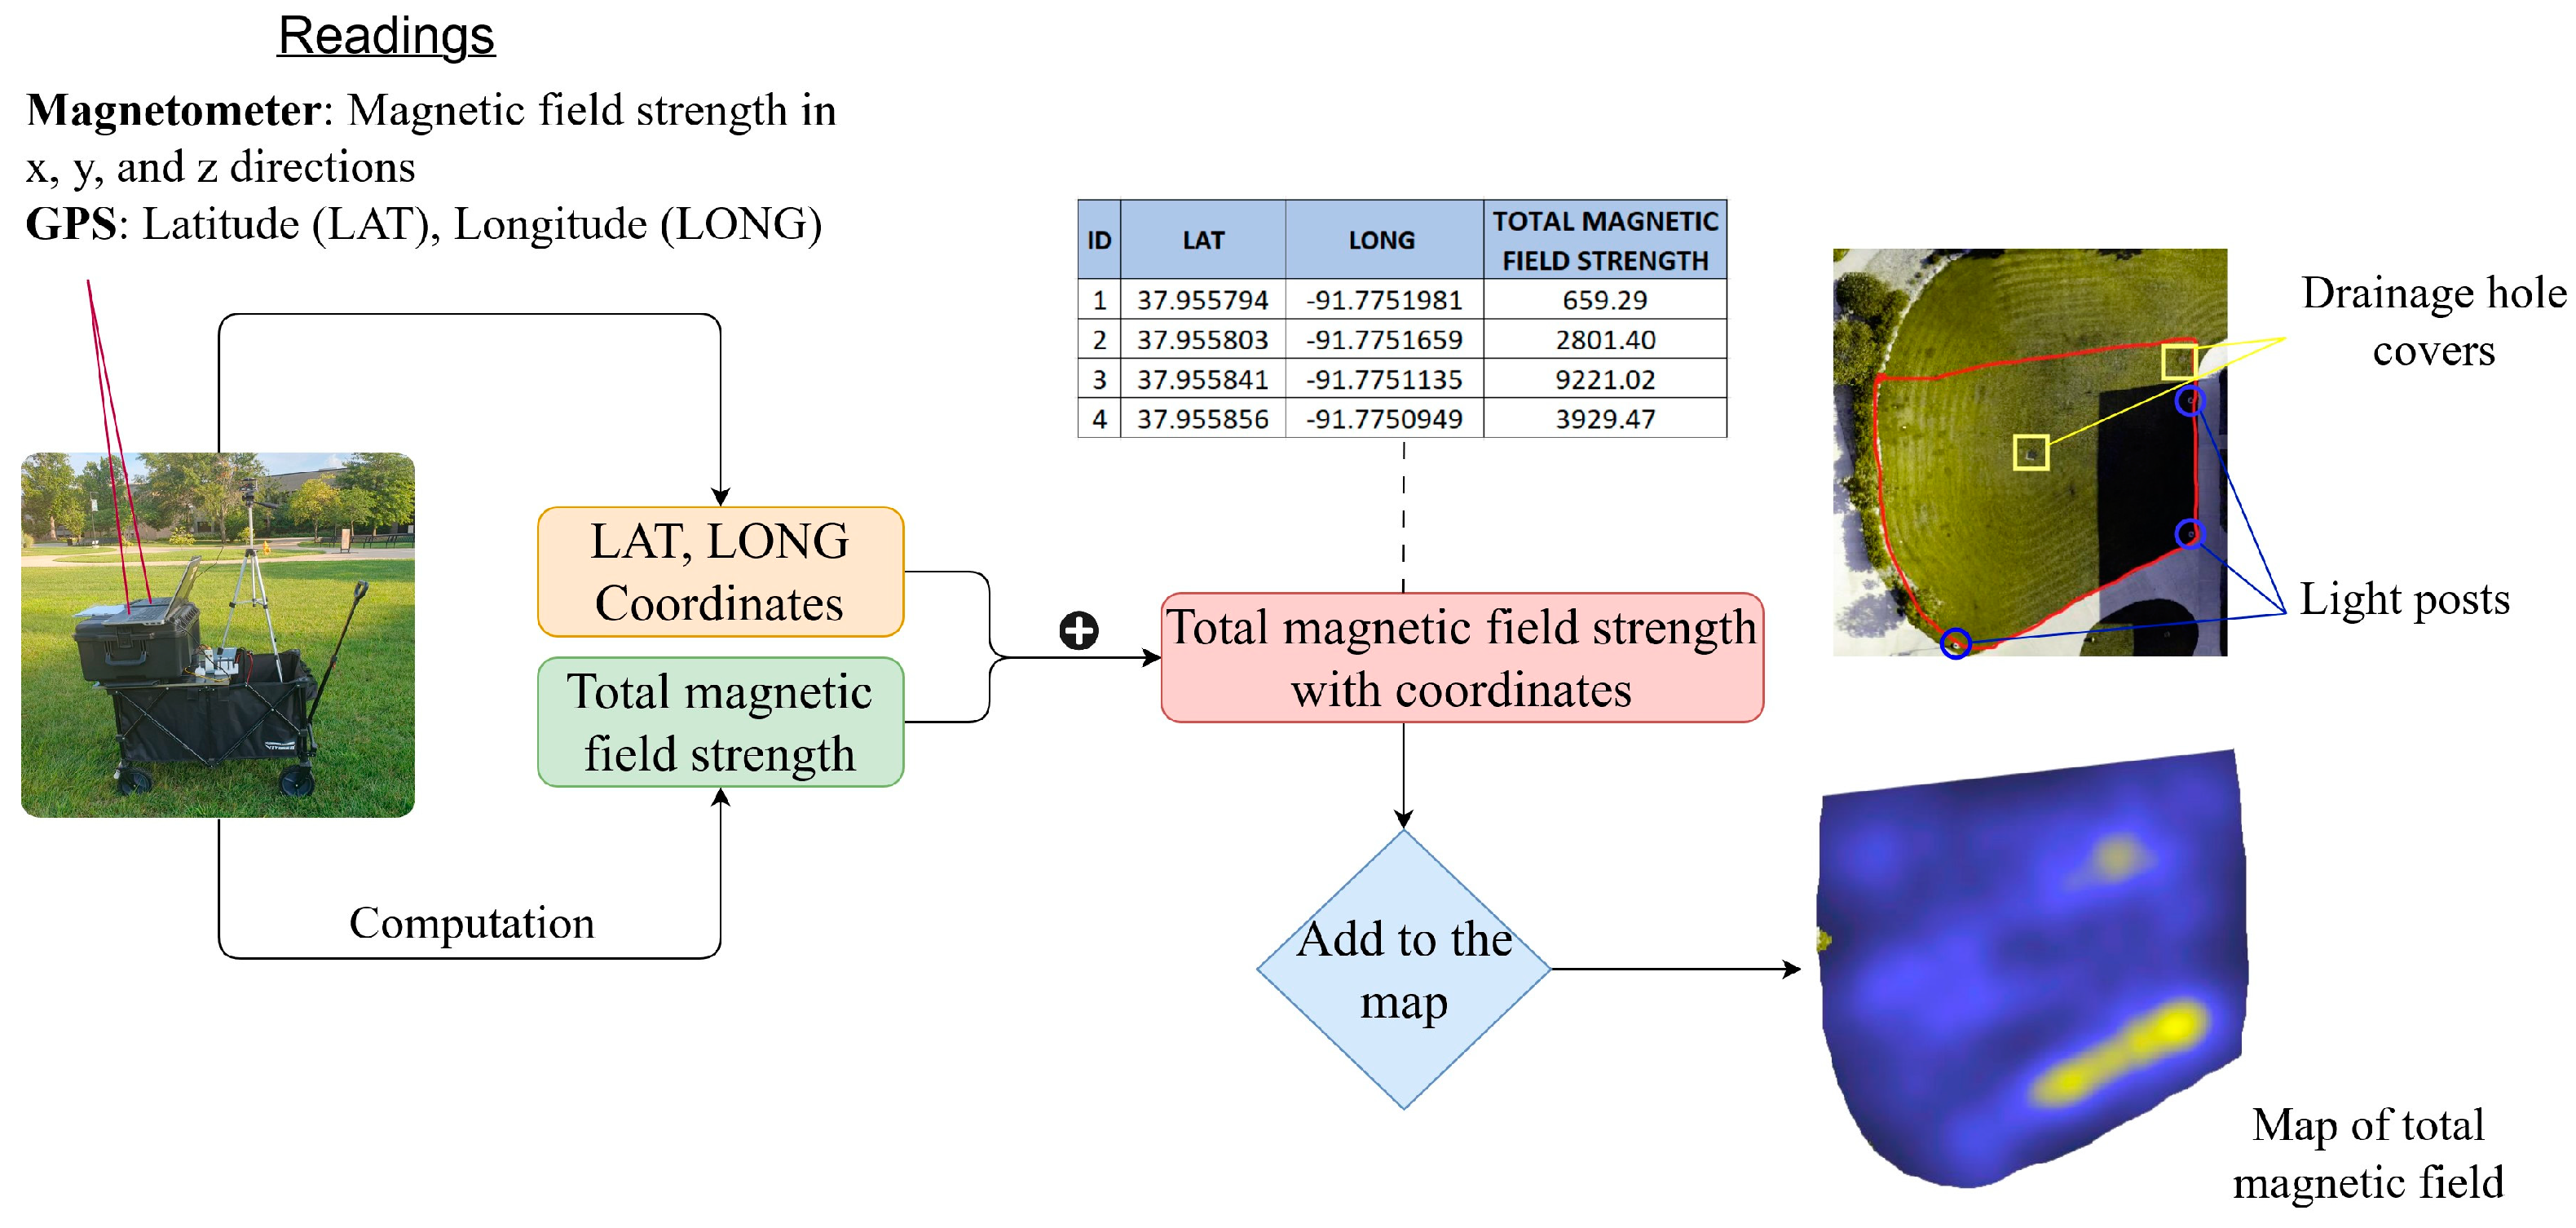
A three-axis magnetometer was installed on a ground robot, as shown in
Figure 16, or on an octocopter [
30] to survey a nearby magnetic field. When surveyed using a ground robot, the process of creating a total magnetic field map near the ground surface is illustrated in
Figure 16. The map is useful for exploring and locating underground utility lines and infrastructure such as metal pipes for flood vulnerability studies (sixth DODT). Additionally, it proves beneficial for construction projects, enabling the prevention of inadvertent damage during excavation activities. When surveyed using a drone [
30], the ambient magnetic field in space can be used to ensure the navigation and guidance safety of aerial vehicles by understanding the minimum interference of the magnetic field.
As evidenced by practical demonstrations involving eight DODTs at the campus (regional) level, a single DT has the capacity to fulfill multiple DODTs based on the targeted values for exploration. All the presented DODTs play a vital role in tackling various issues within the campus environment. However, the significance attributed to each may fluctuate depending on the priorities of stakeholders pertaining to cost-efficiency, safety, aesthetics, or other customized factors relevant to the intended use of the built environment. This diversity introduces complexity in reaching consensus. Therefore, the proposed DODT concept suggests a revolutionary simplification of metrics that solely assesses the value of a DT by considering the number of digital models and feature mappings it encompasses, thereby addressing diverse social needs without bias towards any specific aspect.
The majority of examples presented in this work illustrate the campus-scale DT operating at the asset level within a hierarchical structure of modulated DTs. This modulated arrangement enables interactive data flow between physical and digital twins, incorporating the insightful inputs of domain experts in different disciplines to establish an integrative, closed-loop, digital–physical system. As detailed in
Section 2, the proposed DT framework supports the real-time updating of digital models through in situ sensing. The workflow depicted in
Figure 7 demonstrates that, while eight DODTs are showcased, this number is not the maximum attainable, and the integration of new sensors will allow the creation of further DODTs. We are actively developing novel DODTs that leverage in situ sensors to generate added value at both system and asset levels. This endeavor promotes the creation of new digital models and facilitates bidirectional data transmission between physical and digital twins through autonomous closed-loop operation without human intervention after the digital models have been fully developed with domain experts’ knowledge. Ultimately, this progression will result in a regional-level DT encompassing an expanded array of DODTs, delivering comprehensive value throughout the lifecycle of the campus environment.
5. Concluding Remarks
This position paper outlines an implementable framework for enterprise DTs. In the area of asset lifecycle management, rudimentary database and BIM are, respectively, the first-generation and second-generation of clearinghouse tools with increasing merits in value engineering and as-built information. The proposed DT framework implies the coming of the third-generation tool in asset lifecycle management, which will act as a clearinghouse for structural condition assessment and information on buildings and infrastructure, as well as their affected communities.
This paper extended the concept of DTs to enable a multilayered integration of informational, computational, and learning-based models of buildings and infrastructure to understand their conditions and their impact on surrounding communities during normal operations and emergency responses in the wake of a catastrophic event. The extended DTs can be applied in a wide spectrum of functions in a lifecycle of assets from design through construction to operation to preserve buildings and infrastructure.
The two foundational computation platforms couple information and computation modeling and hybridize instrumentation and computational simulation. They address both spatial and temporal connections within existing infrastructure or between existing and new infrastructure. The spatial connection between structural and nonstructural components integrates the structural safety and nonstructural property loss into a multi-performance-based design, which enables rapid emergency planning as natural or man-made hazards arise, to understand regional and thus community resilience. The temporal connection enables a glimpse into and execution of potential projects and their impacts on community during urban planning.
The DODT allows the value-driven digital duplication of a physical twin at different levels and thus the value proposition of structural health monitoring in broader architectural and engineering practices. The DODT of the example campus-scale DT is at least eight, indicating substantial DT values to addressing campus needs in asset lifecycle management.
The concept and model of multidimensional DTs are still evolving. More and closer collaborations among academia, industry, government, and software sources are required to develop standards and guidelines. For capital DT projects, clear outcomes and end users must be identified to sustain the needed infrastructure and workforce both administratively and financially.
Author Contributions
Conceptualization, G.C. and W.Z.T.; methodology, W.Z.T., I.A. and M.H.A.; software, I.A., W.Z.T. and Z.S.; validation, I.A. and W.Z.T.; formal analysis, I.A., W.Z.T. and M.H.A.; investigation, I.A., W.Z.T., M.H.A. and T.G.M.; resources, G.C.; data curation, Z.S., M.H.A. and S.N.; writing—original draft preparation, G.C., W.Z.T., I.A. and M.H.A.; writing—review and editing, G.C., W.Z.T. and T.G.M.; visualization, W.Z.T.; supervision, G.C.; project administration, G.C.; funding acquisition, G.C. All authors have read and agreed to the published version of the manuscript.
Funding
Financial support to complete this study was provided in part by the University of Missouri System Strategic Investment, by the U.S. Department of Transportation, Office of the Assistant Secretary for Research and Technology (USDOT/OST-R) under Grant No. 69A3551747126 under the auspices of the INSPIRE University Transportation Center, and by the Taylor Geospatial Institute Fellow Program led by St. Louis University. The views, opinions, findings, and conclusions reflected in this publication are solely those of the authors and do not represent the official policy or position of the USDOT or any State or other entity.
Data Availability Statement
Support data will be made available upon request.
Conflicts of Interest
The authors declare no conflicts of interest.
References
- Gelernter, D.H. Mirror Worlds: Or the Day Software Puts the Universe in a Shoebox—How It Will Happen and What It Will Mean; Oxford University Press: Oxford, UK, 1991; ISBN 978-0195079067. [Google Scholar]
- Grieves, M. Completing the cycle: Using PLM information in the sales and service functions. In Proceedings of the Society of Manufacturing Engineering (SME) Management Forum, Troy, MI, USA, 31 October 2002. [Google Scholar]
- Piascik, B.; Vickers, J.; Lowry, D.; Scotti, S.; Stewart, J.; Calomino, A. Materials, Structures, Mechanical Systems, and Manufacturing Road Map: Technology Area 12; NASA: Washington, DC, USA, 2012. [Google Scholar]
- Grieves, M.; Vickers, J. Digital twin: Mitigating unpredictable, undesirable emergent behavior in complex systems. In Transdisciplinary Perspectives on Complex Systems; Kahlen, F.J., Flumerfelt, S., Alves, A., Eds.; Springer International Publishing: Cham, Switzerland, 2017; pp. 85–113. [Google Scholar]
- Schleich, B.; Anwer, N.; Mathieu, L.; Wartzack, S. Shaping the digital twin for design and production engineering. CIRP Annu. 2017, 66, 141–144. [Google Scholar] [CrossRef]
- Mohammadi, N.; Taylor, J.E. Smart city digital twins. In Proceedings of the 2017 IEEE Symposium Series on Computational Intelligence (SSCI), Honolulu, HI, USA, 27 November–1 December 2017. [Google Scholar]
- Batty, M. Digital twins. Environ. Plan. B Urban Anal. City Sci. 2018, 45, 817–820. [Google Scholar] [CrossRef]
- NIC. Data for the Public Good; Final Report; National Infrastructure Commission: London, UK, 14 December 2017. [Google Scholar]
- Lu, Q.C.; Xie, X.; Parlikad, A.K.; Schooling, J.; Pitt, M. Digital Twins in the Built Environment: Fundamentals, Principles, and Applications; Institution of Civil Engineers (ICE), ICE Publishing: London, UK, 2022. [Google Scholar]
- Farsi, M.; Daneshkhah, A.; Hosseinian-Far, A.; Jahankhani, H. Digital Twin Technologies and Smart Cities; Springer: Cham, Switzerland, 2020. [Google Scholar]
- Farhat, C. Data-driven digital twinning for structural health monitoring. In Proceedings of the 14th International Workshop on Structural Health Monitoring (Keynote Presentation), Stanford, CA, USA, 12–14 September 2023. [Google Scholar]
- Pan, Y.; Zhang, L. A BIM-data mining integrated digital twin framework for advanced project management. Autom. Constr. 2021, 124, 103564. [Google Scholar] [CrossRef]
- Chen, G.; Alomari, I.; Shi, Z.; Taffese, W.; Mondal, T.; Runji, J.; Afsharmovahed, M. Computation-enabled digital twin in the built environment. In Proceedings of the 14th International Workshop on Structural Health Monitoring (Keynote Presentation), Stanford, CA, USA, 12–14 September 2023. [Google Scholar]
- Barricelli, B.R.; Casiraghi, E.; Fogli, D. A survey on digital twin: Definitions, characteristics, applications, and design implications. IEEE Access 2019, 7, 167653–167671. [Google Scholar] [CrossRef]
- Delgado, J.M.D.; Oyedele, L. Digital twins for the built environment: Learning from conceptual and process models in manufacturing. Adv. Eng. Inform. 2021, 49, 101332. [Google Scholar] [CrossRef]
- Chatzi, E. Learning by monitoring: Twinning and model discovery for engineered. In Proceedings of the 14th International Workshop on Structural Health Monitoring (Keynote Presentation), Stanford, CA, USA, 12–14 September 2023. [Google Scholar]
- Grieves, M. Virtually intelligent product systems: Digital and physical twins. In Complex Systems Engineering: Theory and Practice; Flumerfelt, S., Schwartz, K.G., Mavris, D., Briceno, S., Eds.; American Institute of Aeronautics and Astronautics: Washington, DC, USA, 2019; pp. 175–200. [Google Scholar]
- Haselton, C.B.; Goulet, C.A.; Mitrani-Reiser, J.; Beck, J.L.; Deierlein, G.G.; Porter, K.A.; Stewart, J.P.; Taciroglu, E. An Assessment to Benchmark the Seismic Performance of a Code-Conforming Reinforced Concrete Moment-Frame Building; PEER Report 2007/12; Pacific Earthquake Engineering Research Center: Berkeley, CA, USA, 2008. [Google Scholar]
- Chen, G.D.; Huang, Y. Real-time monitoring and assessment of large-scale infrastructure with statistically correlated, hybrid instrumented and computational simulations. In Proceedings of the 6th International Conference on Structural Health Monitoring of Intelligent Infrastructure, Hong Kong, China, 9–11 December 2013. [Google Scholar]
- Zhang, C.; Karim, M.; Qin, R. A multitask deep learning model for parsing bridge elements and segmenting defect in bridge inspection images. Transp. Res. Rec. J. Transp. Res. Board 2023, 2677, 693–704. [Google Scholar] [CrossRef]
- Kirimtat, A.; Krejcar, O. A review of infrared thermography for the investigation of building envelopes: Advances and prospects. Energy Build. 2018, 176, 390–406. [Google Scholar] [CrossRef]
- Mergos, P.E.; Kappos, A.J. Seismic damage analysis including inelastic shear–flexure interaction. Bull. Earthq. Eng. 2010, 8, 27–46. [Google Scholar] [CrossRef]
- Soroushian, S.; Zaghi, A.E.; Maragakis, M.; Echevarria, A.; Tian, Y.; Filiatrault, A. Analytical seismic fragility analyses of fire sprinkler piping systems with threaded joints. Earthq. Spectra 2015, 31, 1125–1155. [Google Scholar] [CrossRef]
- FEMA. Seismic Performance Assessment of Buildings; Federal Emergency Management Agency; National Earthquake Hazards Reduction Program and Applied Technology Council: Redwood City, CA, USA, 2018.
- Hofierka, J. Topographic Solar Radiation Modeling for Environmental Applications. In Encyclopedia of Sustainability Science and Technology; Springer: Cham, Switzerland, 2012; pp. 10621–10636. [Google Scholar]
- Fu, P.; Rich, P.M. A geometric solar radiation model with applications in agriculture and forestry. Comput. Electron. Agric. 2002, 37, 25–35. [Google Scholar] [CrossRef]
- Li, B.; Hou, J.; Li, D.; Yang, D.; Han, H.; Bi, X.; Wang, X.; Hinkelmann, R.; Xia, J. Application of LiDAR UAV for high-resolution flood modelling. Water Resour. Manag. 2021, 35, 1433–1447. [Google Scholar] [CrossRef]
- Jimenez, R.B.; Lane, K.J.; Hutyra, L.R.; Fabian, M.P. Spatial resolution of normalized difference vegetation index and greenness exposure misclassification in an urban cohort. J. Expo. Sci. Environ. Epidemiol. 2022, 32, 213–222. [Google Scholar] [CrossRef] [PubMed]
- Wu, Y.; Shan, Y.; Lai, Y.; Zhou, S. Method of calculating land surface temperatures based on the low-altitude UAV thermal infrared remote sensing data and the near-ground meteorological data. Sustain. Cities Soc. 2022, 78, 103615. [Google Scholar] [CrossRef]
- Zhang, H.; Li, Z.; Chen, G.; Reven, A.; Scharfenberg, B.; Ou, J. UAV-based smart rock localization for bridge scour monitoring. J. Civ. Struct. Health Monit. 2021, 11, 301–313. [Google Scholar] [CrossRef]
| Disclaimer/Publisher’s Note: The statements, opinions and data contained in all publications are solely those of the individual author(s) and contributor(s) and not of MDPI and/or the editor(s). MDPI and/or the editor(s) disclaim responsibility for any injury to people or property resulting from any ideas, methods, instructions or products referred to in the content. |
© 2024 by the authors. Licensee MDPI, Basel, Switzerland. This article is an open access article distributed under the terms and conditions of the Creative Commons Attribution (CC BY) license (https://creativecommons.org/licenses/by/4.0/).

 ,
, 


