
Enhancing Smart Cities through Third-Party Logistics: Predicting Delivery Intensity


Abstract
:1. Introduction
2. Theoretical Background
2.1. Last-Mile Delivery in the Context of the Smart City Concept
- catering supplies;
- the speed of delivery of individual courier consignments;
- accessibility to goods and services.
- From an economic point of view—efficient management of the delivery procedure by planning the most optimal route while focusing on ensuring cost efficiency and on-time delivery;
- From an environmental point of view—minimising emissions to the lowest possible level, including CO2, noise and congestion;
- From a societal point of view—ensuring the highest quality of supply to customers with commensurate consideration of its impact on human health and safety.
2.2. Smart City Technologies for Last-Mile Delivery Management
- a reduction in investment in transport infrastructure with similar effects of improved system efficiency;
- reduced carbon emissions by making the traffic flow smoother;
- reduced travel times, both for passengers and goods;
- a reduced number of traffic accidents, which is one of the causes of congestion in the city;
- the increased capacity of existing sections of the transport network.
- Advanced Traveller Information System;
- Intelligent Traffic Signal System (I-SIG);
- Signal Priority (transit, freight);
- Mobile Accessible Pedestrian Signal System (PED-SIG);
- Emergency Vehicle Preemption (PREEMPT);
- Dynamic Speed Harmonisation (SPD-HARM);
- Incident Scene Work Zone Alerts for Drivers and Workers (INC-ZONE);
- Dynamic Transit Operations (T-DISP);
- Dynamic Ridesharing (D-RIDE);
- Freight-Specific Dynamic Travel Planning and Performance—Drayage Optimisation.
2.3. 3PL in the Context of Smart City
2.4. Predictive and Coordinating Capacities of 3PL
3. Methods
3.1. Description of Case Study
3.2. Description of the Data
- To Warsaw: 27,691 pallets (in terms of full pallet spaces) and 174,600 parcels;
- To Wroclaw: 11,328 pallets (in terms of full pallet spaces) and 84,898 parcels.
3.3. Description of the Predictive Algorithm
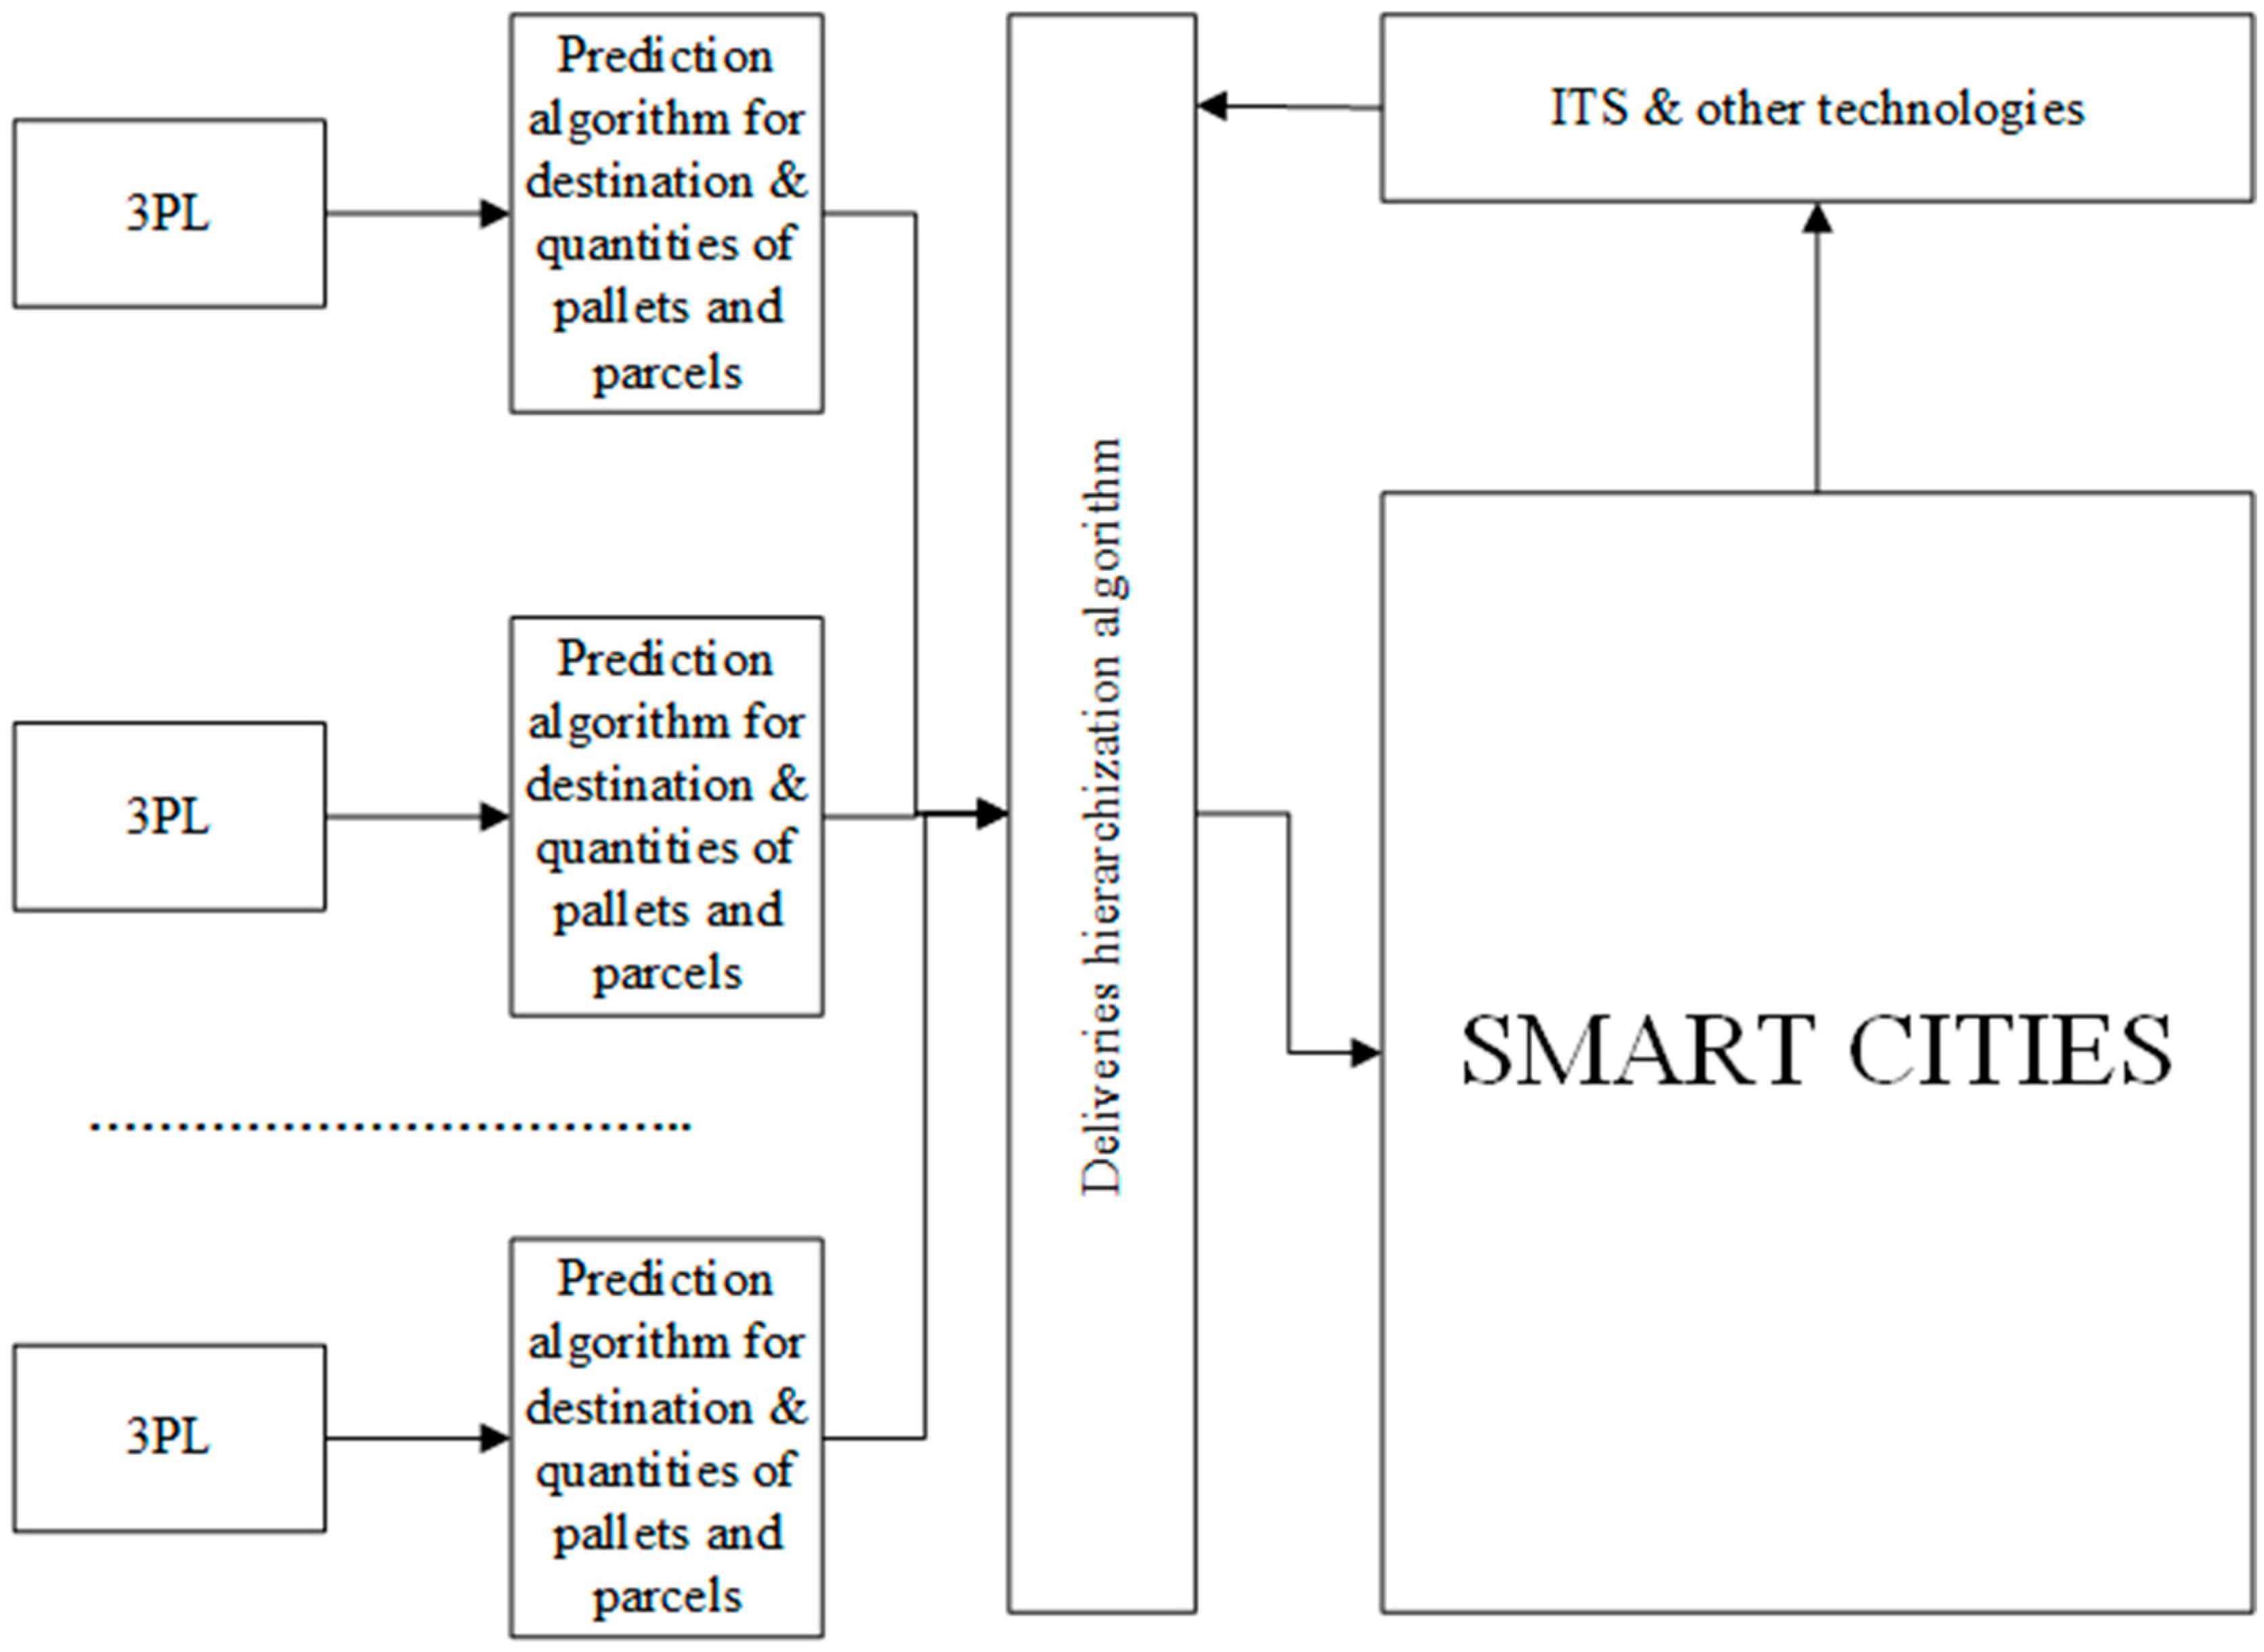
3.4. Conceptualisation
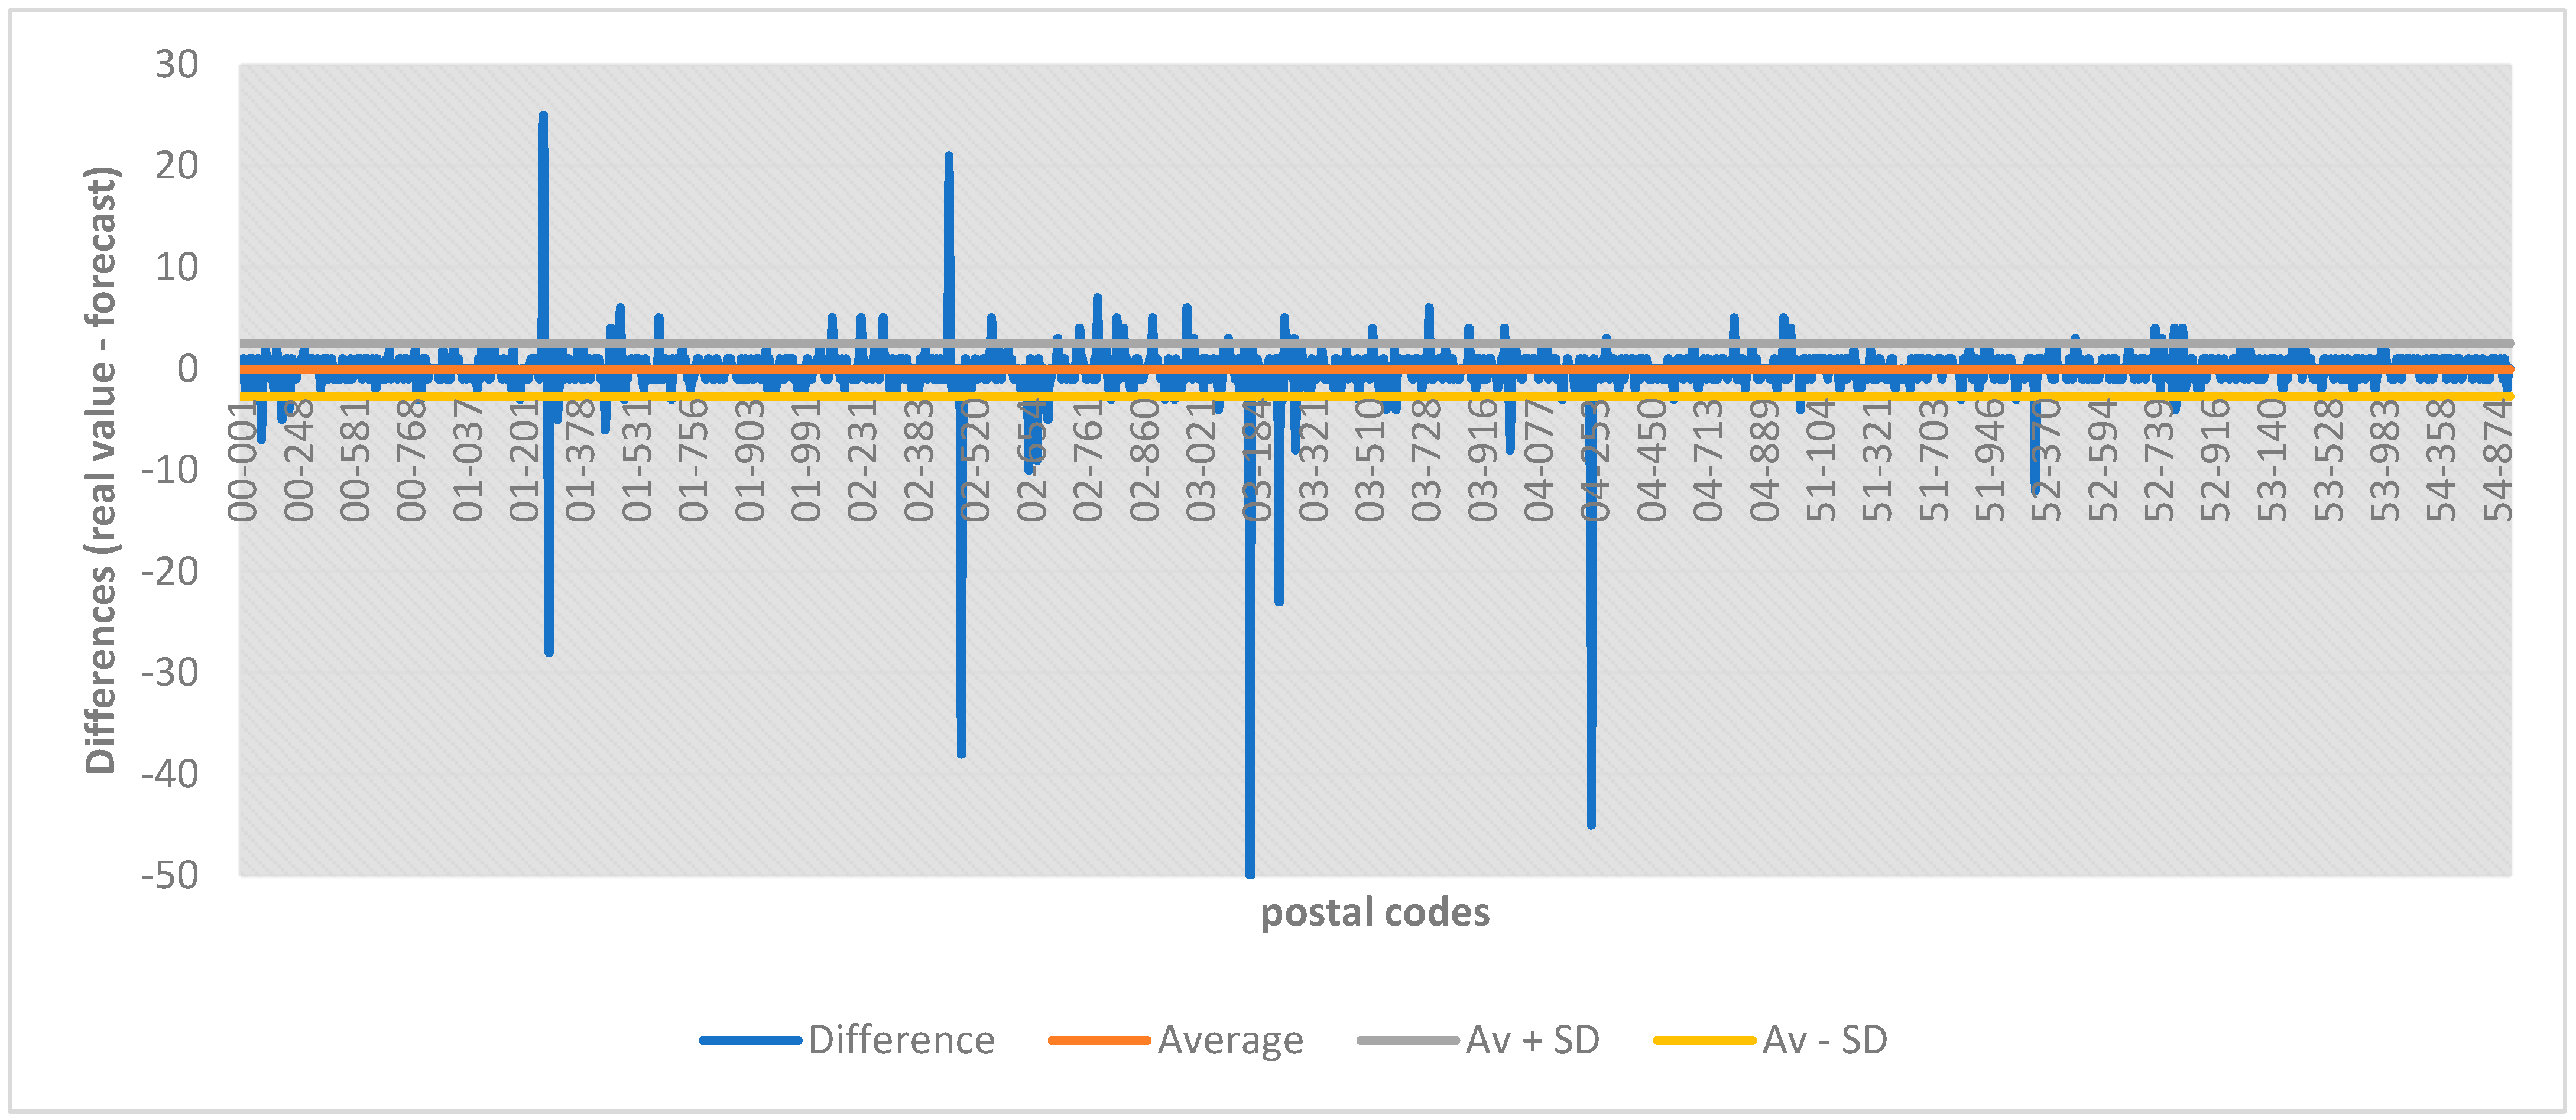
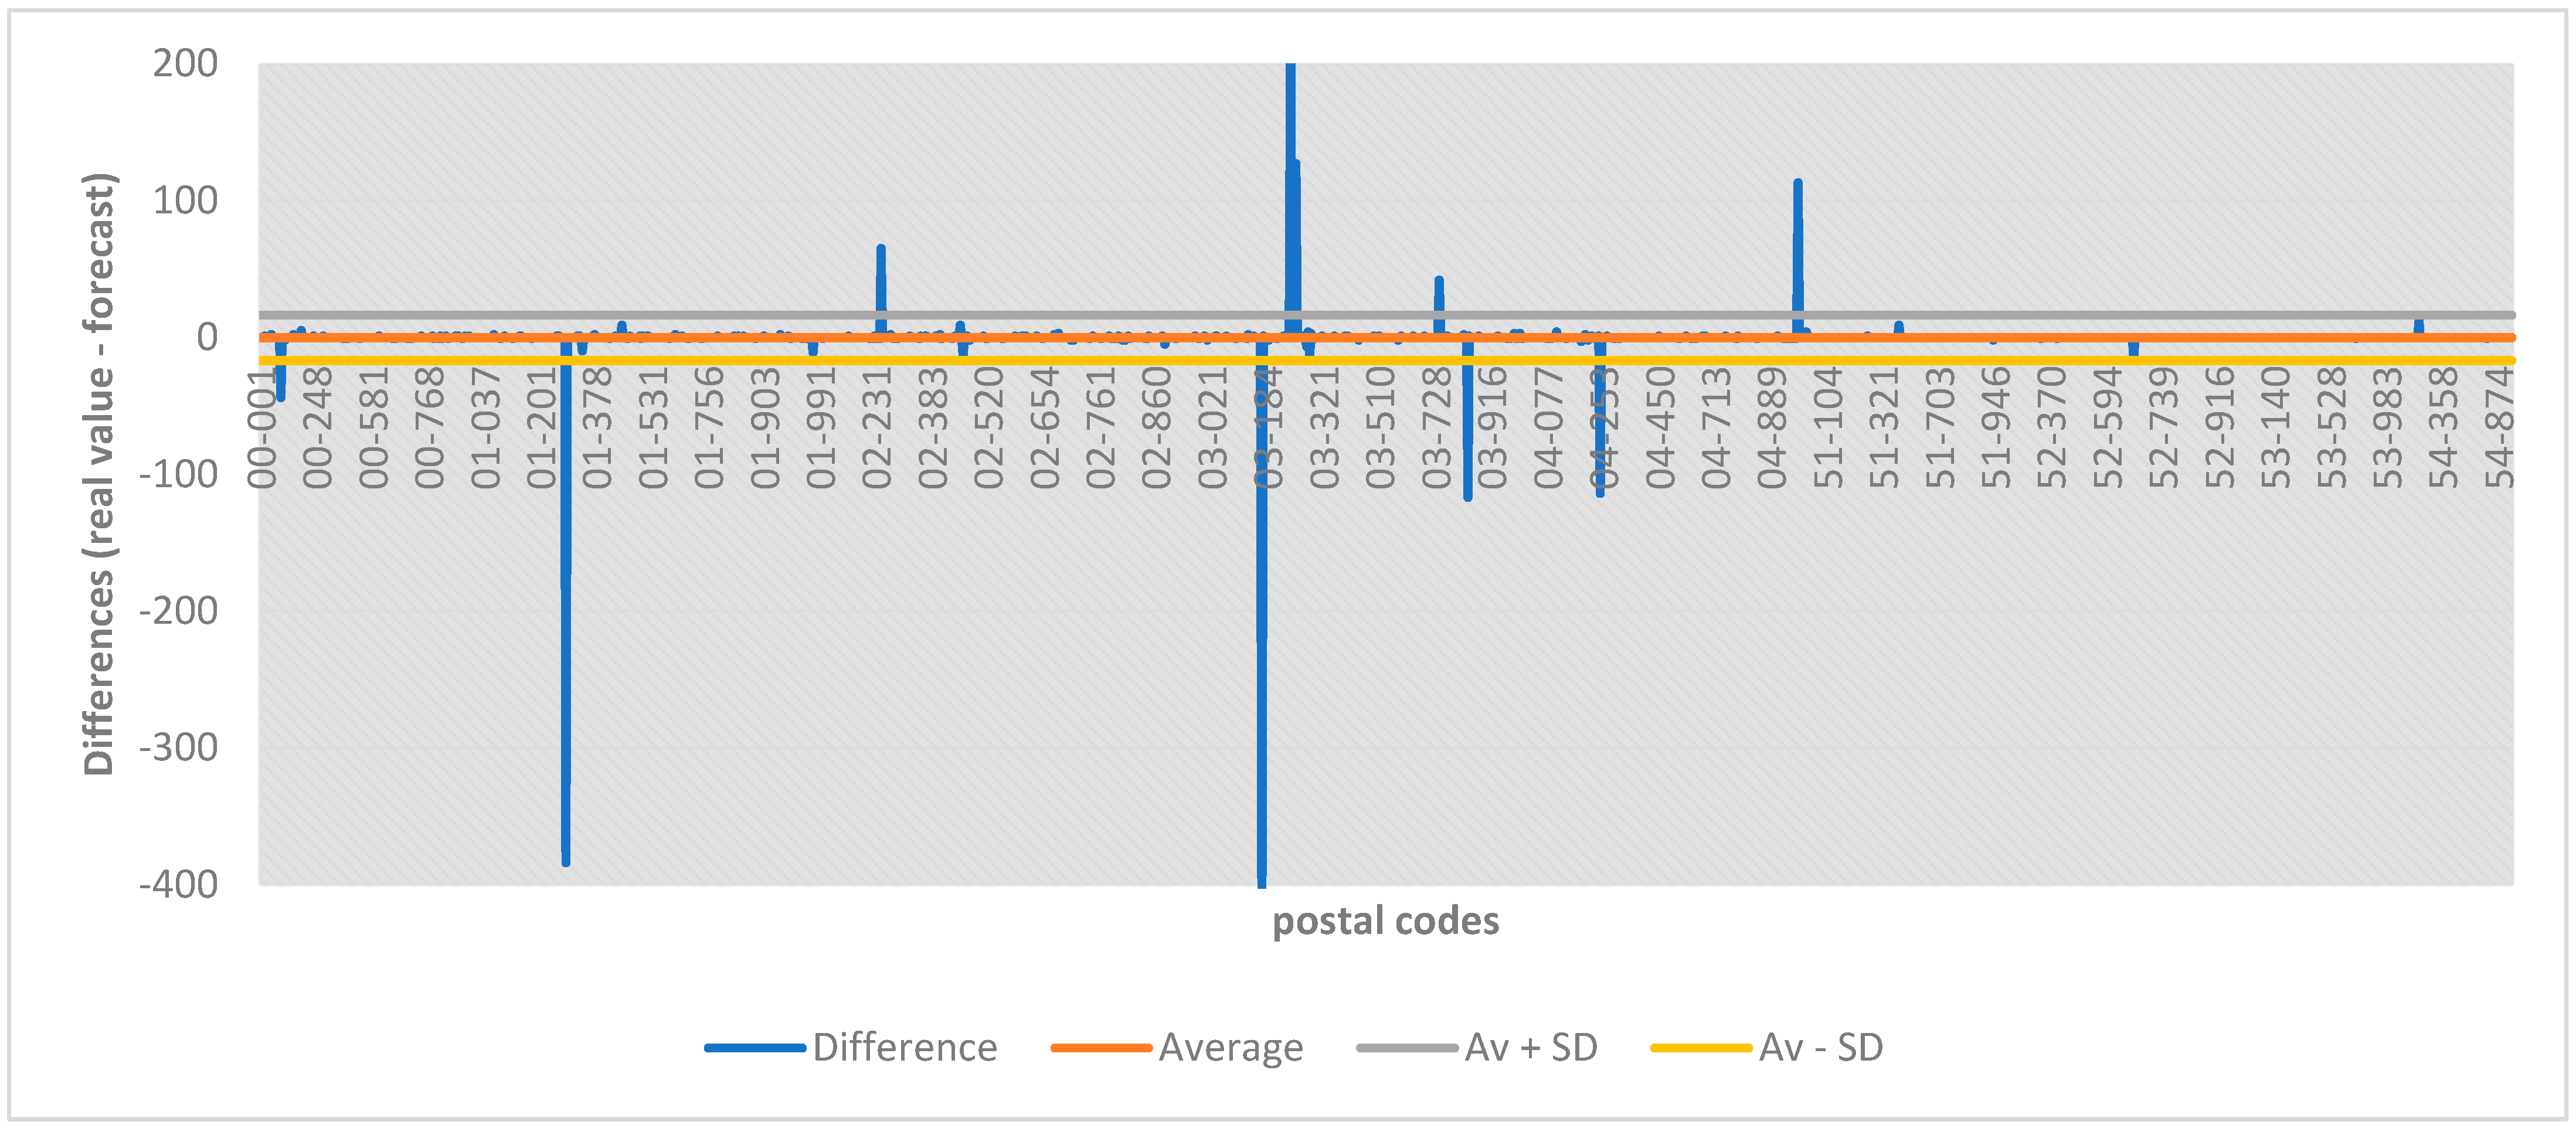
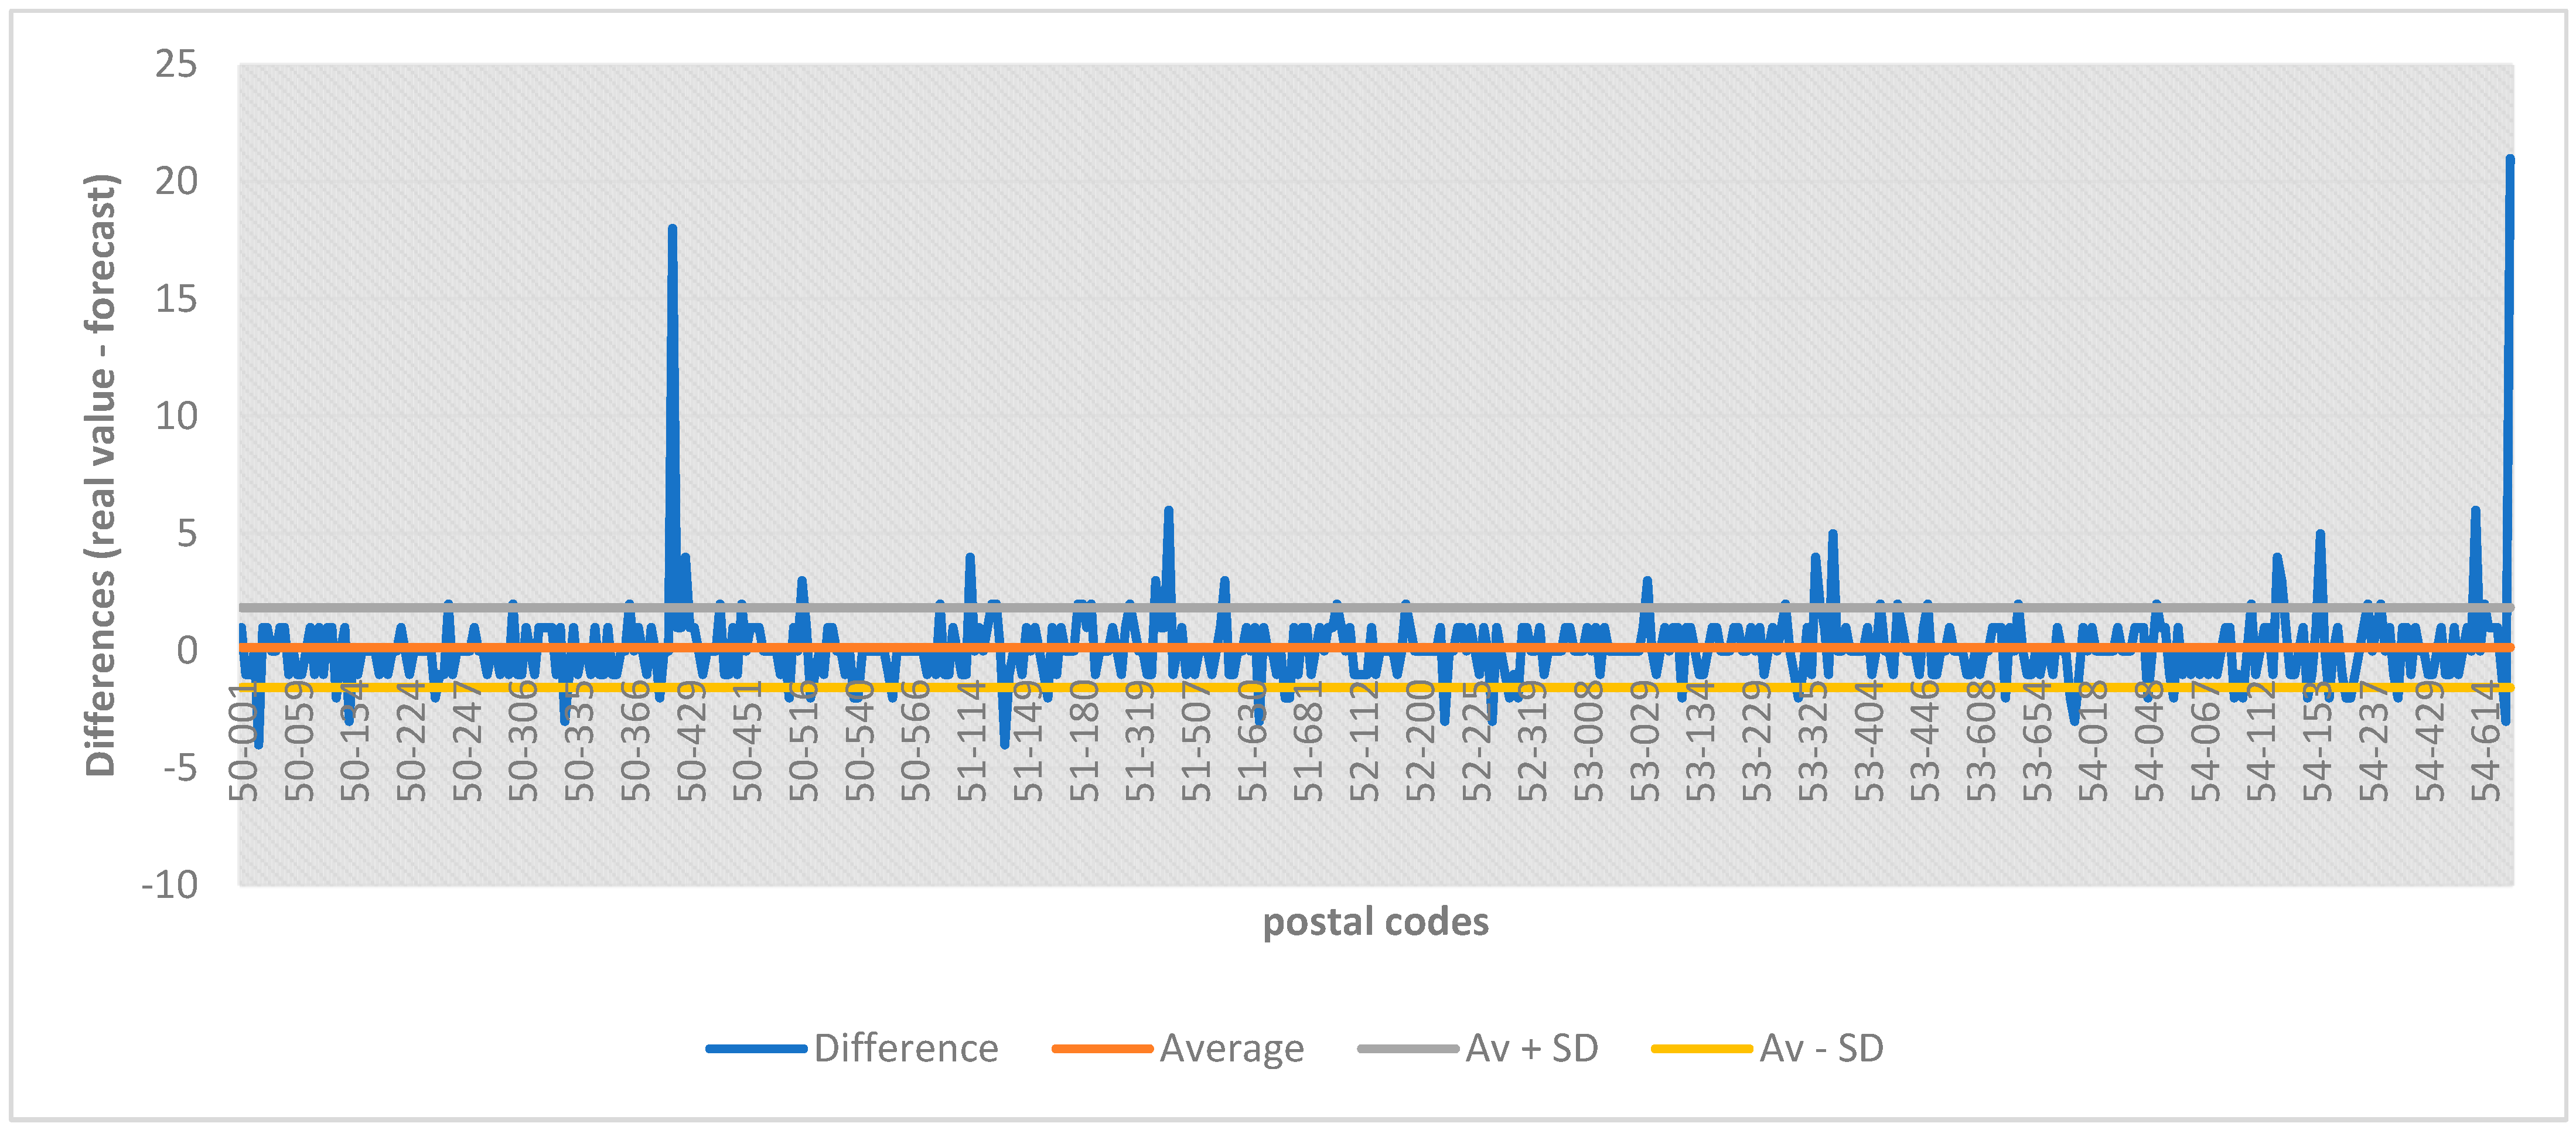
4. Results
5. Discussion
5.1. Predictive Actions of 3PL in the Pilot Studies
5.2. Concept for the Smart City
- An objective function minimising congestion in the city;
- A parameter related to the current traffic volume data extracted from ITS systems;
- A parameter related to the volumes of forecasts generated by 3PL companies;
- Individual point weight information in the form of postcodes for each 3PL.
5.3. Main Limitations and Further Research Directions
6. Conclusions
Author Contributions
Funding
Data Availability Statement
Conflicts of Interest
References
- Rześny-Cieplińska, J. Strategie Logistyki Miejskiej Wobec Koncepcji Smart City na Przykładzie Miast Polskich i Zachodnioeuropejskich; Prace Naukowe Uniwersytetu Ekonomicznego we Wrocławiu: Wrocław, Poland, 2018; pp. 473–477. [Google Scholar]
- Büyüközkan, G.; Uztürk, D. Smart last mile delivery solution selection for cities. In Proceedings of the World Congress on Engineering 2019, WCE 2019, London, UK, 3–5 July 2019; pp. 1–7. [Google Scholar]
- Kolasińska-Morawska, K.; Sułkowski, Ł.; Buła, P.; Brzozowska, M.; Morawski, P. Smart Logistics—Sustainable Technological Innovations in Customer Service at the Last-Mile Stage: The Polish Perspective. Energies 2022, 15, 6395. [Google Scholar] [CrossRef]
- Kazimierczak, M. Smart City po Polsku. Tak Nasze Miasta Stają się Inteligentniejsze. 2021. Available online: https://www.bankier.pl/wiadomosc/Smart-city-po-polsku-Tak-nasze-miasta-staja-sie-inteligentniejsze-8242747.html (accessed on 10 December 2023).
- Węcławowicz-Bilska, E. Etapy rozwoju miast typu smart. Sr. Mieszk. 2017, 19, 55–56. [Google Scholar] [CrossRef]
- Komninos, N. Intelligent Cities and Globalisation of Innovation Networks; Routledge: London, UK; New York, NY, USA, 2008; p. 110. [Google Scholar]
- Kinelski, G. Smart-city trends in the environment of sustainability as support for decarbonization processes. Polityka Energetyczna Energy Policy J. 2022, 25, 109–136. [Google Scholar] [CrossRef]
- Korenik, A. Smart city jako forma rozwoju miasta zrównoważonego i fundament zdrowych finansów miejskich. Ekon. Probl. Usług 2018, 129, 169–173. [Google Scholar]
- Nam, T.; Pardo, T.A. Conceptualizing smart cityies with dimensions of technology, people, and institutions, ACM International Conference Proceeding Series. In Proceedings of the 12th Annual International Digital Government Research Conference: Digital Government Innovation in Challenging Times, College Park, MD, USA, 12–15 June 2011; pp. 282–291. [Google Scholar]
- Kelly, K.; Usoro, A.; Opeyemi Ogunleye, G.; Gbenga Fashoto, S.; Weje, E.; Aribilosho, M. A Review on Smart Cities: Impact of Technology and Social Factors. Sch. Eng. Comput. Comput. Inf. Syst. J. 2016, 20, 21–28. [Google Scholar]
- Legaspi, J.; Shamsnaz, V.; Bhada Mathisen, P.; DeWinter, J. Synthesis of Public Transportation Literature Related to Health; Smart City Transportations; IEEE: Piscataway, NJ, USA, 2020; pp. 1–11. [Google Scholar]
- Gupta, S.; Mustafa, S.Z.; Kumar, H. Smart people for Smart Cities: A behavioral framework for personality and roles: Smarter people, governance and solution. In Advances in Smart Cities; Chapman Hall/CRC: London, UK, 2017; pp. 23–30. [Google Scholar]
- Wierzbicka, A. The Last Mile Transport. Zesz. Nauk. Politech. Śląskiej 2020, 145, 628. [Google Scholar] [CrossRef]
- Hou, Y.; Zhao, Y.; Wagh, A.; Zhang, L.; Qiao, C.; Hulme, K.F.; Wu, C.; Sadek, A.W.; Liu, X. Simulation-Based Testing and Evaluation Tools for Transportation Cyber–Physical Systems. IEEE Trans. Veh. Technol. 2016, 65, 1098–1108. [Google Scholar] [CrossRef]
- Mazur, S. An Introduction to Smart Transportation: Benefits and Examples. 2020. Available online: https://www.digi.com/blog/post/introduction-to-smart-transportation-benefits (accessed on 15 November 2023).
- Boichuk, N. Logistyka Ostatniej Mili Jako Najdroższy Odcinek Łańcucha Dostaw; Wydawnictwo Uniwersytetu Ekonomicznego w Poznaniu: Poznań, Poland, 2022; p. 124. [Google Scholar]
- Cichosz, M. Drony w Logistyce Ostatniej Mili—Innowacja Wspierająca Zrównoważoną Logistykę; Oficyna Wydawnicza SGH: Warszawa, Poland, 2020; p. 417. [Google Scholar]
- Majowicz, A.; Gral, M.; Maroszek, M. Ostatnia Mila Dla e-Commerce; Polski Instytut Transportu Drogowego: Wrocław, Poland, 2022; pp. 6–7. [Google Scholar]
- Iwan, S. Wdrażanie Dobrych Praktyk w Obszarze Transportu Dostawczego w Miastach; Wydawnictwo Naukowe Akademii Morskiej w Szczecinie: Szczecin, Poland, 2013; p. 92. [Google Scholar]
- Kamiński, T.; Niezgoda, M.; Razin, P.; Świderski, A.; Filipek, P. Implementation of urban ITS systems. Pr. Nauk. Politech. Warsz. Transp. 2018, 122, 32–34. [Google Scholar] [CrossRef]
- Costa, M.; José. Intelligent Transport Systems, Handbook on Land Mobile (Including Wireless Access), 2021st ed.; ITU Publications: Geneva, Switzerland, 2021; Volume 4, p. 5. [Google Scholar]
- Kramarz, M.; Dohn, K.; Przybylska, E.; Knop, L. Scenarios for the development of multimodal transport in the TRITIA cross-border area. Sustainability 2020, 12, 7021. [Google Scholar] [CrossRef]
- Wierzbicka, A. Freight Transport in the City and Its Impact on the Lives of Residents. Sci. Pap. Silesian Univ. Technol. Organ. Manag. 2023, 168, 487. [Google Scholar]
- Brodacki, D. Transformacja Ostatniej Mili, Zeroemisyjność Miasta; Fundacja Promocji Pojazdów Elektrycznych: Warszawa, Poland, 2022; pp. 5–6. [Google Scholar]
- Janik, T. Transport podziemny towarów-wizja czy misja? Logistyka 2020, 4, 16–19. [Google Scholar]
- Krasik, J. Przyszłość Transportu w Smart City. 2022. Available online: https://samochody-specjalne.pl/2022/06/09/przyszlosc-transportu-w-smart-city/ (accessed on 20 December 2023).
- Iwan, S. Zarządzanie dostawami ostatniego kilometra realizowanymi z wykorzystaniem rowerów towarowych. Innow. Zarządzaniu Inżynierii Prod. 2015, 383, 867–880. [Google Scholar]
- Berner, B.; Chojnacki, J. Wykorzystanie dronów do transportu towarów. Autobusy 2016, 17, 233–235. [Google Scholar]
- Chłąd, M.; Strzelczyk, M. Innowacyjne rozwiązania w transporcie towarów. Probl. Transp. Logistyki 2017, 3, 15. [Google Scholar]
- Mantey, C. Overcoming Last-Mile Delivery and Urban Logistics Obstacles, Supply and Demand Chain Executive. 2017. Available online: https://www.sdcexec.com/warehousing/article/12314667 (accessed on 19 December 2023).
- Golinska-Dawson, P.; Sethanan, K. Sustainable urban freight for energy-efficient smart cities—Systematic literature review. Energies 2023, 16, 2617. [Google Scholar] [CrossRef]
- Asthana, S.; Dwivedi, A. Performance measurement of India-based third party logistics sector: An empirical study of user versus provider perspectives. Prod. Plan. Control. 2020, 31, 259–272. [Google Scholar] [CrossRef]
- Gerrits, B.; Schuur, P. Parcel delivery for smart cities: A synchronization approach for combined truck-drone-street robot deliveries. In Proceedings of the 2021 Winter Simulation Conference (WSC), Phoenix, AZ, USA, 12–15 December 2021; pp. 1–12. [Google Scholar]
- Sebe, S.M.; Müller, J.P. Pfara: A platoon forming and routing algorithm for same-day deliveries. In Smart Cities, Green Tech-nologies and Intelligent Transport Systems, Proceedings of the 8th International Conference, SMARTGREENS 2019, and 5th International Conference, VEHITS 2019, Heraklion, Crete, Greece, 3–5 May 2019; Springer International Publishing: Berlin/Heidelberg, Germany, 2021; pp. 297–320, Revised Selected Papers 8. [Google Scholar]
- Wang, H.; Li, W.; Li, M.; Yang, X.; Wang, Z.; Zhao, Z.; Wang, L. Intelligent selection of delivery parties for fresh agricultural product based on third-party logistics in smart city. Sustain. Energy Technol. Assess. 2022, 52, 102151. [Google Scholar] [CrossRef]
- Lin, I.-C.; Fu, H.-C.; Chang, S.-H.; Leng, K. An Evaluation Model Based on Product Characteristics for End-Delivery Choice in China e-Commerce Services. In Proceedings of the 6th International Conference on Information Technology: IoT and Smart City, New York, NY, USA, 29–31 December 2018; pp. 219–223. [Google Scholar]
- Liu, Y.; Pan, S.; Folz, P.; Ramparany, F.; Bolle, S.; Ballot, E.; Coupaye, T. Cognitive digital twins for freight parking man-agement in last mile delivery under smart cities paradigm. Comput. Ind. 2023, 153, 104022. [Google Scholar] [CrossRef]
- Herrera Quintana, A.I.; Yang, L. Understanding Value-Added Service Offering by 3PL Providers: VAS as a Source of Competitive Advantage for the Provider and the Customer; Jönköping University International Business School: Jönköping, Sweden, 2017; p. 106. [Google Scholar]
- Baruffaldi, G.; Accorsi, R.; Manzini, R.; Ferrari, E. Warehousing process performance improvement: A tailored framework for 3PL. Bus. Process. Manag. J. 2020, 26, 1619–1641. [Google Scholar] [CrossRef]
- Kotlars, A. Resource and Internal Process Management in Third Party Logistics. Econ. Bus. 2018, 32, 228–246. [Google Scholar] [CrossRef]
- Rosenberg, L.N.; Balouka, N.; Herer, Y.T.; Dani, E.; Gasparin, P.; Dobers, K.; van Uden, S. Introducing the shared mi-cro-depot network for last-mile logistics. Sustainability 2021, 13, 2067. [Google Scholar] [CrossRef]
- Feng, X.; Chu, F.; Chu, C.; Huang, Y. Crowdsource-enabled integrated production and transportation scheduling for smart city logistics. Int. J. Prod. Res. 2021, 59, 2157–2176. [Google Scholar] [CrossRef]
- Parodos, L.; Tsolakis, O.; Tsoukos, G.; Xenou, E.; Ayfantopoulou, G. Business model analysis of smart city logistics solutions using the business model canvas: The case of an on-demand warehousing E-marketplace. Futur. Transp. 2022, 2, 467–481. [Google Scholar] [CrossRef]
- Shee, H.; Miah, S.; Taboada, I.; De Vass, T. Smart City–Smart Logistics Amalgamation. In Proceedings of the 2020 IEEE European Technology and Engineering Management Summit (E-TEMS), Dortmund, Germany, 5–7 March 2020; pp. 1–4. [Google Scholar]
- Singh, R.K.; Gunasekaran, A.; Kumar, P. Third party logistics (3PL) selection for cold chain management: A fuzzy AHP and fuzzy TOPSIS approach. Ann. Oper. Res. 2018, 267, 531–553. [Google Scholar] [CrossRef]
- Huo, B.; Ye, Y.; Zhao, X. The impacts of trust and contracts on opportunism in the 3PL industry: The moderating role of demand uncertainty. Int. J. Prod. Econ. 2015, 170, 160–170. [Google Scholar] [CrossRef]
- Darko, E.O.; Vlachos, I. Creating valuable relationships with third-party logistics (3PL) providers: A multiple-case study. Logistics 2022, 6, 38. [Google Scholar] [CrossRef]
- Merminod, N.; Large, R.O.; Paché, G. Procurement of advanced logistics services: Proposition of a reasoned action model of individual buying behavior. Supply Chain Forum Int. J. 2019, 20, 169–184. [Google Scholar] [CrossRef]
- Mortensen, O.; Lemoine, O.W. Integration between manufacturers and third party logistics providers? Int. J. Oper. Prod. Manag. 2008, 28, 331–359. [Google Scholar] [CrossRef]
- Tyan, J.C.; Wang, F.K.; Du, T. Applying collaborative transportation management models in global third-party logistics. Int. J. Comput. Integr. Manuf. 2003, 16, 283–291. [Google Scholar] [CrossRef]
- Gürler, Ü.; Alp, O.; Büyükkaramikli, N.Ç. Coordinated inventory replenishment and outsourced transportation operations. Transp. Res. Part E Logist. Transp. Rev. 2014, 70, 400–415. [Google Scholar] [CrossRef]
- Sheikh, Z.; Rana, S. Role of third party logistics providers with advanced IT to increase customer satisfaction in supply chain integration. In Society of Interdisciplinary Business Research (SIBR) Conference on Interdisciplinary Business Research; Comsats University Islamabad: Islamabad, Pakistan, 2011; pp. 1–12. [Google Scholar]
- Wu, X.; Wang, Q.; Wang, L.; Zhao, X. Customer integration and the performance of third-party logistics firms: A moderated mediation model. Int. J. Logist. Res. Appl. 2023, 26, 615–632. [Google Scholar] [CrossRef]
- Liu, X.; Qian, C.; Wang, S. When do 3PLs initiate low-carbon supply chain integration? Int. J. Oper. Prod. Manag. 2020, 40, 1367–1395. [Google Scholar] [CrossRef]
- Mir, A.; Lazaar, S.; Balambo, M.A. The logistics service provider as an integrator of supply chain. Evidences from an emerging market. Rev. Eur. D’économie Manag. Serv. 2021, 2021, 69–91. [Google Scholar]
- Mohanty, M.; Shankar, R. DEA-ADALINE: An approach to improve the relative efficiency of 3PLs providers. Benchmarking Int. J. 2020, 27, 166–191. [Google Scholar] [CrossRef]
- Zacharia, Z.G.; Sanders, N.R.; Nix, N.W. The emerging role of the third-party logistics provider (3PL) as an orchestrator. J. Bus. Logist. 2011, 32, 40–54. [Google Scholar] [CrossRef]
- Jiang, L.; Guo, Y.; Su, J.; Jian, J.; He, Y. Sub-coordination in a competing supply chain with a 3PL provider. IEEE Access 2019, 7, 158148–158159. [Google Scholar] [CrossRef]
- Pinna, R.; Carrus, P.P.; Pettinao, D. Supply Chain Coordination and IT: The role of third party logistics providers. In Man-agement of the Interconnected World: ItAIS: The Italian Association for Information Systems; Physica-Verlag HD: Heidelberg, Germany, 2010; pp. 299–306. [Google Scholar]
- Kramarz, M.; Kmiecik, M. Quality of Forecasts as the Factor Determining the Coordination of Logistics Processes by Logistic Operator. Sustainability 2022, 14, 1013. [Google Scholar] [CrossRef]
- Karia, N.; Wong, C.Y.; Asaari, M.H.A.H.; Lai, K.-H. The effects of resource bundling on third-party logistics providers’ performance. Int. J. Eng. Bus. Manag. 2015, 7, 9. [Google Scholar] [CrossRef]
- Krasnov, S.; Zotova, E.; Sergeev, S.; Krasnov, A.; Draganov, M. Stochastic algorithms in multimodal 3PL segment for the digital environment. IOP Conf. Ser. Mater. Sci. Eng. 2019, 618, 012069. [Google Scholar] [CrossRef]
- Huemer, L. Unchained from the chain: Supply management from a logistics service provider perspective. J. Bus. Res. 2012, 65, 258–264. [Google Scholar] [CrossRef]
- Gligor, D.M. The role of demand management in achieving supply chain agility. Supply Chain Manag. Int. J. 2014, 19, 577–591. [Google Scholar] [CrossRef]
- Cox, A.; Chicksand, D.; Ireland, P. Overcoming demand management problems: The scope for improving reactive and pro-active supply management in the UK health service. J. Public Procure. 2005, 5, 1–22. [Google Scholar] [CrossRef]
- Mahmood, S.; Kess, P. An overview of demand management through demand supply chain in fashion industry. Int. J. Manag. Sci. Bus. Adm. 2016, 2, 7–19. [Google Scholar] [CrossRef]
- Jonek-Kowalska, I.; Wolniak, R. Economic opportunities for creating smart cities in Poland. Does wealth matter? Cities 2021, 114, 103222. [Google Scholar] [CrossRef]
- Masik, G.; Sagan, I.; Scott, J.W. Smart City strategies and new urban development policies in the Polish context. Cities 2021, 108, 102970. [Google Scholar] [CrossRef]
- Yarashynskaya, A.; Prus, P. Smart Energy for a Smart City: A Review of Polish Urban Development Plans. Energies 2022, 15, 8676. [Google Scholar] [CrossRef]
- Khan, S.; Alghulaiakh, H. ARIMA model for accurate time series stocks forecasting. Int. J. Adv. Comput. Sci. Appl. 2020, 11, 1–5. [Google Scholar] [CrossRef]
- Sahai, A.K.; Rath, N.; Sood, V.; Singh, M.P. ARIMA modelling & forecasting of COVID-19 in top five affected countries. Diabetes Metab. Syndr. Clin. Res. Rev. 2020, 14, 1419–1427. [Google Scholar]
- Satrio, C.B.A.; Darmawan, W.; Nadia, B.U.; Hanafiah, N. Time series analysis and forecasting of coronavirus disease in Indonesia using ARIMA model and PROPHET. Procedia Comput. Sci. 2021, 179, 524–532. [Google Scholar] [CrossRef]
- Choudhary, A.; Kumar, S.; Sharma, M.; Sharma, K.P. A framework for data prediction and forecasting in WSN with Auto ARIMA. Wirel. Pers. Commun. 2022, 123, 2245–2259. [Google Scholar] [CrossRef]
- Sharmin, S.; Alam, F.I.; Das, A.; Uddin, R. An investigation into crime forecast using auto ARIMA and stacked LSTM. In Proceedings of the 2022 International Conference on Innovations in Science, Engineering and Technology (ICISET), Chittagong, Bangladesh, 26–27 February 2022; pp. 415–420. [Google Scholar]
- Kurani, A.; Doshi, P.; Vakharia, A.; Shah, M. A comprehensive comparative study of artificial neural network (ANN) and support vector machines (SVM) on stock forecasting. Ann. Data Sci. 2023, 10, 183–208. [Google Scholar] [CrossRef]
- Vairagade, N.; Logofatu, D.; Leon, F.; Muharemi, F. Demand forecasting using random forest and artificial neural network for supply chain management. In Computational Collective Intelligence, Proceedings of the 11th International Conference, ICCCI 2019, Hendaye, France, 4–6 September 2019; Proceedings, Part I 11; Springer International Publishing: Berlin/Heidelberg, Germany, 2019; pp. 328–339. [Google Scholar]
- Leenatham, A.; Khemavuk, P. Demand forecasting using artificial neural network based on quantitative and qualitative data. In Proceedings of the 2020 1st International Conference on Big Data Analytics and Practices (IBDAP), Bangkok, Thailand, 25–26 September 2020; pp. 1–6. [Google Scholar]
- Tian, L.; Dexin, R.; Qingbo, H.; Hongying, C. Construction of combinatorial prediction model for infectious diseases based on software R. Dis. Surveill. 2023, 38, 721–727. [Google Scholar]
- Setiawan, I. Time series air quality forecasting with R Language and R Studio. J. Phys. Conf. Ser. 2020, 1450, 012064. [Google Scholar] [CrossRef]
- Sun, Z. Comparison of trend forecast using ARIMA and ETS Models for SP500 close price. In Proceedings of the 2020 4th In-ternational Conference on E-Business and Internet, Singapore, 9–11 October 2020; pp. 57–60. [Google Scholar]
- Kmiecik, M. Supporting of manufacturer’s demand plans as an element of logistics coordination in the distribution network. Prod. Eng. Arch. 2023, 29, 69–82. [Google Scholar] [CrossRef]
- Abbasimehr, H.; Shabani, M.; Yousefi, M. An optimized model using LSTM network for demand forecasting. Comput. Ind. Eng. 2020, 143, 106435. [Google Scholar] [CrossRef]
- Minashkina, D.; Happonen, A. Systematic literature review and research gap issues on third party logistics operators selecting WMS for efficient operations for customers. Int. J. Supply Chain Inventory Manag. 2020, 3, 142–166. [Google Scholar] [CrossRef]
- Giannikas, V.; McFarlane, D.; Strachan, J. Towards the deployment of customer orientation: A case study in third-party lo-gistics. Comput. Ind. 2019, 104, 75–87. [Google Scholar] [CrossRef]
- Baruffaldi, G.; Accorsi, R.; Manzini, R. Warehouse management system customization and information availability in 3pl companies: A decision-support tool. Ind. Manag. Data Syst. 2019, 119, 251–273. [Google Scholar] [CrossRef]
- Tan, M.; Yuan, S.; Li, S.; Su, Y.; Li, H.; He, F. Ultra-short-term industrial power demand forecasting using LSTM based hybrid ensemble learning. IEEE Trans. Power Syst. 2019, 35, 2937–2948. [Google Scholar] [CrossRef]
- Chicco, D.; Warrens, M.J.; Jurman, G. The coefficient of determination R-squared is more informative than SMAPE, MAE, MAPE, MSE and RMSE in regression analysis evaluation. PeerJ Comput. Sci. 2021, 7, e623. [Google Scholar] [CrossRef]
- Zhou, L.; Zhao, P.; Wu, D.; Cheng, C.; Huang, H. Time series model for forecasting the number of new admission inpatients. BMC Med Inform. Decis. Mak. 2018, 18, 39. [Google Scholar] [CrossRef] [PubMed]
- Badulescu, Y.; Hameri, A.-P.; Cheikhrouhou, N. Evaluating demand forecasting models using multi-criteria decision-making approach. J. Adv. Manag. Res. 2021, 18, 661–683. [Google Scholar] [CrossRef]
- Cagatay, B.A.L.; Demir, S. Adaptive Weighted Performance Criterion for Artificial Neural Networks. In Proceedings of the 2018 International Conference on Artificial Intelligence and Data Processing (IDAP), Malatya, Turkey, 28–30 September 2018; pp. 1–4. [Google Scholar]
- Carta, S.; Medda, A.; Pili, A.; Reforgiato Recupero, D.; Saia, R. Forecasting e-commerce products prices by combining an autoregressive integrated moving average (ARIMA) model and google trends data. Future Internet 2018, 11, 5. [Google Scholar] [CrossRef]
- Bowen, T.; Zhe, Z.; Yulin, Z. Forecasting method of e-commerce cargo sales based on ARIMA-BP model. In Proceedings of the 2020 IEEE Inter-national Conference on Artificial Intelligence and Computer Applications (ICAICA), Dalian, China, 27–29 June 2020; pp. 133–136. [Google Scholar]
- Qi, Y.; Li, C.; Deng, H.; Cai, M.; Qi, Y.; Deng, Y. A deep neural framework for sales forecasting in e-commerce. In Proceedings of the 28th ACM International Conference on Information and Knowledge Management, Beijing China, 3–7 November 2019 2019; pp. 299–308. [Google Scholar]
- Bandara, K.; Shi, P.; Bergmeir, C.; Hewamalage, H.; Tran, Q.; Seaman, B. Sales demand forecast in e-commerce using a long short-term memory neural network methodology. In Neural Information Processing, Proceedings of the 26th International Conference, ICONIP 2019, Sydney, NSW, Australia, 12–15 December 2019; Proceedings, Part III 26; Springer: Berlin/Heidelberg, Germany, 2019; pp. 462–474. [Google Scholar]
- Ketipov, R.; Kostadinov, G.; Petrov, P.; Zankinski, I.; Balabanov, T. Human-computer mobile distributed computing for time series forecasting. In Distributed Computer and Communication Networks, Proceedings of the 22nd International Conference, DCCN 2019, Moscow, Russia, 23–27 September 2019; Revised Selected Papers 22; Springer: Berlin/Heidelberg, Germany, 2019; pp. 503–509. [Google Scholar]
- Masdari, M.; Khezri, H. Efficient VM migrations using forecasting techniques in cloud computing: A comprehensive review. Clust. Comput. 2020, 23, 2629–2658. [Google Scholar] [CrossRef]
- Qin, X.; Liu, Z.; Tian, L. The optimal combination between selling mode and logistics service strategy in an e-commerce market. Eur. J. Oper. Res. 2021, 289, 639–651. [Google Scholar] [CrossRef]
- Cho, J.J.K.; Ozment, J.; Sink, H. Logistics capability, logistics outsourcing and firm performance in an e-commerce market. Int. J. Phys. Distrib. Logist. Manag. 2008, 38, 336–359. [Google Scholar]
- Abbas, S.; Khan, M.A.; Athar, A.; Shan, S.A.; Saeed, A.; Alyas, T. Enabling smart city with intelligent congestion control using hops with a hybrid computational approach. Comput. J. 2022, 65, 484–494. [Google Scholar] [CrossRef]
- Guo, Y.; Tang, Z.; Guo, J. Could a smart city ameliorate urban traffic congestion? A quasi-natural experiment based on a smart city pilot program in China. Sustainability 2020, 12, 2291. [Google Scholar] [CrossRef]
- Djahel, S.; Jabeur, N.; Barrett, R.; Murphy, J. Toward V2I communication technology-based solution for reducing road traffic congestion in smart cities. In Proceedings of the 2015 International Symposium on Networks, Computers and Communications (ISNCC), Hammamet, Tunisia, 13–15 May 2015; pp. 1–6. [Google Scholar]
- Hopkins, J.L.; McKay, J. Investigating ‘anywhere working’ as a mechanism for alleviating traffic congestion in smart cities. Technol. Forecast. Soc. Chang. 2019, 142, 258–272. [Google Scholar] [CrossRef]
- Parekh, T.; Kumar, B.V.; Maheswar, R.; Sivakumar, P.; Surendiran, B.; Aileni, R.M. Intelligent transportation system in smart city: A SWOT analysis. In Challenges and Solutions for Sustainable Smart City Development; Springer: Cham, Switzerland, 2021; pp. 17–47. [Google Scholar]
- Urzúa-Morales, J.G.; Sepulveda-Rojas, J.P.; Alfaro, M.; Fuertes, G.; Ternero, R.; Vargas, M. Logistic modeling of the last mile: Case study Santiago, Chile. Sustainability 2020, 12, 648. [Google Scholar] [CrossRef]
- Okude, M.; Taniguchi, E. An approximation algorithm for vehicle routing problems with hierarchized traffic network. Procedia Soc. Behav. Sci. 2012, 39, 369–386. [Google Scholar] [CrossRef]
- Fairchild, A.M. What is the role of Third Party Logistics (3PL) partners in an omni-channel strategy? Int. J. Oper. Res. Inf. Syst. 2016, 7, 22–32. [Google Scholar] [CrossRef]
- Kembro, J.H.; Norrman, A. Warehouse configuration in omni-channel retailing: A multiple case study. Int. J. Phys. Distrib. Logist. Manag. 2020, 50, 509–533. [Google Scholar] [CrossRef]
- Murfield, M.; Boone, C.A.; Rutner, P.; Thomas, R. Investigating logistics service quality in omni-channel retailing. Int. J. Phys. Distrib. Logist. Manag. 2017, 47, 263–296. [Google Scholar] [CrossRef]
- Zhang, J.; Zhong, S.; Wang, T.; Chao, H.C.; Wang, J. Blockchain-based systems and applications: A survey. J. Internet Technol. 2020, 21, 1–14. [Google Scholar]
- Wang, J.; Chen, W.; Wang, L.; Sherratt, R.S.; Alfarraj, O.; Tolba, A. Data secure storage mechanism of sensor networks based on blockchain. Comput. Mater. Contin. 2020, 65, 2365–2384. [Google Scholar] [CrossRef]
- Chen, Y.; Zhou, J.; Guo, M. A context-aware search system for Internet of Things based on hierarchical context model. Telecommun. Syst. 2016, 62, 77–91. [Google Scholar] [CrossRef]
- Li, W.; Xu, H.; Li, H.; Yang, Y.; Sharma, P.K.; Wang, J.; Singh, S. Complexity and algorithms for superposed data uploading problem in networks with smart devices. IEEE Internet Things J. 2019, 7, 5882–5891. [Google Scholar] [CrossRef]


| Author of the Publication | Combination of 3PL Operators with the Smart City Concept |
|---|---|
| Golinska-Dawson and Sethanan, 2023 [31] | 3PL as an entity having to adapt modern technologies like drones, autonomous delivery robots, autonomous vehicles, cargo bikes, electric vehicles and combined passenger-and-cargo transportation rapid-transit systems for the smart city |
| Asthana and Dwivedi, 2020 [32] | 3PL as an entity having to adapt modern technologies or Internet of Things (loT) technologies |
| Gerrits and Schuur, 2021 [33]; Sebe and Muller, 2021 [34] | In these publications, the improvement of delivery technologies by 3PL operators is indicated as the direction for the application of modern technologies |
| Wang et al., 2022 [35] | The use of modern technologies in the supply of special products, such as fresh agricultural products |
| I-Ching et al., 2018 [36]; Liu et al., 2023 [37] | Implementation of last-mile delivery services, whether from the perspective of e-commerce or freight parking management in last-mile delivery |
| Shipping Date | Pallet Quantity | Parcel Quantity | Delivery Address Postal Code | Delivery Address City | Delivery Address Code (Country) |
|---|---|---|---|---|---|
| 25 December 2023 | 1 | 0 | 50304 | WROCLAW | 616 |
| 8 August 2023 | 11 | 0 | 50422 | WROCLAW | 616 |
| 1 August 2023 | 3 | 0 | 03977 | WARSAW | 616 |
| 7 July 2023 | 1 | 2 | 34122 | WARSAW | 616 |
| … | … | … | … | … | … |
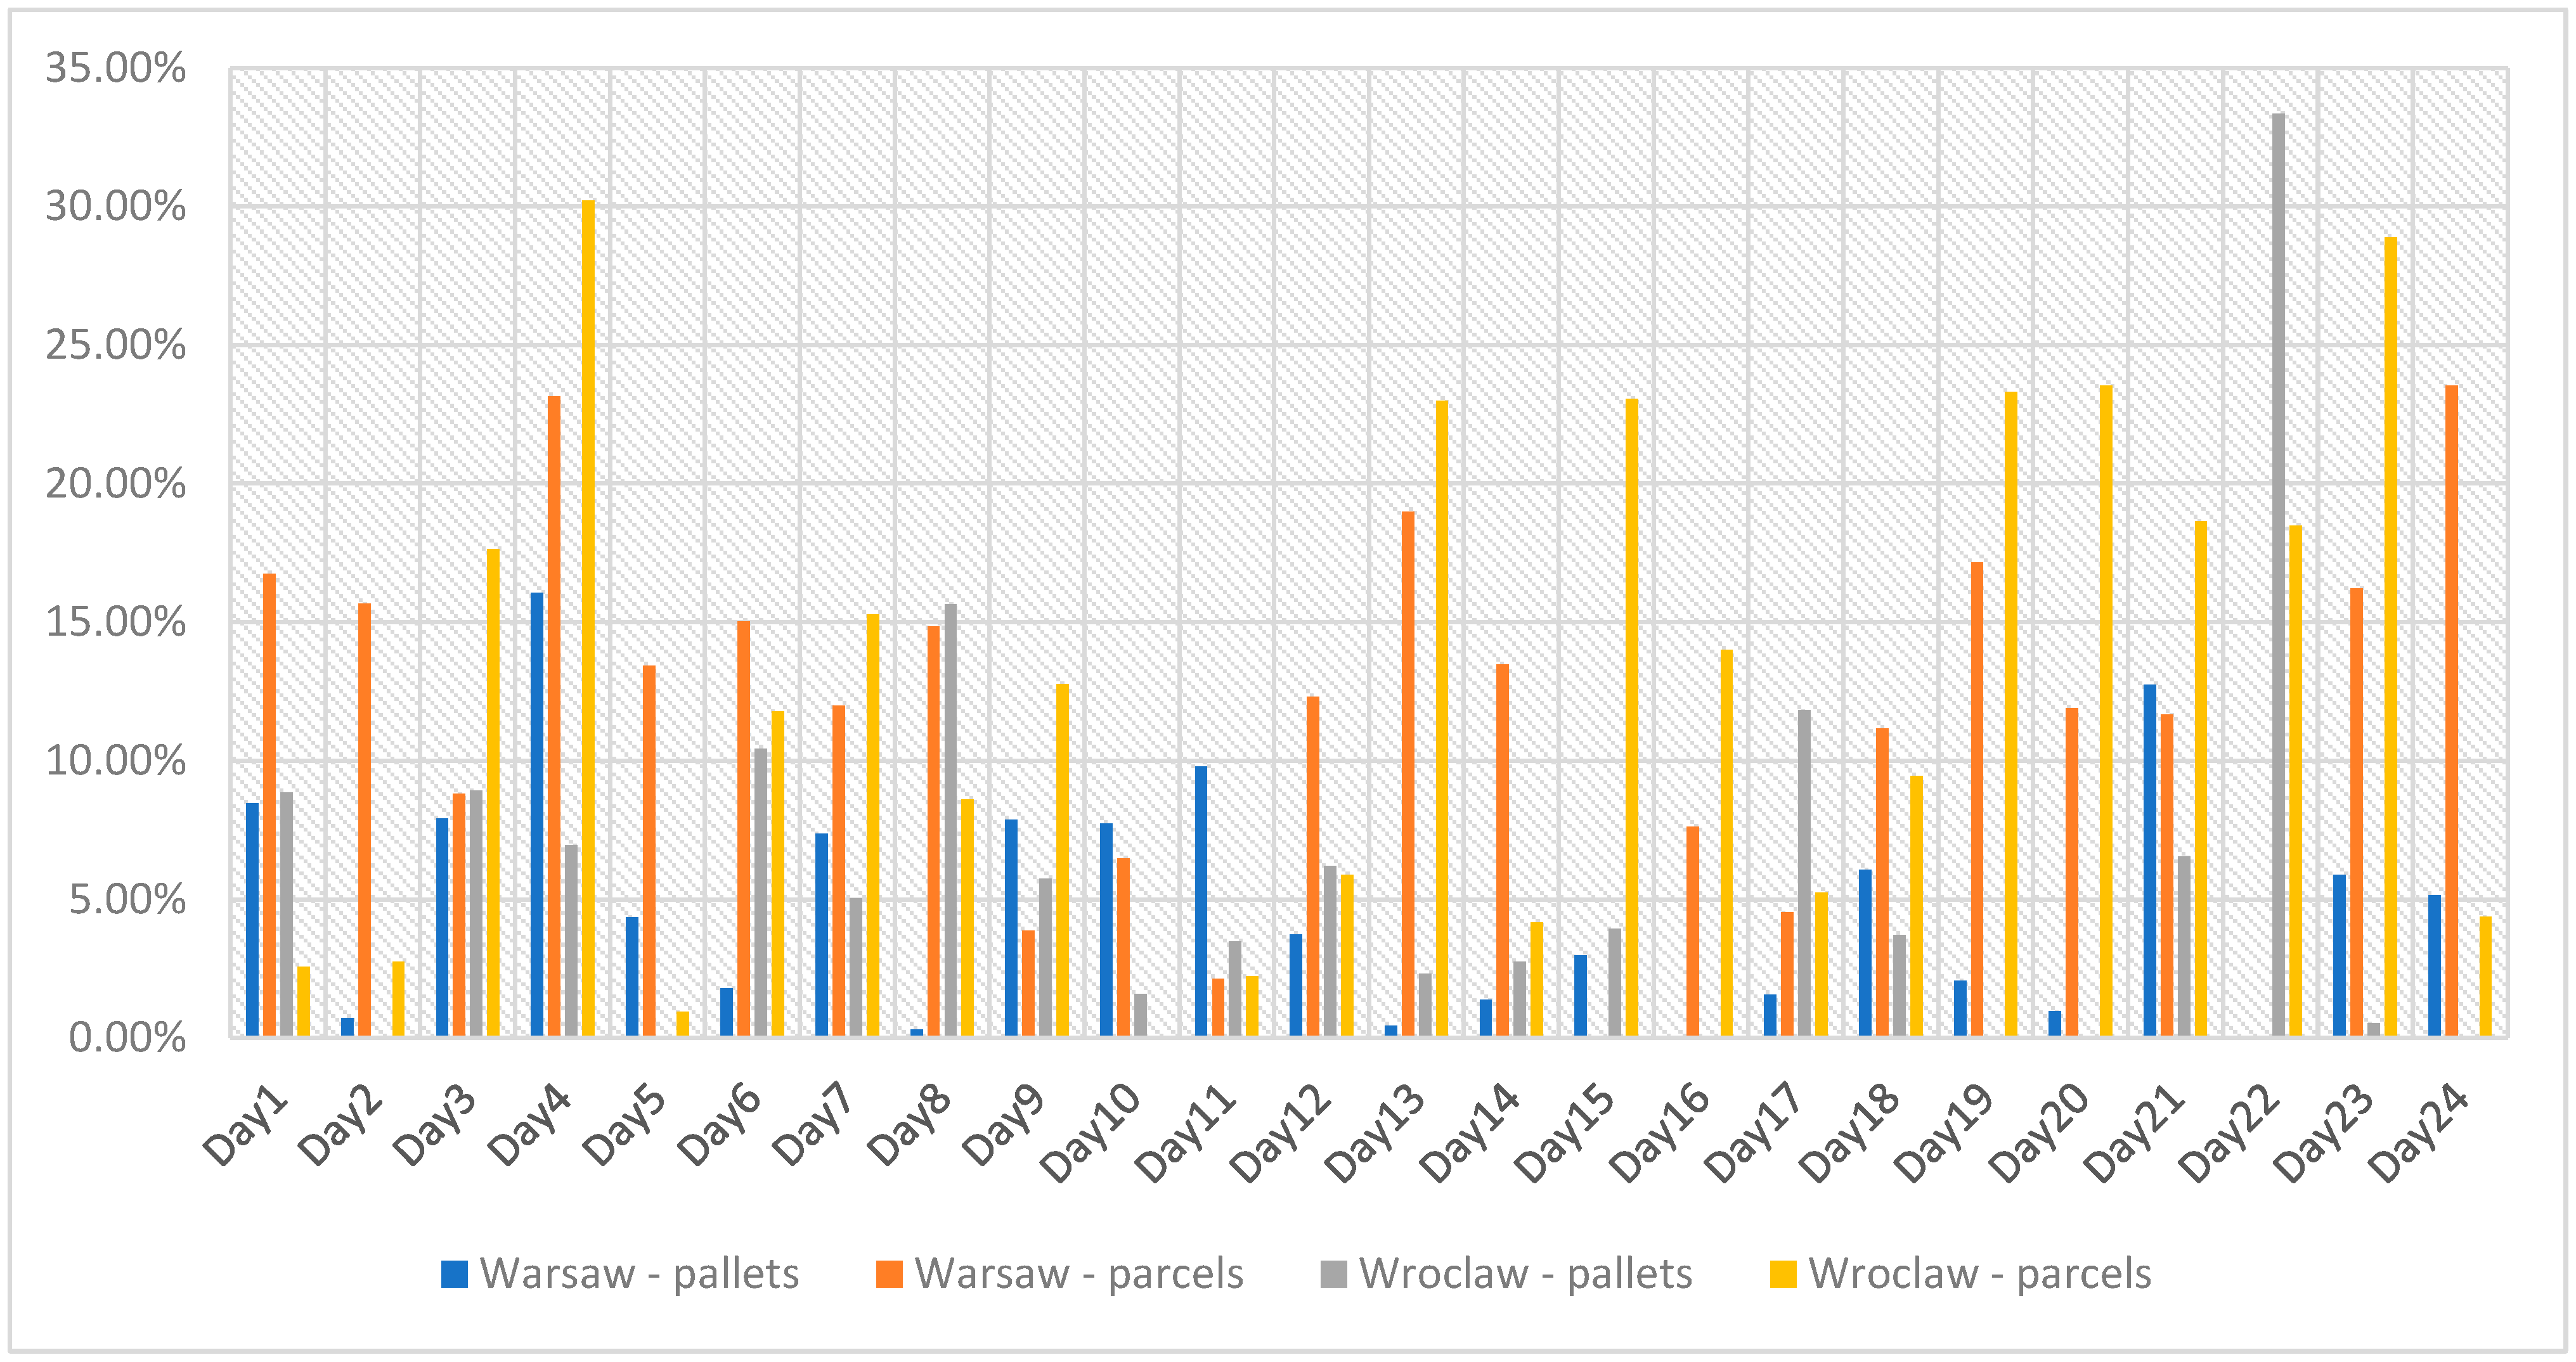
| Percentage of Delivery Days in the Total Work Days | Number of Reception Points (Postal Codes) | |
|---|---|---|
| City Warsaw | City Wroclaw | |
| 0.00–25.00% | 2513 | 771 |
| 25.00–50.00% | 69 | 69 |
| 50.00–75.00% | 21 | 21 |
| 75.00–100.00% | 8 | 1 |
| Prediction Function in R Environment | Short Description |
|---|---|
| auto.arima() | Returns best ARIMA model according to information criteria (either AIC, AICc or BIC value). The function conducts a search over possible models within the order constraints provided. |
| nnetar() | Feed-forward neural networks with a single hidden layer and lagged inputs for forecasting of univariate time series. |
| ets() | Estimates the model parameters (error, trend, seasonality) and returns information about the fitted model. |
| City | Prediction Type | Prediction Parameter | ||
|---|---|---|---|---|
| MAPE | Algorithm (Chosen Based on Testing Part for Particular Time Series) | |||
| First Update | Second Update | |||
| Warsaw | pallets | 0.36% | nnetar() | nnetar() |
| parcels | 17.47% | nnetar() | nnetar() | |
| Wroclaw | pallets | 3.78% | auto.arima() | nnetar() |
| parcels | 4.03% | nnetar() | auto.arima() | |
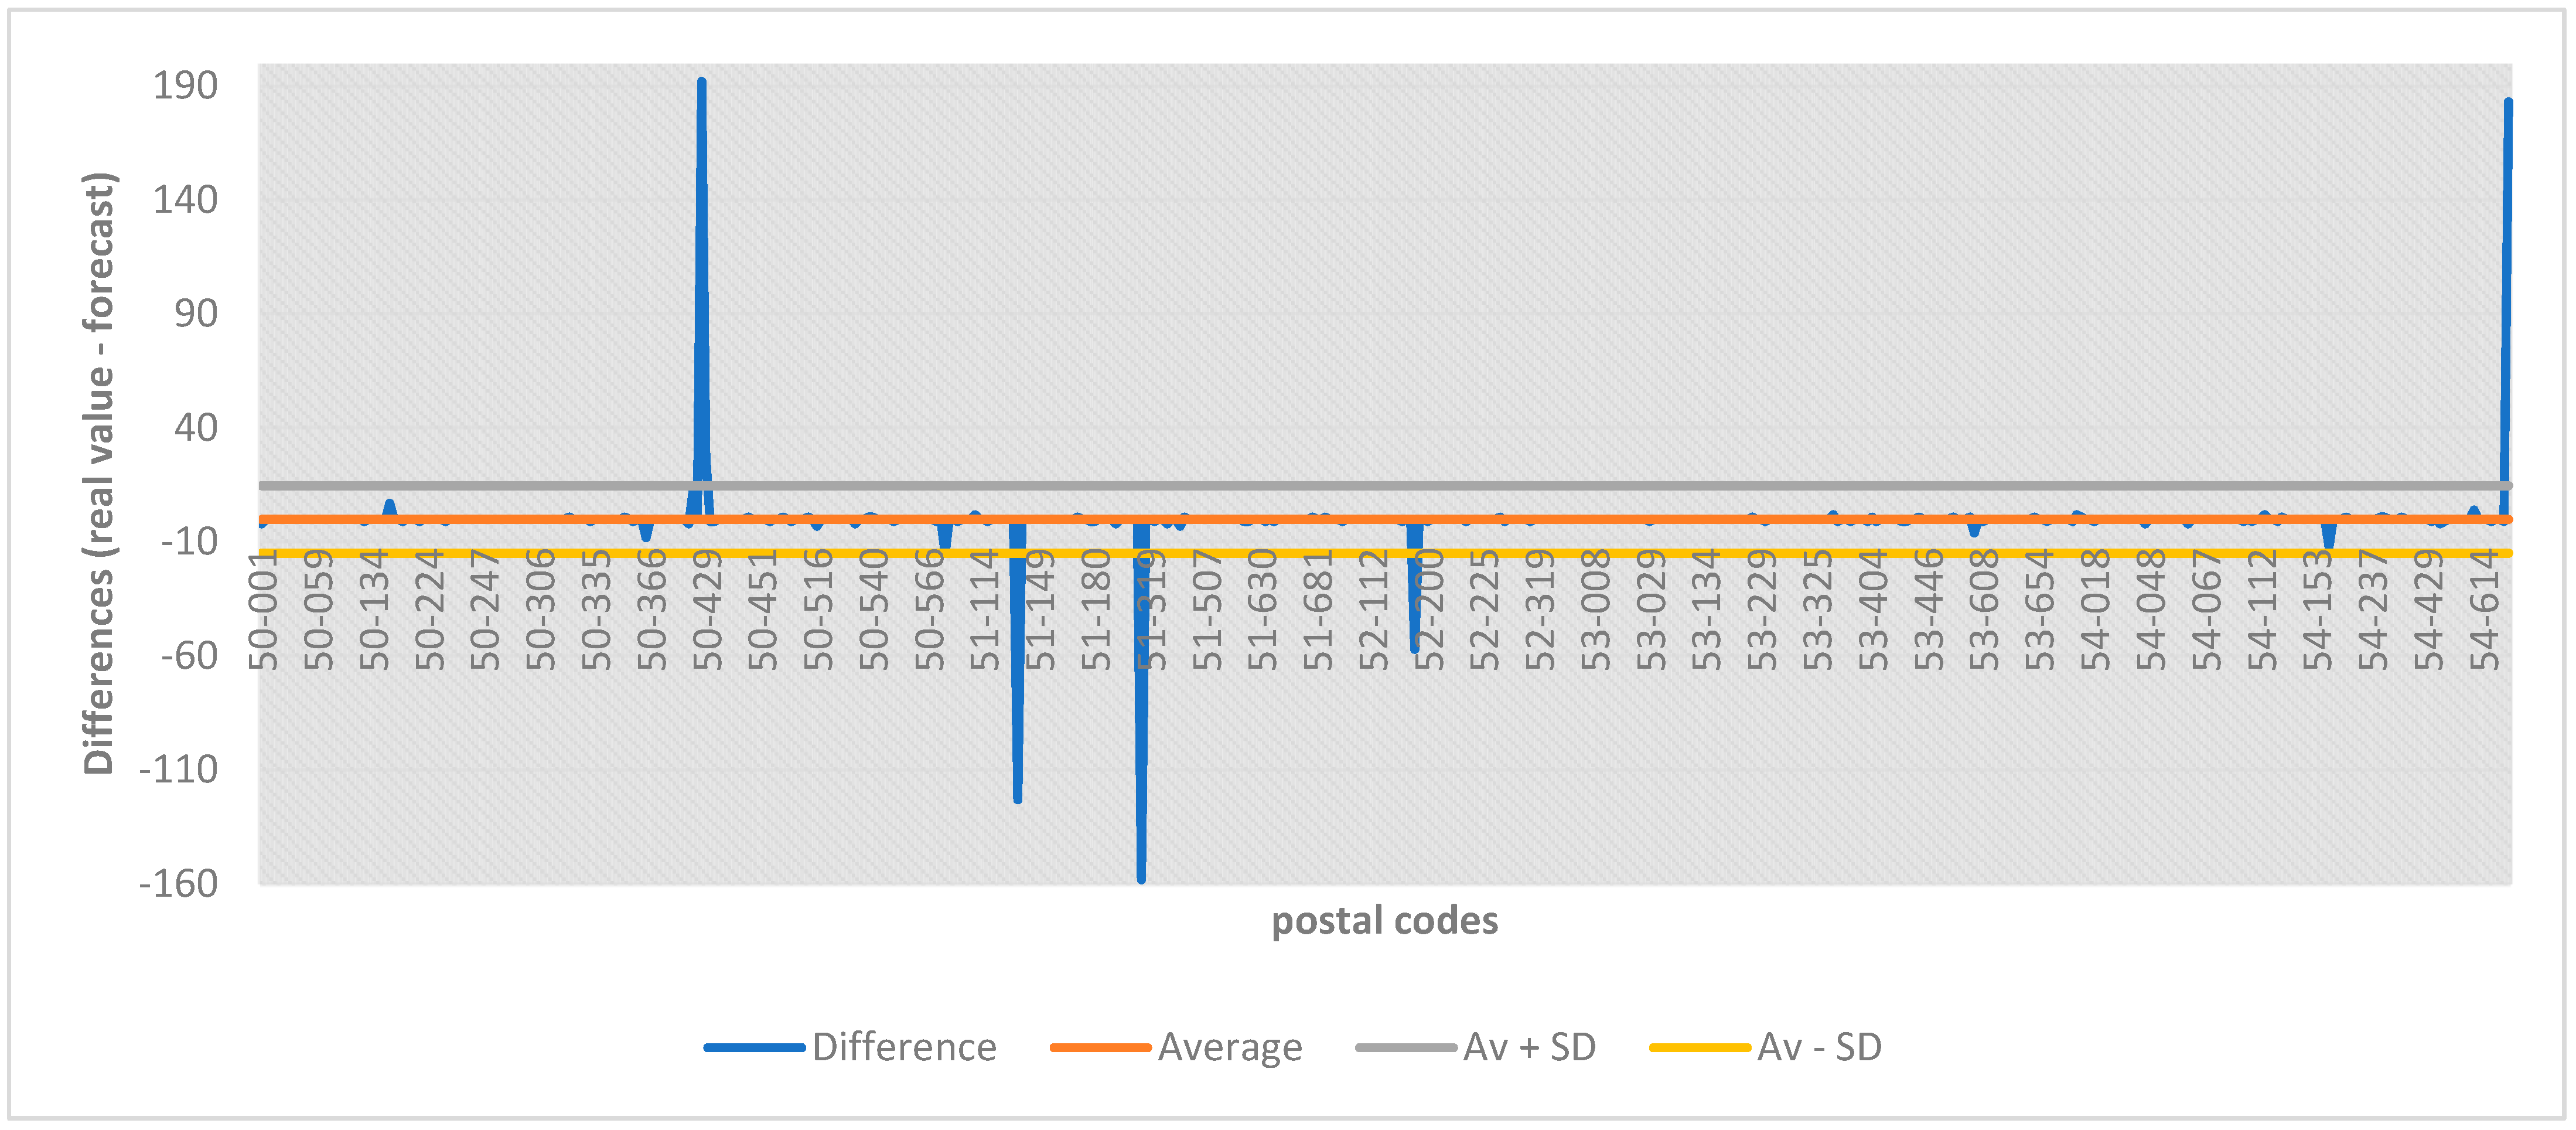
| City | Prediction Type | Average Difference | Av + SD | Av − SD |
|---|---|---|---|---|
| Warsaw | pallets | −0.09 | 2.52 | −2.69 |
| parcels | −0.30 | 16.25 | −16.86 | |
| Wroclaw | pallets | 0.15 | 1.85 | −1.56 |
| parcels | 0.02 | 14.80 | −14.77 |
Disclaimer/Publisher’s Note: The statements, opinions and data contained in all publications are solely those of the individual author(s) and contributor(s) and not of MDPI and/or the editor(s). MDPI and/or the editor(s) disclaim responsibility for any injury to people or property resulting from any ideas, methods, instructions or products referred to in the content. |
© 2024 by the authors. Licensee MDPI, Basel, Switzerland. This article is an open access article distributed under the terms and conditions of the Creative Commons Attribution (CC BY) license (https://creativecommons.org/licenses/by/4.0/).
Share and Cite
Kmiecik, M.; Wierzbicka, A. Enhancing Smart Cities through Third-Party Logistics: Predicting Delivery Intensity. Smart Cities 2024, 7, 541-565. https://doi.org/10.3390/smartcities7010022
Kmiecik M, Wierzbicka A. Enhancing Smart Cities through Third-Party Logistics: Predicting Delivery Intensity. Smart Cities. 2024; 7(1):541-565. https://doi.org/10.3390/smartcities7010022
Chicago/Turabian StyleKmiecik, Mariusz, and Aleksandra Wierzbicka. 2024. "Enhancing Smart Cities through Third-Party Logistics: Predicting Delivery Intensity" Smart Cities 7, no. 1: 541-565. https://doi.org/10.3390/smartcities7010022