Article

Predicting Autonomous Driving Behavior through Human Factor Considerations in Safety-Critical Events

Connected Urban Mobility, Technical University of Applied Sciences Aschaffenburg, 63743 Aschaffenburg, Germany
*
Author to whom correspondence should be addressed.
Smart Cities 2024, 7(1), 460-474; https://doi.org/10.3390/smartcities7010018
Submission received: 17 November 2023 / Revised: 24 January 2024 / Accepted: 30 January 2024 / Published: 1 February 2024

Abstract

:
This paper investigates the ability of autonomous driving systems to predict outcomes by considering human factors like gender, age, and driving experience, particularly in the context of safety-critical events. The primary objective is to equip autonomous vehicles with the capacity to make plausible deductions, handle conflicting data, and adjust their responses in real-time during safety-critical situations. A foundational dataset, which encompasses various driving scenarios such as lane changes, merging, and navigating complex intersections, is employed to enable vehicles to exhibit appropriate behavior and make sound decisions in critical safety events. The deep learning model incorporates personalized cognitive agents for each driver, considering their distinct preferences, characteristics, and requirements. This personalized approach aims to enhance the safety and efficiency of autonomous driving, contributing to the ongoing development of intelligent transportation systems. The efforts made contribute to advancements in safety, efficiency, and overall performance within autonomous driving systems. To describe the causal relationship between external factors like weather conditions and human factors, and safety-critical driver behaviors, various data mining techniques can be applied. One commonly used method is regression analysis. Additionally, correlation analysis is employed to reveal relationships between different factors, helping to identify the strength and direction of their impact on safety-critical driver behavior.

1. Introduction

Despite the increasing prevalence of vehicle automation, the persistently high number of car crashes remains a concern. Safety-critical events in human-driven scenarios have become more intricate and partially uncontrollable due to unforeseen circumstances. Investigating human driving behavior is imperative to establish traffic baselines for mixed traffic, encompassing traditional, automated, and autonomous vehicles (AVs). Various factors, such as weather conditions affecting visibility in longitudinal car-following (CF) behavior [1,2], influence human driving behavior [3].
Car-following behavior, illustrating how a following vehicle responds to the lead vehicle in the same lane, is a crucial aspect. Existing car-following models often make assumptions about homogeneous drivers, neglecting significant heterogeneity in driving experience, gender, character, emotions, and sociological, psychological, and physiological traits. Failing to account for this heterogeneity hampers a comprehensive understanding of car-following behavior, limiting model accuracy and applicability. In the development of more realistic car-following models for mixed traffic, acknowledging the diversity among drivers is crucial. By including individual variations such as risk-taking tendencies, reaction times, decision-making processes, and driving styles, the modeling of real-world driving complexities can be improved. Simplifying drivers into a few categories overlooks the richness and variety of their characteristics, prompting the need for a more comprehensive approach to capture nuances within different driver profiles. To address these limitations, models should effectively incorporate both external heterogeneity among different drivers and internal heterogeneity within a single driver. The proposed model relies on personalized cognitive agents, assigning each driver a unique cognitive agent capable of representing their profile by accessing local information and learning characteristics. These agents process individual user preferences, characteristics, and needs, with the goal of providing tailored and customized experiences in operating a cognitive vehicle. This approach considers the distinct requirements and individual preferences of autonomous vehicle occupants while gaining a better understanding of the driving behavior of surrounding vehicles in mixed traffic scenarios [3]. The subsequent sections of this paper are organized as follows: Section 2 provides an overview of related research; Section 3 details the methodology; and Section 4 and Section 5 present a performance evaluation and the study’s conclusions.

2. Related Research

The literature encompasses various driving models [3,4], with many attempting to simulate a real driver’s road tracking performance by making assumptions about inputs and outputs. These models aim to capture the decision-making processes and behaviors of drivers, including responses to changes in the road and traffic induced by external factors. A cognitive vehicle, equipped with onboard sensors to observe the driving behavior of surrounding vehicles [5], plays a role in recognizing driving maneuvers. It is acknowledged that driving behavior models involve a level of uncertainty due to their reliance on assumptions and approximations of real-world driver behavior. Additionally, they are influenced by the inherent uncertainties associated with onboard sensor measurements and subsequent feature extraction that characterize the surrounding objects [6]. This uncertainty can significantly impact the performance of control systems designed based on these models. A viable approach to tackle this issue is the development of models capable of predicting and managing uncertainties inherent in driving scenarios.
This includes modeling the driving behaviors of human drivers and automated or autonomous vehicles, and external and other factors that can affect driving performance. Driving behaviors are the main cause of road accidents and one of the main sources of insurance claims [7]. Wang and Lu [8] found that the differences in driving behavior between males and females have remained unchanged or have increased in some aspects. The differences involved traffic accidents and offenses, with driving times, attitudes, education, and other background factors controlled for. Furthermore, all drivers are involved in traffic accidents and fatalities; however, younger drivers have the highest rate of accidents. Hiang and Ming [9] investigated the relationship of age and gender to speeding. Younger drivers exhibit the highest accident rates, as highlighted in [10]; they are notably over-represented in traffic accidents and fatalities and are more prone than older drivers to be at fault in the accidents that involve them. Furthermore, it is well-documented that men and women tend to display distinct driving behaviors. The literature consistently evidences higher crash rates among male drivers than among their female counterparts [11,12]. These disparities in driving patterns and accident rates among age and gender groups underscore the importance of tailoring safety measures and interventions to enhance road safety for all. The objective of this study was to explore the relationships between age and gender and speeding behavior. The findings revealed that, on average, young and male drivers tended to maintain higher speeds than their older and female counterparts before entering a roundabout and upon exiting it. This insight sheds light on the distinct driving patterns associated with different age and gender groups, underscoring the need for targeted interventions to address speeding behaviors and enhance road safety. In [13], the primary objective was to examine the factors influencing aggressive driving behavior, with a particular focus on age, driving experience, and additional covariates. To achieve this, regression analysis was employed to assess how age and driving experience, as well as their potential interactions with other covariates, contributed to the manifestation of aggressive driving behavior. This comprehensive analysis aimed to provide valuable insights into the complex interplay of variables affecting driver behavior and aggression on the road. Driving behaviors, as discussed in [14], constitute a primary contributor to road accidents and represent a significant source of insurance claims. The results show that young and male drivers, on average, travel at a higher velocity than older and female drivers before entering a roundabout and accelerate to a higher velocity upon exiting. Lee et al. [15] investigated the relationship between crash severity and the age and gender of the at-fault driver, the socio-economic characteristics of the surrounding environment, and road conditions. They adopted the logit regression model, using age as a continuous variable to investigate how age has an impact on accident severity and to uncover situations where age has little effect. Shahverdy et al. [16] introduced a deep learning method for analyzing driver behavior focusing on driving signals, including acceleration and speed, to recognize five types of driving styles: normal, aggressive, distracted, drowsy, and drunk. Liu et al. [17] examined factors that influence aggressive driving behavior, such as human factors, personality traits, and demographic characteristics. Regression analysis was used to explore the impacts of age and driving experience and their interactions with other variables in relation to aggressive driving behaviors. Aggressive driving behavior is influenced by a combination of human factors, including age, driving experience, personality traits, and demographic characteristics. The analysis revealed a negative correlation between age and aggressive driving behaviors; namely, as individuals grow older, they tend, on average, to engage in fewer aggressive driving behaviors. The study also found a positive correlation between the personality trait of neuroticism and aggressive driving behaviors; that is, individuals with higher levels of neuroticism, characterized by emotional instability and heightened negative emotions, are more likely to exhibit aggressive driving tendencies. Significant associations were identified among age, driving experience, and depression. This suggests that older, more experienced drivers may be less prone to depression, potentially reducing their likelihood of engaging in aggressive driving behaviors. In the scenario of car-following models, artificial intelligence tools are utilized as effective tools to depict different aspects and behaviors of drivers. Previous studies have introduced a novel non-monotonic logic-based approach for car-following in Autonomous Vehicles (AVs) [18,19]. This approach involves the creation of a reasoning system that incorporates non-monotonic inference mechanisms specifically designed to handle uncertainties and exceptions within car-following scenarios. The experimental results of this approach illustrate an improved adaptability and decision-making performance when compared to traditional rule-based systems. Researchers implemented an adaptive car-following system using non-monotonic logic to enhance reasoning and decision-making capabilities. This system integrates context-dependent rules and non-monotonic inference mechanisms, effectively managing exceptions and conflicting information during car-following. Simulation results demonstrate heightened safety and efficiency across various traffic scenarios.
This study explores the integration of non-monotonic logic into car-following algorithms, as illustrated in Figure 1. It proposes an architecture that combines rule-based reasoning with non-monotonic inference mechanisms to address uncertainties and modify the behavior of AVs during car-following. The experimental evaluations reveal improved performance and adaptability, particularly under dynamic traffic conditions.
The paper offers a comprehensive overview of the challenges and opportunities associated with applying non-monotonic reasoning to car-following by AVs. It critically examines the limitations of traditional rule-based systems and underscores the benefits of non-monotonic logic in managing uncertainties, conflicting data, and context-dependent reasoning. Additionally, the paper identifies potential avenues for future research and explores other applications of non-monotonic reasoning within the realm of autonomous driving.

3. Methodology

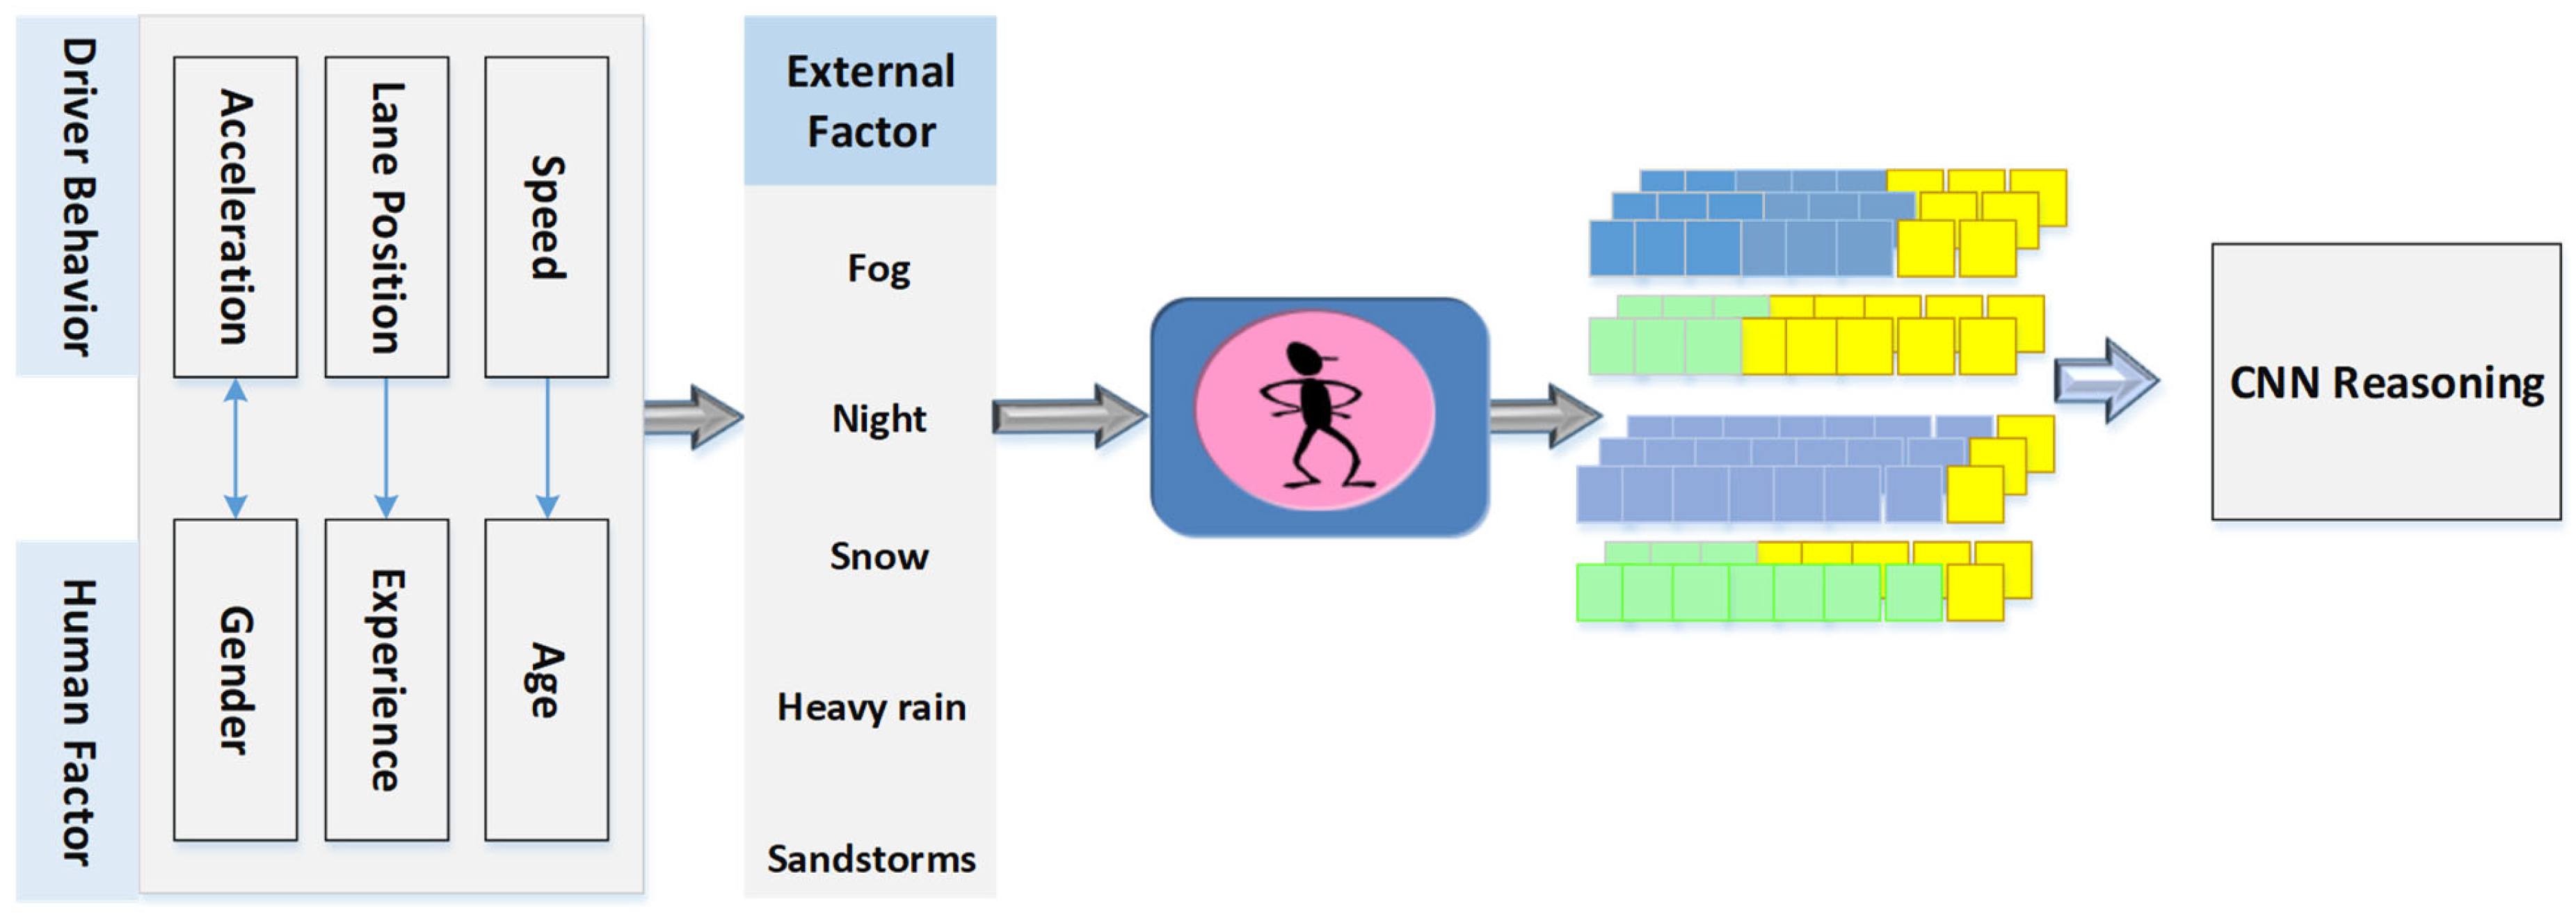
3.1. The CNN Reasoning Approach

Reasoning and decision-making tasks benefit from the application of Convolutional Neural Network (CNN) reasoning, as demonstrated in recent studies [19]. The conventional CNN architecture typically comprises multiple convolutional layers succeeded by fully connected layers. These layers operate collaboratively to learn hierarchical representations of input data, allowing the network to discern intricate patterns and features. To enhance reasoning capabilities, CNNs can be extended or combined with additional components.
This extension often involves the incorporation of supplementary layers, such as Recurrent Neural Networks (RNNs) or attention mechanisms. These additions help the network capture temporal or spatial dependencies, facilitating sequential reasoning [20]. Additionally, CNNs are adept at visual reasoning tasks, where the model is trained to reason about relationships between objects. Through the learning process, the model extracts meaningful features from input data and utilizes them to infer relationships and draw logical deductions. In the case of AVs, these features are likely derived from various sources of information, such as sensor data, video feeds, and other data related to a driver’s behavior and the surrounding environment. The goal of feature extraction is to transform raw data into a format that the model can work with effectively. These extracted features can include elements like a vehicle’s speed, position, and orientation, road conditions, weather conditions, and more. Here, a hybrid approach is proposed, which combines multiple techniques to create more accurate and robust driver models, such as the one illustrated in Figure 1. A hybrid model uses deep learning to find causal relationships between a statistical model and human factors such as age, gender, experience, and driving behavior, collected through feature extraction, to predict a driver’s speed and acceleration, but also incorporates rule-based logic to handle unexpected situations, as illustrated in Figure 2. One of the challenges in modeling driver behavior is dealing with unexpected or uncommon situations on the road. To do this, rule-based logic is incorporated into the model. These rules act as a safety net and provide the model with guidelines on how to react in situations that may not be well represented in the training data. This hybrid approach combines the strengths of different techniques to create a comprehensive driver model. It uses deep learning to understand causal relationships, statistical modeling for making predictions, and rule-based logic for handling unexpected scenarios, ultimately improving the accuracy and robustness of the model’s predictions and inferences related to driver behavior.

3.2. Data Collection

The dataset used in this research is based on naturalistic driving data taken from the L3Pilot database [21]. The data consists of performance indicators for four driving scenarios: free driving, following a lead vehicle, driving in traffic jams, and changing lanes. The data used for training the deep learning algorithm involves cleaning and formatting the data, selecting relevant features, and splitting the dataset into training, validation, and testing sets. The piloting operations were extensive and involved a significant amount of data collection and processing, with a focus on both motorway and urban environments. L3Piloting operations were conducted at 14 pilot sites across 7 European countries, involving more than 750 test subjects and testing 70 vehicles. The focus was on collecting motorway data, resulting in 2267 h of such data, with 1808 h deemed suitable for upload to the Common Data Environment (CDB). Some data was excluded either because it fell outside the Operational Design Domain (ODD) of the piloted Automated Driving Function (ADF) or due to issues with data quality. Specifically for Urban ADF, 1120 h were spent driving within urban environments, including 130 h dedicated to baseline data collection. The delivered dataset from these urban operations comprised 638 h of data, which were subsequently used for data evaluation.

3.3. Algorithm Description

Our approach is a hybrid algorithm, outlined in Figure 3, consisting of two distinct phases. By employing deep learning techniques to analyze extensive datasets of human and vehicle behavior, one can uncover intricate patterns and causal relationships that may be challenging to detect using conventional statistical methods.
Statistical tools are then applied to assess the performance of the prediction scheme. The model predicting a driver’s behavior during car-following operates in terms of certainty and uncertainty. Certainty in car-following increases when the driver is familiar with the situation, and the leading vehicle maintains a consistent speed, appropriate acceleration and deceleration, and adherence to traffic rules. Conversely, uncertainty arises when the leading vehicle executes erratic or unexpected actions, such as sudden braking, lane changes without signaling, and unforeseen accelerations. Lack of information or incomplete information about road conditions, traffic situations, or the intentions of the leading vehicle can also contribute to uncertainty.
Drivers commonly rely on signals and visual cues from the leading vehicle to comprehend its intentions. When these cues are unclear or inconsistent, predicting the leading vehicle’s next move becomes challenging for the following driver. Addressing these sources of uncertainty is crucial for enhancing road safety and optimizing traffic flow.

3.4. Feature Extraction

One strategy involves leveraging deep learning models to extract features from data as described in Table 1. Subsequently, these features serve as input for various machine learning schemes, including nearest neighbor, random forest, naïve Bayesian network (NBN), decision table schemes, and others. The extraction of features based on naturalistic driving data holds pivotal significance for analyzing driving behavior, especially in the context of safety-critical events. While human driving behavior can be identified, its control is challenging. Human drivers are influenced not only by external factors, which can be estimated and predicted, but also by internal factors affecting cognition that are challenging to distinguish or control. In contrast, for Autonomous Vehicles (AVs), both internal and external factors are predictable, as depicted in Figure 4.
The trained CNN can construct a driver profile based on time headway. CNN classifies driver behaviors into three groups: normal, inattentive, and aggressive. To evaluate and validate the quality of the data-clustering results, we used the silhouette, a statistical technique [22] for graphically representing how well each object has been classified. For each driver, we calculated a silhouette score using the following formula:
S i = b i a i max ( a i , b i )
where ai, is the average distance from the ith point to the other points in the same cluster as i, and bi is the minimum average distance from the ith point to points in a different cluster, minimized over all clusters. The silhouette value is an internal criterion used for interpretating and validating consistency within a cluster of data; it measures how similar each point is to points in its cluster when compared to points in other clusters. Furthermore, we assigned a score rating the degree of a driver’s aggressiveness.

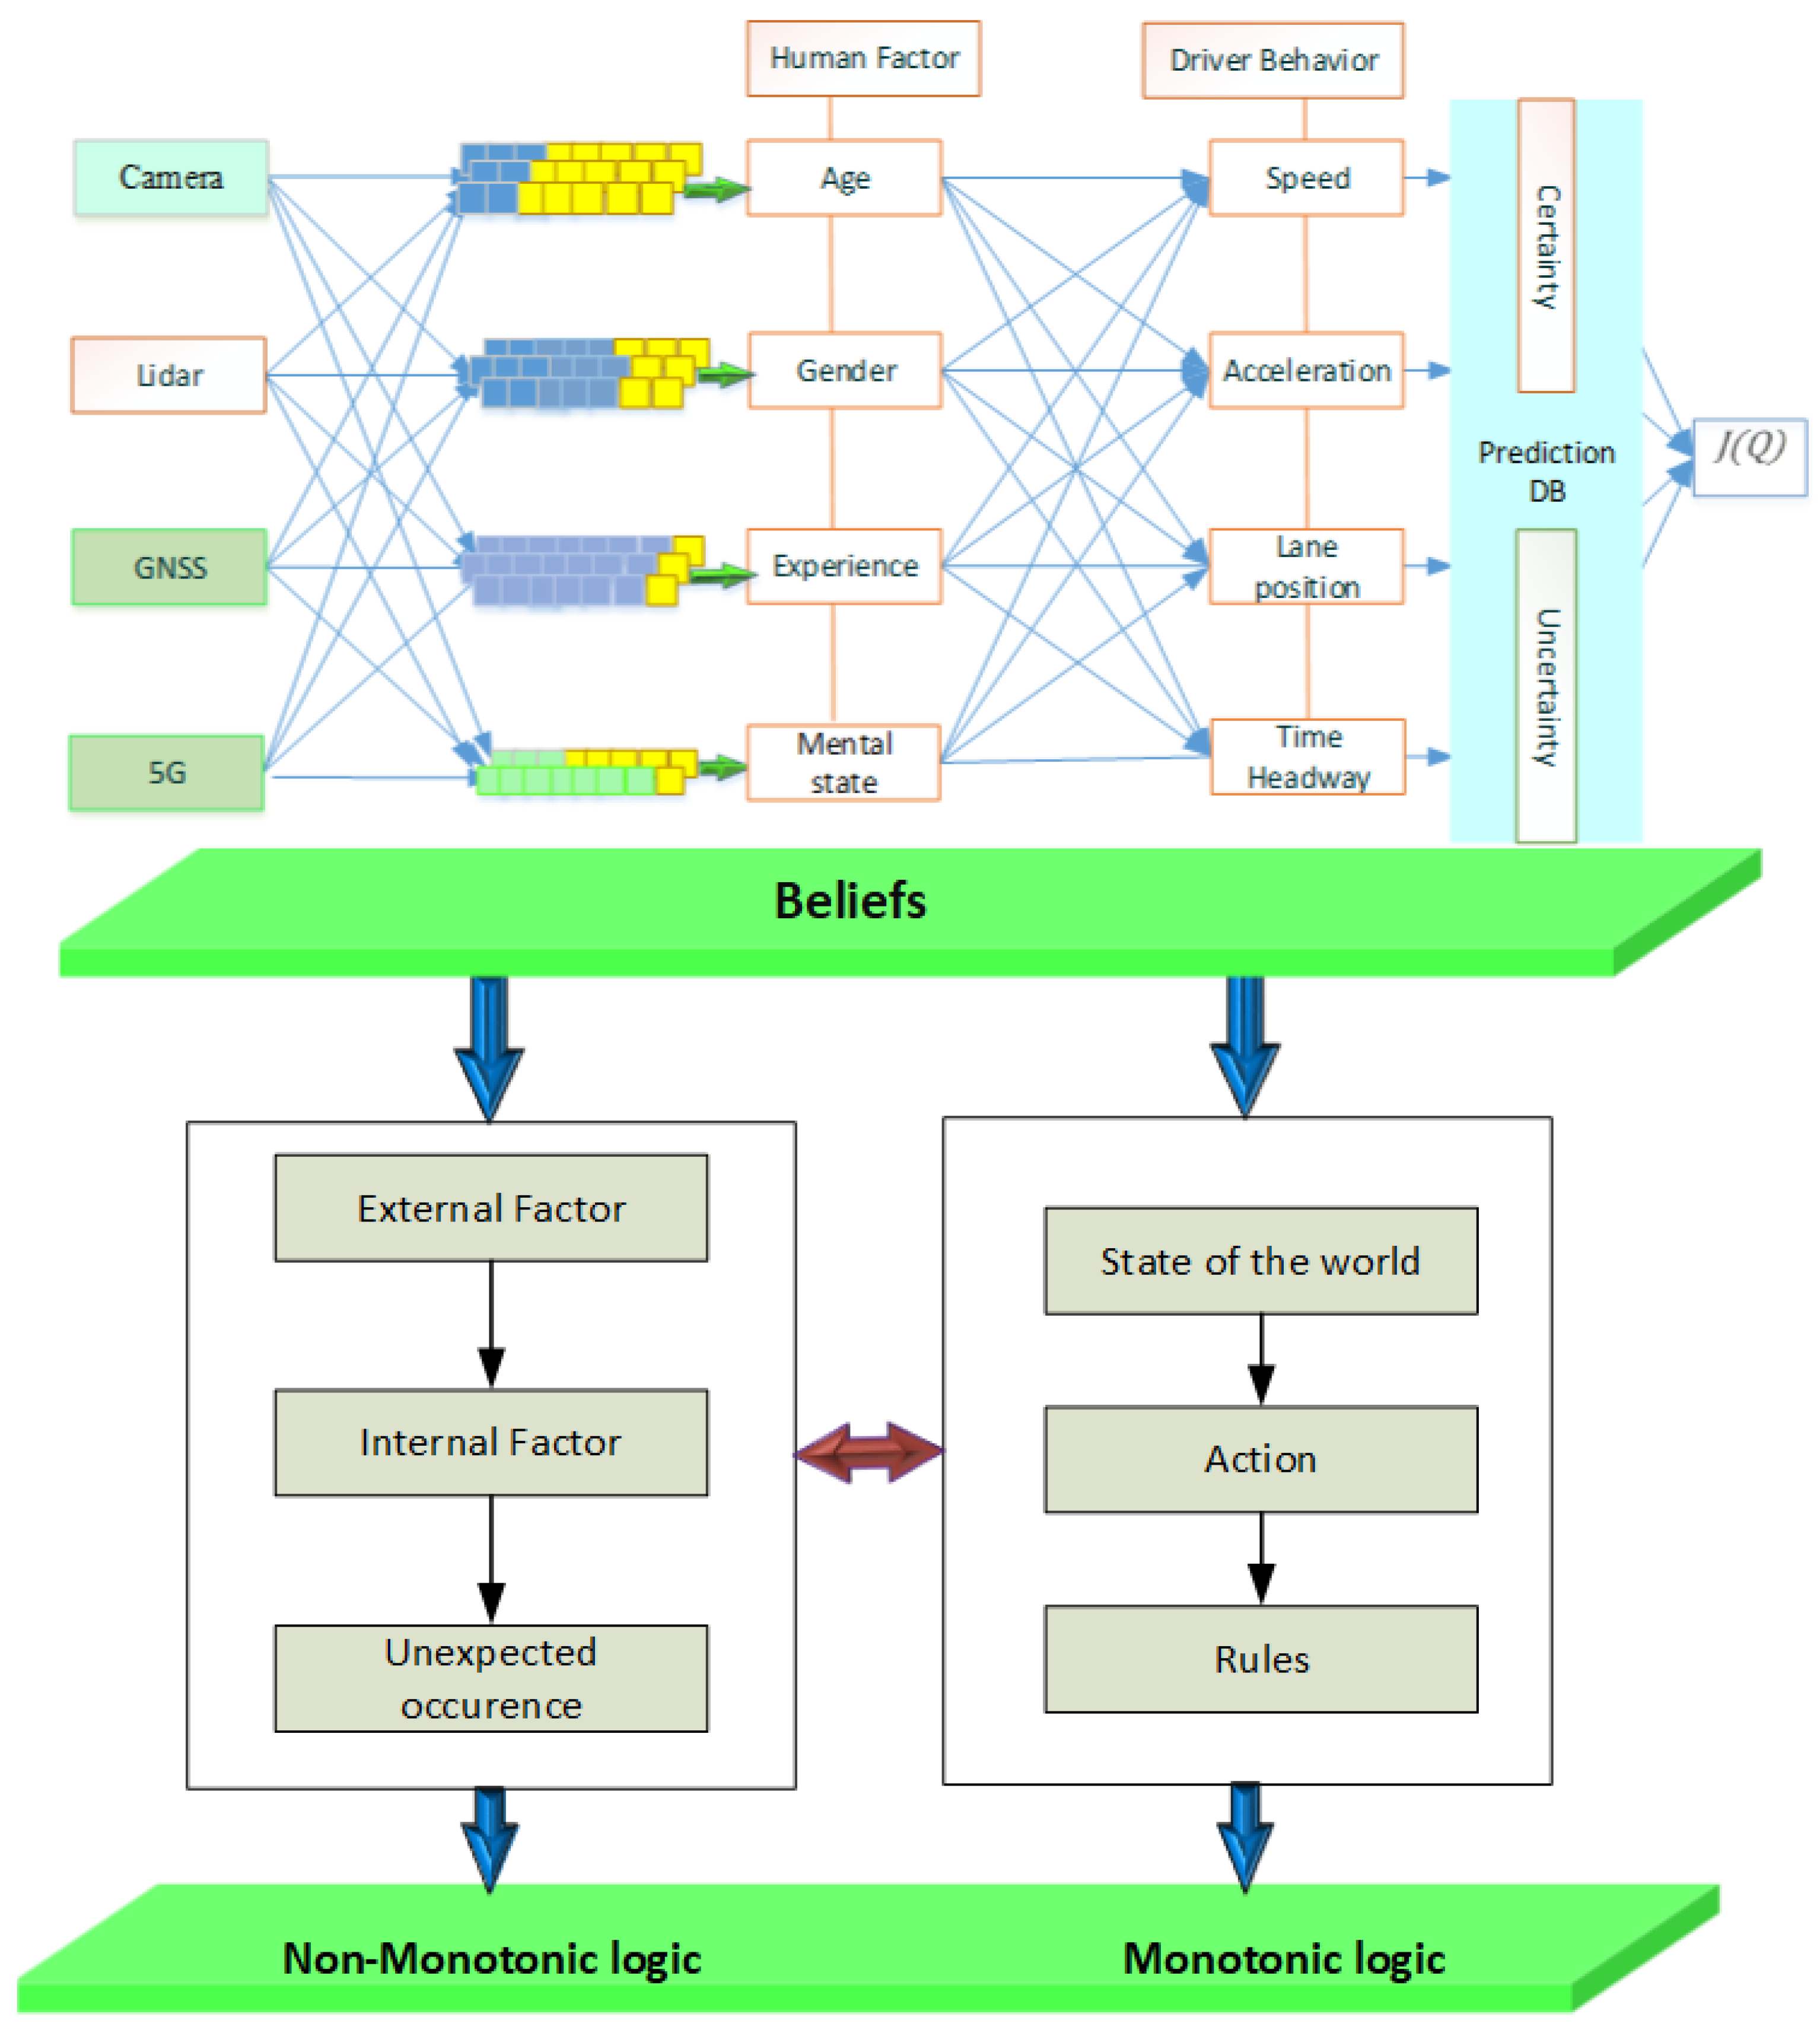
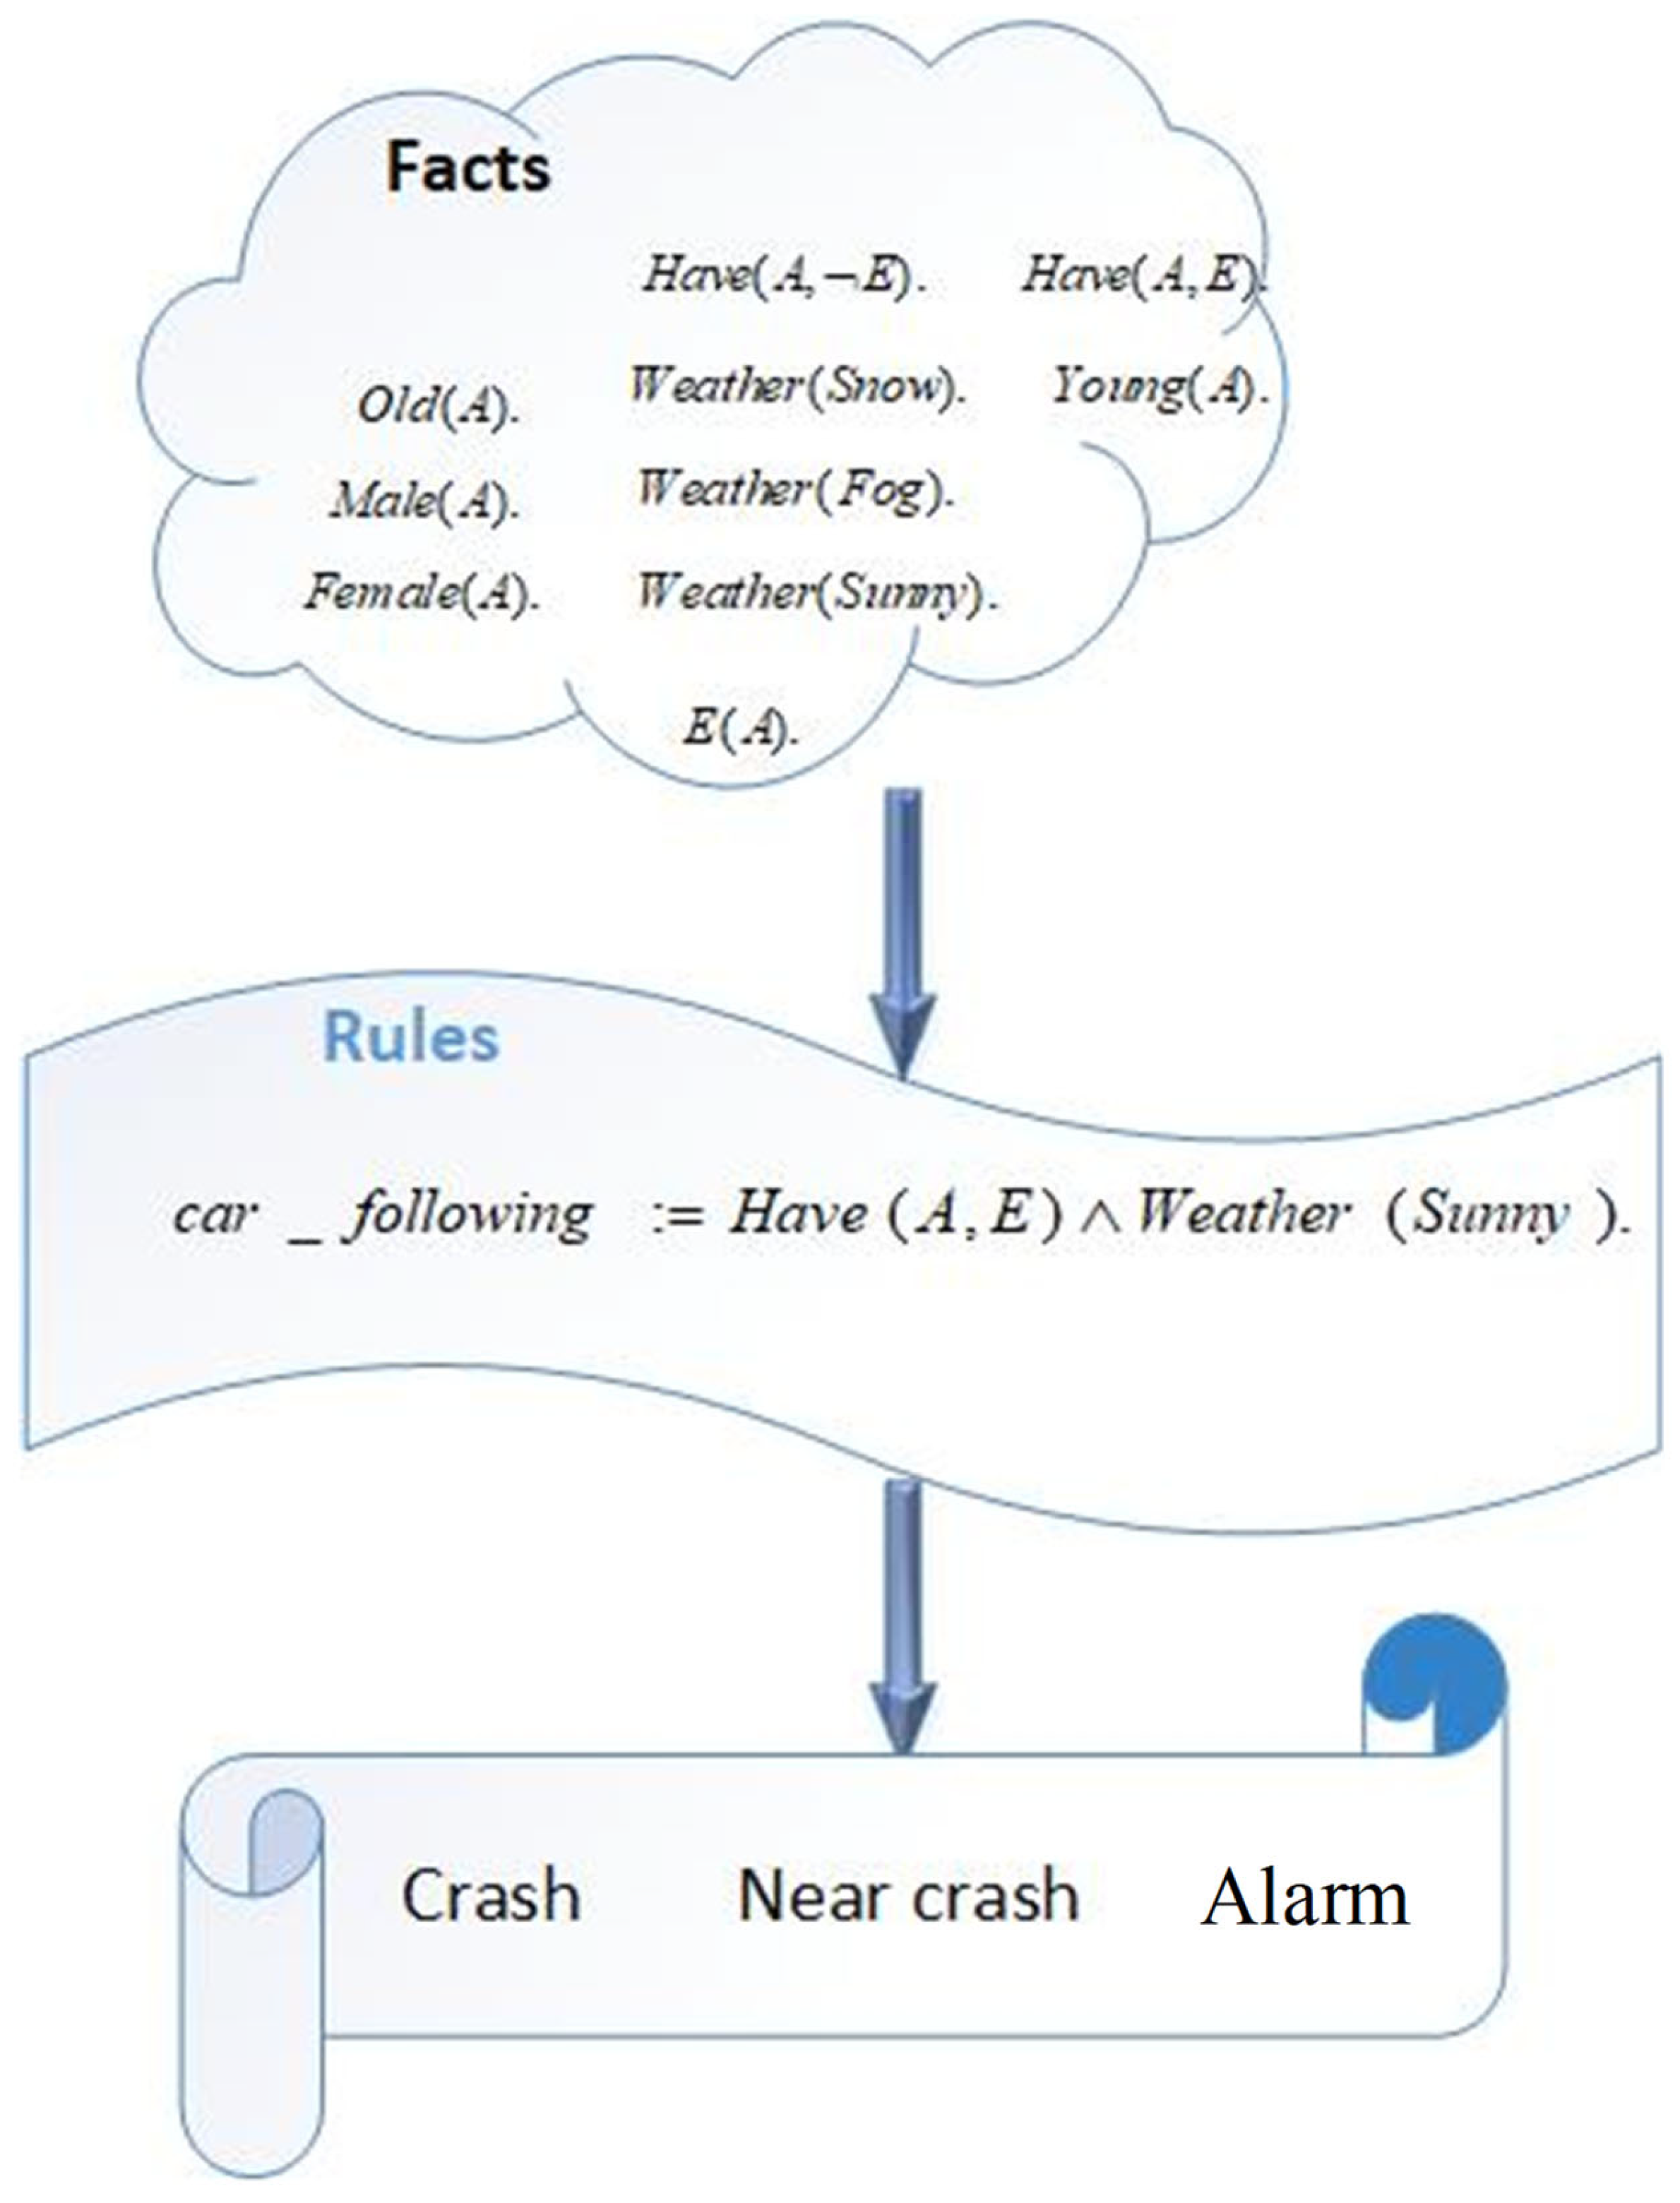
3.5. Reasoning-Based Non-Monotonic Logic

To address the constraints associated with monotonic logic, we advocate for the adoption of non-monotonic logic as a promising strategy to augment the reasoning capabilities of Autonomous Vehicles (AVs) during car-following scenarios. By integrating non-monotonic logic into AVs, they can engage in plausible inferences, manage conflicting data, and dynamically adapt their behavior to ensure safe and efficient car-following. The personalized cognitive agent alerts the autonomous control system based on the causal relationship between human factors and driver behavior related to time headway.
Non-monotonic logic offers flexible and adaptive reasoning, accommodating exceptions and context-specific information. Integrating non-monotonic logic into AVs empowers them to make plausible inferences, handle conflicting, uncertain, and incomplete data, and dynamically adapt their behavior for safe and efficient car-following.
The agent uses logical statements and facts to represent knowledge, which can come from various sources, including data, research, expert knowledge, and previous interactions with the driver, as illustrated in Figure 5. Logical statements are used to express the relationships among different variables or conditions, enabling the agent to make logical deductions based on the information provided. Facts are typically specific data points or pieces of information about the driver, the driver’s current state, the environment, and the vehicle. The agent uses the rules it formulated, the logical statements available, and facts to infer new information. In this context, inference refers to the process of drawing logical conclusions or making predictions based on the rules and the knowledge provided. The agent’s role is to reason and deduce how a driver’s human factors may lead to specific driving behaviors; for instance, it might infer that a tired driver is more likely to exhibit slower reaction times.

4. Discussion and Analysis

This section discusses the modeling of causal dependencies between human factors and driving behavior during car-following with the aim of keeping a time headway (THW) (the time distance between a leading and a following vehicle). The data provide evidence on the heterogeneity of human driving profiles as the mean of the THW ranges from near 0 s to 5 s, and the minimum of THW ranges from near 0 s to more than 3 s. Based on these preliminary findings, we propose the definitions of three profiles:
(i)
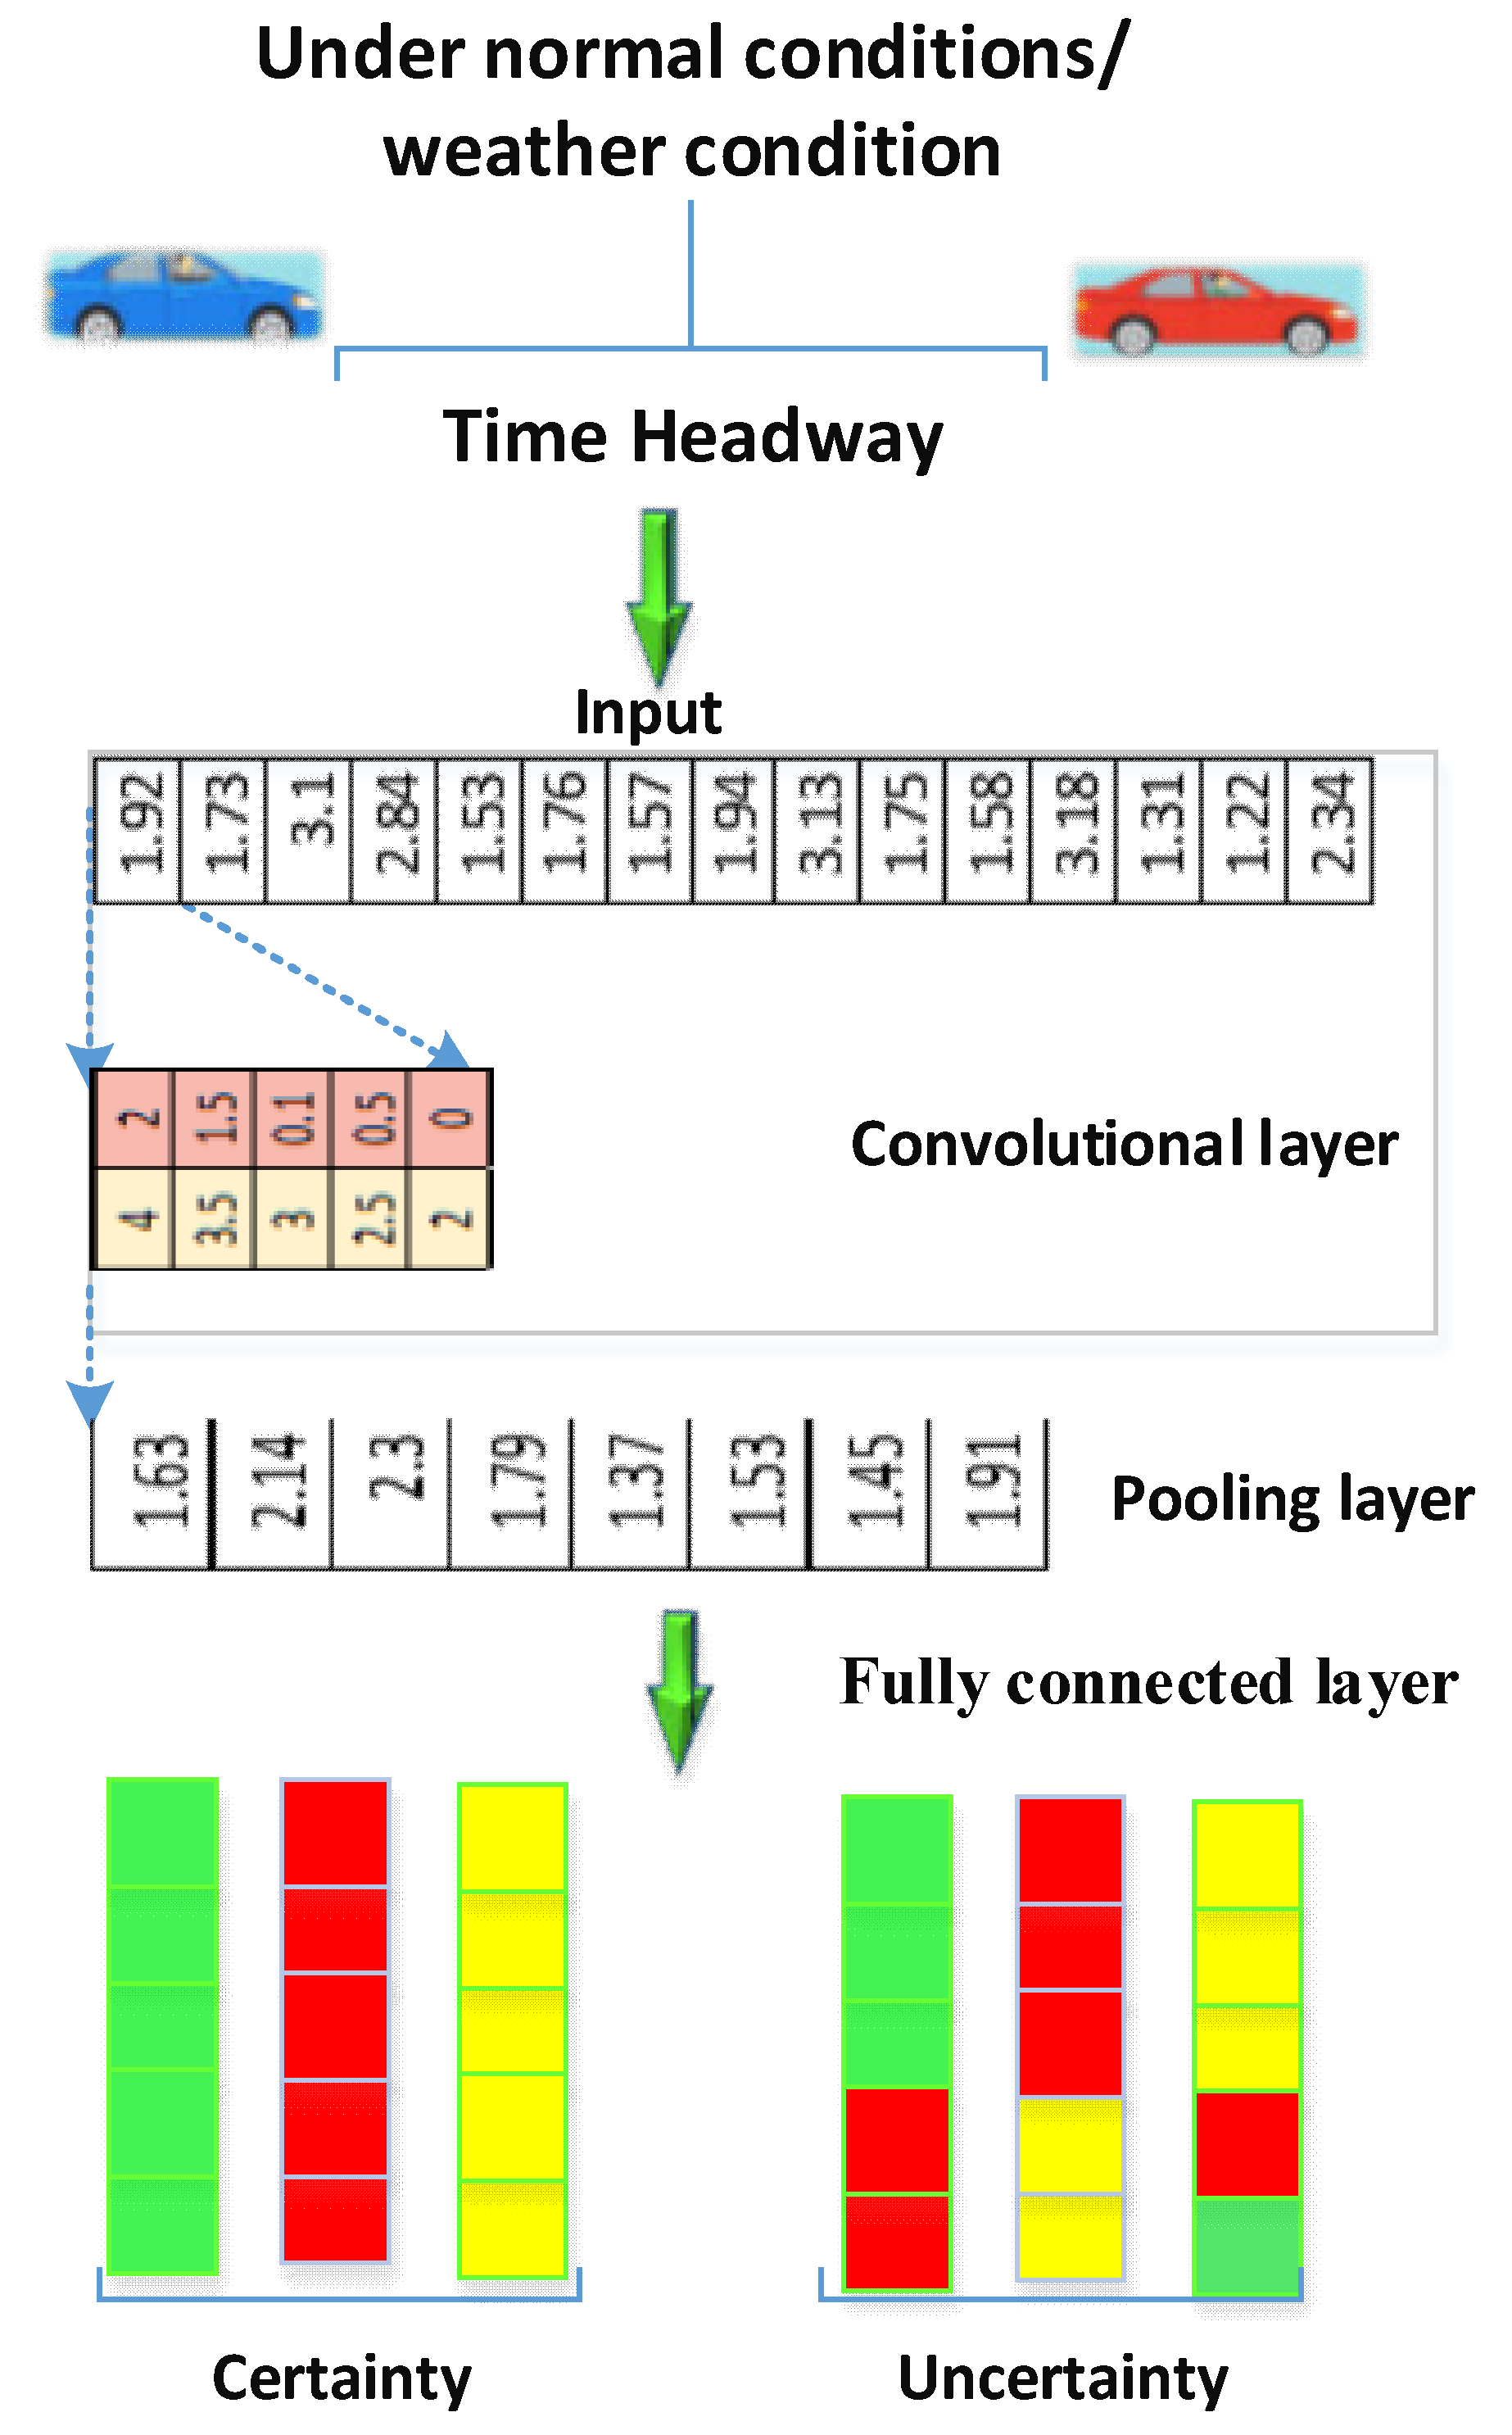
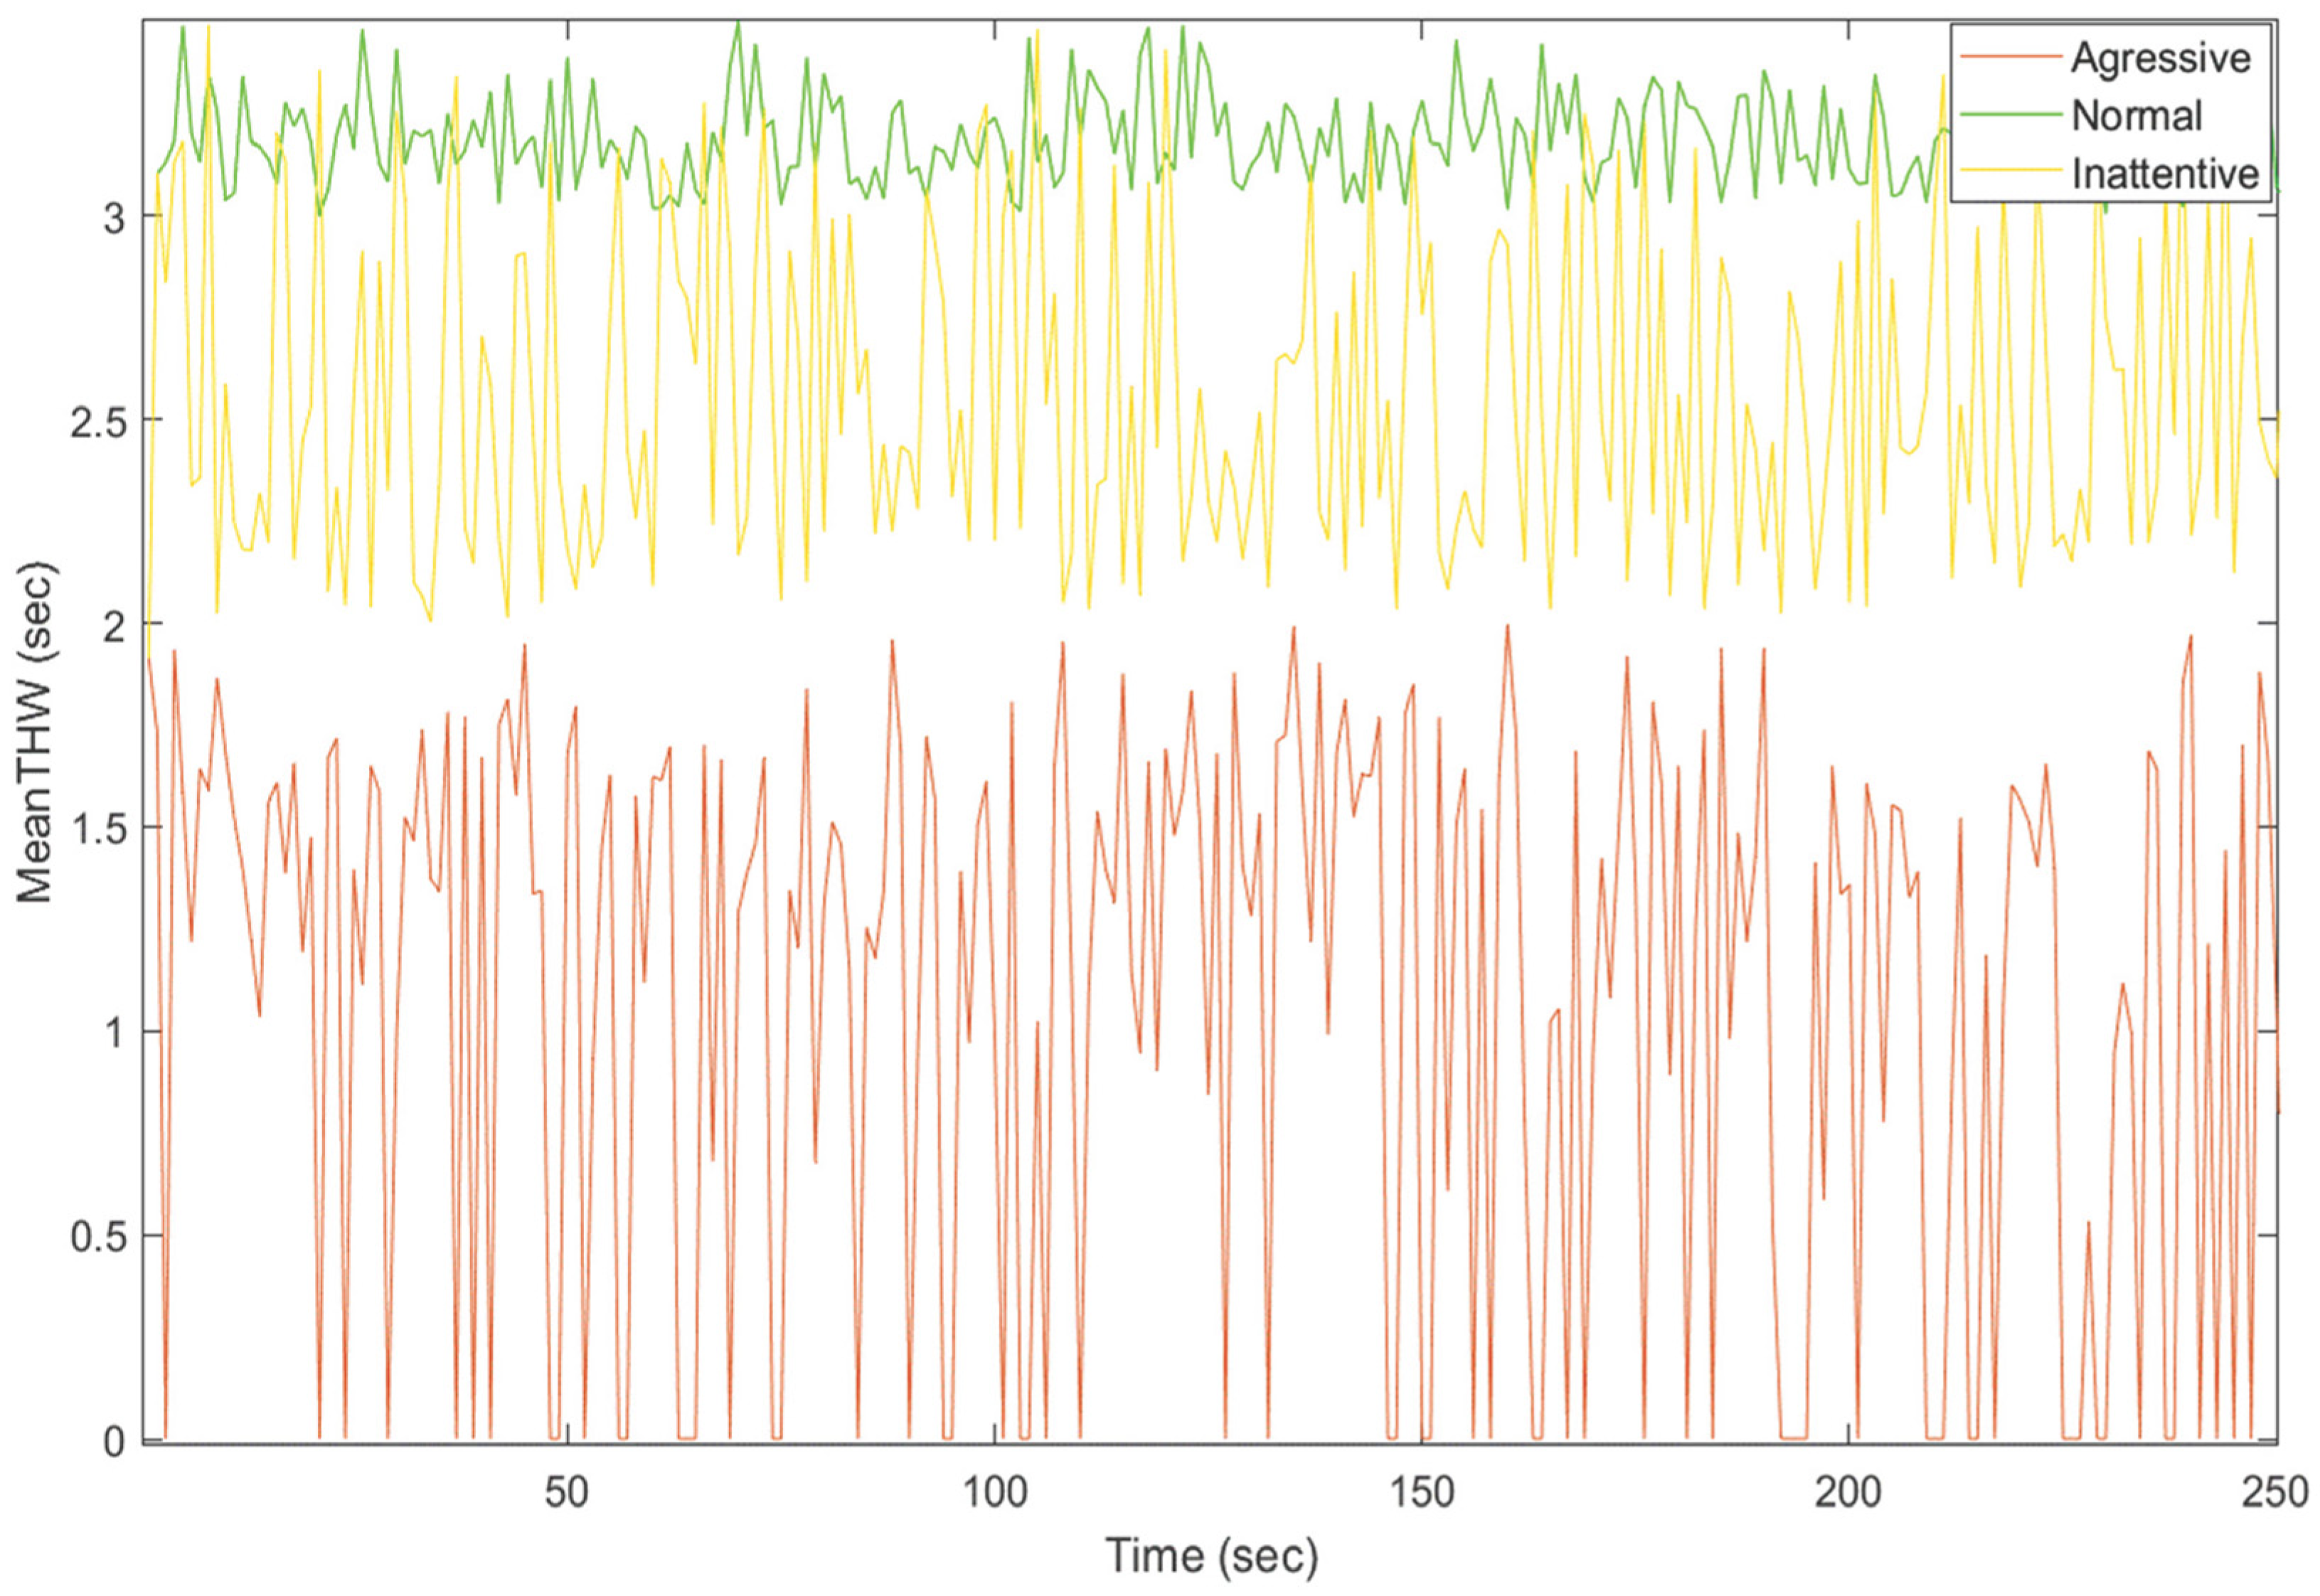
‘aggressive’: a shorter car time headway, (0–2 s);
(ii)
‘inattentive’: a longer reaction time (2–3 s);
(iii)
‘normal’ for intermediate values of reaction time and car time headway (longer than 3 s), i.e., maintaining adaptive cruise control, which is expressed in terms of adaptive relative distance [m] and constant relative speed [m/s].
The definitions of the two non-normal driver profiles (aggressive inattentive) are formalized below.
Aggressive driver profile: A driver i is considered to be aggressive with respect to a threshold t*, for the time headway THW if
T H W ¯ ( i ) : = 1 T t T T H W ( i , t ) < t * ,
where the time, T, (in seconds) = relative distance (m)/relative speed (m/s).
Inattentive driver profile (a driver with a long reaction time): A driver i is considered to be inattentive (with a long reaction time) with respect to a threshold t ˜ on the time headway THW if
min T H W ( i ) : = min t T H W ( i , t ) > t ˜
Normal driver profile: Drivers whose profiles are neither aggressive or inattentive are called normal. They have intermediate values for reaction time headway (e.g., <1 s).

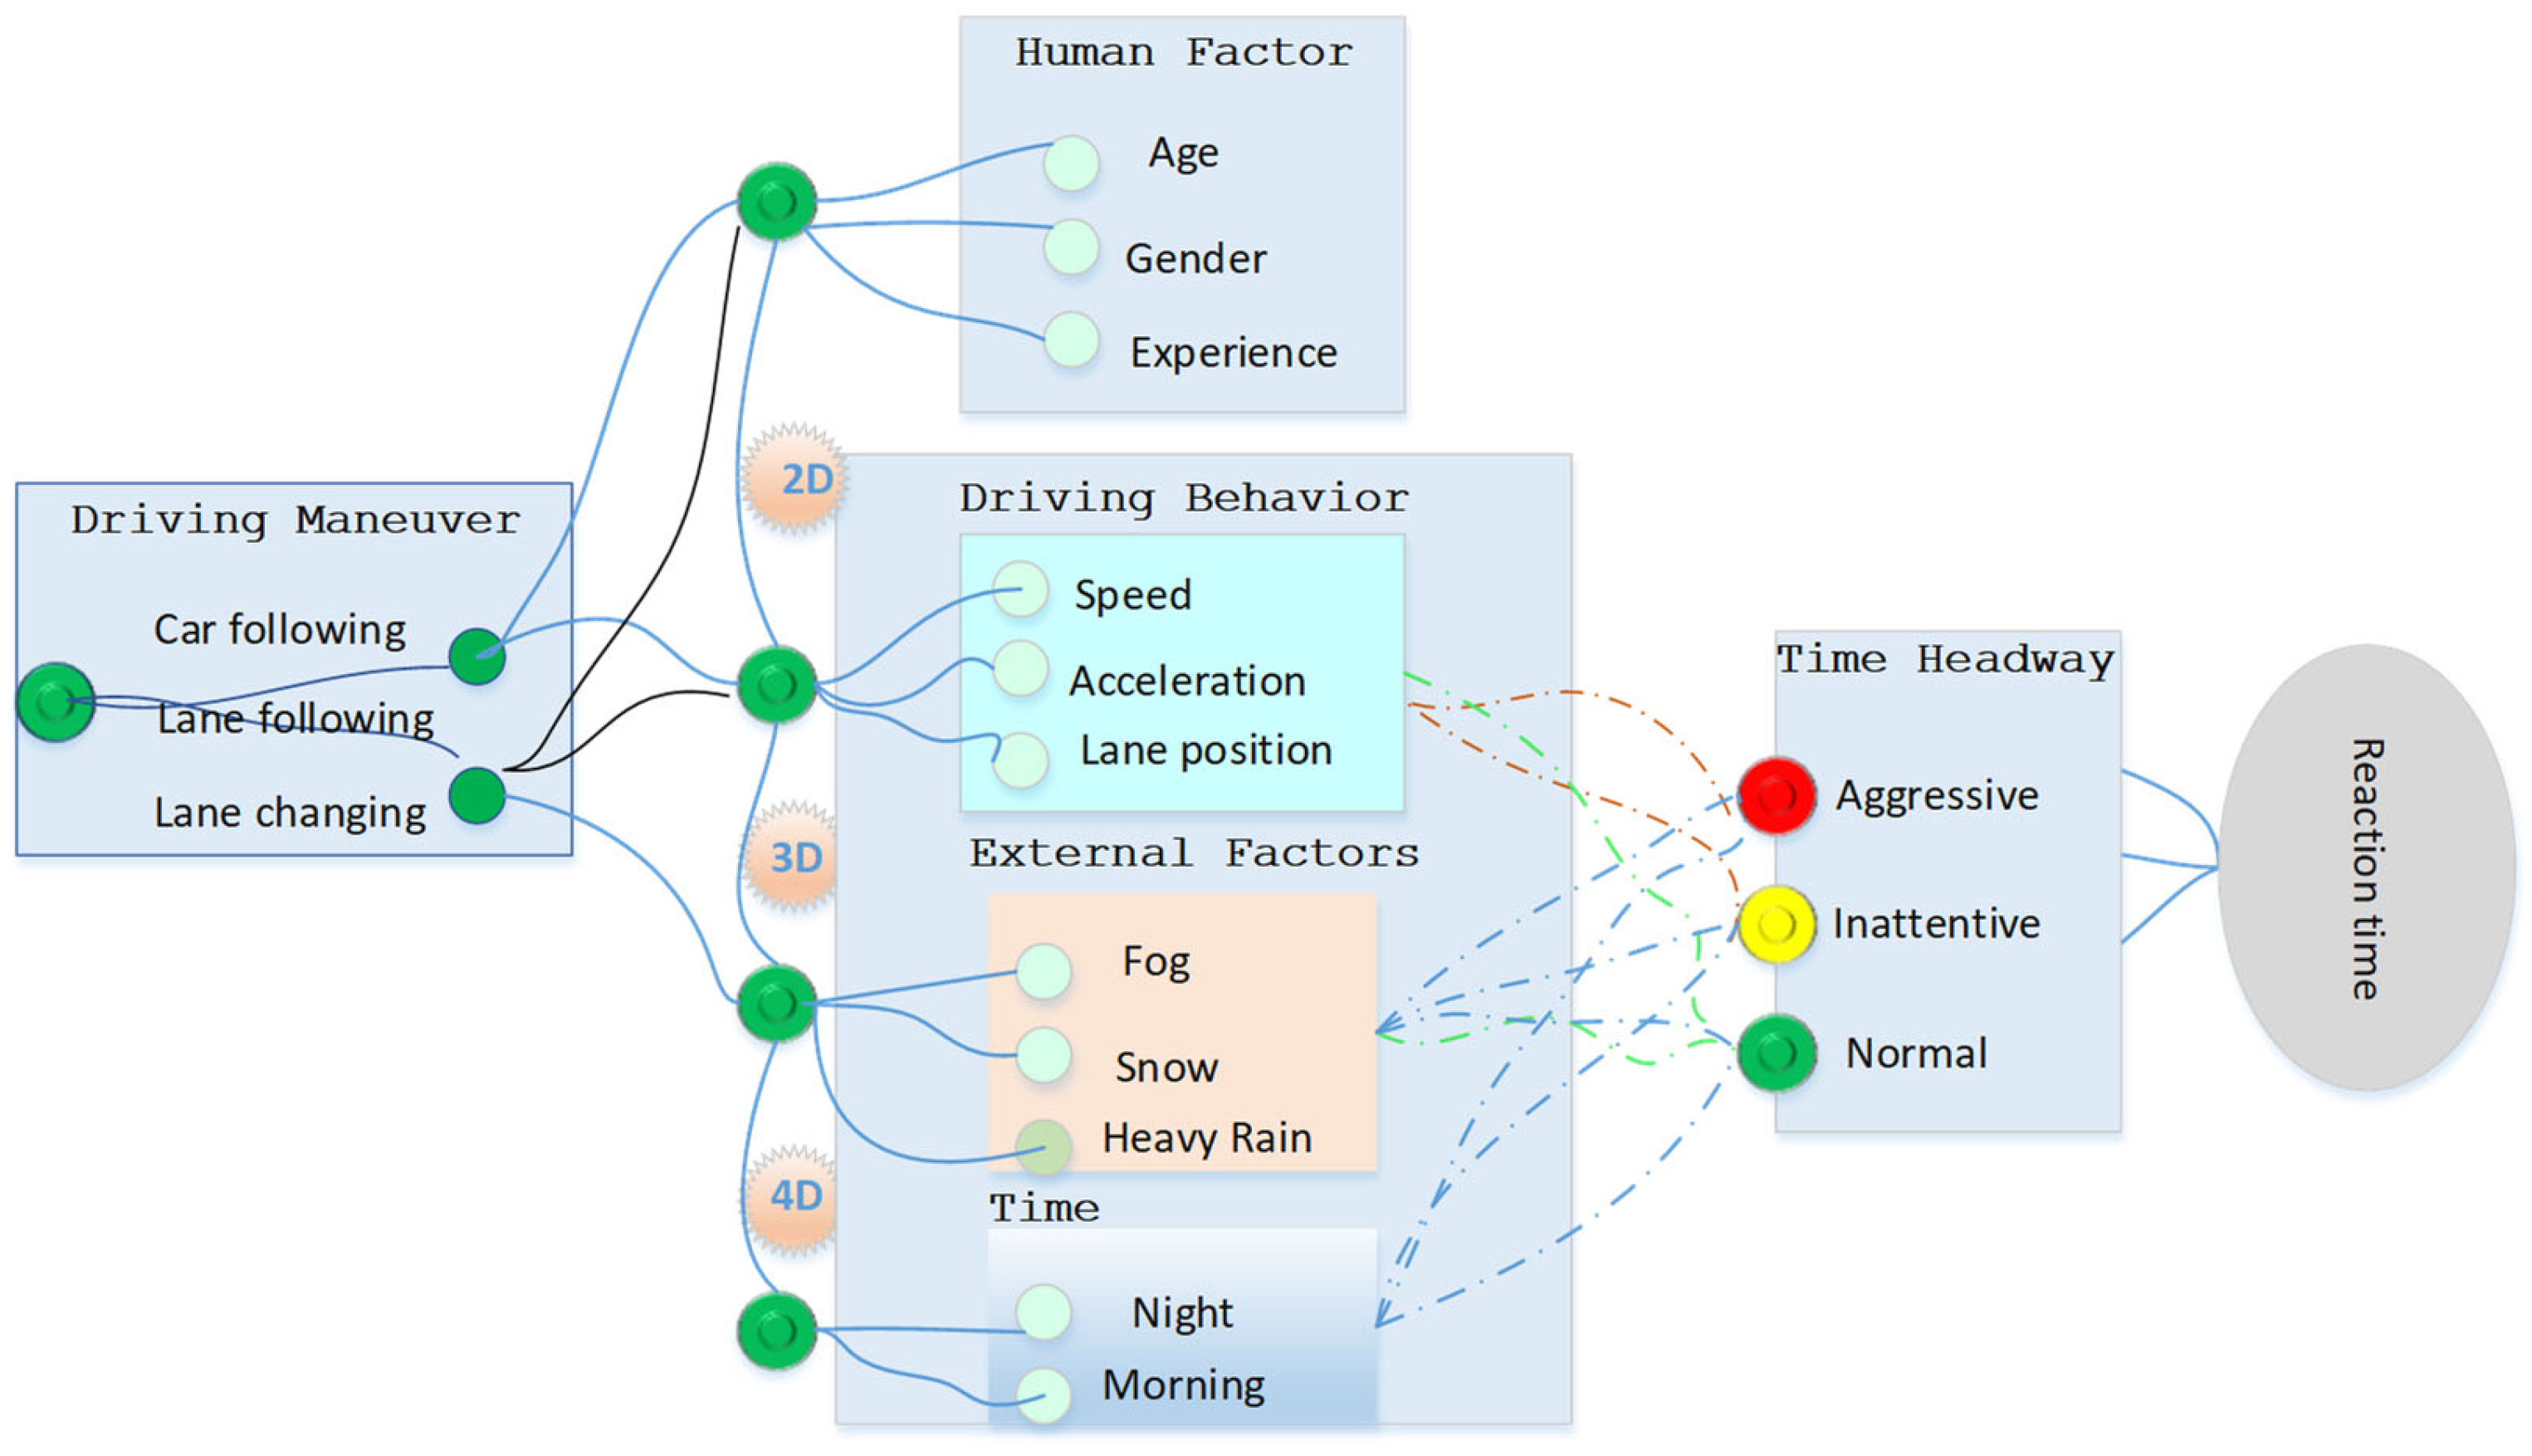
The Combination of Human Factors and Driving Behaviors

Driving behavior is influenced by various human factors, such as age, gender, and experience. It is essential to recognize that individual differences play a significant role in driving behavior, and not all individuals within a particular age group or gender will exhibit the same patterns. Young drivers (teenagers and early 20s) often exhibit riskier behavior due to their lack of experience and judgment. They may be more prone to speeding, distracted driving, and taking risks on the road. Middle-aged drivers (30s to 50s) have more experience and better judgment, leading to safer driving practices compared to younger drivers. However, physical changes associated with aging may start to emerge, affecting driving abilities. Some studies [3] have suggested that males tend to engage in riskier driving behaviors, such as speeding and aggressive driving. On the other hand, females may exhibit more cautious driving patterns and are often associated with fewer traffic violations. Inexperienced drivers are more likely to make errors and have difficulty handling challenging situations on the road. Lack of familiarity with road rules and traffic patterns can contribute to higher accident rates among new drivers. To provide a mathematical description of the correlations between driving behavior and human factors (age, gender, experience), we can use statistical methods such as regression analysis. Regression analysis allows us to model the relationship between a dependent variable (e.g., driving behavior) and one or more independent variables (e.g., age, gender, experience) in a quantitative manner. We can then use multiple linear regression to create a model that predicts driving behavior based on age, gender, and experience. Mathematically, the multiple linear regression model can be written as:
D r i v i n g _ B e h a v i o r = β 0 + β 1 × A g e + β 2 × G e n d e r + β 3 × E x p e r i e n c e + ε
where, β0, β1, β2, and β3 are the coefficients of the model. ε is the error term. It is based on a dataset with observations for different drivers, and the dependent variable representing safe driving behavior.
D r i v i n g _ B e h a v i o r ( a c c i d e n t ) = 1.08 + 0.04 × A g e + 0.087 × G e n d e r
One of the significant factors that can lead to car-following accidents is not maintaining an appropriate time headway (THW). Time headway refers to the time interval between the front of one vehicle and the front of the vehicle immediately in front of it. If a driver fails to maintain a sufficient time headway, it reduces their ability to react to sudden changes in the speed or behavior of the lead vehicle. This lack of reaction time can result in rear-end collisions or other accidents, especially when the lead vehicle suddenly decelerates or stops. Time headway can be influenced by various factors, including speed, road conditions, weather, driver attentiveness, and reaction time. Tailgating, which is driving too closely behind the vehicle in front, is a common behavior associated with inadequate time headway and is a major risk factor for accidents. To mitigate the risk of car-following accidents related to time headway, drivers should maintain a safe following distance that allows enough time to react to any changes in traffic conditions. A mathematical formula for calculating the value of Mean_THW is based on the given variables. The formula for Mean_THW is a linear combination of various variables, each multiplied by a corresponding coefficient: Max_ax represents a measurement related to acceleration in the x-axis direction of a vehicle; Mean_LongDist_LeadVeh (LD_LV) represents a measurement related to the mean of the longitudinal distance between the vehicle and the leading vehicle (vehicle directly in front); Mean_v_LeadVeh (v_LV) represents a measurement related to the mean of the velocity of the leading vehicle.
M e a n _ T H W = 2.3952 + 0.0611 × M a x _ a x + 0.0988 × L D _ L V + 0.0129 × v _ L V
Driving behaviors such as time headway, speed, and acceleration, depend on human factors such as age, gender, and experience of external factors such as weather conditions. This paper focuses on human factors. The probability of an accident is expressed as follows:
Time   Headway = w 0 ×   Gender + w 1 ×   Age + w 2 × Experience + ε
The weight of each human factor is calculated in terms of naturalistic driving.
w 0 = Pr ( m a l e ) = 0.799
w 1 = Pr ( 18 < a g e < 29 ) = 0.352
w 2 = Pr ( exp e r i e n c e < 15 ) = 0.409
The personalized cognitive agent can estimate the likelihood of an accident based on minimization of the weights. The type of minimization objective function is referred to as a loss function, or cost function. Neural network learning algorithms are formulated with the use of a loss function. The goal is always to minimize errors in prediction L by minimizing the number of misclassifications with respect to all the training instances in a data set D containing feature–label pairs.
M i n i m i z e W L = ( X ¯ , y ) D ( y y ¯ ) 2 = ( X ¯ , y ) D ( y s i g n { W ¯ . X ¯ } ) 2
The cost function is a distinctive type of function designed to minimize error and bring the predicted output as close to the expected output as possible. It employs two parameters for error calculation: the estimated output of the CNN model, often referred to as the prediction; and the actual output. Among various machine learning tasks, the mean squared error (MSE) serves as a prevalent loss function, especially in regression problems. Depending on the nature of the specific problem and its requirements, other loss functions like the root mean square error (RMSE) and the mean absolute error (MAE) are also commonly employed. Table 2 compares various machine learning schemes based on statistical measurements of error. The nearest neighbor and random forest algorithms provide better classification performance than others, namely, the zeroR, NBN, and DT. Furthermore, these two schemes outperform the others for accuracy, as can be seen in their higher rating in the comparison graphs in Figure 6. TP stands for true positive, FP (false positive), MCC (Matthews Correlation Coefficient), ROC (Receiver Operating Characteristic) Curve, and PRC (Precision-Recall Curve)
The nearest neighbor scheme is a classification algorithm that assigns a data point to the class most common among its k-nearest neighbors in the training dataset. The random forest scheme is an ensemble learning method that combines multiple decision trees to make predictions. It is known for its ability to handle high-dimensional data and capture complex relationships in the data.

5. Simulation Results

The intricate connection between human factors and driver behavior concerning time headway is multifaceted and shaped by diverse elements. Human factors exert a substantial influence on how drivers perceive, understand, and react to the necessity of maintaining appropriate time headway. Figure 7 shows graphic samples of mean time headway values for aggressive, inattentive, and normal drivers.
Aggressive drivers tend to tailgate and keep shorter time headways. Experienced drivers typically grasp the importance of lane discipline and are adept at staying within their assigned lane, maintaining a steady and centered position. Inexperienced drivers may lack a comprehensive understanding of lane discipline, heightening the risk of accidents. They might find the acceleration of a vehicle exhilarating, especially if they are new to driving or unfamiliar with the sensation of speed. Additionally, they may experience nervousness or anxiety during acceleration, particularly in situations where they are still mastering the smooth control of the vehicle’s speed and acceleration.
Young drivers between 20 and 24 years of age are statistically more likely to be involved in car accidents than older drivers, as illustrated in Figure 8. Several factors contribute to this increased risk, such as lack of experience, distracted driving, and night-time driving. Figure 9 shows evidence that more females than males are involved in car accidents. Males are more likely to engage in risky driving behaviors, such as speeding, aggressive driving, not wearing a seat belt, and driving under the influence of alcohol or drugs, all of which increase the likelihood of an accident. Car accidents can vary in terms of their types and causes. Figure 10 shows several types of accidents plotted against age groups. One common type is “rear-end collisions”, where one vehicle collides with the rear of a preceding vehicle. These are typically associated with cars traveling in the same directions; they occur most often in traffic jams and during lane-changing maneuvers involving adjacent cars.

6. Conclusions

In conclusion, the incorporation of non-monotonic logic in Autonomous Vehicles (AVs) for car following represents a promising avenue for enhancing safety, adaptability, and decision making in dynamic traffic environments. Traditional rule-based systems and monotonic logic often struggle with exceptions, conflicting data, and context-dependent reasoning prevalent in car-following scenarios. Non-monotonic logic empowers AVs to overcome these limitations, fostering more robust and intelligent behavior. They can navigate uncertainties, adapt to changing conditions, and make plausible inferences based on incomplete or uncertain information.
The integration of non-monotonic logic also facilitates the modeling of non-monotonic dependencies in driver behavior, enabling AVs to respond effectively to unexpected actions, variable speeds, and context-specific behaviors exhibited by human drivers. This contributes to the improvement of safety, efficiency, and overall performance in autonomous driving systems. Additionally, safety can be further enhanced through the utilization of AI characteristics, including sensor fusion, perception, decision making, predictive analytics, and continuous learning. AI enables vehicles to perceive their environment, make informed decisions, and monitor performance in real-time.
The combined use of non-monotonic logic and AI characteristics provides a comprehensive approach to developing safe cognitive AVs. However, ongoing research is essential to address the challenges associated with integrating these functionalities in AVs. These challenges encompass interpreting and handling complex scenarios, validating and verifying non-monotonic reasoning, and developing robust and reliable AI algorithms. Future work aims to integrate features describing human factors and vehicle behavior to formulate cognitive hypotheses within a hierarchical cognitive Bayesian network, building upon the approach in [7] for recognizing vehicle behaviors such as car following, lane following, and lane changing. Addressing these challenges will contribute to further improvements in the safety, reliability, and acceptance of Avs on our roads.

Author Contributions

Conceptualization, J.R. Conceptualization, J.R. and G.W.; methodology, J.R.; software, J.R.; validation, J.R.; formal analysis, J.R.; investigation, J.R.; writing—original draft preparation, J.R.; writing—review and editing, J.R.; visualization, J.R.; supervision, G.W.; project administration, G.W. All authors have read and agreed to the published version of the manuscript.

Funding

This study has been supported by Project 101076165—i4Driving within Horizon Europe under the call HORIZON-CL5-2022-D6-18 01-03, which is programmed by the European Partnership on ‘Connected, Cooperative and Automated Mobility’ (CCAM).

Data Availability Statement

Data will be made available on request.

Conflicts of Interest

The authors declare no conflicts of interest.

References

  1. Yarlagadda, J.; Pawar, D.S. Heterogeneity in the Driver Behavior: An Exploratory Study Using Real-Time Driving Data. J. Adv. Transp. 2022, 2022, 4509071. [Google Scholar] [CrossRef]
  2. Zhai, C.; Wu, W. A new car-following model considering driver’s characteristics and traffic jerk. Nonlinear Dyn. 2018, 93, 2185–2199. [Google Scholar] [CrossRef]
  3. Raiyn, J.; Weidl, G. Improving Autonomous Vehicle Reasoning with Non-Monotonic Logic: Advancing Safety and Performance in Complex Environments. In Proceedings of the 2023 IEEE International Smart Cities Conference, Bucharest, Romania, 24–27 September 2023; University POLITEHNICA of Bucharest: Bucharest, Romania, 2023. [Google Scholar]
  4. Bouhsissin, S.; Sael, N.; Benabbou, F. Driver Behavior Classification: A Systematic Literature Review. IEEE Access 2013, 11, 14128–14153. [Google Scholar] [CrossRef]
  5. Weidl, G.; Madsen, A.L.; Wang, S.R.; Kasper, D.; Karlsen, M. Early and Accurate Recognition of Highway Traffic Maneuvers Considering Real-World Application: A Novel Framework Using Bayesian Networks. IEEE Intell. Transp. Syst. Mag. 2018, 10, 146–158. [Google Scholar] [CrossRef]
  6. Abdar, M.; Pourpanah, F.; Hussain, S.; Rezazadegan, D.; Liu, L.; Ghavamzadeh, M.; Fieguth, P.; Cao, X.; Khosravi, A.; Acharya, R.; et al. A Review of Uncertainty Quantification in Deep Learning: Techniques. Inf. Fusion 2021, 76, 243–297. [Google Scholar] [CrossRef]
  7. Bhargavi, R. Road Rage and Aggressive Driving Behavior Detection in Usage-Based Insurance Using Machine Learning. Int. J. Softw. Innov. 2019, 11, 1–29. [Google Scholar] [CrossRef]
  8. Wang, J.; Li, K.; Lu, X.-Y. Effect of Human Factors on Driver Behavior. In Advances in Intelligent Vehicles; Academic Press: Cambridge, MA, USA, 2013; pp. 111–155. [Google Scholar]
  9. Hiang, T.S.; Ming, G.L. Speeding driving behavior: Age and gender experimental analysis. MATEC Web Conf. 2016, 74, 30. [Google Scholar]
  10. Rousseeuw, P.J. Silhouettes: A Graphical Aid to the Interpretation and Validation of Cluster Analysis. Comput. Appl. Math. 1987, 20, 53–65. [Google Scholar] [CrossRef]
  11. Nguyena, T.T.; Krishnakumaria, P.; Calverta, S.-C.; Vub, H.-L.; Lintam, H. Feature extraction and clustering analysis of highway congestion. Transport. Res. Part C Emerg. Technol. 2019, 100, 238–258. [Google Scholar] [CrossRef]
  12. Neurohr, C.; Westhofen, L.; Butz, M.; Bollmann, H.M.; Eberle, U.; Galbas, R. Criticality Analysis for the Verification and Validation of Automated Vehicles. IEEE Access 2021, 9, 18016–18041. [Google Scholar] [CrossRef]
  13. Wang, J.; Zhang, L.; Lu, X.; Li, K. Driver Characteristics Based on Driver Behavior. In Transportation Technologies for Sustainability; Ehsani, M., Wang, F.Y., Brosch, G.L., Eds.; Springer: New York, NY, USA, 2013. [Google Scholar]
  14. Oppenheim, M.; Parmet, I.; Oron-Gilad, Z.T. Can Driver Behavior Be Traced to Gender Role, Sex and Age? Adv. Transp. 2022, 60, 450–459. [Google Scholar] [CrossRef]
  15. Lee, D.; Guldmann, J.-M.; von Rabenau, B. Impact of Driver’s Age and Gender, Built Environment, and Road Conditions on Crash Severity: A Logit Modeling Approach. Int. J. Environ. Res. Public Health 2023, 20, 2338. [Google Scholar] [CrossRef]
  16. Shahverdy, M.; Fathy, M.; Berangi, R.; Sabokrou, R. Driver behavior detection and classification using deep convolutional neural networks. Expert Syst. Appl. 2020, 149, 113240. [Google Scholar] [CrossRef]
  17. Liu, X.-K.; Chen, S.-L.; Huang, D.-L.; Jiang, Z.-S.; Jiang, Y.-T.; Liang, L.-J.; Qin, L.-L. The Influence of Personality and Demographic Characteristics on Aggressive Driving Behaviors in Eastern Chinese Drivers. Psychol. Res. Behav. Manag. 2022, 15, 193–212. [Google Scholar] [CrossRef] [PubMed]
  18. Ley, H.; Sridharan, M. Integrating Non-Monotonic Logical Reasoning and Inductive Learning with Deep Learning for Explainable Visual Question Answering. Front. Robot. AI 2019, 6, 125. [Google Scholar] [CrossRef]
  19. Szalas, A. Decision-making support using non-monotonic probabilistic reasoning. In Proceedings of the Intelligent Decision, Technologies 2019: 11th KES International Conference on Intelligent Decision Technologies (KES-IDT 2019), Malta, Prague, 17–19 June 2019; Springer: Singapore, 2019; Volume 1, pp. 39–51. [Google Scholar]
  20. Raiyn, J.; Weidl, G. Naturalistic Driving Studies Data Analysis Based on a Convolutional Neural Network. In Proceedings of the 9th international Conference on Vehicle Technology and Intelligent Transportation Systems, Prague, Czech Republic, 26–28 April 2023; pp. 248–256, ISBN 978-989-758-652-1. [Google Scholar]
  21. L3pilot Automation Driving. Available online: https://l3pilot.eu/ (accessed on 14 November 2023).
  22. Raiyn, J. Classification of Road Traffic Anomaly Based on Travel Data Analysis. Int. Rev. Civ. Eng. 2021, 12. [Google Scholar] [CrossRef]
Figure 1. Personalized cognitive agent reasoning.
Smartcities 07 00018 g001
Figure 2. System model.
Smartcities 07 00018 g002
Figure 3. Hybrid model.
Smartcities 07 00018 g003
Figure 4. Identification of driving behavior.
Smartcities 07 00018 g004
Figure 5. Rule design.
Smartcities 07 00018 g005
Figure 6. Comparisons of ML schemes.
Smartcities 07 00018 g006
Figure 7. Driver profiles.
Smartcities 07 00018 g007
Figure 8. Age versus number of accidents.
Smartcities 07 00018 g008
Figure 9. Gender versus number of accidents.
Smartcities 07 00018 g009
Figure 10. Age versus type of accident.
Smartcities 07 00018 g010
Table 1. Summary of the main notation.
NotationDescriptionSymbol
Min_axMinimum longitudinal accelerationmin(ax)
Max_axMaximum longitudinal accelerationmax(ax)
SD_axStDEV of longitudinal acceleration sd(ax)
SD_ayStDEV of lateral accelerationsd(ay)
Mean_vMean speedm(v)
SD_vStandard deviation of speedsd(v)
Max_abs_ayMaximum absolute lateral accelerationmax(|ay|)
Max_vMax speedmax(v)
Mean_pos_in_lineMean position in lanesd(Pos in lane)
Mean_THWMean time headwaym(THW)
Table 2. Statistical measurement of error.
NNNBNzeroRJ48RFDT
MAE0.16870.1860.2000.1820.1690.190
RMSE0.2900.3060.3160.3010.2920.307
RAE84.03393.0793.0790.67684.28895.049
RRSE91.66396.8396.8395.24192.27496.950
MAE: Mean absolute error; RMSE: Root mean square error; RAE: Relative absolute error; RRSE: Root relative square error. RF: Random forest; DT: Decision Table; NN: Neural Network.
Disclaimer/Publisher’s Note: The statements, opinions and data contained in all publications are solely those of the individual author(s) and contributor(s) and not of MDPI and/or the editor(s). MDPI and/or the editor(s) disclaim responsibility for any injury to people or property resulting from any ideas, methods, instructions or products referred to in the content.

