Article

Benchmarking the Functional, Technical, and Business Characteristics of Automated Passenger Counting Products

Interuniversity Department of Regional and Urban Studies and Planning, Politecnico di Torino, 10125 Turin, Italy
*
Author to whom correspondence should be addressed.
Smart Cities 2024, 7(1), 302-324; https://doi.org/10.3390/smartcities7010013
Submission received: 3 December 2023 / Revised: 14 January 2024 / Accepted: 16 January 2024 / Published: 22 January 2024

Abstract

:
Urban transport planning and the integration of various mobility options have become increasingly complex, necessitating a thorough understanding of user mobility patterns and their diverse needs. This paper focuses on benchmarking different Automatic Passenger Counting (APC) technologies, which play a key role in Mobility as a Service (MaaS) systems. APC systems provide valuable data for analysing mobility patterns and informing decisions about resource allocation. Our study presents a comprehensive data collection and benchmark analysis of APC solutions. The literature review emphasises the significance of passenger counting for transport companies and discusses various existing APC technologies, such as pressure sensors, wireless sensors, optical infrared sensors (IR), and video image technology. Real-world applications of APC systems are examined, highlighting experimental results and their potential for improving accuracy. The methodology outlines the data collection process, which involved identifying APC companies, conducting interviews with companies and customers, and administering an ad hoc survey to gather specific information about APC systems. The collected data were used to establish criteria and key performance indicators (KPIs) for the benchmarking analysis. The benchmarking analysis compares APC devices and companies based on ten criteria: technology, accuracy, environment, coverage, interface, interference, robustness (for devices), price, pricing model, and system integration (for companies). KPIs were developed to measure performance and make comparison easier. The results of the benchmarking analysis offer insights into the costs and accuracy of different APC systems, enabling informed decision making regarding system selection and implementation. The findings fill a research gap and provide valuable information for transport companies and policy makers, and we offer a comprehensive analysis of APC systems, highlighting their strengths, weaknesses, and business strategies. The paper concludes by discussing limitations and suggesting future research directions for APC technologies.

1. Introduction

Planning urban transport and managing transport supply and demand are complex tasks that require in-depth knowledge of user mobility patterns and needs, which can be influenced by several factors including but not limited to residential density and land-use mix levels [1,2,3]. Integrating traditional public transport services with on-demand and shared mobility options, known as Mobility as a Service (MaaS), plays a crucial role in this context [4,5]. Intelligent Transport System (ITS) tools, using technologies like camera recognition, Wi-Fi networks, and GPS, facilitate data collection and analysis of mobility needs [6,7].
APC systems provide valuable data for identifying mobility patterns, obtained through continuous measurement that can yield timely and accurate information [8]. Various APC technologies exist and have given rise to a wide range of systems on the market [9].
Counts of passengers on board can be obtained through manual or automatic methods [10] and are crucial data for transport companies. Automatic Fare Collection (AFC) technologies such as smartcards are able to calculate space–time passenger volumes as passengers board and alight [11]. In contrast, APC systems use electronic devices placed near vehicle doors to count passengers without any explicit action on their part. The collected data are sent to a backend service for analysis and storage [10]. APC and AFC systems are closely related to the Automatic Vehicle Positioning (AVL) system, which allows passenger data to be matched to information about routes and actual vehicle stops (taking into account deviations in routes and stop skips) [12]. The implementation of APC systems is beneficial for both transport systems and federal or state funding agencies. For transport systems, APC data help to identify factors affecting ridership and passenger flows. Federal agencies, on the other hand, require ridership reports in compliance with government legislation [13].
The common strategy involves connecting the APC to the on-board computer or router, which can then transmit or store the collected data. These data are then analysed and processed by the central control system.
In general, two categories of typically collected data can be summarised:
  • Service planning data: they include data on daily variations in the distribution of boarding and alighting, total number of passengers, overcrowding during peak hours, and actual versus scheduled journey times. These data are useful for inferring possible seasonal variations in ridership and journey times. A significant amount of data are required to ensure statistical significance.
  • Scheduling data: they include data on individual stops, trips and dwell times, boarding and alighting, and punctuality performance. The objective is to monitor and, if necessary, modify travel schedules to better align supply with demand [14].
In addition to the established advantages of Automatic Passenger Counting (APC) systems, a further significant benefit is the prediction of bus arrival times. This is achieved by analysing APC data with neural network processing, as shown by Chen et al. [15], Cheng et al. [16], and Zhou et al. [17]. This additional functionality enhances public transport by improving scheduling accuracy, optimising operational plans, and consequently increasing user satisfaction.
Various studies have explored ways of improving existing APC systems using new technologies, often including assessments of accuracy and precision and presenting experimental results [18,19,20,21]. This section provides a review of technologies used in APC system development.
A number of studies have separated APC technologies into different categories according to the methodologies used. Olivo et al. [11] make a distinction between indirect and direct traveller number estimation, while Grgurević et al. [8] classify APC systems as being either integrated or independent counting systems. Integrated systems, such as those using RFID or gate-based technologies, face accuracy challenges due to potential fraud. APC systems typically involve cameras or sensors placed over each bus door, connected to a counting unit that runs some kind of software. Processed data, along with time, date, and GIS information, are transmitted to the on-board computer for analysis. Different data transmission mechanisms, cable-based or wireless, may be used for this purpose. The main APC technologies employed are pressure sensors, wireless sensors, optical sensors (infrared technology), and video image technology.
Weight-based systems using pressure sensors seek to count passengers either by sensing their footsteps on mats or estimating passenger volumes based on the total weight of the vehicle. The former method requires careful installation and may have edge insensitivity issues, while the latter lacks information on boarding and alighting and relies on assumptions about passengers’ average weight [14].
Wireless sensors are APC systems that detect passengers’ mobile devices using wireless sensors including Wi-Fi and Bluetooth. Wi-Fi-based systems detect devices within a certain radius using probe request signals, which contain useful data like MAC addresses and timestamps. The collected data are transmitted to a backend service for computing passenger numbers, but reliability and precision may vary due to factors such as passengers carrying more than one device, MAC address randomisation, and irregular probe request intervals [22].
Optical sensors (infrared technology) employ infrared (IR) sensors for passenger counting. Active IR technology uses transmitter and receiver sensors on each side of the door to monitor the flow of people boarding or alighting. When a person passes through the door, the interruption of the IR signal indicates their presence. Passive IR technology relies on pyroelectric sensors to count individuals based on detected temperature. However, distinguishing multiple individuals on the basis of their temperature requires the use of pyroelectric sensor arrays [23]. Although the use of IR sensors during periods of congestion has its limitations, these sensors are often combined with other types of sensors in order to improve counting accuracy [24].
Video image technology uses cameras with optical sensors to measure passenger volumes. Using recognition software to process recorded images, passengers can be categorised based on their shapes and distinguished from other objects [25]. This technology can identify the direction of movement of passengers and distinguish between boarding and alighting [26]. However, camera-based systems face challenges relating to lighting conditions, privacy concerns, and variations in visibility.
APC systems are typically evaluated through laboratory tests, but real-world scenarios present numerous variables that cannot be simulated. Kotz et al. [27] combine IR sensors, onboard cameras, and pressure sensors to improve accuracy, achieving 97.62% accuracy compared to 82.5% with IR alone. Pu et al. [6] propose a low-cost method based on body kinematics and pressure sensors, achieving 90% accuracy. Nitti et al. developed a Wi-Fi-based APC system with 100% accuracy in static scenarios and 94% in dynamic cases. Li et al. [28] use RGB video technologies with accuracy up to 96.5%, but video systems are costly. Overall, video systems are promising despite the cost.
This study benchmarks different APC solutions, analysing their strengths, weaknesses, and business strategies. The overall aim is to help transport providers make informed decisions about resource allocation. The paper, after having discussed the used systems, starts by presenting the methodology for collecting the data needed to benchmark the APC systems described, and our results are presented. Finally, the conclusions highlight some limitations of the present study and outline future work.

2. Materials and Methods

To benchmark the APC devices, we analysed their characteristics and the marketing strategies of the companies behind them. The benchmarking was performed using a three-step methodology (Figure 1): (a) collecting data relating to the companies producing and selling APC systems and to the characteristics of the APC products; (b) defining criteria and key performance indicators (KPIs) for the benchmarking; and (c) evaluating an APC system according to the KPIs thus defined.
Our objective in this benchmarking was to help transport operators to identify the best-performing products.

2.1. Data Collection

Data collection involved the following: (1) identification and review of companies producing and selling APC systems; (2) a survey in two parts; qualitative, based on interviews with companies producing APC systems and with system integrators; and quantitative, based on a questionnaire to characterise the products and the needs of buyers, administered to transport operators.
The first step distinguished companies as either manufacturers or system integrators, with further analysis on their business models and integration levels. The term “integration levels” refers to the classification of components provided to clients for installation and use, including APC hardware units, AVL/AVM on-board gateways, and IoT platforms for data processing.
The process for identifying target companies involved in producing or selling APC systems utilised a custom-built smart search tool. This tool employed a circular methodology, where its output—a collection of various online resources such as links, articles, and social media posts, sorted by relevance—could be re-inputted for further research. The tool’s structure is depicted in Figure 2. Keywords were selected based on characteristics of both the device (e.g., technology, accuracy, and environmental impact) and the company (e.g., pricing strategies). Initially, three reference companies (selected based on simple key-word search and prior knowledge about such companies) provided ‘seed’ keywords and sentences, which were processed using the Rapid Keyword Extraction (RAKE) Algorithm [29]. This approach mitigated the limitations of human-only keyword searches.
The identified keywords initiated the search for relevant companies, using a comprehensive set of documents from Google Search, Google Scholar, and Scopus. The smart search tool transformed unstructured text into structured, normalised data. Each company’s data were then classified based on these keywords and sentences. A string-matching algorithm compared this data with the reference material from the initial phase. The resulting collection of resources, ordered by relevance, was manually verified. The process was iteratively repeated, incorporating additional data from previous iterations and interviews, to identify more companies.
As the information retrieved online was not complete and not all the characteristics that we needed were available on companies’ websites, a survey was created including the following two parts performed in chronological order:
  • first, a qualitative survey based on interviews, targeting the companies found on the web where there were information gaps.
    For producers, the interview was structured around the following elements:
    -
    characteristics of the company, business strategy, and revenue model;
    -
    device-specific details, such as interface and integration levels;
    -
    real-world accuracy, environmental factors, robustness, and potential issues;
    -
    economic and commercial information like pricing and maintenance contracts.
For system integrators, the interview focused on contract details and the distinction between manufacturers and integrators.
The sample of respondents was selected using LinkedIn to identify the employees with skills in APC technology and pricing (mainly commercial profiles);
  • second, a quantitative survey to address the lack of data and diversify the sample, enlarging the target respondents. As the interviewees in the previous step did not necessarily provide all the information that we wished to use for our analysis, a second survey was necessary to collect the missing information. To this end, a different sample was targeted, namely transport operators. The reason is that operators purchase APC systems through public tenders where they define the specifications as well as the reference price for the tender. This means that they are quite well informed regarding pricing systems and various other aspects that producers do not usually disclose. To select the operators, the “snowball” sampling plan was used, selecting an initial random group of companies and associations including transport operators (e.g., ASSTRA and ANAV), who were asked to randomly identify other operators falling within the target population [30].
    The quantitative survey was designed to collect the following information:
    -
    real-world accuracy, as measured in real world by the company;
    -
    components and level of integration of the system;
    -
    perception of price;
    -
    business model;
    -
    maintenance contract.
To evaluate the above information, a number of statements were drawn up, which respondents were invited to endorse or reject, with their responses scoring from 1 to 6 on a Likert scale. The survey was administered using the Lime Survey platform, and the link to the questionnaire was sent to selected technicians working for Italian public transport companies, as well as to ANAV (Associazione Nazionale Autotrasporto Viaggiatori) and ASSTRA (Azienda di trasporti, trasporti internazionali merci), two trade bodies linking transport companies that in turn disseminated the link to their members.
The data analysis was designed according to the two survey typologies. For the qualitative survey, the interviews were recorded and transcribed. A textual analysis of the interviews was performed, extracting the elements investigated, which were then classified in a table.
The data collected through the questionnaire were directly provided by Lime survey in table format. The data were cleaned, and a database was constructed to allow a statistical analysis of the sample using IBM SPSS software.

2.2. Benchmarking Analysis

Based on the collected data, the benchmarking consisted of a comparison of the devices and characteristics of the companies. The analysis was structured in three steps: (a) identification of data to be used for the comparison and the criteria relevant for the benchmarking; (b) determination of the KPIs; and (c) analysis of the results in relation to a reference standard [31]. A benchmarking analysis seeks to improve organisational, process, or product performance.
The criteria that we selected in the first step are listed below, separated into those relating to device characteristics and those relating to company characteristics.
Device-related criteria:
  • technology: different approaches (e.g., Wi-Fi and infrared) with opportunities and challenges;
  • accuracy: quantification of performance of available technologies;
  • environment: requirements and standards for system implementation;
  • coverage: number of devices needed and cost variance;
  • interface: communication interfaces for product selection;
  • interference: potential interference during device operation;
  • robustness: hardware components’ ability to withstand adverse conditions.
Company-related criteria:
  • price: price paid by buyers to manufacturers or system integrators;
  • pricing model: business strategies selected by manufacturers and integrators in selling their products;
  • system integration: level of integration provided to customers.

Key Performance Indicators

KPIs are essential for benchmarking analysis, measuring progress made towards the realisation of strategic goals. They are quantifiable indicators that may be used to compare the performance of different companies [25,32]. Two KPIs were built based on the survey responses and focussed on two key elements for the transport operators: cost and accuracy.
The first KPI (KPI1) combines the internal and external costs of APC systems to compute the total cost useful to rank and classify them in terms of cost incurred by operators to purchase or develop an APC system. Equation (1) shows how this indicator was computed:
K P I 1 = i = 1 r e s a i   × H   ×   hour   + n = 1 c o m p C n   ×     w n  
where:
  • i is the counter for the different tasks involved (integration, maintenance, etc.), considering only in-house processes. It ranges from zero to the number of different tasks (res);
  • a is an integer corresponding to the number of resources allocated for the i th task (number of employees, etc.);
  • H is an integer corresponding to the number of hours required for the completion of the i th task;
  • EUR/hour is the cost per hour of the i th task;
  • n is the counter for the system components (hardware unit, on-board gateway, IoT platform, etc.). It ranges from zero to the number of system components (comp);
  • C is the price of the n th component;
  • w is a normalised value weighting the critical nature (complexity) of the n th component.
The cost of APC systems was determined by a linear combination of internal (allocated resources) and external (components) costs, weighted by factors a and w. The weights (wn) were obtained from the survey. The averages of the responses on the Likert scale (1 to 6) were calculated and then normalised using Equation (2).
w i = x i x m i n x m a x x m i n    
where:
  • xi is the mean/median value of the data collected by the survey;
  • xmin is the minimum score of the Likert scale;
  • xmax is the maximum value used for the normalisation.
These weights were then applied to Equation (1).
The second indicator (KPI2) brings the costs obtained from Equation (1) into relation with the accuracy of the system as a whole, and it is useful to rank and classify different solutions available on the market. It was computed using Equation (3):
K P I 2 = w 1 ×   K P I 1 w 2   ×   A C C U R A C Y
where:
  • w1 is a normalised value weighting the costs of the system;
  • K P I 1 is the result of Equation (1) for the system;
  • w2 is a normalised value weighting the accuracy of the system;
  • ACCURACY is the accuracy of the system, expressed as a simple number (not percentage) ranging between 0 and 100. Note that this value may refer to data available in the company’s product data sheet. If real-field accuracy is available, this information can be used in Equation (2).
Equation (3) can be used to compute KPI2 in cases where both cost and accuracy are available, expanding the scope of KPI1 to include system performance in addition to the purely financial aspect. The weights (w1 and w2) were derived from the survey responses; the average values corresponding to the levels of importance ascribed to accuracy and cost were normalised using Equation (2), similarly to the weights in KPI1. These values were then used to obtain KPI2. Therefore, there is likely to be a high correlation between the two KPIs if the accuracy of the compared APC systems is similar. Although many companies report similar high accuracy values, ideal scenarios often diverge from the actual accuracy in the field [33]. This discrepancy, influenced by product-specific factors and different city contexts, can lead to significant differences between KPI2 and KPI1.

3. Results

Here we present the results of the data collection, starting with the information about companies and devices, followed by the qualitative and quantitative data collected through the two surveys. Finally, the benchmarking results (see Section 3.4 below) are presented separately, with Section 3.4.1 examining the data collected according to the predefined criteria and Section 3.4.2 reporting the KPIs obtained, supported by relevant figures and tables.

3.1. Review of Companies Producing and Selling APC

The web search identified 27 APC companies from Europe, Asia, and the United States. Data from the companies’ websites and device datasheets are presented, although we do not include system integrators that use APC products from other manufacturers or that did not provide specifications.
Table 1 summarises the results according to the criteria used for the benchmarking analysis:
  • Technology used: Some systems use stereoscopic 3D cameras with depth, colour, and texture pattern algorithms, while others use binocular cameras and the Time of Flight (ToF) technique. IR methods based on ToF estimation and wireless solutions that sniff MAC addresses are also represented in the market [28];
  • Accuracy is a device characteristic that customers pay particular attention to when selecting an APC solution. Regional legislation in Italy requires systems to attain a certain accuracy threshold before they may be purchased using public funding. Table 1 shows that most companies offer an accuracy of 95% or higher, with the exception of Softailor and TripPeopleCounter, which report an accuracy of 90%;
  • Environment and device coverage: The different technologies used in APC devices must meet specific operating conditions and environmental standards. For example, ISO 16750 provides guidance on environmental conditions encountered by electrical and electronic systems in vehicles [34]. Infrared-based solutions are reliable in some environments, but may have difficulty counting passengers accurately in crowded conditions. Video imaging technology, on the other hand, performs well in crowded vehicles, but performance may be impaired in situations of excessive brightness. Wi-Fi approaches are not affected by lighting conditions but are more susceptible to external interference. Wired solutions offer robustness against interference, but may require additional resources for installation and maintenance;
  • Interface: The interface of an APC system is crucial for data transmission and device integration. The most common interfaces are RS-485, Ethernet, PoE, WLAN, and Wi-Fi. Companies need to take into consideration the advantages and limitations of the interfaces on which their devices rely. Some devices, such as Eurotech’s DynaPCN, offer more than one interface option. Some devices lack interference information, which highlights the need for comprehensive communication capabilities;
  • Robustness: The robustness of APC devices is evaluated according to various international standards, the most common being the Ingress Protection Code (IP) [35]. The IP Code, defined by the IEC, assesses how well a device can withstand dust, intrusion, accidental contact, and water. Certifications like IP30, IP45, IP65, and IP67 indicate a device’s protection levels against solid particles and liquids. Not all companies advertise their certifications on their websites, but companies will provide them to customers on request;
  • Pricing model: This is different for manufacturers and system integrators. Information about companies’ pricing models is not generally available online and has to be obtained through interviews and surveys;
  • System integration: System integration refers to the extent to which a company offers customers integrated components, including APC hardware units, on-board gateways, and IoT platforms. While both manufacturers and system integrators provide integration, manufacturers sell components to system integrators, who customise solutions according to customer requirements, resources, and the desired level of integration;
  • Price: information about price, which is difficult to collect, was mainly obtained through interviews and surveys due to companies’ reluctance to reveal such details other than to prospective customers.

3.2. Outcomes of the Interviews

The interviews involved employees with different roles in organisations including GTT, ASP, Eurotech, IVECObus, Leonardo S.p.A., Dilax Intelcom, IRIS Intelligent Sensing, TRISolutions, and Aesys. LinkedIn was particularly helpful as regards setting up interviews. The results of the interviews relevant for the calculation of the KPIs were classified and analysed according to the benchmarking criteria:
  • Accuracy: Regional legislation in the Piedmont region (in Northwest Italy) has imposed a minimum accuracy of 95% for APC systems used in public transport [18]. However, there is often a significant gap between the nominal accuracy declared in device datasheets and the actual accuracy observed in real use, with a discrepancy that has been estimated to be 20–30% [18]. Concerns have been raised about the effectiveness of in-house testing and about inconsistencies in the numbers of passengers recorded as boarding and alighting;
  • Pricing: Hardware-only companies have low profit margins and often outsource to low-cost labour companies. SaaS (Software as a Service) companies, on the other hand, can enjoy margins of up to 70–80%. The main costs in the SaaS model are product development, sales activities, customer service, and software hosting. By implementing third-party processing, companies can reduce production costs, ensure expert maintenance, and benefit from just-in-time supplies. It is also important to distinguish between CAPEX (capital expenditure) and OPEX (operational expenditure), where CAPEX includes the supply of hardware/software and integration services, while OPEX covers operational management contracts;
  • Warranty: Repairs of hardware components are handled by the integrator, who coordinates with the manufacturer for replacements. Warranty and maintenance contracts for software components are concluded online. Warranty contracts are included in CAPEX and typically last 24–36 months. Maintenance variables include repair time, bus line size, and deployment;
  • System integration: The process of integrating APC components is examined. System integrators typically purchase APC hardware, firmware, and cables from manufacturers, while on-board gateways and IoT platforms are often developed by the integrators themselves, although they can also be purchased from hardware manufacturers or their authorized suppliers. Whether integrators develop these components themselves or source them externally will depend on factors such as their degree of knowledge, their resources, and the costs involved. In most cases, integrators provide comprehensive data management, processing, and storage tailored to the customer’s needs, either through a central control system at the customer’s headquarters or through outsourcing;
  • Price: Regarding price, it is important to distinguish between APC solutions according to the different technologies used and the different settings in which they are implemented. The transport systems that we consider are:
    closed systems with access after validation (e.g., metro);
    closed systems with access after ticket reservation (e.g., high-speed train);
    open systems: systems where there are no turnstiles or reservations (e.g., bus).
Information was obtained on the various commercial offers made by manufacturers to integrators, with a focus on the costs to the integrator. The data collected refer to 2015. The Consumer Price Index (CPI) in Italy increased significantly from a base of 100 in 2015 to 113.2 points by 2023. At the same time, the Industrial Producer Prices Index, also based on the 2015 baseline, rose to 128.7 points [36]. This suggests an inflation-adjusted cost increase of between 13% and 28%. However, data collected from respondents indicate that the actual price variation was within a range of ±10%. It is crucial for an accurate and relevant comparison to compare different Automatic Passenger Counting (APC) systems from the same time period. This approach ensures that the comparison is relative and contextually appropriate, facilitating the selection of the most suitable APC system for a given time and circumstance.
The first offer concerns the Eurotech DynaPCN 10-01-00 APC hardware unit. The prices quoted are per unit. The offer includes:
DynaPCN 10-01-00: EUR 510;
Cable connector (optional): EUR 15;
12-month warranty contract from commissioning.
The following commercial offers concern fleet monitoring systems, which provide the necessary on-board gateways for the proper functioning of APC systems. This offer refers to the supply of AVM units to support a bus fleet monitoring system based on smart ticketing. The prices quoted are per unit. The offer includes:
AVM unit: EUR 1670;
GPS/GPRS antenna: EUR 73;
System installation and testing: EUR 380;
Data communication contract: charged to the customer;
Central control system (IoT platform) at customer’s headquarters:
Web software: EUR 80,000;
Annual maintenance fee: EUR 12,000;
Hardware components: charged to the customer;
Software management component: charged to the customer;
Central control system (IoT platform) in outsourcing mode:
Web software: EUR 6000;
Web service settings (access, fleet, and configuration): EUR 5000;
Annual maintenance fee: included;
One-shot additional services (design, assistance, customisation, etc.): EUR 60,000;
12-month warranty contract from commissioning.
It is important to note the price difference between the two strategies for the central control system. The customer in-house installation would cost EUR 92,000, while the outsourcing mode is EUR 11,000.
Moreover, the installation of the central control system, including hardware and software components, is typically borne by the customer because vendors do not consider them to be profitable processes. Customers are free to choose the best solution according to their specific needs.
Manufacturers typically generate profits from the sale of AVM units, with a selling price of EUR 1670. The cost price of these units is around EUR 600, indicating that the manufacturer’s markup is around EUR 1000 for the proprietary license.
The one-shot additional services are stand-alone services concerning the configuration, activation of the central control system, etc. These costs should only be incurred once.
In the following, we present tenders referring to data from 2021. The data refer to four supply contracts for Eurotech. Below is a Eurotech tender for supplying a DynaPCN 10-20-01 with a PoE interface. The prices quoted are per unit. The offer made by the manufacturer to the system integrator includes:
DynaPCN 10-20-01: EUR 581;
Cable connector (optional): EUR 37;
Multi-band communication antenna: EUR 149;
Training course (1 day, mandatory for programmers, installers, and maintainers) that is free;
24-month warranty contract from commissioning.
In contrast, the offer made by the authorized supplier to the system integrator includes:
DynaPCN 10-20-01: EUR 758;
Cable connector (optional) and multi-band communication antenna not provided.
The supplier’s mark-up is EUR 177, and shipping costs and fleet size affect the price of the system. Large supplies often include the sale of hardware components and allow for the amortisation of software and service costs, but this can create a lack of understanding in the purchasing process arising from the data management costs that are included in the AVL system costs.
The interviews allowed us to establish possible values for the KPI1 variables relating to internal costs. These values do not necessarily correspond to the actual values, but reflect the best knowledge of the interviewees employed by system integrators. However, they can be used to provide an example of the sort of calculations made by contracting authorities, who are in possession of the actual values. The values that we established are:
tasks involved (cardinality i):
data management and maintenance;
resources allocated to tasks ( a i ): two persons for each task;
hours necessary for work completion (H):
40 h for weekly data management, not considering overtime, on-call services, etc.;
2 h for average maintenance work:
cost per hour of work (EUR/hour):
data management: EUR 45/hour;
maintenance: EUR 35/hour.

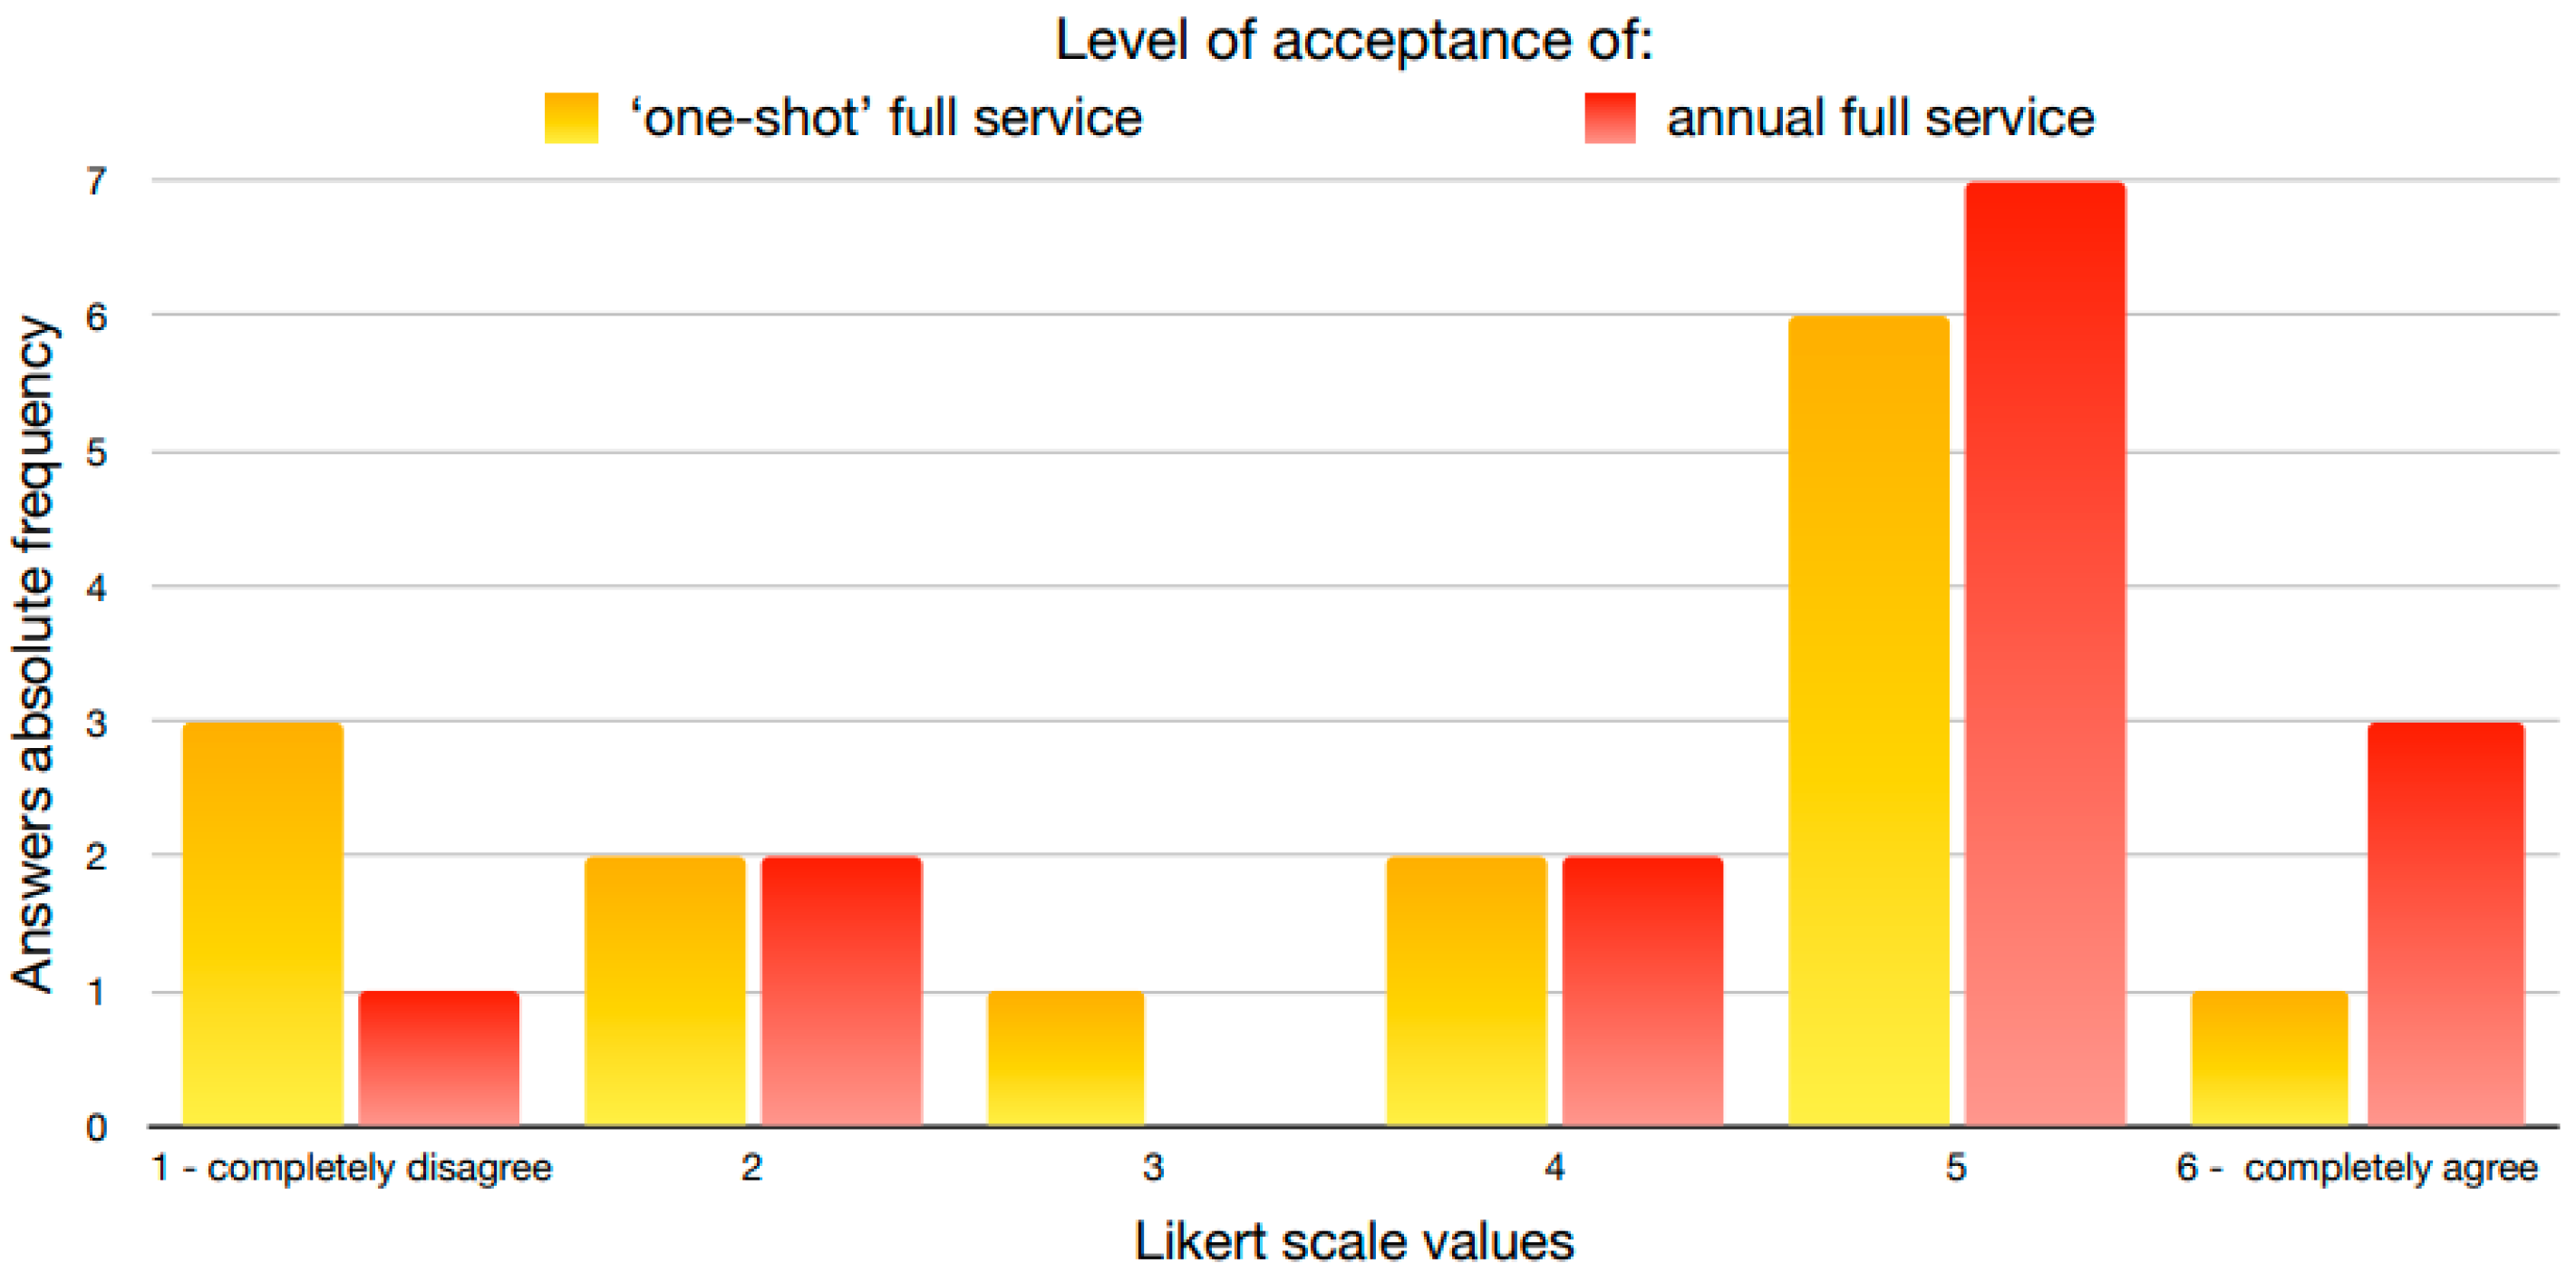
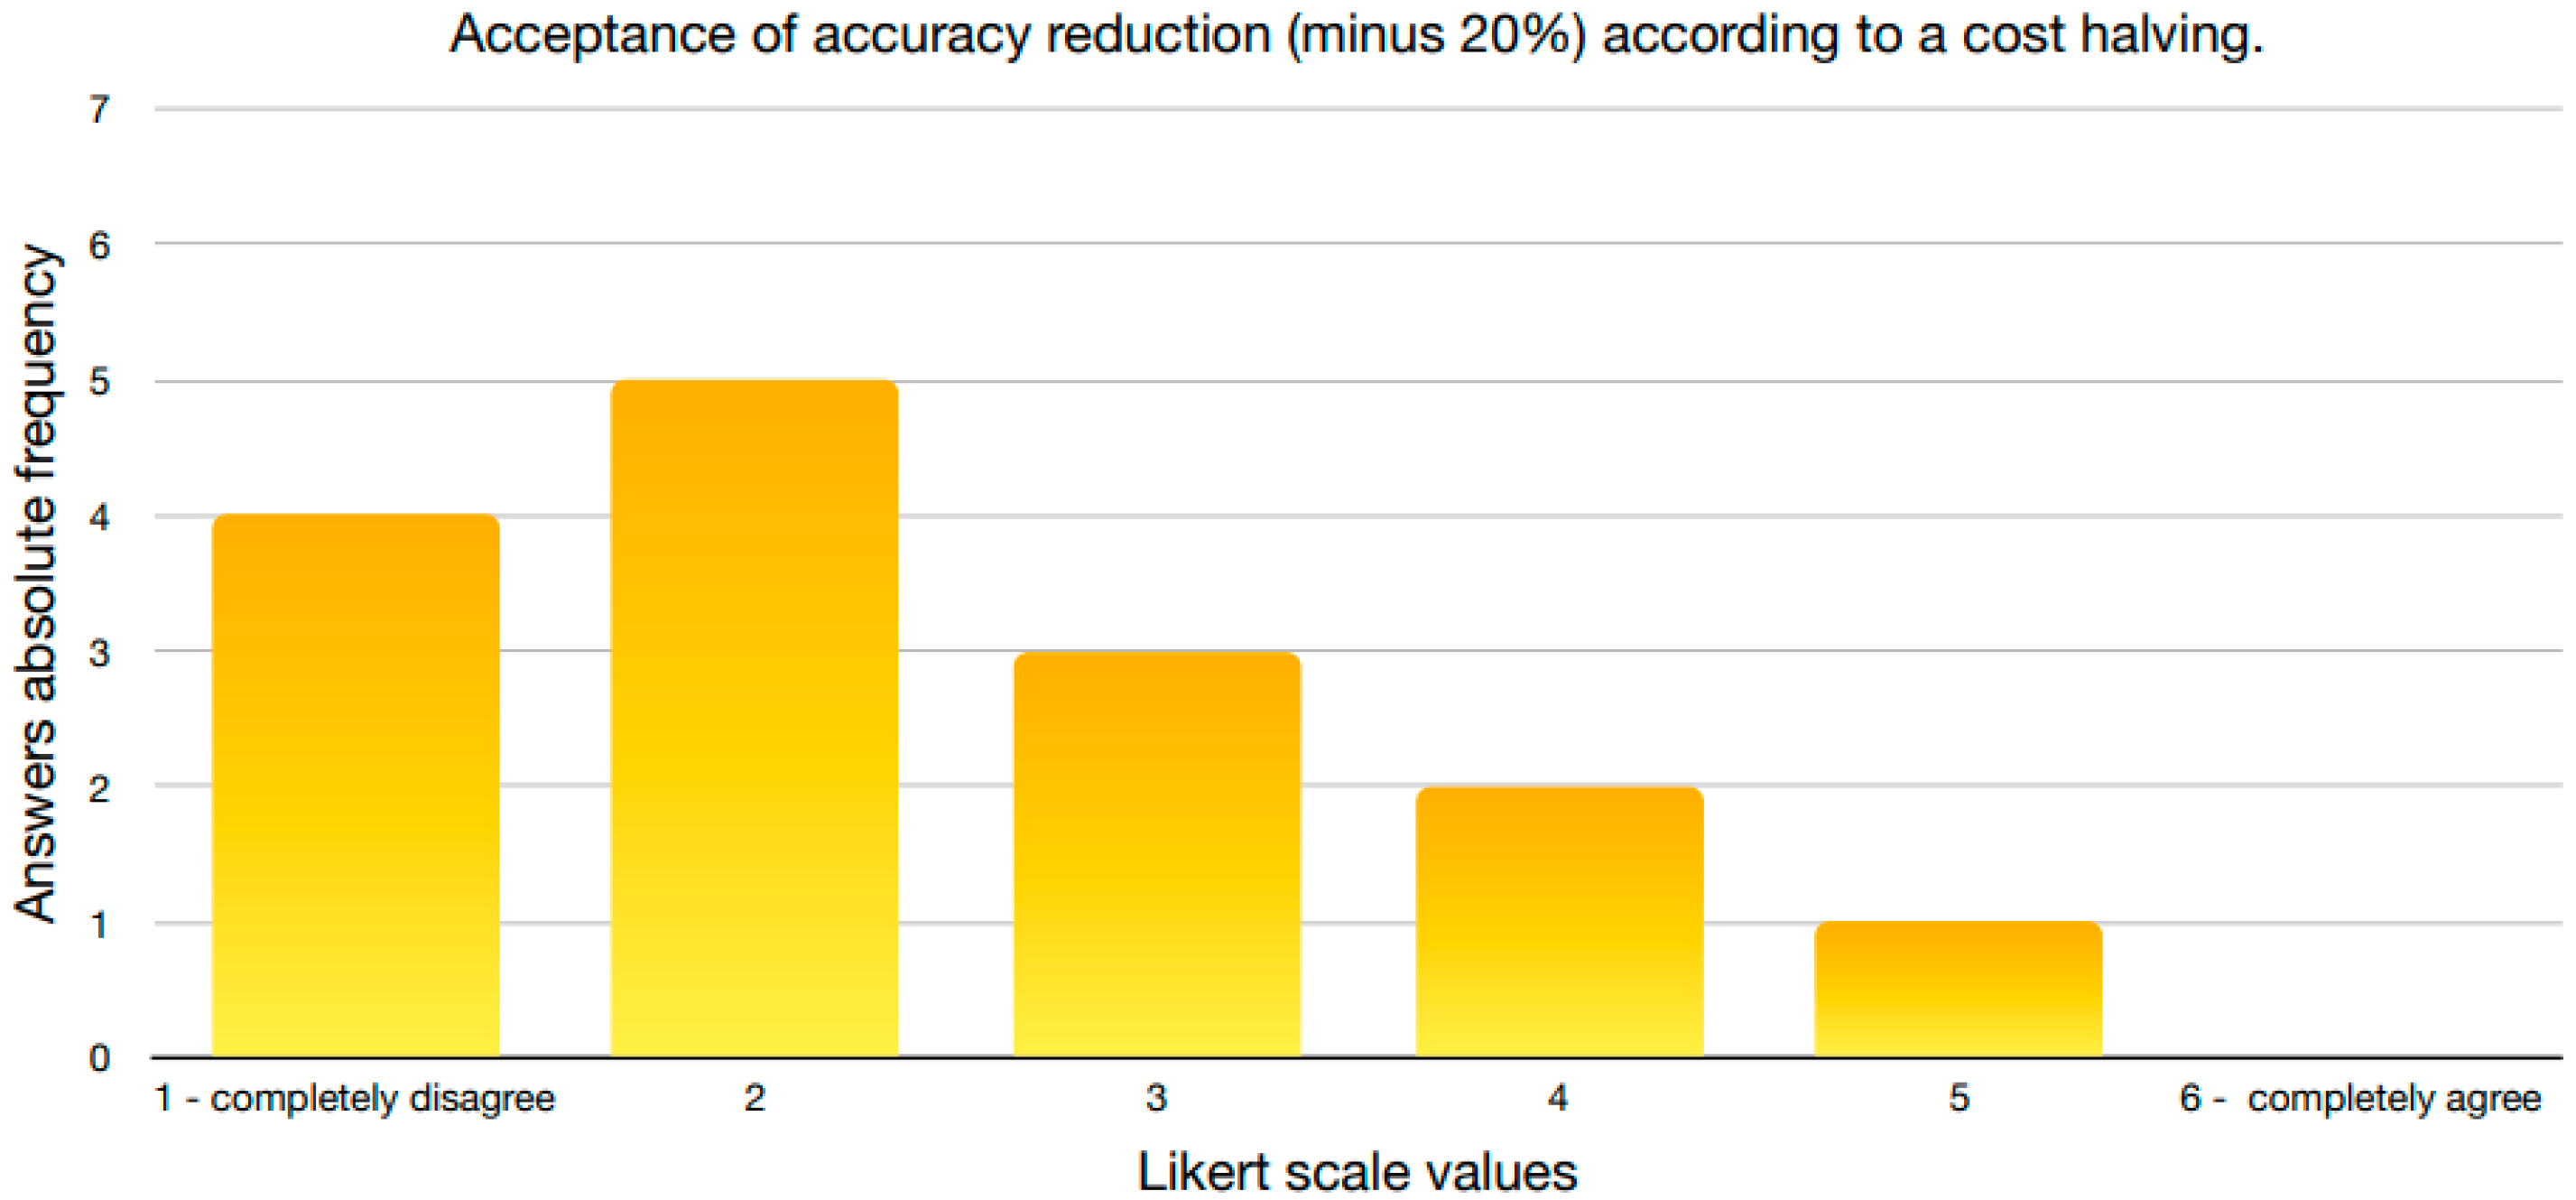
3.3. Results of the Questionnaire

The data collected concern 12 public transport companies, one organisation comprising 14 transport operators, a second organisation comprising three operators, and two further companies that answered the questionnaire anonymously. The survey drew responses from all over Italy, with a number of companies being based in Northern Italy (Figure 3). Some of the companies are owned by public administrations (municipalities, etc.), and others are privately owned. Among the respondents, catchment managers, IT managers, innovation and technology development managers, technical directors, general managers; IT programmers, maintenance managers, and engineers are all represented.
The respondents were asked to provide information about attitudes within their companies to APC systems and about how far these systems are accepted by the personnel. The data concern perceptions of APC systems as fundamental tools for planning and operating services (Figure 4), of the reliability of the data collected by APC systems (Figure 5), and of the effort required to correctly understand and manage the data (Figure 6). Figure 4 indicates that APC systems are perceived as useful tools, with results polarised towards acceptance (median Likert value of 5, and mean equal to 4.3).
The median value for the perception of data reliability (Figure 5) is 3 (mean equal to 2.8). It emerged clearly from the interviews with transport companies that data reliability depends on the type of installed solution and on the technical skills of the company.
Respondents perceived APC data as easy to use and understand (Figure 6), with a median Likert value of 2 (mean equal to 2).
Accuracy: Accuracy emerges as a pivotal determinant among the possible features of an APC system. Participants unanimously assigned the highest rating to the importance of accuracy (median of 6 and mean of 4). They were also asked about whether the minimum acceptable accuracy level is determined by third parties. The responses are shown in Figure 7, revealing a lack of polarization in respondents’ perceptions and a broad distribution across the values of the Likert scale, which may be attributable to the diverse geographical locations of the respondents (in various Italian regions). Notably, transport companies operating in the Piedmont region, subject to regional legislation, uniformly awarded the maximum score, suggesting that there are indeed regional factors at play here.
Interface: The type of interface used by a device is seen as being of medium/high importance. Almost two-thirds of responses were around the middle of the Likert scale, while for the remaining third of respondents, the type of interface was of prime importance.
Pricing: The survey sheds light on attitudes concerning different forms of APC system procurement contracts. These contracts can include both the product and associated assistance. A majority of the survey participants expressed a preference for the annual full-service mode (Figure 8). The median score for the annual service arrangement is 5 (mean equal to 4.4), while the median score for the ‘one-shot’ full-service model is 4 (mean of 3.6).
The results also show that the ‘one-shot’ full-service approach is considered favourable, even though a notable portion of respondents consider it less convenient. Furthermore, respondents were asked to evaluate two possibilities of service inclusion within the contract structure. The first option includes the product along with both data analytics and reporting services. The second option consists of two separate contracts: one for the product and assistance and another for data management (analytics + reporting). As shown in Figure 9, the first option, which includes comprehensive services, registers the highest level of acceptance (median = 5 and mean = 4.4). In contrast, the concept of separate contracts for these services is deemed inconvenient by almost all respondents (median = 2 and mean = 2.4). However, it is worth noting that certain transport companies might still lean towards separate contracts, possibly due to pre-existing integrated service arrangements.
The survey also addressed the question of who handles the end data. Respondents were asked to say which is the final entity managing the data, a crucial point in the OPEX. Most of the companies are the end data managers. Indeed, it is unusual to leave APC collected data to third parties, external to the company.
Finally, supply methodologies were analysed and the results are shown in Figure 10. The possibilities analysed are the following:
a: one-shot supply of hardware components without additional services;
b: supply of hardware components with annual contract for data management;
c: supply of hardware components with annual contract for data management and processing.
A near-even distribution can be seen between the one-shot supply of hardware components and the supply of hardware components accompanied by an additional annual data management and processing contract. This suggests a prevailing trend where data management and processing are intertwined and provided as a unified service. The chosen supply model appears to be heavily contingent on the requirements of the contracting authority.
System Integration: With regard to system integration, it was found that manufacturers generally do not supply vehicles with pre-integrated APC systems, but leave the specification and integration to the contracting authorities. Integration efforts for non-prepared vehicles were also examined, and this revealed that transport companies perceive this integration as expensive, on par with the integration of newly acquired vehicles.
As for the challenges of integrating APC systems in vehicles that are not initially equipped to support them, the survey indicates that transport companies consider this integration process to be very expensive, or at least as expensive as the integration efforts required for newly manufactured vehicles.
Among the various types of contracts, transport companies prefer integration and the supply of hardware components only. Finally, critical elements among APC system components were examined. The results are shown in Figure 11.
Respondents were asked to identify the most “critical” system components, that is to say those whose continued successful operation consumes the most resources. The element seen as having the greatest “criticality”, in this broad sense of the term, is the IoT platform (median = 5 and mean = 4.3), necessary for the correct planning and operation of the transport services. In contrast, the element deemed to be the least “critical”, requiring little maintenance effort, is the AVM/Gateway unit (median = 2 and mean = 2.6). These results are unsurprising, considering that AVM has been mandatory for a number of years, and during that time, it has been thoroughly tested, improved, and refined. Finally, the hardware component (APC device) is the only one perceived as having a low-to-medium criticality (median = 3 and mean = 3.3). This may be taken as confirmation that perceived efficiency and reliability are highly dependent on the particular equipment used.
Price: As we might expect, price is seen as important by all respondents (median = 5). To give us a clearer idea of the respondents’ attitudes towards price, they were also asked to what extent they could envisage accepting a trade-off between accuracy and price, in a hypothetical scenario, where price was halved in exchange for a reduction in accuracy from 100% to 80% (Figure 12).
Most of the companies consider accuracy more important than the price of a system. This probably reflects the availability of state subsidies for the purchase of the APC systems, which can be a motivating factor when manufacturers and system integrators reply to tenders.
To help us better understand the dynamics of state subsidies and how they are perceived by public transport companies, respondents were asked about their own company’s source of finance for the purchase of APC systems. The proposed options are:
  • company capital;
  • public subsidies;
  • company capital and public subsidies.
The results are shown in Figure 13.
Most of the companies purchased their systems by drawing both on their own capital funds and on public subsidies. This result is consistent with what has been previously stated concerning the importance of public finance for public transport companies. Regarding perceptions of how prices break down, the respondents were asked what percentages of the total price they would expect to be due to the hardware unit, to the on-board gateway, and to the IoT platform. The results are the following:
  • hardware unit: 35%;
  • on-board gateway: 45%;
  • IoT platform: 20%.
The on-board gateway is therefore perceived as being the most expensive component of the system, followed by the hardware unit and the IoT platform. Interestingly, the oldest component of the system, which has been mandatory for years and around which a robust market has developed, is deemed to be the most expensive. However, it is important to remember that these are the opinions of the respondents and that these data need to be analysed carefully, because they may be biased depending on the specific company supply/case. We also note that the component that inspires the least confidence is judged to be the least expensive.
Weights: With regard to the KPI weights defined in the methodology, for KPI1, the component criticality mean values are as follows: hardware unit weight = 3.3, on-board gateway weight = 2.6, and IoT platform weight = 4.3.
For KPI2, the mean values for the levels of importance of price versus accuracy are 4.8 and 6, respectively. The mean values for component criticality are the same as those used for KPI1, with the following median values: accuracy weight = 6, hardware unit weight = 3, on-board gateway weight = 2, and IoT platform weight = 5.

3.4. Benchmarking Analysis

This section presents the results of the benchmarking analysis, organised into two sections. The first section examines the data collected according to the predefined criteria, while the second presents the KPIs obtained, supported by relevant figures and tables.

3.4.1. Criteria for the Benchmarking

The collected data were characterised and categorised according to predefined criteria for the purposes of the benchmarking analysis. The analysis focused on device and company characteristics, summarising the most relevant information for each criterion.
Implemented technology: The market offers several solutions for APC systems, classified according to the technologies implemented. The most common technology is stereoscopic optical technology, often combined with infrared sensors for greater accuracy. Other methods are also available, such as Time-of-Flight (ToF) technology and wireless solutions.
Accuracy: When choosing an APC solution, customers prioritise accuracy as a crucial feature of the device. Although online accuracy tends to be consistently high (98% or higher) across companies, regional legislation imposes minimum accuracy levels in order for a device to be eligible for public funding. However, our interview results indicate that real-world accuracy is often 20–30% lower than advertised values, highlighting a significant gap between datasheet claims and real performance.
Environment and device coverage: Environmental standards such as EN50155, EN 50125-1, and ISO 16,750 are important for the development of APC devices. Regional legislation in Piedmont requires compliance with EN50155. Visual solutions generally require one device per door, while Wi-Fi solutions vary according to vehicle size, external interference, and software calibration. The corresponding standards for each device are listed in Table 1, in the “Environment” column.
Interfaces and interference: Various communication interfaces are available on the market for APC systems, including RS-485, Fast Ethernet, PoE Ethernet, WLAN, 3G/4G/LTE, and Wi-Fi, each with its own pros and cons. Transport companies can use this information to choose the most suitable solution. Regional legislation suggests the purchase of APC devices with PoE interfaces because of the advantages that these interfaces offer. Interference problems depend on the technology implemented: wired solutions are more robust but require more resources for installation and maintenance, and wireless solutions are easier to install but susceptible to interference, while Wi-Fi solutions require software calibration and the use of routers.
Robustness: Robustness and certification standards, such as IP Code (IP30, IP65, and IP67), play a key role in ensuring the durability of APC devices and protection from adverse conditions. Regional legislation often requires compliance with the IP65 standard, while it emerges from interviews that box breakages and related problems occur only rarely.
Criteria relating to company characteristics are pricing, system integration, and price, as discussed below.
Pricing: The decision to operate as a manufacturer or system integrator is influenced by various factors, including experience, technical skills, and the challenges associated with the hardware industry. The interviews highlight the advantages of an SaaS model for system integrators, with higher profit margins and the use of third-party processing to optimise production costs and ensure timely supplies. The installation process involves training the integrator as a “trainer” through courses provided by the manufacturer, while the involvement of dealers as intermediaries between manufacturers and customers can facilitate negotiations. Warranty contracts and maintenance efforts are typically included in the capital expenditure (CAPEX) of the contracting authority, with considerations such as repair times and the size and distribution of bus lines.
System integration: The system integration criterion focuses on the level of integration offered to customers and the criticality of the APC system components. Transport companies prefer the provision of hardware components, with the IoT platform as the most critical element (median = 5), followed by the hardware component (median = 3), and the least critical AVM unit (median = 2).
Price: When pricing APC systems, it is essential to consider the different technologies and deployment scenarios. The interviews show that Eurotech products are perceived as efficient and reliable, despite being more expensive. Integration with existing vehicle systems is emphasised by both system integrators and transport companies to reduce implementation costs. In addition, increasing the quantity of components supplied can help reduce shipping costs.

3.4.2. Key Performance Indicators

The values of variable C (component price) were set according to the prices from tenders mentioned above. For the APC hardware unit price, we used Eurotech’s 2021 offer concerning the supply of hardware to system integrators by authorised dealers. For the gateway and IoT platform price, we used tender data from 2015 (see Section 3.2) relating to a smart-ticket bus fleet monitoring system. For the IoT platform, outsourcing was chosen. The component prices are:
  • hardware unit: EUR 758;
  • on-board gateway: EUR 1670;
  • IoT platform: EUR 11,000.
The weights for the typical component criticalities were established according to the average results of the survey (see “Weights” in Section 3.3) and then normalised. Hence, the values of weights obtained using Equation (2) are:
  • hardware unit weight: 0.46;
  • on-board gateway weight: 0.32;
  • IoT platform weight: 0.66.
Using these values and Equation (1), KPI1 was computed using Equation (4).
K P I 1 = 2 × 40 × 45 + 2 × 2 × 35 + 0.46 × 758 + 0.32 × 1670 + 0.66 × 11.000
The resulting value for KPI1 is EUR 11,883.08.
Note that this value is expressed in euros (EUR), as it refers to a cost. It is a cost that weights the internal and external costs of APC systems, giving them lesser or greater prominence according to the issues or allocated resources that each component or work requires. In this example, only two types of internal costs were considered: data management and maintenance. In real projects, the number of types of internal work is much higher, resulting in a higher total cost. Therefore, this cost value cannot be considered a realistic expense for the possible purchase of the system. This indicator is intended to compare the different solutions available on the market and not to obtain the price of the system.
From this preliminary result, the second KPI (KPI2) could then be estimated with reference to Equation (3). KPI2 refers to the linear combination of the cost and accuracy of the system, thus assessing the overall value proposition of different APC systems in terms of their accuracy. Instead, KPI1 quantifies the relative cost efficiency between various APC products. In order to be as realistic as possible, the accuracy value was set according to the data published in the Eurotech DynaPCN 10-20-01 datasheet, that is to say 98%, and not according to real values (much lower). In this way, the knowledge and the data used as settings were the same as for a hypothetical customer who uses these indicators to estimate the performance of a potential solution without knowing the real values. Hence, in accordance with the steps and instructions presented in the methodology, the accuracy value is 98%.
In addition, to estimate KPI2, the two weights needed to balance the linear combination of the variables cost and accuracy are:
  • cost weight: 0.76 1 ;
  • accuracy weight: 1.
Using these weight values and Equation (3), KPI2, computed using Equation (5), is equal to 92.15 and is a dimensionless value; it is a score that ranks systems based on the weighting of cost and accuracy.
K P I 2 = 0.76     ×       11 , 883.08 1       ×       98 = 92.15
This value makes it possible to compare different solutions available on the market, offering a clear and immediate ranking of available systems. Unfortunately, as in the case of KPI1, it is not possible to define an upper limit for KPI2 due to the cost that can vary between different tenders, because their upper limit is unknown. To achieve the best possible solution, KPI2 must be minimised, such that the best solution is the one with the lowest value, in other words, the tender with the lowest cost (numerator) and the highest accuracy (denominator).

4. Discussion

The results obtained are intended to be useful to stakeholders, enabling them to compare APC systems and to make informed decisions on the allocation of resources.
First, the analysis revealed that most APC systems advertise accuracies of 95% or higher according to company datasheets. Regional legislation in some Italian regions, such as Piedmont, Lombardy, Friuli-Venezia Giulia, and Apulia, imposes minimum accuracy levels established by third parties in order for systems to be eligible for state subsidies.
However, the interviews reveal a significant disparity between the accuracy of APC systems as advertised in product datasheets and their actual performance under real conditions, with a drop of 20–30% in real accuracy. A manager from a regional transport company explained that the process of verifying the accuracy of APC systems is mainly conducted in the laboratory, with simulated passenger counts that may require passengers to make specific gestures, or other adjustments to be made, for results to be accurate.
The disparity between stated accuracy and actual accuracy represents a critical concern within the context of APC systems. Remarkably, although purchasers of systems are aware of this disparity, they mostly choose not to bring it to the forefront for contractual and funding reasons. At the same time, the survey reveals their insistence on retaining data acquired from APC systems for their exclusive use. Considering that companies are aware of the unreliability of these systems (the 20–30% discrepancy mentioned above), it is hard to see how the use of data that they know to be unreliable can help them to design and plan effective transport systems.
About one-third of respondents consider both ‘one-shot’ and annual full-service contracts to be convenient, with a preference for annual contracts as fleet size increases. The common trend is to prefer a single full-service contract, although in the future, the market may shift towards offering full IoT services. Transport companies with high fleet penetration prefer separate full-service contracts for items, service, and data management, considering the IoT platform and APC hardware as critical system components.
That being said, a contradiction between company preferences and reality is also evident in this case. The survey has brought to light how companies secure a portion of their funding for the procurement of these systems through public subsidies. These subsidies are primarily allocated on an annual basis and can fluctuate from year to year. In most instances, these public subsidies can be utilized for system acquisition in the current fiscal year. Consequently, there exists a disparity between what is pragmatically favoured by companies in terms of entrepreneurial advancement (fleet expansion and software technological innovations) and what is economically and commercially advantageous. From an entrepreneurial perspective, opting for an annual full-service contract is certainly preferable due to the aforementioned reasons. However, in the realm of economics, adopting a ‘one-shot’ contract approach allows for the substantial utilization of public subsidies designated for such investments, thereby exerting a lesser financial burden on the corporate balance sheet. Frequently, this approach is favoured by company management.
Concerning the hardware component, nearly half of the companies consider APC hardware units to be critical. Interviews with local transport companies revealed a significant issue of device unbalancing on buses due to jolting, requiring almost constant maintenance, a fact often under-represented in online data. Typically, transport companies outsource the supply and configuration of APC hardware to system integrators, who provide comprehensive services including component supply, installation, testing, system design, and documentation, as well as warranty and maintenance contracts. Expenditure for these authorities is classified into Capital Expenditure (CAPEX) and Operational Expenditure (OPEX), with CAPEX covering the supply of hardware and the services of integrator and OPEX covering operational management contracts. Despite the importance of maintenance contracts in OPEX, their influence on the choice of APC manufacturer or model is limited. Post-warranty, hardware maintenance costs are often transferred to the customer as part of separate maintenance contracts. These contracts generally transfer the hardware costs directly to the customer and charge the work performed on an hourly basis; we have tried to reflect this in the cost calculation.
The costs linked to these units are seen as being mostly due to the maintenance effort required by installed devices, rather than the cost of installing them in the first place. In addition, price considerations emerged, where the analysis of tender data revealed the importance of price in distinguishing and ranking different solutions. Particularly noteworthy is the revelation that the perceived costs concerning the three main components of APC systems are not in line with reality. The survey shows that the costs perceived by companies for the hardware unit, on-board gateway, and IoT platform components are 35%, 45%, and 20%, respectively. However, insights gleaned from worker interviews, specifically regarding pricing, reveal that the perceived cost for the hardware component is significantly higher than the actual cost (inclusive of maintenance expenses). The synthesis of these two aspects—namely, the critical perception of the hardware component and the much lower actual percentage cost compared to the perceived cost—requires thoughtful consideration.
It would be prudent for companies to consider investing in APC systems over a time frame of no less than five to ten years. This approach underscores the fact that hardware cost is a one-time expense and, thus, marginal in relation to the cost of the other two components. The implication of this logic is that companies might find it advantageous to consider acquiring more robust hardware systems (potentially at a higher initial cost) for two reasons. Firstly, the costs of hardware components would nonetheless remain marginal in the context of the entire system expenditure. Secondly, hardware components play a critical role and often require maintenance, which can lead to temporary unavailability of the vehicle and the loss of significant data when the system is non-operational while the vehicle remains in service. Opting for more robust hardware components would alleviate both problems without unduly impacting the long-term economic outlook.
The method for calculating KPI1 provides a benchmark for obtaining the prices proposed by integrators, but considers only the costs of data management and maintenance, whereas real projects involve various other types of internal work that increase the total cost. In addition, fleet size also influences the price of the system, with a different cost distribution for software and services than for hardware. The lack of price specifications further complicates the collection of price data and hampers the understanding of the purchasing process.
Defining a price for an APC system is challenging because of the many factors to be considered. For transport companies, it is recommended to iterate the calculation of KPI1 using the data and solutions from the quotations, selecting the solution with the lowest value, to minimise the cost in order to choose the optimal solution. However, setting an upper limit for KPI1 is impossible due to variable costs between tenders.

5. Conclusions

This research aims to shed light on APC technologies and support transport companies purchasing these systems in choosing the best solutions on the market through specific metrics. To this end, we have attempted to provide a sound framework through the use of key performance indicators (KPIs). The data underpinning these KPIs may vary depending on the specific circumstances of each transport authority, tender, and business requirements. KPI2 implies a choice between using the manufacturer’s advertised accuracy or conducting independent tests to check the accuracy in real field. The drawback is the cost of the test but allowing a more customised and potentially more accurate assessment of APC technologies.
This study identifies major APC manufacturing companies and system integrators, analyses APC products from a technical and functional perspective, and examines the business systems of these companies. Data were collected through website searches, interviews, and a quantitative survey, from which we obtained a wealth of information on APC products, but only limited information on activities, prices, and pricing models. The work provides interested stakeholders with an overview of APC products and companies, an interpretation of accuracy, insights into contract possibilities and preferences, and benchmarks for APC system costs.
In continuing the work begun, it is our intention to broaden the survey audience, to collect more data on pricing policies and components, and to monitor the evolution of technology and the appearance of new systems on the market. This is particularly important because in the literature, to the best of our knowledge, there are no indicators allowing for the comparison of APC systems from a financial point of view. Thus, we need to collect more data to try to identify thresholds to facilitate the comparison.

Author Contributions

Conceptualisation, C.P.; methodology, C.P.; validation, C.P., L.B. and D.A.; formal analysis, L.B. and D.A.; investigation, C.P., L.B. and D.A.; resources, C.P.; data curation, C.P., L.B. and D.A.; writing—original draft preparation, C.P. and D.A.; writing—review and editing, C.P.; supervision, C.P.; project administration, C.P.; funding acquisition, C.P. All authors have read and agreed to the published version of the manuscript.

Funding

This research received no external funding.

Informed Consent Statement

Informed consent was obtained from all subjects involved in the study.

Data Availability Statement

The data are not publicly available due to privacy of the companies and individuals involved.

Acknowledgments

This research study was made possible through the collaboration and support of several transport companies that responded to the questionnaire and to the interviewed people form the selected companies cited in the paper. We also thank Mobyforall, the company where this work was developed.

Conflicts of Interest

The authors declare no conflicts of interest.

References

  1. Ben-Akiva, M.E.; Lerman, S.R. Discrete Choice Analysis: Theory and Application to Travel Demand; MIT Press Series in Transportation Studies; MIT Press: Cambridge, MA, USA, 1985; ISBN 978-0-262-02217-0. [Google Scholar]
  2. Cervero, R. Mixed Land-Uses and Commuting: Evidence from the American Housing Survey. Transp. Res. Part Policy Pract. 1996, 30, 361–377. [Google Scholar] [CrossRef]
  3. Banister, D. The Sustainable Mobility Paradigm. Transp. Policy 2008, 15, 73–80. [Google Scholar] [CrossRef]
  4. Butler, L.; Yigitcanlar, T.; Paz, A. How Can Smart Mobility Innovations Alleviate Transportation Disadvantage? Assembling a Conceptual Framework through a Systematic Review. Appl. Sci. 2020, 10, 6306. [Google Scholar] [CrossRef]
  5. Cruz, C.O.; Sarmento, J.M. “Mobility as a Service” Platforms: A Critical Path towards Increasing the Sustainability of Transportation Systems. Sustainability 2020, 12, 6368. [Google Scholar] [CrossRef]
  6. Pu, Z.; Zhu, M.; Li, W.; Cui, Z.; Guo, X.; Wang, Y. Monitoring Public Transit Ridership Flow by Passively Sensing Wi-Fi and Bluetooth Mobile Devices. IEEE Internet Things J. 2020, 8, 474–486. [Google Scholar] [CrossRef]
  7. Halyal, S.; Mulangi, R.H.; Harsha, M.M. Short-Term Passenger Demand Modelling Using Automatic Fare Collection Data: A Case Study of Hubli-Dharwad BRTS. Adv. Transp. Stud. 2023, 59, 103–122. [Google Scholar]
  8. Grgurević, I.; Juršić, K.; Rajič, V. Overview of Wi-Fi-Based Automatic Passenger Counting Solutions in Public Urban Transport. In EAI/Springer Innovations in Communication and Computing; Springer Science and Business Media Deutschland GmbH: Berlin/Heidelberg, Germany, 2022; pp. 181–196. [Google Scholar]
  9. Qureshi, K.; Abdullah, A. A Survey on Intelligent Transportation Systems. Middle-East J. Sci. Res. 2013, 15, 629–642. [Google Scholar]
  10. Nitti, M.; Pinna, F.; Pintor, L.; Pilloni, V.; Barabino, B. Iabacus: A Wi-Fi-Based Automatic Bus Passenger Counting System. Energies 2020, 13, 1446. [Google Scholar] [CrossRef]
  11. Olivo, A.; Maternini, G.; Barabino, B. Empirical Study on the Accuracy and Precision of Automatic Passenger Counting in European Bus Services. Open Transp. J. 2019, 13, 250–260. [Google Scholar] [CrossRef]
  12. Osama, A.; Mahdy, H.; Kandil, K.; Elhabiby, M. Monitoring the Impact of Unscheduled Stops and Unscheduled Route Deviations on Bus Service Using Automatic Vehicle Location System: A Case Study. Adv. Transp. Stud. 2016, 39, 37–48. [Google Scholar]
  13. United States Department of Transportation. ITS Transit Fact Sheet—Automatic Passenger Counter—ITS Professional Capacity Building Program. Available online: https://www.pcb.its.dot.gov/factSheets/apc/apc_overview.aspx#page=tech (accessed on 10 October 2022).
  14. Baltes, M.; Rey, J. The “Ins and Outs” of APCs: An Overview of Automatic Passenger Counters. J. Public Transp. 1999, 2, 47–64. [Google Scholar] [CrossRef]
  15. Chen, M.; Liu, X.; Xia, J.; Chien, S.I. A Dynamic Bus-Arrival Time Prediction Model Based on APC Data. Comput. Aided Civ. Infrastruct. Eng. 2004, 19, 364–376. [Google Scholar] [CrossRef]
  16. Cheng, S.; Liu, B.; Zhai, B. Bus Arrival Time Prediction Model Based on APC Data. In Proceedings of the 6th Advanced Forum on Transportation of China (AFTC 2010), Beijing, China, 16 October 2010; pp. 165–169. [Google Scholar]
  17. Zhou, P.; Zheng, Y.; Li, M. How Long to Wait? Predicting Bus Arrival Time with Mobile Phone Based Participatory Sensing. In Proceedings of the 10th International Conference on Mobile Systems, Applications, and Services, Association for Computing Machinery. New York, NY, USA, 25 June 2012; pp. 379–392. [Google Scholar]
  18. Regione Piemonte, D.G.R. n. 40-5004. Available online: https://trasparenza.regione.piemonte.it/media/7241/download (accessed on 9 January 2022).
  19. Diyasa, I.G.S.M.; Purbasari, I.Y.; Setiawan, A.; Winardi, S. Smart Passenger Information System Based On IoT. In Proceedings of the 2019 TRON Symposium (TRONSHOW), Tokyo, Japan, 11–13 December 2019; pp. 1–5. [Google Scholar]
  20. IVECO BUS Home Page. Available online: https://www.iveco.com/ivecobus/es-es/Pages/Home-Page.aspx (accessed on 11 December 2022).
  21. Nasir, A.S.A.; Gharib, N.K.A.; Jaafar, H. Automatic Passenger Counting System Using Image Processing Based on Skin Colour Detection Approach. In Proceedings of the 2018 International Conference on Computational Approach in Smart Systems Design and Applications (ICASSDA), Kuching, Malaysia, 15–17 August 2018; pp. 1–8. [Google Scholar]
  22. Kimpel, T.J.; Strathman, J.G.; Griffin, D.; Callas, S.; Gerhart, R.L. Automatic Passenger Counter Evaluation: Implications for National Transit Database Reporting. Transp. Res. Rec. 2003, 1835, 93–100. [Google Scholar] [CrossRef]
  23. Ragland, D. Estimating Pedestrian Accident Exposure: Automated Pedestrian Counting Devices Report; University of California: Berkeley, CA, USA, 2007. [Google Scholar]
  24. Jalali, S. Estimating Bus Passengers’ Origin-Destination of Travel Route Using Data Analytics on Wi-Fi and Bluetooth Signals. Ph.D. Thesis, University of Ottawa, Ottawa, ON, Canada, 2019. [Google Scholar]
  25. Håkegård, J.E.; Myrvoll, T.A.; Skoglund, T.R. Statistical Modelling for Estimation of OD Matrices for Public Transport Using Wi-Fi and APC Data. In Proceedings of the 21st International Conference on Intelligent Transportation Systems (ITSC), Maui, HI, USA, 4–7 November 2018; ISBN 978-1-72810-323-5. [Google Scholar]
  26. Li, L. Time-of-Flight Camera—An Introduction. Available online: https://www.ti.com/lit/pdf/sloa190 (accessed on 13 January 2023).
  27. Kotz, A.J.; Kittelson, D.B.; Northrop, W.F. Novel Vehicle Mass-Based Automated Passenger Counter for Transit Applications. Transp. Res. Rec. 2016, 2563, 37–43. [Google Scholar] [CrossRef]
  28. Li, G.; Chen, A. Frequency-Based Path Flow Estimator for Transit Origin-Destination Trip Matrices Incorporating Automatic Passenger Count and Automatic Fare Collection Data. Transp. Res. Part E Logist. Transp. Rev. 2022, 163, 102754. [Google Scholar] [CrossRef]
  29. Rose, S.; Engel, D.; Cramer, N.; Cowley, W. Automatic Keyword Extraction from Individual Documents. In Text Mining: Applications and Theory; John Wiley & Sons, Inc.: Hoboken, NJ, USA, 2010; pp. 1–20. [Google Scholar] [CrossRef]
  30. Naderifar, M.; Goli, H.; Ghaljaie, F. Snowball Sampling: A Purposeful Method of Sampling in Qualitative Research. Strides Dev. Med. Educ. 2017, 14. [Google Scholar] [CrossRef]
  31. Sobral, T.; Galvão, T.; Borges, J. Visualization of Urban Mobility Data from Intelligent Transportation Systems. Sensors 2019, 19, 332. [Google Scholar] [CrossRef]
  32. Kistowski, J.V.; Arnold, J.A.; Huppler, K.; Lange, K.-D.; Henning, J.L.; Cao, P. How to Build a Benchmark. In Proceedings of the 6th ACM/SPEC International Conference on Performance Engineering, Association for Computing Machinery. New York, NY, USA, 31 January 2015; pp. 333–336. [Google Scholar]
  33. Pronello, C.; Garzón Ruiz, X.R. Evaluating the Performance of Video-Based Automated Passenger Counting Systems in Real-World Conditions: A Comparative Study. Sensors 2023, 23, 7719. [Google Scholar] [CrossRef]
  34. ISO 16750. Available online: https://en.wikipedia.org/w/index.php?title=ISO_16750&oldid=1088542724 (accessed on 30 August 2023).
  35. IP Code. Available online: https://en.wikipedia.org/w/index.php?title=IP_code&oldid=1188610955 (accessed on 12 August 2023).
  36. ISTAT. Nic—Medie Annue Dal 2016 (Base 2015). Available online: http://dati.istat.it/Index.aspx?QueryId=23063 (accessed on 7 January 2022).
Figure 1. Methodology of research.
Smartcities 07 00013 g001
Figure 2. Smart search tool searching and sorting approach.
Smartcities 07 00013 g002
Figure 3. Geographic locations of the respondent companies.
Smartcities 07 00013 g003
Figure 4. Utility of APC systems for planning and operation.
Smartcities 07 00013 g004
Figure 5. APC data reliability.
Smartcities 07 00013 g005
Figure 6. Level of effort required to understand and use APC data.
Smartcities 07 00013 g006
Figure 7. Accuracy defined by third parties.
Smartcities 07 00013 g007
Figure 8. Level of acceptance of different contract modes.
Smartcities 07 00013 g008
Figure 9. Level of acceptance of single or separate service contracts.
Smartcities 07 00013 g009
Figure 10. Pricing model of APC systems.
Smartcities 07 00013 g010
Figure 11. Components of APC systems seen as most likely to fail.
Smartcities 07 00013 g011
Figure 12. Acceptance of accuracy reduction versus cost halving.
Smartcities 07 00013 g012
Figure 13. Purchase method of APC systems.
Smartcities 07 00013 g013
Table 1. Products of the companies selected and criteria used for the benchmarking.
CompanySolutionTechnologyAccuracyEnvironmentCoverageInterfaceRobustness
Dilax IntelcomDILAX IRS-400Stereoscopic 3D99%-1 per doorGSM/GPRS/Wi-FiIP65
Foorir Binocular camera (BC)98%-1 per doorRJ45/RS485/WI-FIT: −20 °C to 40 °C, Hum: 10–80%
ErmetisZyklop PeopleBC98%EN501551 per doorRS485, Wi-FiIP65
EurotechDynaPCN 10-20-01Stereoscopic vision and IR98–99%EN501551 per doorRS-485, Ethernet PoE EthernetIP65
FootfallcamFootfallCam 3D Pro2Stereoscopic 3D vision99.5%min 1 lux1 per doorEthernet or PoE Ethernet/WI-FIT: −10 °C to 45 °C, Hum: 10–90%
Hella AglaiaAPS-BStereoscopic vision and IR99%EN 50125-11 per doorEthernet or PoE EthernetIP65
IRIS Intelligent SensingIRMA Matrix3D IR matrix sensor (ToF)99%EN501551 per doorCAN/PoE Ethernet Wi-Fi IBIS-IPIP65/IP67
Microlog-Stereoscopic 3D95%-1 per door-n.a.
MRB make recording betterHCP-168-HCP088BC-3D vision95–98%0 lux1 per doorRJ45/RS45 or RS485/WI-FIIP43
Softailor BC90%-1 per door-n.a.
StremaxAPC-P3BC-3D vision99%-1 per door n.a.
XovisPTC-13D light sensor technology99%EN501551 per doorEthernet or PoE Ethernet/WI-FIIP65
Exeros-3D light sensor99%-1 per door-n.a.
InfodevDA-4003D light directional sensor97.5–99.5%-1 per doorRS-485/PoE Ethernet/Wi-Fi, GSMn.a.
InterautomationVDV457 v2.12D/3D sensor99%-1 per door-n.a.
Masstrans-BC-3D vision ToF97%-1 per door n.a.
R2P-Stereoscopic 3D vision98%-1 per doorWi-Fi, Ethernet, RS485, RS232, LoRaWANn.a.
RETAIL Sensing-BC98%-1 per doorWi-Fi, Ethernet, RS485, RS232,n.a.
Trip people counter-Wi-Fi solution% error: 10%EN50155vehicle-size basedTeltonika RUT955IP30
V-CountUltima GOStereoscopic 3D vision98%min 30 lux1 per doorEthernet or PoE EthernetT: −15 °C to 40 °C, Hum: 10–90%
Note: n.a.—not available.
Disclaimer/Publisher’s Note: The statements, opinions and data contained in all publications are solely those of the individual author(s) and contributor(s) and not of MDPI and/or the editor(s). MDPI and/or the editor(s) disclaim responsibility for any injury to people or property resulting from any ideas, methods, instructions or products referred to in the content.

