1. Introduction
The healthcare industry has undergone significant changes in recent years due to the substantial increase in intelligent services. Electronic healthcare systems (eHealth) represent the promising future for healthcare by offering new and innovative ways to employ technology to enhance healthcare [
1]. The aim is to improve the effectiveness and efficiency of the healthcare industry while providing better, more value-added, and cost-effective healthcare services to patients.
In response to the COVID-19 pandemic, research has recently focused on automating healthcare systems, particularly for allergy and immunology diseases. Such systems enable patients to receive care from the comfort of their homes. Several intelligent healthcare systems have been introduced for various allergy and immunology diseases, especially for asthma [
2,
3,
4,
5,
6].
Asthma is one of the most pervasive inflammatory illnesses that inflames the airways and gives rise to respiration difficulties that culminate in allergy−induced asthma attacks. It has emerged as a widespread chronic respiratory ailment, impacting millions across the globe. It is a life-threatening condition, and the number of people with asthma is increasing rapidly [
7]. The traditional approach to managing asthma attacks is reactive and relying on the patient to recognize the symptoms and seek medical attention.
When designing an eHealth system for asthma patients, it’s crucial to consider multiple variable contexts to ensure a positive user experience. The primary objective is to provide satisfactory health services that protect asthma patients from risk factors specific to their health status, environment, and location. Therefore, an effective eHealth should offer asthma attack prediction to prevent attacks and a personalized risk factor visualization tool to enhance the environmental experience.
The research community has made numerous efforts to develop tools for predicting asthma attacks and visualizing risk factors. However, there are still some gaps that need to be considered. These gaps include the use of limited risk factors in prediction models, the use of traditional machine learning techniques, the inability to predict asthma attacks in real time, and the lack of personalized visualization tools.
This paper presents an intelligent healthcare system that predicts and prevents asthma attacks by recommending safe routes. The system utilizes real-time data from multiple sources, such as weather conditions, air quality, and patient’s health data, to anticipate the likelihood of an asthma attack. It then suggests safe routes to follow based on current air quality and other environmental factors.
The proposed system offers numerous advantages over existing asthma management systems. It is proactive, allowing patients to take preventive measures before an asthma attack occurs. Furthermore, it offers personalized recommendations based on patient-specific data, which can significantly enhance treatment outcomes. Additionally, the system assists patients in avoiding triggers that may cause asthma attacks, such as exposure to environmental pollutants.
The proposed system leverages cloud computing technology, allowing for scalability and accessibility of the asthma care framework. By utilizing cloud-based resources, the system can analyze large amounts of data in real-time, while making it available to healthcare providers, patients, and caregivers. This approach facilitates the integration of new data and feedback, improving the accuracy and effectiveness of the system’s prediction models. One of the key advantages of the proposed system is that it provides a personalized approach to asthma attack prediction and safe route recommendation models. These models are constantly refined and improved through cloud-based adaptive learning algorithms. By providing proactive recommendations, the system helps patients avoid triggers and stay healthy, ultimately leading to a more effective and efficient healthcare system.
The contributions of this research can be outlined in the following points:
Personalized asthma attack prediction: The proposed system aims to develop a personalized asthma attack prediction model using advanced machine learning techniques. By taking into account various personal and environmental risk factors, this model can provide more accurate and tailored predictions of asthma attacks. Such a personalized approach is a novel contribution to the field of asthma care where existing systems often rely on generalized risk factors rather than individual patient characteristics.
Safe route recommendation: The safe route recommendation model of the proposed system is a noteworthy addition to the field of asthma care. It factors in different contextual and spatial contexts to suggest the safest route to the intended destination, while also considering the user’s health condition and potential risk factors along the way. This approach is an innovative solution to guarantee the safety and well-being of asthma patients during travel.
Adaptive learning: The proposed system incorporates a crucial feature of system adaptation, which enables it to continuously improve its predictions and recommendations based on new data and user feedback. This novel solution to the challenge of maintaining accuracy and effectiveness over time allows the system to learn from experience and user input. The inclusion of an adaptation layer is a significant addition to the system, as it ensures its continued relevance and effectiveness in assisting asthma patients in managing their conditions.
The rest of this paper is structured as follows. In
Section 2, we provide a detailed description of the proposed framework, including its components.
Section 3 presents the implementation and testing of the system. In
Section 4, we analyze the results of the implementation.
Section 5 contains a literature review followed by a comparative analysis in
Section 6. Finally, we conclude the paper in
Section 7 and discuss future work.
2. Materials and Methods
By leveraging contextual and spatial data, our framework offers users a variety of services. This includes predicting asthma exacerbations and attacks and recommending the safest route to avoid any potential risks.
The framework is composed of six layers (refer to
Figure 1). The initial layer is responsible for data collection and loads data from various datasets. These datasets are then passed onto the second layer, known as data pre-processing, which handles missed values and outliers. The third layer is the machine learning layer, which uses integrated asthma attack prediction datasets to build two ML models. One model predicts asthma attacks while the other predicts route risk levels. Pre-processed data is used to train these models, which are then saved over the cloud using Google Cloud services for real-time predictions in the next layer. The fourth layer is the safe route recommendation layer. This layer comprises two functions gain direction and risk factor extraction—which utilize API services to obtain the necessary information. The fifth layer is the application layer, providing users with various services, including asthma attack prediction, safe route recommendation, risk level prediction, and AQI heatmap visualization. Finally, the system adaptation layer aids developers in upgrading the application based on user feedback and system performance. Each of these layers is explained in detail below.
2.1. Data Source and Ethical Considerations
Data was collected from Makkah and Jeddah, Saudi Arabia, from 24 March to 30 June 2021, approved by the Research Centre in the Ministry of Health, Health Programs and Chronic Disease in Makkah, Saudi Arabia [
8]. The researchers collected the dataset from twenty-one volunteers aged twelve years or more, ranging in asthma disease severity. All study participants were recruited from Makkah health centers with their written informed consent obtained (IRB Number: H-02-K-076-1220-421, Date of Issue 21 December 2020). The identity of patients was anonymized by assigning them tracking numbers for registration and daily data recording.
At the outset of recruitment, we documented the patient’s characteristics, taking into account their medical history and asthma symptoms over the past four weeks. We employed an Asthma Control Test (ACT) [
9] questionnaire to record historical information for the prior four weeks. We employed Google Forms to capture these data. After that, we requested participants to download My Health application, built specifically for this study, or to utilize the Google Form to register their daily asthma bio-signals linked to asthma symptoms. The symptom recording was based on a five-level scale: never, rarely, sometimes, often, and always. This dataset was previously utilized as a central component in another research study [
10], wherein it played a significant role in investigating various aspects or questions related to the subject matter.
2.1.1. Data Collection Layer
The system operates using two primary datasets: the asthma dataset and the route dataset. The asthma dataset comprises three primary components, namely the patient’s historical medical record (HMR), daily bio-signals symptoms, and environmental conditions. These components are critical in understanding and managing asthma effectively. These components are described below:
All of these features have been combined into a single dataset for predicting asthma attacks.
Table 2 displays all of the features that have been collected. The values for these features range from one to five, with one indicating rare symptoms and five indicating strong symptoms.
The route dataset is a synthetic compilation of various risk factors that can contribute to an increased likelihood of asthma attacks. These factors include Air Quality Index (AQI), construction sites, gas stations, traffic jams, and grill restaurants. AQI plays a significant role in determining the quality of a route, with higher AQI readings indicating poorer air quality, which can negatively affect asthma patients and lead to attacks. Construction sites contain substances such as chemical compounds and wood dust that can trigger asthma symptoms [
14]. Traffic jams increase AQI, directly causing asthma attacks [
15]. Gas stations release harmful substances that can also impact asthma patients [
16]. Grill restaurants produce charcoal grills that may increase air pollution, leading to smog and potentially exacerbating asthma symptoms [
17]. It’s important to note that the range of values for AQI typically ranges from 0 to 500, with elevated values signaling deteriorating air quality.
To generate this synthetic dataset, we have considered all potential values that can be extracted from the current state of a route. These values are listed in
Table 3. On average, there are five possible construction sites, gas stations, and grill restaurants per leg of the route, which can range from 100 to 5000 m (5 Km) according to [
18]. AQI readings vary from 1 to 5, based on the data retrieved from the open weather map. By incorporating all of these risk factors and their potential occurrences, we can simulate various scenarios that can help predict asthma attacks and analyze route features.
2.2. Data Pre-Processing Layer
The data pre-processing stage involves filling in missing values and eliminating outliers in each collected dataset separately. We adopted two different methods to fill in the missing values of the dataset. For patient variables, we used the mean value, whereas, for environmental variables, we used the interpolated value. We used the mean value for patient data as their health condition could be stable on one day and change on another. In contrast, we employed the interpolated value for environmental data as we needed to fill in missed data to be more proximate to the previous and next values.
Afterward, we removed the outliers by using the Interquartile Range (IQR) method [
19]. This involved dividing the dataset into three quartiles to measure the variability of the data. The first quartile included the data below the median, while the third quartile included the data above the median. The second quartile was the difference between the third and first quartiles (IQR = Q3 − Q1). Any observations that fell below the threshold of (Q1 − 1.5 × IQR) or above the threshold of (Q3 + 1.5 × IQR) were excluded.
We combined the cleaned dataset by using the patient’s record date, location, and environmental records. However, the integrated dataset had imbalanced classes, with class 0 (no attack in our dataset) being significantly larger than class 1 (attack in our dataset) at a ratio of 59:7. To address this, we used a hybrid method to balance the dataset. Firstly, we eliminated ambiguous examples in the majority class using the Edited Nearest Neighbour algorithm (ENN) [
20]. Then, we used the Synthetic Minority Over-sampling technique with a Support Vector Machine (SMOTE-SVM) [
21] to balance the dataset. This hybrid approach allowed us to create a balanced dataset for further analysis.
2.3. Machine Learning (ML) Layer
Two machine learning models were developed in this layer: one for personalized asthma attack prediction, and another for predicting route risk levels. XGBoost was used as the machine-learning algorithm for both models.
XGBoost, short for Extreme Gradient Boosting, is an advanced machine learning technique that has gained popularity due to its high performance and versatility [
22]. Advanced machine learning techniques are important. They enable the extraction of meaningful insights from complex data and uncover hidden patterns. Additionally, they make accurate predictions, which leads to informed decision-making and improved outcomes across various domains. By leveraging advanced machine learning, we can unlock the full potential of data. This allows drive innovation and tackle complex problems that traditional methods may struggle to address, ultimately advancing our understanding and capabilities in the digital age.
XGBoost serves as a distributed gradient-boosting decision tree machine learning library. This method employs an ensemble learning approach by combining predictions from multiple individual models, referred to as decision trees, to achieve accurate predictions [
22]. It is designed to maximize machine learning models’ performance and computational speed. Unlike the primary gradient-boosting algorithm, XGBoost builds trees in parallel rather than sequentially. It employs a step-by-step approach, scanning gradient values and employing partial sums to evaluate the quality of splits at each potential split within the training dataset [
23]. Overall, XGBoost is a powerful and versatile machine learning technique that excels in predictive modeling tasks. Its ability to handle large datasets, handle missing values, and provide feature importance analysis makes it a popular choice for both beginners and experienced practitioners in machine learning.
XGBoost is a robust algorithm widely used in various domains, including data science competitions, finance, healthcare, and more. The utilization of the XGBoost model was employed for simulating a biomass gasification system [
24], achieving high performance with a coefficient of determination of 0.96. In the context of predicting product sales in the large-scale retail sector, the XGBoost algorithm, combined with the Augmented Data (AD) technique, improved prediction accuracy and decreased error by about an order of magnitude [
25]. In the field of acute ischemic stroke (AIS) prediction, the XGBoost-based models using age, fasting glucose, and NIHSS scores demonstrated notable performance and provided valuable insights for clinical decision-making [
26]. Additionally, in the selective laser melting (SLM) process, an optimized XGBoost model showed high prediction accuracy and outperformed other models such as artificial neural network (ANN) and support vector regression (SVR) [
27]. In our study, XGBoost is trained with the collected dataset. The dataset is divided into 80:20 for training and testing. The asthma attack prediction model is trained with the processed asthma dataset, and the route risk level prediction model is trained with the route dataset. We use 5-fold cross-validation to train the models. The XGBoost models have hyperparameters for learning rate and max-depth, which we define and optimize using cross-validation. This produced the optimum values of 0.1 for the learning rate and 5 for max-depth. Finally, we save the ML models on Google Cloud Services for better accessibility.
2.4. Safe Route Recommendation Layer
This layer consists of two functions: direction acquisition and risk factor extraction. Google API services are utilized to obtain routing context, requiring the generation of an API key. An API functions as an interface between a specific development environment and the developers, enabling them to leverage the environment’s services without creating everything from scratch. Generally, APIs aim to conceal encapsulation details and emphasize the best practices for utilizing the code [
28].
The system needs to obtain the user’s current location and desired destination to utilize its functions. The ’Gain Direction’ function is responsible for acquiring these two locations by using the Google API key, which enables map services [
29]. The Direction API then takes the latitude and longitude of both locations as inputs to provide directions between them. This API is a web service that uses HTTP requests to return JSON or XML-formatted directions. The directions can be customized according to the user’s preferred mode of transportation, such as public transportation, driving, walking, or cycling [
18]. Each direction consists of various segments of the moving steps known as legs.
The function of extracting risk factors analyzes the given directions to identify places that could trigger asthma attacks. These include construction sites, gas stations, and grill restaurants. The Google Maps Places API and OSM API are used to recognize these places. OSM is preferred here since it returns the specified place parameter passed in the amenity tag as a string. For instance, searching for amenity = ‘restaurants’ returns all restaurants in a given place. On the other hand, Google Maps Places API uses a code instead of a string to pass the place type, making it challenging to search for construction sites found in OSM. Moreover, traffic jams in each route are identified by comparing the current travel time with the original required time saved in the distance matrix API. Finally, the AQI is extracted using OWM API. These extracted risk factors, along with the prediction result of an asthma attack, are passed to the risk level prediction model trained earlier in the third layer. The model provides the risk level of each leg in a route based on the extracted route’s context and the user’s personalized context.
The proposed methodology for the safe route recommendation model is precisely shown in
Figure 2. It describes how the model offers a route with a minor risk to the user. To begin with, the model acquires the user’s GPS location and prompts them to enter their desired destination. These locations include latitude and longitude parameters defined by Google Maps. The Google Direction API then utilizes these parameters [
18] to extract all possible directions, which are subsequently passed on to the route’s risk factor extraction function (R
).
Each route (R) is comprised of a series of legs (segments) that provide directional information from one point to another and include nearby amenities such as construction sites, gas stations, and restaurants. These amenities are identified through a risk factor extraction function.
The presence of a traffic jam is identified as a risk factor by comparing the current estimated travel time (E
) with the historical time (H
) stored in Google Maps’ distance-matrix API. This API calculates the distance and time between a set of origins and destinations [
29]. To estimate traffic time, the API uses a traffic model parameter that sets the assumptions. The response’s duration in the traffic field contains the expected time in traffic based on historical averages. If the current time exceeds the historical average by five minutes or more, a traffic jam is likely on that route.
The grill restaurant is considered a risk factor based on its opening hours. If it is closed, it will not be taken into account. For construction sites, the risk factor is activated as soon as the OSM amenities are updated. The AQI feature is assigned based on the value returned from OWM, which is shown in
Table 1.
To predict the level of risk associated with a particular route, several factors are taken into account, including the user’s asthma attack prediction model output. This information, along with environmental data and the specific details of the route, is fed into the risk level prediction model. The model then calculates a risk level for each leg of the journey using all the available data. To determine the overall risk score for the entire route, the predicted risk levels for each leg are added together and divided by the total number of legs (as shown in Equation (
1)).
The information for the route with the lowest score is combined with the information for the other routes and passed on to the next layer to be visualized as a Google map.
2.5. Application Layer
The system proposed in this study aims to offer users four main services. These include visualizing the AQI (air quality index) heatmap of their current location, predicting the likelihood of an asthma attack, recommending a safe route from their source to destination, and displaying the risk level of various routes.
The Open Weather Map (OWM) services are used to acquire the current AQI and weather conditions for the user’s area. OWM provides an API to retrieve the necessary data for any point globally. They achieve this by using multiple sources, including global numerical weather prediction models. They also incorporate data from weather stations, radars, and satellites.
The Air Quality Index (AQI) is presented as a heatmap that displays pollution concentration within a 1-kilometer radius of the user’s location. This is achieved by using the user’s geolocation to identify different points within the radius, and then connecting to the OpenWeatherMap (OWM) API using a unique API key. The API retrieves AQI values for all the points and the heatmap is generated by adding a folium layer to Maps. The AQI values are represented using a color scale starting with green for safe zone, yellow for under moderate, orange for moderate, red for over moderate, and purple for high values. Refer to
Table 1 in
Section 2.1.1 for possible AQI values, which are obtained from OWM [
30].
To receive a real-time prediction of an asthma attack, the user must input both historical and current bio-signal data through the application interface. Once submitted, the system uses Google’s application programming interface (API) key. This key is used to determine the user’s geographical location. It enables the allocation of environmental data using OWM API services. This information is then fed into the trained model, which is stored on Google Cloud, to predict the likelihood of an asthma attack.
Based on the prediction output for asthma attacks and the user’s location, the system recommends the safest route for users. Users input their destination, and the system obtains their current location, which is then passed to the previous layer to gather directions and identify risk factors. The system uses this information to generate a list of routes, each with a predicted risk level. The safest route is highlighted in blue, while other risky routes are displayed in gray to help users make informed decisions.
2.6. System Adaptation Layer
The proposed architecture includes a system adaptation layer that continuously improves the efficiency and accuracy of the learning models, making it a promising solution for various applications. This layer analyzes user feedback and determines the accuracy of the system’s prediction models, allowing for updates and adaptations. The system is also open to expert feedback regarding the sensors, devices, or advanced service mechanisms required to achieve optimal performance. This feedback assists in planning and estimating the necessary upgrades for the proposed system.
Moreover, the use of cloud computing technology enables scalability and accessibility of the proposed system, making it more flexible and adaptive to the changing needs of users. Cloud-based resources facilitate the integration of new data and feedback to improve the accuracy and effectiveness of the system’s predictive models. Additionally, this approach allows for the analysis of large amounts of data in real time, making the system more efficient and capable of handling a variety of applications. Finally, the proposed system helps users avoid potential risks by providing proactive recommendations. It also assists users in maintaining their health. Ultimately, these efforts lead to a more efficient and effective healthcare system.
3. Implementation and Testing
The proposed eHealth system has been fully implemented and tested under various circumstances and locations. The implementation steps are explained in detail in the following sections. In the upcoming sections, we discuss the experimental environment and setup used to implement our system. Then, we provide screenshots of the implemented application interface along with some output.
3.1. Experiment Environment and Setup
The eHealth application has been developed using Python 3.10, Flask, and Bootstrap framework. Flask is a well-known microweb framework for Python that is lightweight and enables developers to create web applications quickly and efficiently. Flask’s biggest advantage is its ease of use and flexibility, which allows developers to choose the tools and libraries they require for their projects. Bootstrap, on the other hand, is a free and open-source front-end framework that is utilized for developing responsive and mobile-first web applications. Its unique feature enables it to adjust the layout and design automatically to fit the user’s device size and dimensions.
The application utilizes Jinja2 to create various HTML pages. Jinja2 is a popular tool in web development that enables the creation of dynamic and personalized HTML, XML, and other markups through the use of template files and data from the application. With Jinja2, developers can design templates that feature placeholders for data, allowing the insertion of actual values at runtime. This simplifies the process of creating and managing consistent and adaptable markup by eliminating the need for repetitive boilerplate code.
After registering for the application, users are required to enter their historical data. Following this, the daily bio-signal symptoms are recorded and saved into a structured SQLite database. This database is self-contained, serverless, and zero-configuration, which eliminates the need for a separate server process or configuration files. SQLite is capable of storing and managing data in tables and columns and supports various data types such as integers, floating-point numbers, text, and binary data. The trained model utilizes this data to predict asthma attacks.
The application’s map visualization is created using Folium, a powerful Python library that generates interactive and visually appealing leaflet maps. By building on top of the widely-used leaflet.js library, Folium enables developers to create dynamic maps that can be displayed in web applications. With Folium, it’s effortless to visualize spatial data on a map, including points, lines, and polygons. For more information on the implementation and experimental setup, please refer to
Table 4.
3.2. Application User Interfaces
The user interface of the application has been designed to be easily understandable and user-friendly. Upon opening the application, the user is presented with a login interface, as depicted in
Figure 3a. This interface features a simple and clear form where the user can input their username and password. The Flask view function is responsible for handling both GET and POST requests to this login page. In the case of a POST request, the function will process the submitted login data. For a GET request, the function will simply render the login page template. Typically, this view function will utilize Flask’s render template. method to generate the login page template, which includes the necessary HTML and CSS code for displaying the login form and any other content desired by the developer. To create a user model and login manager, a login view function and a login page template must also be created. With these components in place, the application can provide users with a straightforward and effortless login experience.
To access the webpage, new users must first register on the user registration page by clicking on the sign-up button. Once registered, they can log in using the same credentials on the user login page. During registration, users will need to provide their name, email address, and password, as shown in
Figure 3b.
Once the data has been submitted, we store it in an SQLite database. To log in, we compare the user’s name and password with the information already stored in the database for accessing pages that are exclusive to that user. We use a username to query the database and check if the user exists. If the user exists, we verify the password.
After registering, new users are prompted to answer a series of questions regarding their medical history and symptoms from the last four weeks. These questions can be found in
Figure 4a. Once users sign in, they are directed to a page where they can record their daily bio-signal symptoms, as depicted in
Figure 4b. This page is the default landing page for all current users.
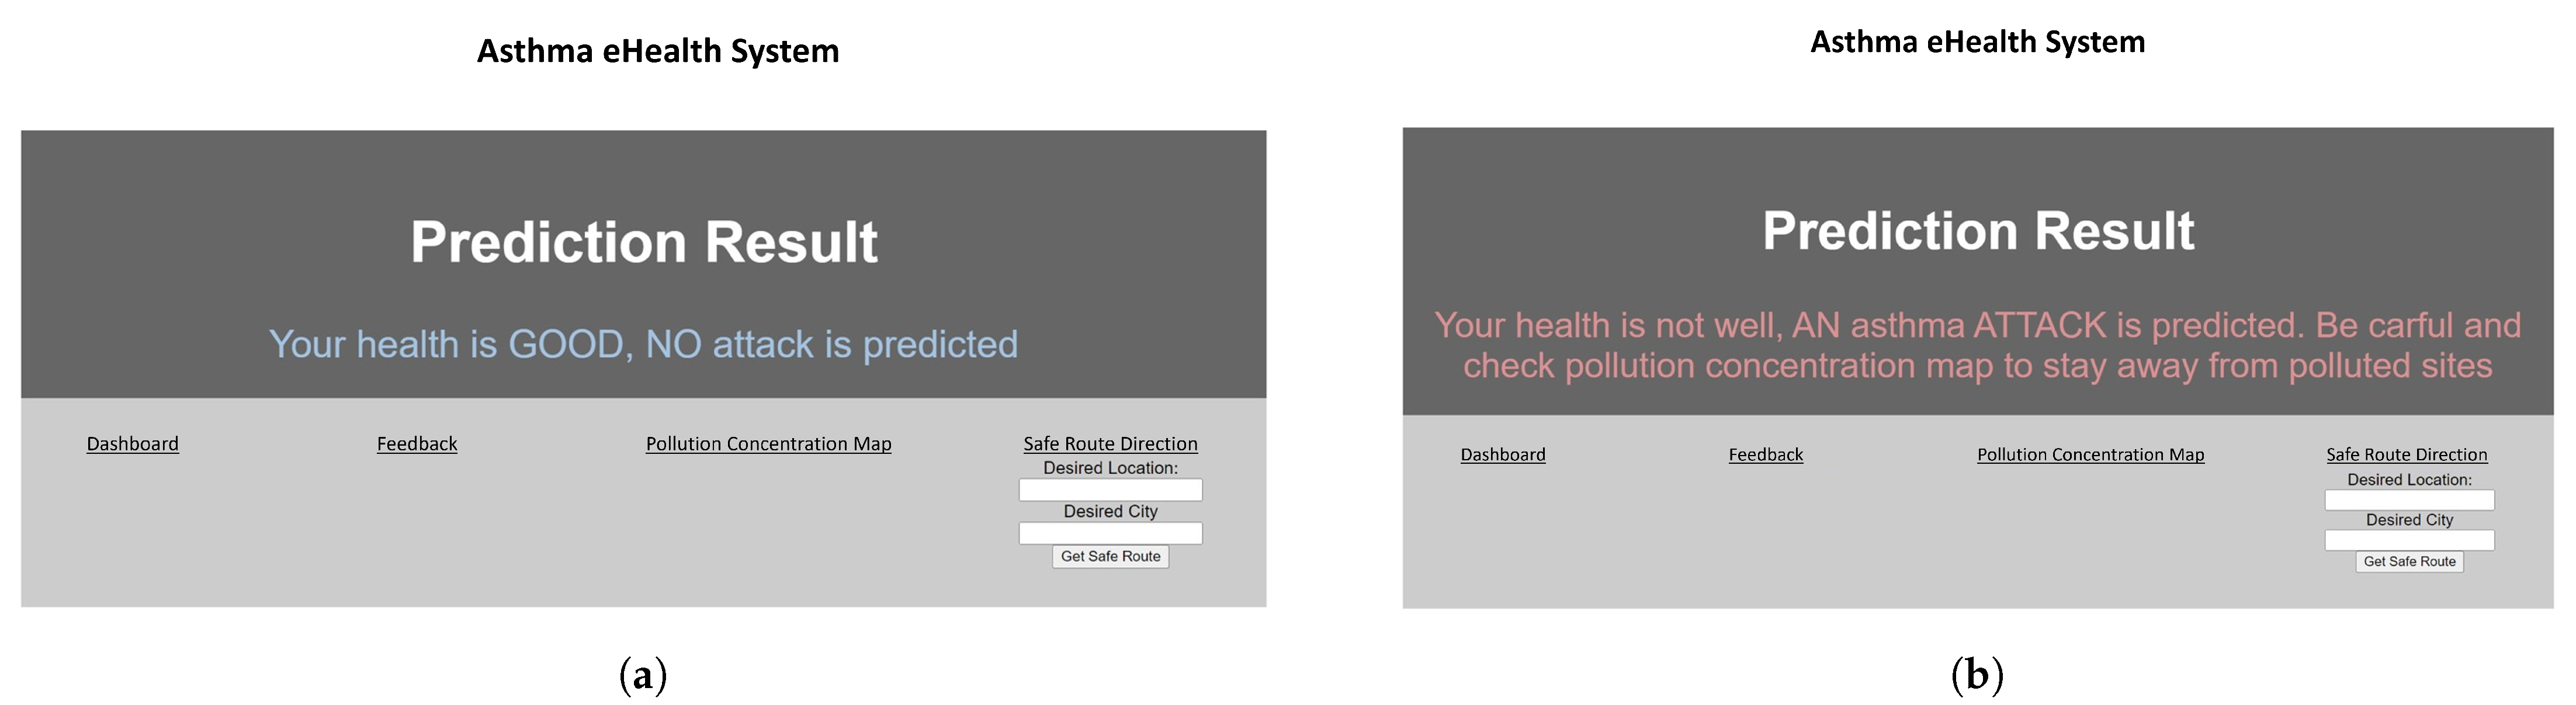
All of the data is stored in the database and retrieved upon clicking the ”submit” button to predict asthma attacks. We execute a query with the user’s ID and the saved prediction model, passing in the values entered by the user. Based on this information, we predict the user’s condition and display a message such as “Your health is GOOD. No attack is predicted” or “Your health is not well, An asthma attack is predicted. Be careful and check pollution concentration map to stay away from polluted sites”. The prediction result is shown in
Figure 5, with the message displayed in green for a good prediction and in red for an attack prediction.
The prediction results page displays four links: feedback, dashboard, pollution concentration map, and safe route pages. The feedback page allows users to rate the application and provide valuable input to developers. This, in turn, helps to improve the accuracy of the model and ensure accurate data is saved to the database.
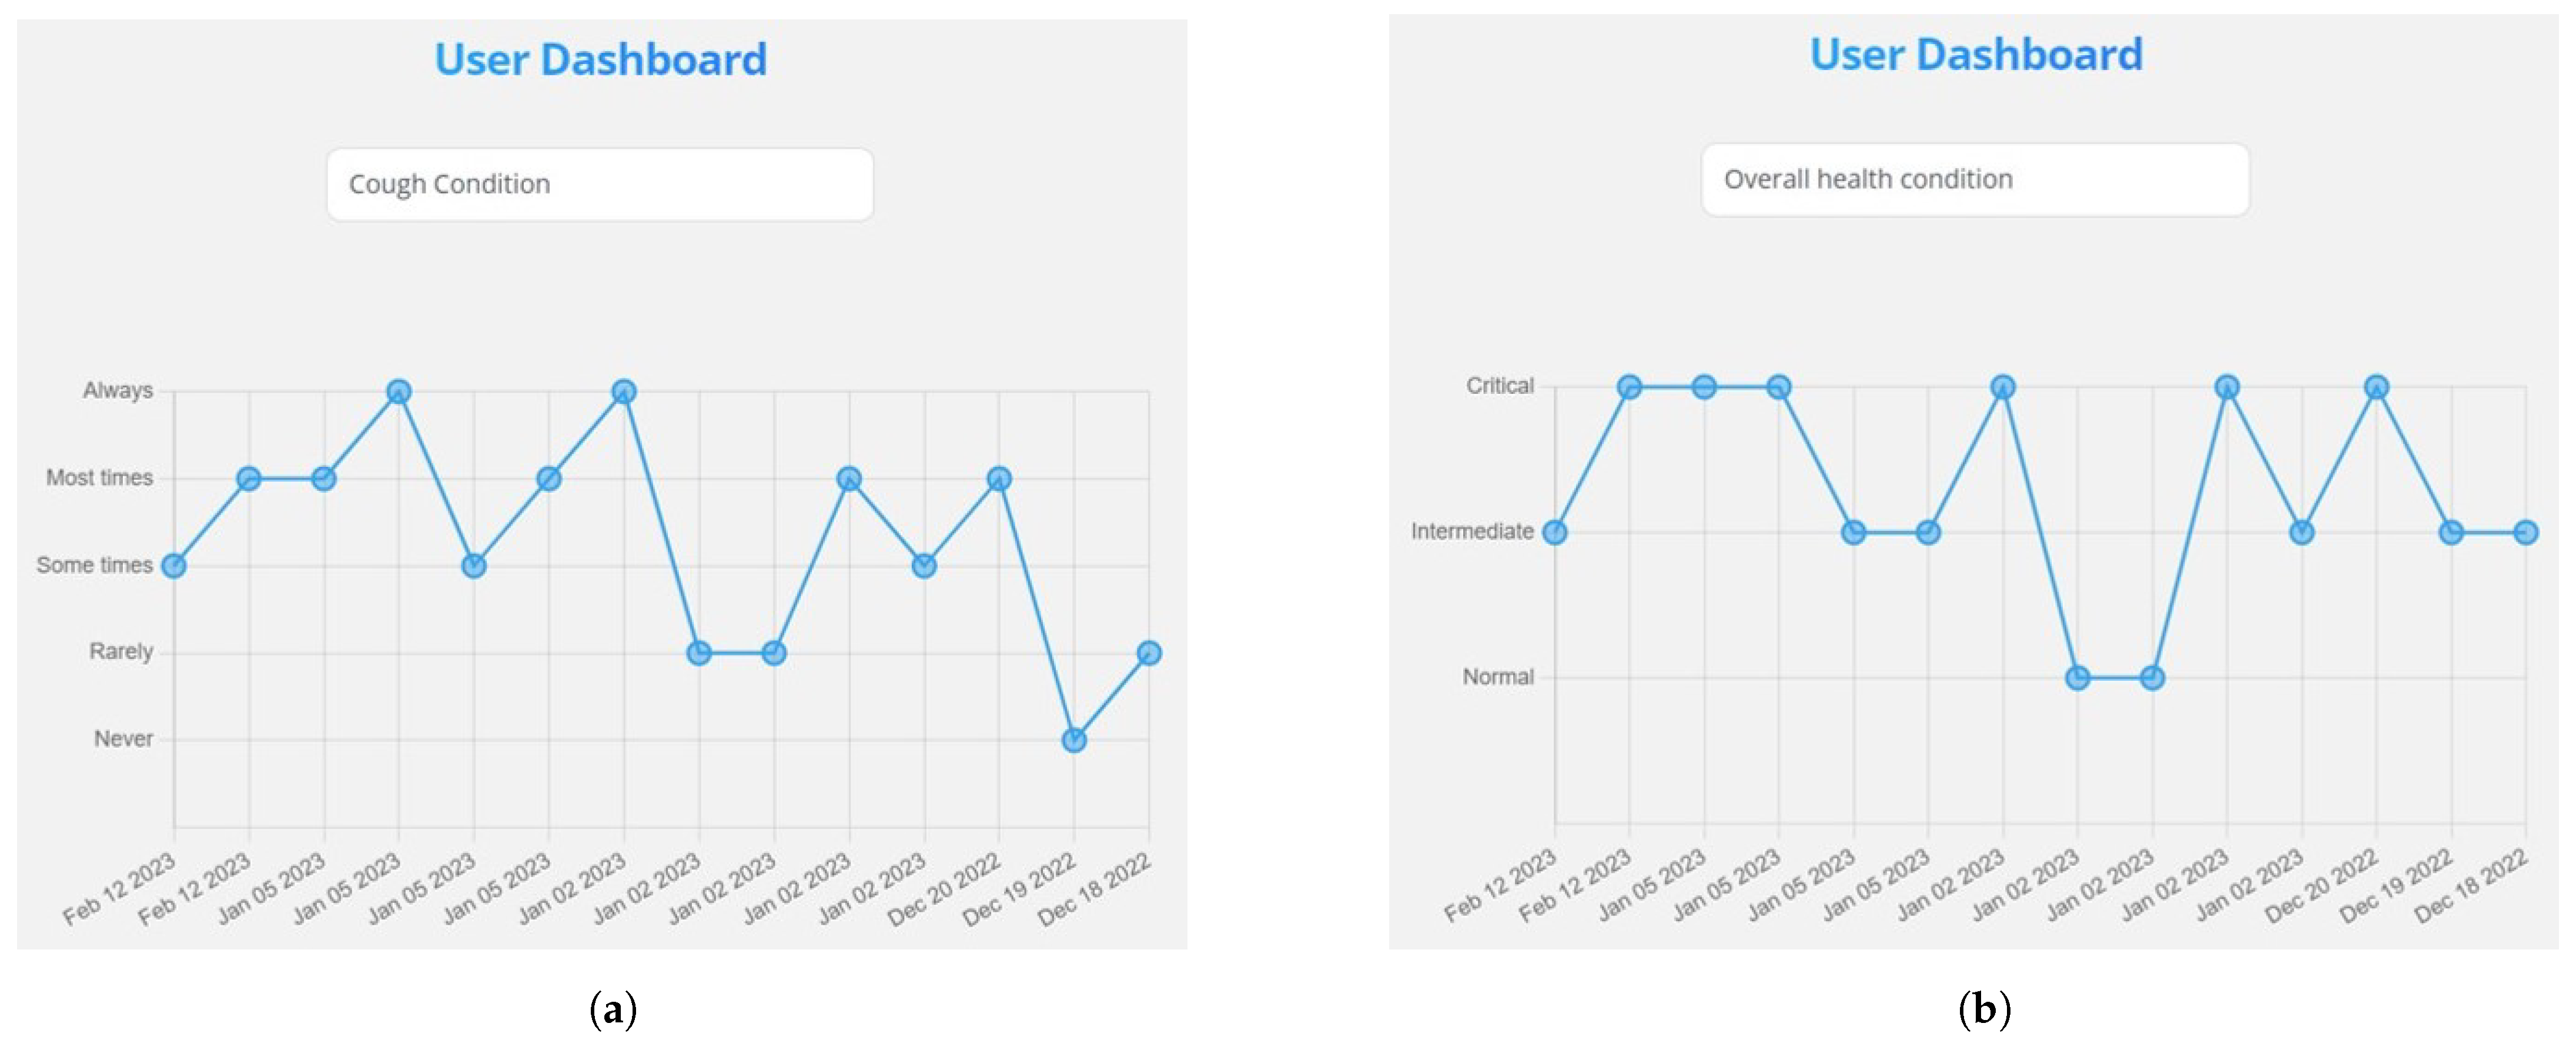
The dashboard page displays a range of options that show the user’s daily bio-signals from the past two weeks. When the user clicks on the dashboard, they are taken to a separate page that only shows the dashboard with a variety of options. The dashboard functions as a toolbar, providing the user with line charts that display the status of their daily recorded bio-signals for the past ten days. Users can choose from a range of options, including:
The statistics displayed in these charts are gathered from a questionnaire that the user fills out. The dashboard presents the user with a clear overview of which symptom is most closely related to the disease. In
Figure 6a, you can see a screenshot of the cough condition dashboard, which displays a line chart based on the collected data.
The “Overall Health Condition” dashboard option calculates the user’s status based on their daily bio-signals data. It takes an average of the recorded symptoms and the percentage of Peak Expiratory Flow Rate (PEFR) and displays the status as normal, intermediate, or critical. To calculate the PEFR percentage, we must first calculate the normal PEFR for each individual using either Equation (
2) or (
3) [
31]. Then, we use the Formula (
4) to determine the percentage PEFR.
The overall health condition is calculated using the values presented in
Table 5. You can refer to
Figure 6b for a screenshot of the line chart that displays the overall health condition.
4. Results and Discussion
In this section, we present the results of our proposed eHealth system regarding the prediction of asthma attacks and the safe route prediction models. The performance of these prediction models is presented in
Section 4.1. The generated maps of running the safe route recommendation model and the pollution concentration heatmap are presented in
Section 4.2. The system is tested and its performance is provided in
Section 4.3.
4.1. Prediction Models Performance
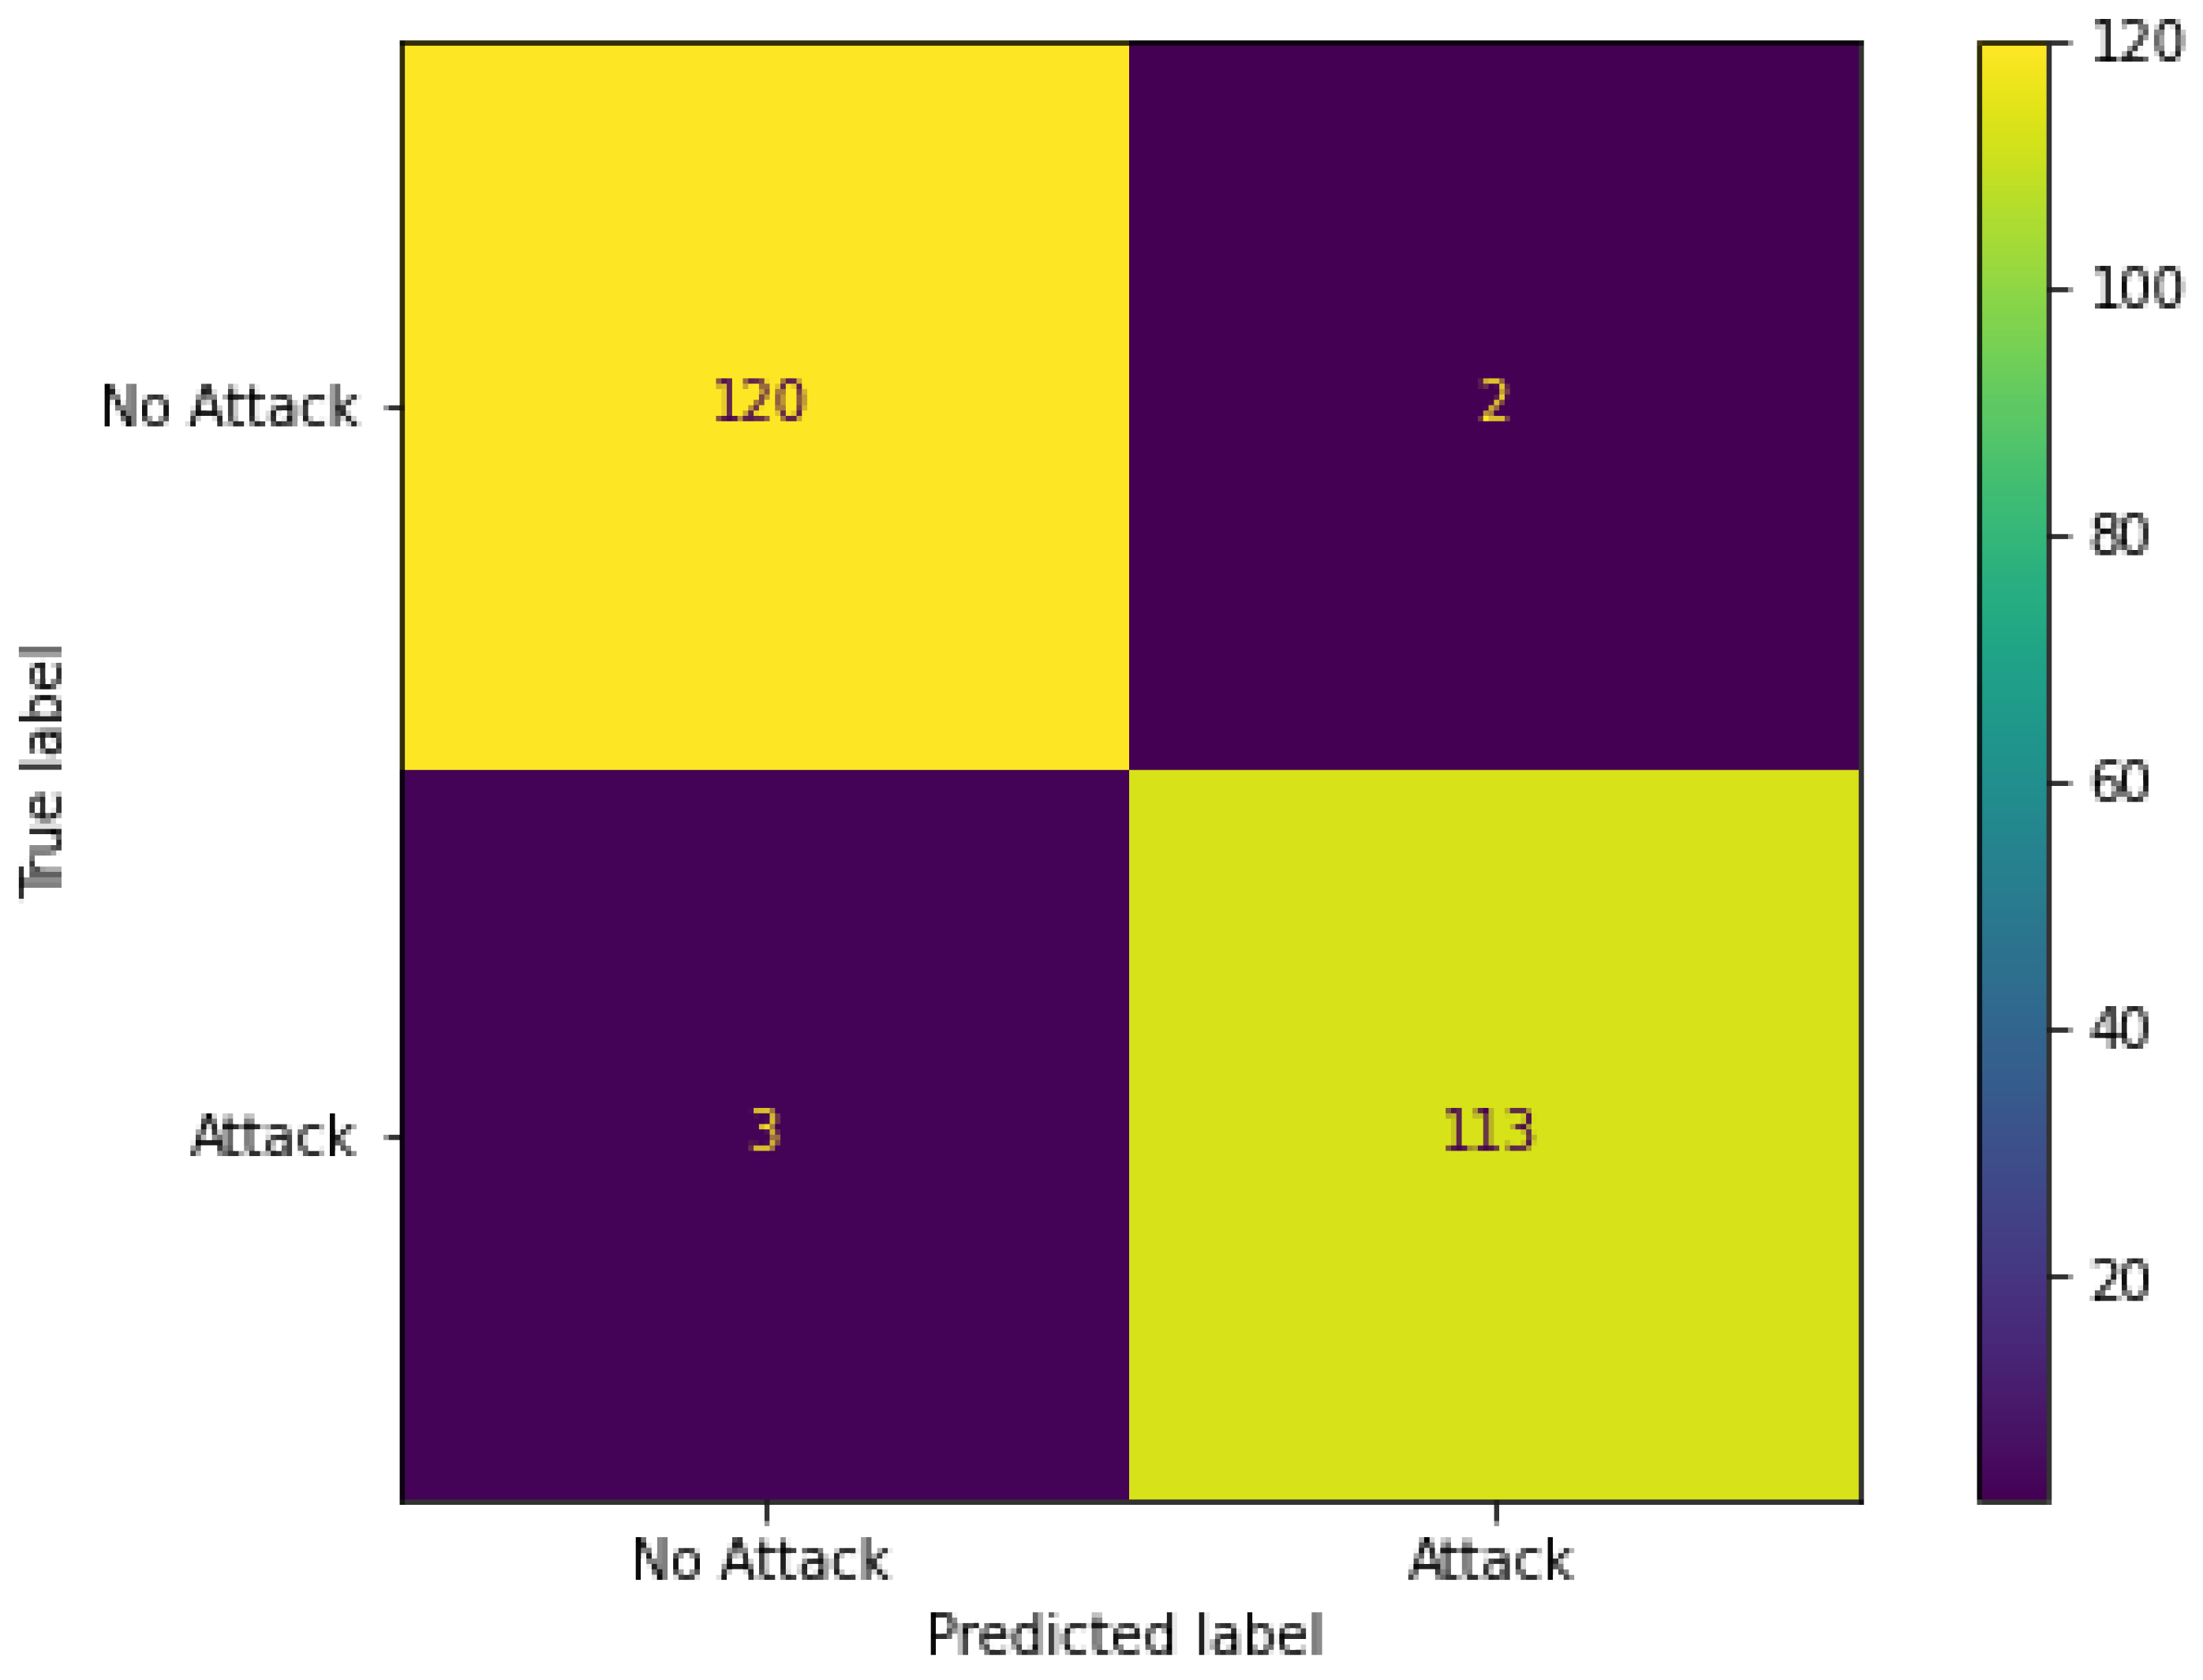
XGBoost algorithm is used in both proposed models, asthma attack and risk level prediction. Each utilized dataset was divided into an 80:20 ratio for training and testing the model. XGBoost undergoes training via a five-fold cross-validation technique, and the model’s performance is evaluated based on accuracy and recall metrics. The performance of the asthma attack prediction model is 98% of accuracy and 96.8% recall.
Figure 7 shows the confusion matrix of the classification report for the asthma attack prediction model. The performance of the route’s risk level prediction model is 94% of accuracy and 95.2% of recall.
Figure 8 shows the confusion matrix of the classification report for the route’s risk level prediction model.
4.2. Safe Route Recommendation Model Output
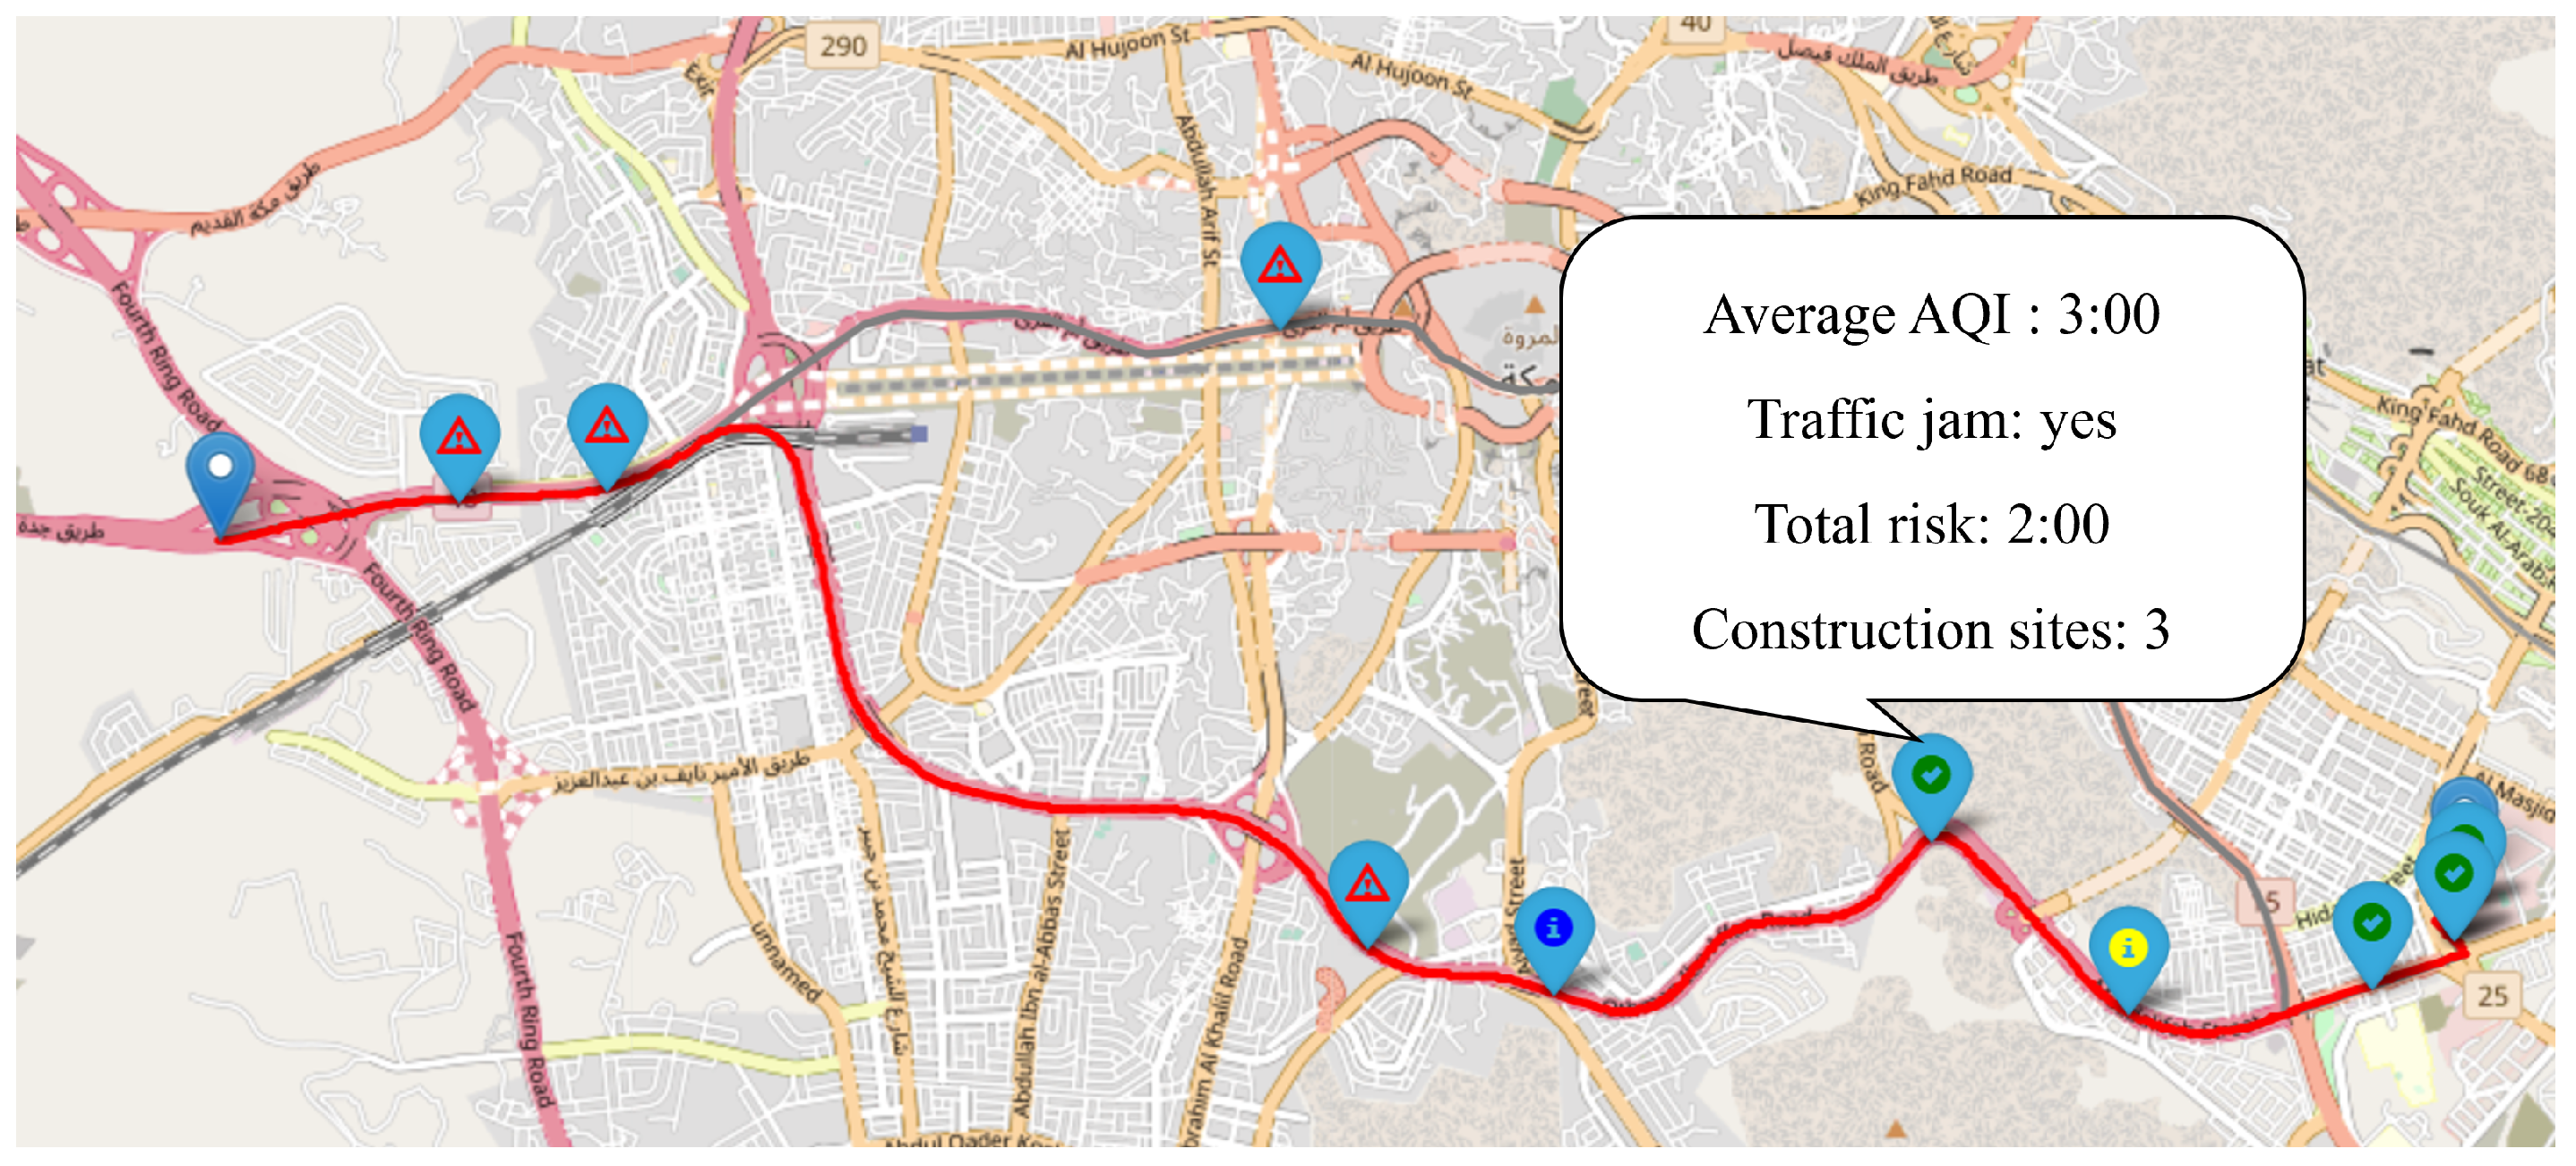
The implemented recommendation model provides the user with an interactive map that displays the possible directions between the two points (user location and desired destination). One of these directions is recommended to the user based on the route’s risk level prediction output.
The least risky route is displayed on OSM by applying a folium layer that shows the recommended route with the AQI heatmap color. In contrast, the other possible routes are displayed in gray.
Each leg in each route has a marker that shows the risk level as one of the three symbols in green, yellow, and red. The marker has a popup window that includes information about the extracted risk factors of that specific leg. This information contains the number of restaurants, gas stations, construction sites, and traffic status. A popup window for the whole route also shows this information besides the AQI average for that route and the total route’s risk score. The model was executed for two locations in Makkah city, and the screenshot is placed in
Figure 9.
The other visualization map provided to the user is the regional AQI heatmap. It works by getting the user’s current location, then returning the latitude and longitude for multiple points within 1 km of the user by using the Google API. The collected points are passed to OWM API to acquire their AQI. The returned values of AQI are between 1 to 5, where one means the AQI is within the minimum rate and the area is safe, and five means the AQI is within the maximum rate and the area is not safe. The Heatmap package plots the AQI as a color scale on Google Maps. A screenshot example of the heatmap output is placed in
Figure 10, which shows the AQI with red color, indicating a high AQI reading for the gained location.
4.3. System Performance
The proposed system was tested and evaluated by ten volunteers, all of whom had asthma, to determine its effectiveness and measure the accuracy of both prediction models. The volunteers accessed the application through their Google browser while located in Makkah City. Each participant had severe asthma and was between the ages of 25 and 43. They were instructed to visit three different locations, which were manually analyzed to determine the areas of interest. These locations included Makkah Mall, the Holy Mosque, and the train station. The directions of these three locations were extracted and analyzed manually and a risk score was assigned based on prior knowledge.
Our research utilizes the focus group qualitative analysis method, particularly in the context of usability testing for our smart asthma management application [
32]. This approach allows us to gather in-depth insights from a diverse group of participants, ensuring a comprehensive understanding of user perspectives, experiences, and preferences.
The volunteers first moved between the locations without the application, sending feedback about asthma attacks. Then, they used the application and sent feedback about predicted attacks and the safety of recommended routes. The user feedback is detailed with the related qualitative questions in
Table 6. User feedback revealed that the system is 95% accurate, and 89% of users were satisfied with the safer recommended route compared to their usual route.
5. Related Work
The development of SHCS, especially for disease monitoring and prediction, has received significant attention in the last decade. Researchers have devoted particular considerations to asthma as it is one of the most exacerbated diseases due to personal and environmental risk factors. Khasha et al. [
33] developed a Mobile Geographical Information System (GIS)-based tool that predicts asthma attacks and generates a monitoring map using different environmental risk factors. However, PEFR reading was the only personal bio-signal variable to predict the attack. They employed different ML techniques for the prediction model. The decision tree classifier shows the best performance and surpasses other classifiers; the performance was presented with charts and figures without denoting the exact accuracy percentage.
Another asthma attack prediction system was proposed by Kaffash-Charandabi et al. [
34]. They considered the user’s PEFR and medical history in predicting asthma attacks. The proposed system contained a recommendation model besides the prediction of asthma attacks. It displays the attractive places frequently visited by users and recommends revisiting them based on the pollution concentration. They deployed the support vector machine (SVM) classifier to build the prediction model, and the performance achieved 92% accuracy.
Hosseini et al. [
35] created an application that utilizes Internet of Things (IoT) devices to predict asthma attack risk, categorizing it into three levels: low, medium, and high risk. A smartwatch was used to send user data to the prediction model, which was built using a random forest classifier. On the other hand, environmental data was gathered from a variety of meteorological wireless sensors, and the data analysis was performed in real-time via a cloud-based platform. The prediction model achieved a risk level classification accuracy of 80%.
Two studies [
36,
37] proposed prediction frameworks with a new interpretation that utilizes personal’s sensors rather than meteorological sensors to acquire bio-signals and environmental data. Nonetheless, the suggested frameworks restrict the data to a select set of risk factors, which include food allergies, humidity, carbon monoxide (CO), and nitrogen dioxide (NO
), without considering important bio-signals risk factors such as PEFR reading, chest tightness, and cough. These frameworks still needs to be implemented to determine how the models would perform with these limited risk factors and evaluate the interpretation of the personal sensors.
Numerous studies have developed a visualization map to visualize safe routes and air pollution concentrations. Such a map helps asthma patients control the disease by making them aware of potentially dangerous areas, including high pollution. It allows users to share the local air quality conditions with their caregivers and exploit the opportunities of their doctor’s consultation via the Internet.
Larkin et al. [
38] developed a mobile health application that displays interactive maps and diagrams for air pollution concentrations. It uses users’ locations and notifies them of the predicted risk level of air pollution. This application minimizes exposure to air pollution, enhancing the quality of life, especially for those with asthma.
Nurgazy et al. [
39] introduced a novel approach to visualize a personalized air pollution map based on the user context. Concentrations of Nitrogen dioxide (NO
), ozone (O
), and particulate matter (PM
) were displayed, taking into account the user’s location, time, pollutant sensitivity levels, and any color vision impairments they may have. The visualization system was tested for Melbourne city. It is displayed using Google Maps, which shows the collected data from the nearest sensor and the data collected using the Victoria API for locations without sensors.
Another air pollution visualization map was developed by Adedeji et al. [
40] based on the road’s context rather than the user’s context. The constructed map shows air pollution concentrations utilizing the data from portable gas detectors at selected road junctions, motor garages, and markets. The study found that the air quality index increases due to traffic-related pollution, significantly affecting health.
Other maps were developed utilizing the meteorological station data without considering any contexts. Chen [
41] developed a Google Earth real-time visualization map for air quality index (AQI) collected from 23 observation points throughout Beijing. Users can use an interactive query to get specific AQI data and check the changes in different regions.
Lu et al. [
42] present a visualization tool that displays multi-granularity time-series AQI data in a larger-scale map for all major Chinese cities. This interactive tool helps analyze AQI visually and gives information for more in-depth investigations on air pollution.
Another map with a route recommendation module was presented by Ramos et al. [
43]. The provided map was designed to create free-pollution routes across cities relying on the pollution level in each zone. AQI data was collected from various sensors, and users were guided to navigate pollution-free routes within cities using air quality sensor networks. Such a map helps to drive users away from polluted sites, which safeguards their health.
Reviewing the existing studies for asthma attack prediction and safe route recommendations (see
Table 7 for the summary) shows some limitations that need consideration to deliver a better smart system. There is a need to utilize advanced ML techniques and feed the model with more bio-signals risk factors to predict asthma attacks accurately. In addition, the route recommendations need to consider innovative technology and the application of artificial intelligence rather than just making recommendations using pollution concentration. Other risk factors should be considered besides air pollution, such as traffic, construction sites, and any area that generates asthma risk factors, like restaurants and gas stations.
6. Comparative Analysis and Discussions
In our research, we have developed a novel system to create a complete smart monitoring application for asthma management. Our objective is to predict asthma attacks and support patients through a module that recommends safe routes. This recommendation module continuously updates its suggestions based on the user’s health, location, and route context data. We aim to leverage all relevant features that impact asthma patients to provide an accurate asthma attack prediction model and ultimately improve their quality of life.
Previously, many works have focused on asthma attack prediction and route recommendation with risk factor visualization. However, using various features in attack prediction and considering different contexts in route recommendation has yet to be given much attention. Most related works for asthma prediction and route recommendation focus more on the bio-signals or environmental features in building their systems. In contrast, there has been limited emphasis on strategies that utilize user and environmental contexts for suggesting the safest route. To the best of our understanding, our proposed system stands as the pioneering initiative to incorporate route context alongside the user’s and environment’s contexts in the creation of a safety-oriented route recommendation module.
To better understand the uniqueness of our proposed system, let us compare it with previously proposed systems as shown in
Table 8. Upon examining the comparisons, it becomes evident that two studies [
33,
34] have considered only one route context, which is the location, without taking into account the risk factors associated with the route. Furthermore, the route’s risk level prediction is addressed in only one study [
34], which utilized a single user risk factor in conjunction with the environmental context.
In terms of real-time application for asthma attack prediction, we identified three studies: [
33,
34,
35]. Among these, the study in [
33] introduced a heatmap visualization service, while the study in [
34] incorporated a personalized risk level along with the heatmap visualization. On the other hand, the study in [
35] focused solely on predicting asthma attacks without offering additional services. It is worth mentioning that the studies by [
36,
37] proposed frameworks but still need to provide implementation details.
In summary, our proposed system stands out by considering various contexts (user, environmental, and route) in a comprehensive manner, which has yet to be fully explored in previous studies. We aim to bridge this gap by leveraging different contexts to develop a safe route recommendation module that considers asthma patients’ unique needs.
By targeting the development of a complete smart monitoring application for asthma management, the proposed system demonstrates a holistic approach to supporting asthma patients. The integration of asthma attack prediction and safe route recommendation modules shows a clear understanding of the challenges faced by individuals with asthma and the need for proactive strategies to mitigate risks. This comprehensive system has the potential to significantly improve the lives of asthma patients by providing personalized recommendations that consider their health, location, and route context.
One notable aspect of the proposed system is its emphasis on utilizing all relevant features that affect asthma patients. By incorporating a wide range of factors, such as bio-signals, environmental conditions, and user-specific information, the system aims to create a more accurate and robust asthma attack prediction model. This multi-dimensional approach acknowledges that asthma triggers can vary significantly among individuals. It recognizes the importance of comprehensively understanding the patient’s context, which gives effective prediction and prevention.
Furthermore, including the route context in the safe route recommendation module sets the proposed system apart from previous studies. The system can provide tailored recommendations that minimize exposure to potential asthma triggers by considering not only the user’s health and environmental conditions but also the characteristics of the route itself. The integration of route context takes into account factors such as air quality, proximity to allergens, and potential irritants. These factors can significantly impact the likelihood of an asthma attack during transit.
The comparison of the proposed system with previous studies showcases its unique contributions. While some studies have explored specific aspects of asthma prediction or route recommendation, they have yet to fully integrate the user, environmental, and route contexts to the extent proposed in this study. This highlights the novelty and originality of the research, as well as its potential to advance the field of asthma management.
In conclusion, the proposed system presents a comprehensive and innovative approach to asthma management by combining asthma attack prediction and safe route recommendation modules. By considering various contexts (user, environmental, and route), the system aims to provide accurate predictions and personalized recommendations that address asthma patients’ specific needs and challenges. This research has the potential to significantly enhance the quality of life for individuals with asthma and contribute to the advancement of smart monitoring applications in healthcare.
7. Conclusions
An intelligent healthcare system can offer patients accurate disease predictions and valuable services to ensure their safety. In the last decade, numerous efforts have been made to develop better prediction and recommendation systems for different diseases. Predicting asthma attacks and recommending safe routes can be challenging due to the numerous factors involved.
This study describes the development of an asthma attack prediction model that incorporates various risk factors. We have given special attention to utilizing the impact factors of the patient’s historical health records, daily bio-signals, and daily changes in environmental conditions. To predict and assess the risk level of routes and recommend the safest way to move from point to point, we have addressed three primary contexts related to the user, environment, and route. In the recommendation process, using the learned model based on the user’s health condition, AQI, traffic, gas stations, construction sites, and grill restaurants, we suggest the least risky route. Additionally, the AQI heatmap visualization provides a concise map to the users showing the pollution within a 1 km radius of their location, which gives them knowledge about the surrounding risk.
In our prediction modules, we utilized XGBoost to achieve impressive results. Specifically, our asthma attack prediction model boasts a 98% accuracy rate, while our route’s risk level model achieves 94%. Our aim with the eHealth system is to minimize the risk of worsening health conditions and alert users to any impending asthma attacks. To prove its efficacy, we conducted a performance test with ten volunteers, resulting in a system accuracy rate of 89%. Our comparative analysis of existing asthma attack healthcare systems and our proposed system demonstrates the latter’s superiority, given its consideration of crucial factors from varying contexts. Personalized risk factor visualization and real-time prediction are key to effective asthma management.
Our primary contribution to this project is a context-based system for predicting and recommending asthma attacks. However, one limitation of the system is that it relies on the manual recording of daily bio-signal data from the users. To overcome this limitation, we plan to integrate IoT devices to acquire this data automatically.
In our future work, we plan to integrate our system with various IoT devices and create a mobile application that connects asthma patients with healthcare providers. By doing so, patients can receive consultations and regular follow-ups from the comfort of their own homes. To ensure that the application is effective and beneficial for asthma patients in urban environments, we will conduct extended usability testing with actual asthma patients. This will help us evaluate the application’s added value in the context of daily life and how it can improve the quality of life for asthma patients.


