1. Introduction
Over the last decades, there has been a steady ageing of the population in Latin American countries. This ageing translates into challenges for states and institutions in terms of adopting measures to address the effects of population growth and prepare for the future needs of an ageing population. These problems necessitate thinking about infrastructural, social, economic, political and cultural solutions. Coupled with the social conditions in Latin American countries, with high rates of social segregation, poverty and vulnerability, the ageing population generates greater social problems [
1].
This is because disadvantaged areas show less walkability, which in turn is of concern given the premise that communities with a predominance of older adults are potentially characterized by greater walkability [
2]. Against this backdrop, this paper explores urban conditions in a city such as Santiago de Chile, given the reality and future outlook for urban life and old age.
Chile is one of the countries with the largest older adult populations in Latin America [
3]. This is due to the transition process the country is undergoing, where high life expectancy and low fertility are mainly responsible for the demographic change. In addition, projections indicate a consistent increase in life expectancy in correlation with a steady increase in the number of elderly people (EP) in the coming years and a low birth rate that mimics other OECD countries [
4]. Moreover, in Chile more than 82% of the older adult population lives in urban areas in line with global trends [
5,
6,
7].
In this context, since President Michelle Bachelet’s second term in office, a policy focused on the concept of ageing-in-place and age-friendly communities has been developed [
8] following the goals set by the 2030 Agenda for Sustainable Development [
9]. These policies recognize that urban factors are relevant to biopsychosocial development and are directly related to public health, especially for the older population and their relationship with their environment [
10,
11,
12,
13]. In this sense, this article focuses on the relationship between the EP and their immediate urban space, and the opportunities that the built space must adapt to meet the requirements of older people, recognising that there is a transformation in this relationship in the post-pandemic scenario.
Regarding the impacts of the COVID-19 health crisis on the ageing population, studies show a high vulnerability of EP, not only because of the risks due to their physical condition, but also because of a negative transformation in economic, social and spatial terms. According to the NODO Project [
14], confinement, physical distance from support and care networks, social capital and adaptation of lifestyles have been essential to understand this transformation. In addition, it has been observed that, thanks to cultural imaginaries constructed by health measures and information about the risk of the elderly population, their participation in urban spaces has regressed, as their self-care agency has been taken away, relegating their activities to domestic spaces for fear of contagion [
15].
In the context of the above, 74% of the Chilean population believes that EPs cannot make decisions or act on their own [
16], which not only exposes this group to situations of violence but also to stigmas that deteriorate the self-esteem of MAPs. This form of discrimination considered “social punishment” towards old age, “results in a lack of freedom and autonomy; isolation and loneliness; negative stereotypes; mistrust in their ability to function on their own, all of which undermines the self-esteem and well-being of older persons”, especially for older women [
17].
In turn, confinement revealed the vulnerability of EP to a decline in their physical, social and mental condition. Of older adults from lower social classes, 17.9% reported having decreased their food intake during the pandemic; 65% of older adults reported having decreased their physical activity time since the pandemic arrived. In addition, according to the post-pandemic survey of the Association of Municipalities of Chile (AMUCH) [
7], 41% of the surveyed older people say that their income is not enough to cover their basic needs for a month, and 36.2% say that they are just making ends meet. This lack of economic independence is compounded by the risk of being victims of domestic, symbolic and urban violence [
14,
16], a situation that is consistent with the fact that more than 37% of EP believe that society treats them badly or very badly [
7].
In addition to this, is the socio-economic reality faced by the country’s older population, where at least 38% of older adults report living on less than CLP 200,000 (approximately USD 200) per month, to which must be added that the average monthly expenditure of an older adult in Chile is CLP 289,000 (approximately USD 289) [
18]. Data also reveal that “1 out of every 3 older persons declares that their income does not allow them to satisfy their basic needs”. This is also demonstrated by the data provided by the study of the UC—Caja Los Andes 2019 [
19], which shows that from 2016 onwards the percentage of people who state that the money they have is not enough to meet their needs has increased” (p. 61). This is a demonstration of the social reality in which older people in Chile are confronted in the post-pandemic period.
In the framework of mobility and healthy spaces for civil society, it is only in the last decade that initiatives have been identified in terms of urban mobility policies that address the issue of creating friendly cities [
20]. For the same reason, there is literature that exemplifies urban options or strategies for improving the quality of life of a social group that has been severely affected by the pandemic. It has been shown that there are opportunities to improve biopsychosocial conditions, in which the neighbourhood environment is fundamental to sustaining the autonomy of MAPs. There is evidence that “air quality, noise, lack of green areas, heat and lack of physical activity have an impact on cardiovascular, respiratory, muscular and psychological diseases” (p. 210, [
21]).
In relation to the above, the health condition of the EPss is not a determinant of the quality of social networks, but rather, the environment and urban mobility are factors that have an impact in this regard [
22]. This is because they not only facilitate the resolution of daily activities of personal sustenance, but also enhance social interaction, especially in the elderly [
23]. According to the National Service for Older Adults (SENAMA), spaces should be designed according to different types of access so that the older population can develop their lives in them without any limitation due to age-related reasons or motives. Active mobility generates an urban environment that is beneficial to the health of city dwellers [
24].
Based on the above, and thinking about post-pandemic cities, the city in 15 min is an alternative solution to the problems in the quality of urban life of older adults. This is because the model “is based on strengthening neighbourhood life, both in the spatial function and in the political organisation of communities, changing the scales of metropolitan governance to neighbourhoods and giving greater decision-making power to communities” [
24].
In Spain, over the last two decades, there has been a development and evolution of active mobility in cities, as it is no longer just a question of urban sustainability, but also of improving the quality of physical and mental health of urban dwellers. By this we mean that urban mobility is fundamental for carrying out everyday activities, but also in the social sphere, facilitating relations between people, especially the elderly [
25]. Social connections, in turn, are one of the major determinants of individual health and well-being (p. 25, [
26]). We will understand a city in 15 min as an urban design option that “lies in trying to reconcile our way of life in the city with sustainable development, climate, biodiversity and the preservation of urban health” (p. 171, [
21]). Urban health is the characteristic that frames the present discussion.
This demographic context of population ageing contemplates a great variety of social and structural aspects that converge in knowing what the urban reality of Elder People (EP) in the city of Santiago is. This is since there is no knowledge about the access that the EP have to services, recreational and social life spaces, health institutions, food market, etc. On the other hand, as can be seen in the background, there is a demonstration of how active social urban life means an improvement in the quality of life of the elderly, therefore the knowledge of this reality and the collection of information that has not been available until now, justifies the social relevance of the present study.
The Importance of Place: Movement and Active Ageing
Starting from a perspective in which people age and develop in relation to the interaction with other elements and contexts of the environment, it is intended to delimit which concepts allow an understanding and analysis of the social reality of older adults with their urban environment.
If we talk about the urban environment, we refer specifically to cities, as they are the space in which the activities and lives of a large percentage of the older adult population in Chile take place. Cities are spaces that are full of materiality and symbolism, which are different for different groups in society, and even for each person who interacts in the urban space. Hence, the construction of the social is also dependent on the spatial characteristics that mediate the relationships between those who inhabit the urban space [
27]. Therefore, these relationships condition the experience and ways of inhabiting, altering each otherness, and from there, an ethic that calls for the recognition that each person has the right to decide and influence his or her own reality.
Following on from the above, Lefebvre [
28] conceptualises the Right to the City, in terms of the capacity of urban inhabitants to create the city and make it their own, through their daily lives, their activities and their perceptive imaginaries. With this we will understand that older adults, although they have the right to a city, also have the right to build it and live it in a dignified way. While space is a construction of social action, practices, unequal relations and experiences, it is also part of each of them [
29]. This distinction is essential to understand that the city is involved, as a space, in each of the social dynamics of older adults, this being the social relevance of the present, since after the pandemic, cities and the outside world became a hostile space for the country’s older population.
Sánchez [
30] points out that older adults coexist and negotiate with their physical and social environment, trying to find a balance between their abilities and age-related limitations, in order to obtain benefits in terms of their physical capacity, social network, life expectancy and active longevity. For the WHO this is “a process of optimising opportunities for health, participation and security in order to improve quality of life as people age” (p. 79, [
31]).
In that sense, it is not only about the individual conditions of EP to achieve physical, social and mental well-being, but also about an environment that facilitates achieving their needs and desires, beyond the residential and domestic space [
32,
33]. Freund and Baltes [
34] indicate that for successful ageing of older people, they must be in a constant development of optimisation strategies and practices, in order to adjust their reality, and thus achieve an improvement in their quality of life.
Likewise, this approach persists in international organisations, where the Pan American Health Organisation PAHO [
3] states that “functionality includes a complex mix of physiological, behavioural, cognitive and social factors (…) mobility and mental function are the elements that best define autonomy, independence and social contact in the older adult” (p. 63–64). Consequently, urban elements from various domains must be considered for an urban environment to be friendly to MAPs, which, as pointed out by Lawton and Nahemov [
32], are mainly eight corresponding to outdoor spaces and buildings, transportation system, housing, civic participation and employment, respect and social inclusion, social participation, communication and information, and finally, community support and health services.
In this sense, according to Fitzgerald and Caro [
35], what allows the EP to age actively and independently is an age-friendly city, understood as a favourable environment to grow together with family and loved ones, developing diverse opportunities for participation in the sphere of community and civil society at the neighbourhood scale. This, in an environment that presents an infrastructural support of services and urban facilities that allow reaching the needs of each person, as well as growing old in the right place. In this way, the construction of spaces around independence, tranquillity and security must take into account elements of the construction of collective imaginaries of older adults, which also directly affect their development and habitability in cities.
However, given the current conditions of urban spaces, older people’s freedoms are being violated. The National Service for Older Adults [
18] provides a guide for the construction of spaces that should be designed according to different types of access so that the older population can develop their lives in them without any limitation for any reason or reason related to the age of the individuals living in the city. If we go back to the idea of the city in 15 min, it is that active mobility generates an urban environment that is beneficial to the health of city dwellers [
22]. In this framework, authors support the idea that the existence of positive moods, social contacts, activity and humour [
36], are elements that favour active ageing of the older population, which are focal points of help with the thought of different urban strategies such as the city in 15 min.
By compact cities we refer to the city in 15 min, which according to Correa et al. [
24], is understood as a city from the position of pedestrians, as it refers to the optimization of land use, improving its public infrastructure so that it becomes a walkable space or with good mobility by public transport. Therefore, the understanding of the city in 15 min is to situate the thought on how adapted cities are so that their inhabitants can carry out their daily activities such as working, shopping, attending health institutions, parks or squares, among other elements that are considered as key for socio-urban development in a range of 15 min from their homes or neighbourhoods in which they carry out their activities. This is justified in the focus of the research, as the model generates in urban agents an increase in the quality of their mental health and physical condition [
37].
Along the same lines, the city in 15 min becomes a strategy or urban model in which the optimization of space and time is the virtue to be squeezed out of cities. This is due to the constant search to increase the supply of services (both private and public) in public spaces, which ends up being expressed in healthier spaces, in terms of their walkability and the sustainable use of public and private transport [
38].
By referring to the 15-min city, in terms of walkability and sustainability, this becomes one of the main axes of urban design, as it makes the spaces become a suitable environment for older adults, as it encourages the creation or strengthening of autonomy, as they feel more security and confidence when using public space in their daily activities [
39]. The 15-min city is a city that elevates the importance of having neighbourhoods where people on foot, as well as by public transport, can meet their needs, thus promoting the idea of urban health [
40]. Better walkability of neighbourhoods improves people’s physical activity, active transport, and mental health [
2]. In turn, the 15-min city becomes a strategy to facilitate the right to the city and to improve the production of age-friendly urban spaces.
Consequently, and taking up the elements pointed out as losses of essential elements in the development of the daily life of the elderly population, we understand mobility in cities as a factor in public health. We argue that urban mobility is fundamental to be able to carry out daily activities, but also to facilitate social aspects, promoting relationships between people, especially the elderly [
27]. Social connections, in turn, are one of the major determinants of individual health and well-being [
38]. Following this line and thinking about a city in 15 min, this article elaborates an empirical analysis of the socio-spatial variables that allow us to diagnose the feasibility of moving towards a 15-min city in Santiago de Chile, with an emphasis on priority urban functions for older people. The results indicate that these approaches are plausible in some sectors of the city, while others require significant changes to become age-friendly spaces. From these results, different public bodies can learn lessons on how to measure the friendliness of cities, as well as share a methodology that is applicable to other cities around the world.
2. Materials and Methods
This research is defined as quantitative, deductive, and based on an exploratory approach that uses various spatial analysis techniques through geographic information systems (GIS) to estimate the levels of accessibility of the older adult population to various urban functions, reflected in public and private facilities, which aim to reveal how effective the ideal of the 15-min city is [
40,
41], with a particular focus on this population group.
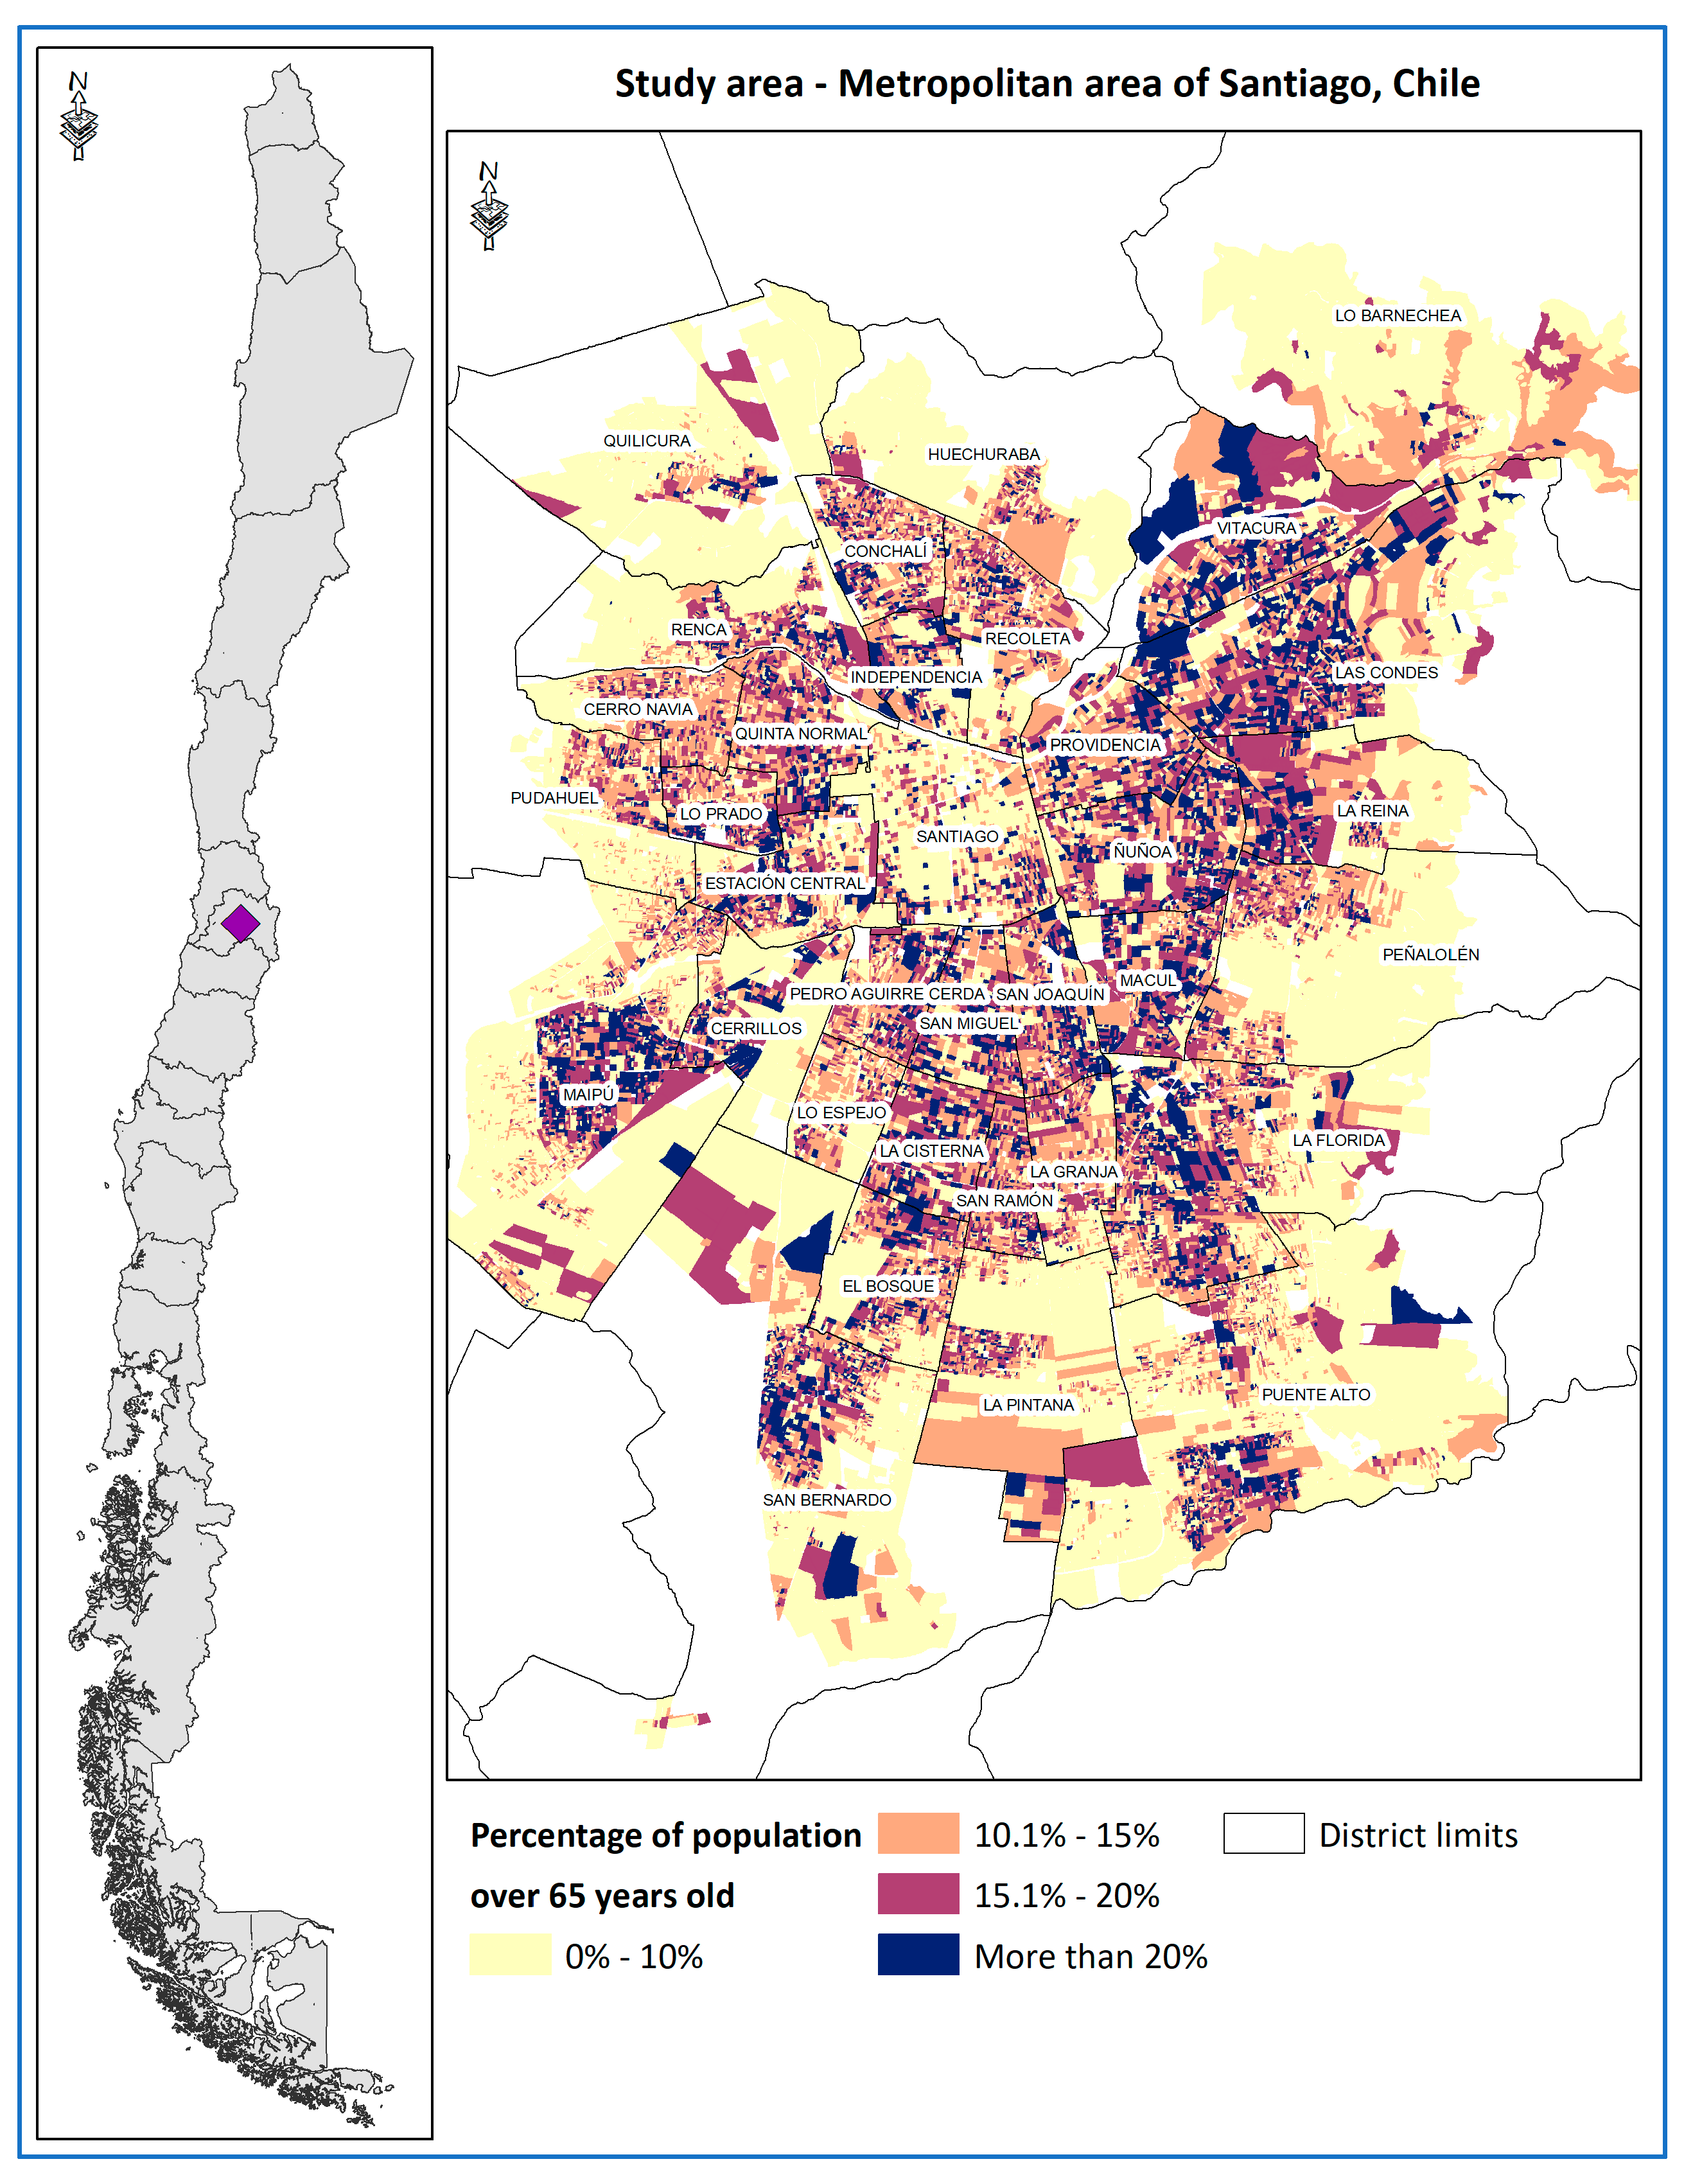
This research is deductive in that it seeks to test in part the feasibility of a 15-min city model proposed by Carlos Moreno in Paris, but from the potentialities offered by the city of Santiago. The study area corresponds to the Metropolitan Area of Santiago (MAS), capital of the Republic of Chile, which is home to 6,071,531 inhabitants [
42] in 34 municipalities. Of these more than 6 million inhabitants, 646,499 are adults over the age of 65, which represents 10.6% of the population living in the study area, which also has a dispersed distribution pattern over a large part of the territory, but with a tendency to concentrate in the peri-central area of the city, as shown in
Figure 1.
The observations to be analysed in this study correspond to the older adult population (over 65 years of age) censused at both census block and census tract level from the records of the 2017 National Population and Housing census [
42].
The methodology seeks to determine the levels of accessibility to various urban functions, understood as access (or not) to a 15-min pedestrian walk from homes to various public and private facilities, in order to determine how accessible and feasible the idea of the 15-min city is. To this end, a connectivity analysis was developed using the network analyst module of the ArcGIS 10.7 GIS programme, measuring the distance from the centroids of the census blocks, through the official road networks, to a set of facilities that are of valuable interest to the elderly population.
Based on the previous experience of other studies on European and Chilean cities [
15,
24,
32,
40], it is key to work with different types, dimensions, and hierarchy levels in the facilities (
Table 1), as these must account for the various forms of mobility that are developed in the city, for which our proposal is based on the analysis of two levels of hierarchy of facilities:
The first level considers facilities considered to be of primary need, as they have a more frequent and intensive use (such as access to commerce, primary health care or public squares) and therefore their accessibility was measured at a 15-min walk, considering a speed of 2.4 km/hr, which in the authors’ opinion is more realistic and demanding for this type of modelling [
43], allowing us to measure a real distance of 600 metres.
The second level of hierarchy considers facilities of greater territorial extension and of less frequent use, but no less important, such as public hospitals, to which the elderly population can go by public transport system, for which we will consider a journey of 15 min in this system [
44], which corresponds to 2400 metres.
The central idea behind these hierarchies is to recognise that not all urban activities or functions can exist within a 15-min walk (such as hospitals) but that there is a clear urban and functional hierarchy in facilities, as Barry [
45] argues, where smaller scale facilities more frequently deliver lower intensity services to the population such as access to primary health care or essential shopping. Additionally, recalling Moreno [
41], it is important to conceive a 15-min city where people can satisfy their needs and generate better urban health, through active mobility by walking, but also by strengthening public transport.
On the other hand, the authors wish to place special emphasis on the importance of considering a walking speed closer to the reality of the older adult population, [
30,
31] as proposed by Rojas et al. [
15] by considering different walking speeds for the population towards public green areas according to their age range, based on international experience [
46,
47]. This consideration allows for a more realistic and inclusive picture of the mobility of this population group in the city.
The study makes it possible to measure whether the blocks have access to the list of facilities indicated in
Table 1, which is based on the researchers’ previous experience in other studies [
15,
24,
33,
40,
47] in the analysis of the 15-min city for similar cases in cities in Chile and the world. Such facilities are understood as urban functions, discriminating whether they are located within the range of time and distance corresponding to the hierarchies set out above.
This list of urban functions attempts to cover the greatest number of facilities (based also on the availability of territorial information) to which older adults may require access in their daily lives, based on the studies of Barry [
45], the reflections on the friendly city by Lawton and Nahemov [
32] and also the experience of the origin–destination survey [
48] and the studies developed by the national service for the elderly [
16] in which the importance of mobility and accessibility of older adults to this type of facilities in particular has been highlighted, which have been analysed in the previous experiences of Correa et al. [
24] in the cities of Santiago, Valparaíso and Concepción.
A dichotomous indicator (0 = no access, 1 = with access) is created for each of the facilities analysed, which are then added together to determine the 15-min accessibility index to the city, which fluctuates between 0 and 1, accounting for the total number of facilities to which the older adult population can have access for each census block.
It is important to recognise that not all the dimensions and facilities proposed by these studies are reflected in
Table 1, due to the lack of some data, such as internet connection or telephone services or the quality or state of maintenance of the facilities.
In line with the above, it should also be considered that the methodological proposal does not consider certain fundamental elements in accessibility studies, due to the availability of data at the census block scale, such as the state of the pavement on which people circulate, potential situations of disability in older adults. Nor does this initial version consider the inclusion of the quality of the public transport system. Subsequently, the weighted average of this accessibility index was determined but at the census tract scale [
42] in order to facilitate the exploratory analysis with respect to various socio-demographic variables of the resident population based on the results of the 2017 census, especially with regard to income levels, for which the classification proposed by the UC Cities Observatory was used through the Territorial Socio-Material Territorial Index (ISMT) [
49].
This index suggests the existence of a socio-spatial dialectic reflected in the relationship between social variables and the built environment, particularly through the quality of housing. Based on the above, the ISMT assumes that a higher level of socio-materiality is closely related to a high level of schooling attained by the head of household, a low level of overcrowding and overcrowding and the presence and concentration of dwellings with acceptable materiality.
This allowed us to determine the socio-economic groups existing in each census area, in order to analyse whether there are significant differences in the levels of accessibility to the city according to the socio-economic level of the households analysed, with special interest in households of older adults in the lower and middle strata.
3. Results
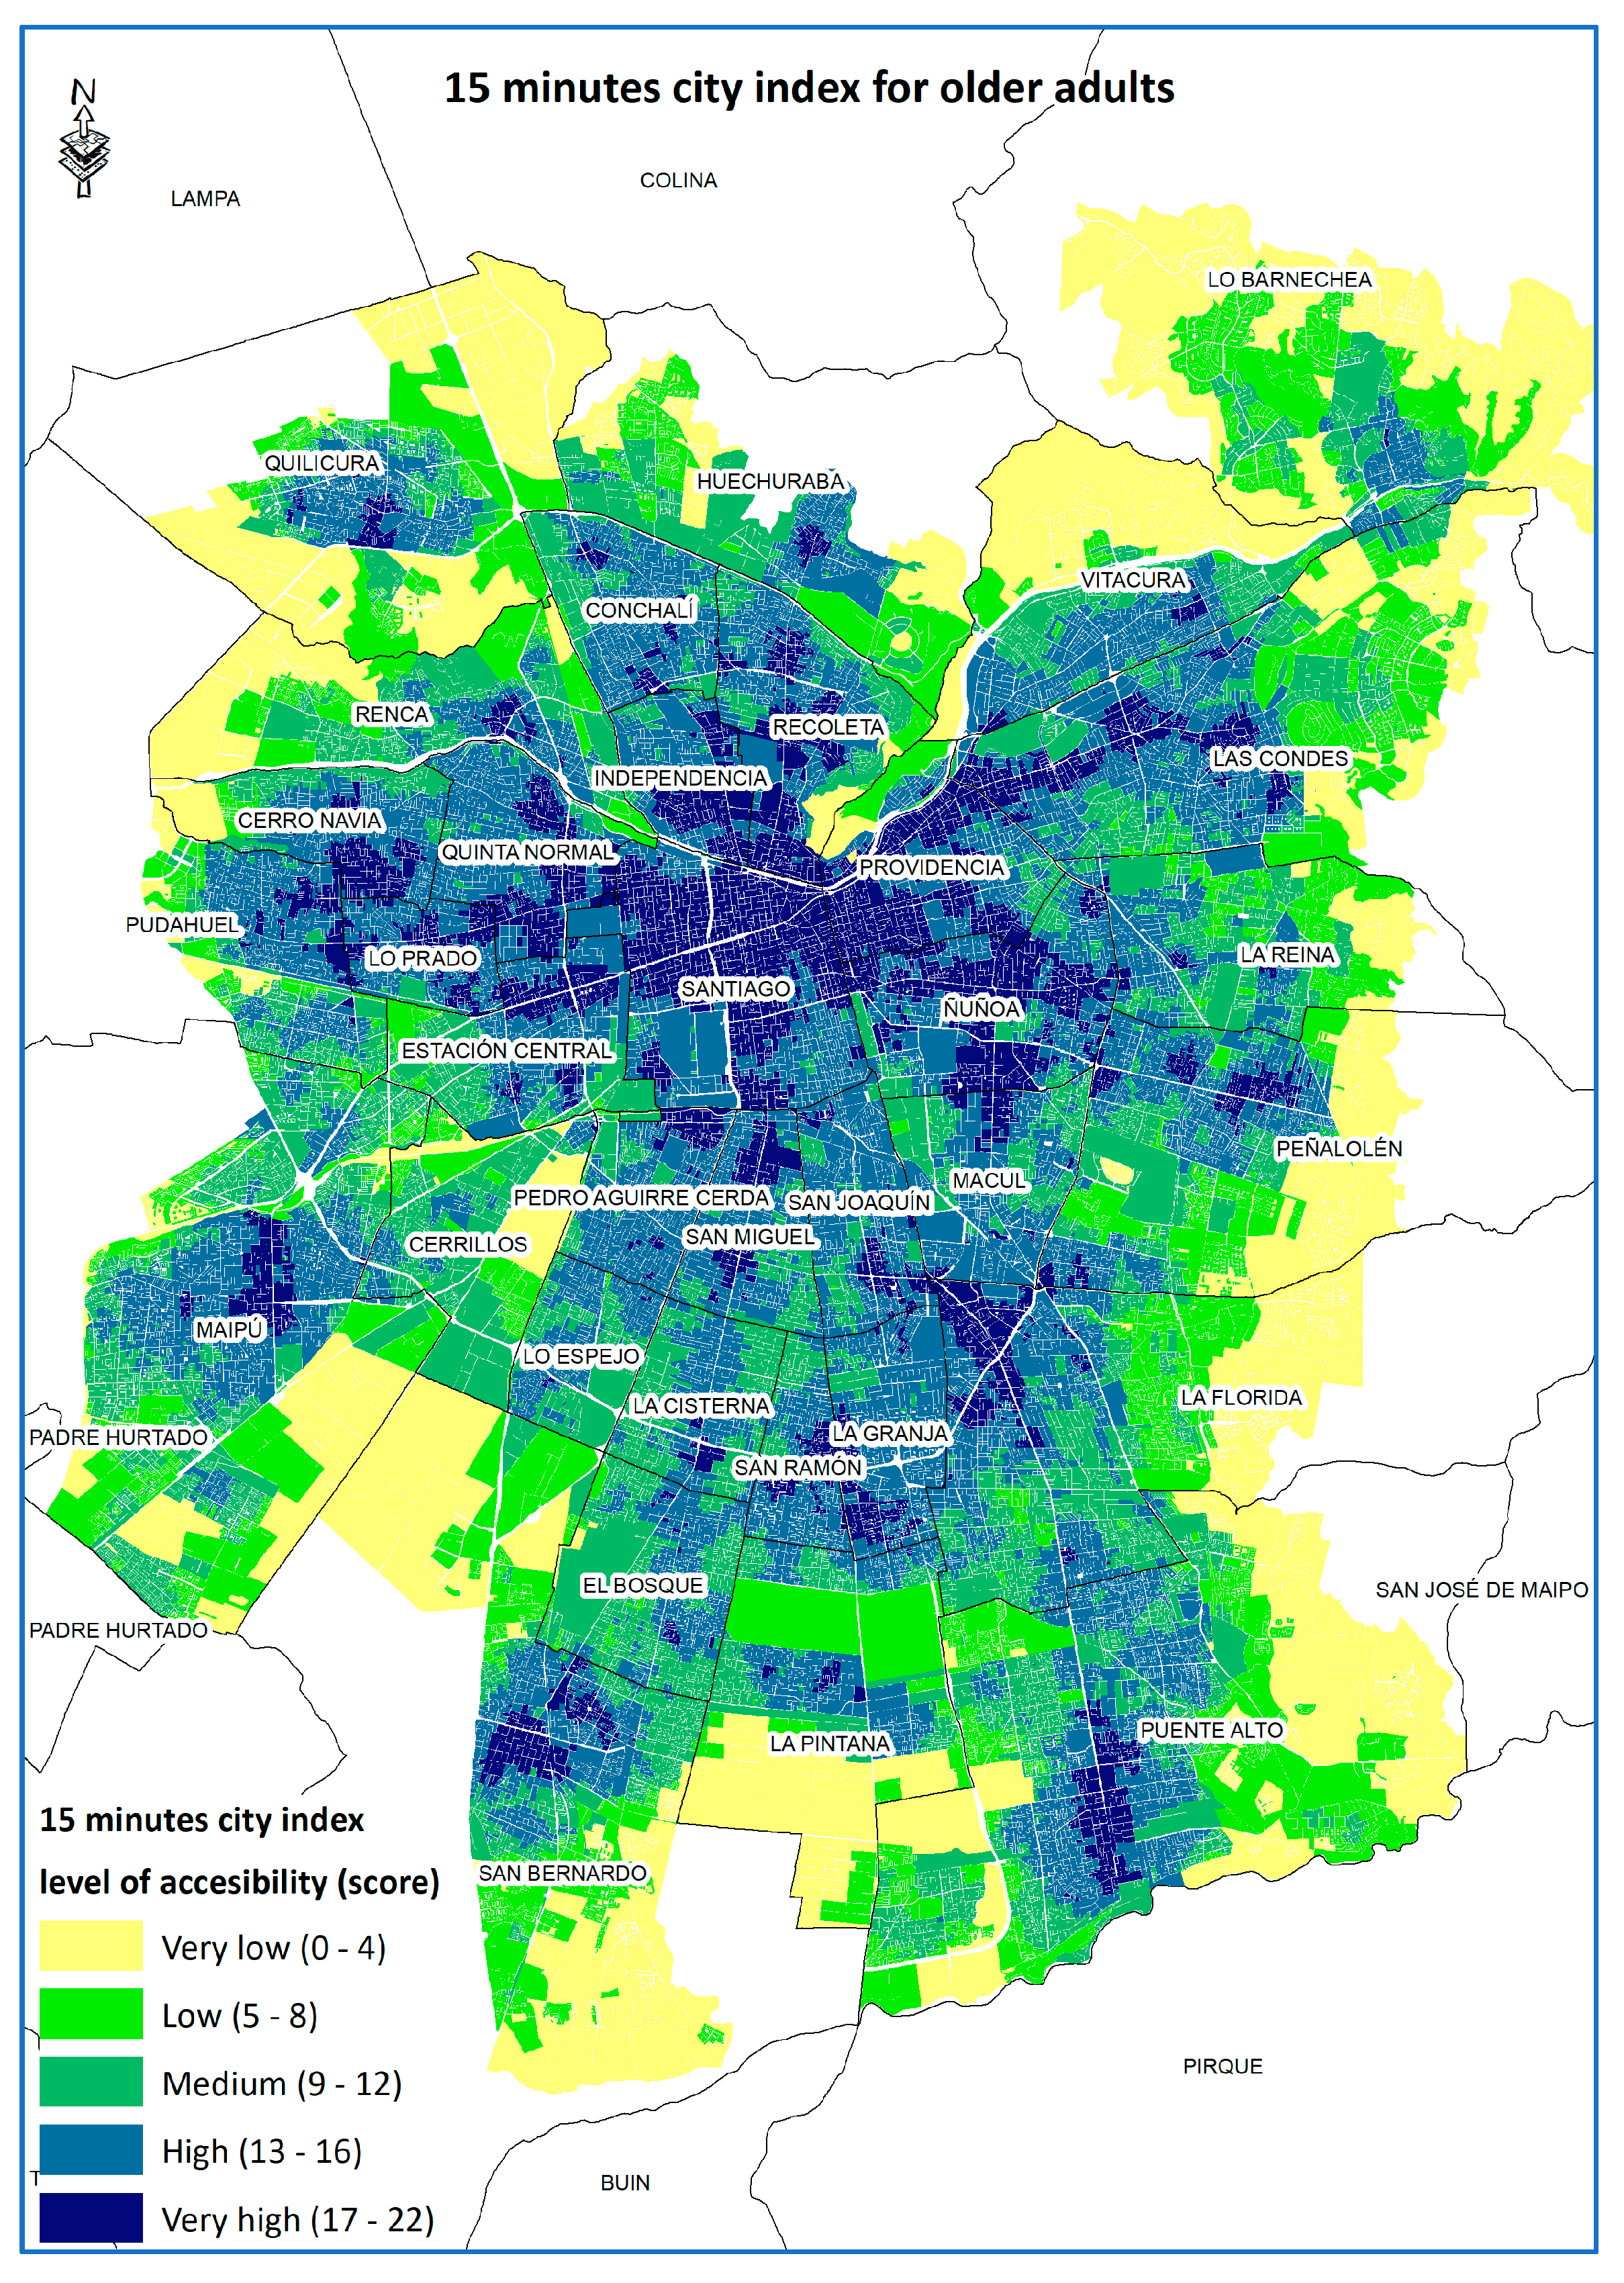
Based on the objectives of this study and the methodological proposal, the spatial distribution of the 15-min city index with a focus on older adults was obtained and is presented in
Figure 2.
This map shows the distribution of levels of accessibility to facilities throughout the city. It can be seen how this tends to be concentrated in different districts of the city, which tends to break the classic pattern of a mono-centric or fragmented city so characteristic of Latin America [
50,
51]. The areas with the highest level of accessibility to the 15-min city (17 or more facilities) are located both in the city centre and in the eastern sector, or form isolated sub-centres in various parts of the southern and western sectors of the city, in districts such as Puente Alto, San Bernardo, Maipú or Quilicura, generating an important coverage of the city. Secondly, a significant number of sectors of the city have a medium and high level of accessibility (9 to 12 facilities, and 13 to 16 accessible facilities), corresponding to peri-central sectors of the city such as the districts of Lo Espejo, La Cisterna, Maipú, Estación Central, Cerro Navia, El Bosque and Conchalí.
Finally, we can observe that there are several territories that have low or very low levels of accessibility to the 15-min city (less than eight facilities), which tend to be concentrated in the peripheral sectors of the city, especially in pre-mountainous sectors of the communes in the eastern sector of the city, corresponding to Lo Barnechea, La Reina, Las Condes, Peñalolén and La Florida. A similar situation occurs in the north-western and south-western periphery of the city in communes such as Renca, Pudahuel or La Pintana. A large part of these spaces are now sectors of industrial development, location of social housing complexes [
51] as well as housing complexes for middle and upper-middle class families [
52], which are part of the spaces of urban expansion and fragmentation that feed the urban growth of the city of Santiago. However, many of the aforementioned spaces are not populated by many older adults, but rather by a younger population, since, as the results in
Table 2 illustrate, only 2.4% of the older adults in the study area live in areas with very low accessibility to the 15-min city.
On the other hand, 11.6% of the city’s older adults live in areas of very high accessibility, followed by another 44.5% in areas of high accessibility, which shows that more than 50% of older adults live in areas with good accessibility to the 15-min city, which is slightly lower than that analysed by Correa et al. [
40], but in the context of the entire population, where 48% of citizens live in areas of high or very high accessibility to the 15-min city.
With regard to sectors categorized as medium accessibility, 33.7% of the population analysed live in these sectors, which tend to be concentrated in peri-central sectors of the city, where a significant percentage of the city’s older adult population is concentrated (
Figure 1), and which tend to have a significant consolidation in terms of public facilities such as squares, health centres or public transport, they have serious shortcomings in access to private services such as supermarkets, banks, ATMs or cultural centres, as illustrated in
Table 3.
Table 3 shows precisely how the levels of access to the 22 different facilities are configured in the levels of accessibility defined by the authors, with a focus on the older adult population. From the above we can see, for example, that the areas with very low accessibility to facilities have very low rates of access to the facilities analysed, which is even more noticeable as only 48.9% of the population of this group has access to a bus stop within 600 m, which further limits access to other facilities.
The same can be observed when we analyse accessibility to various social and cultural recreational spaces, such as squares, parks, bookstores, religious centres, gymnasiums, or theatres, which reveals a potential isolation of older adults, especially those with lower incomes, from activities that could facilitate their recreation and contact with other peers, especially in the post-pandemic context.
In general terms, it can be seen that as higher levels of accessibility are analysed, better rates of access to the facilities analysed tend to be shown, but especially for public services such as green areas, public service offices, public transport or sports centres, but other private services such as supermarkets or banks are among the services to which the lowest percentage of the older adult population has access in the city.
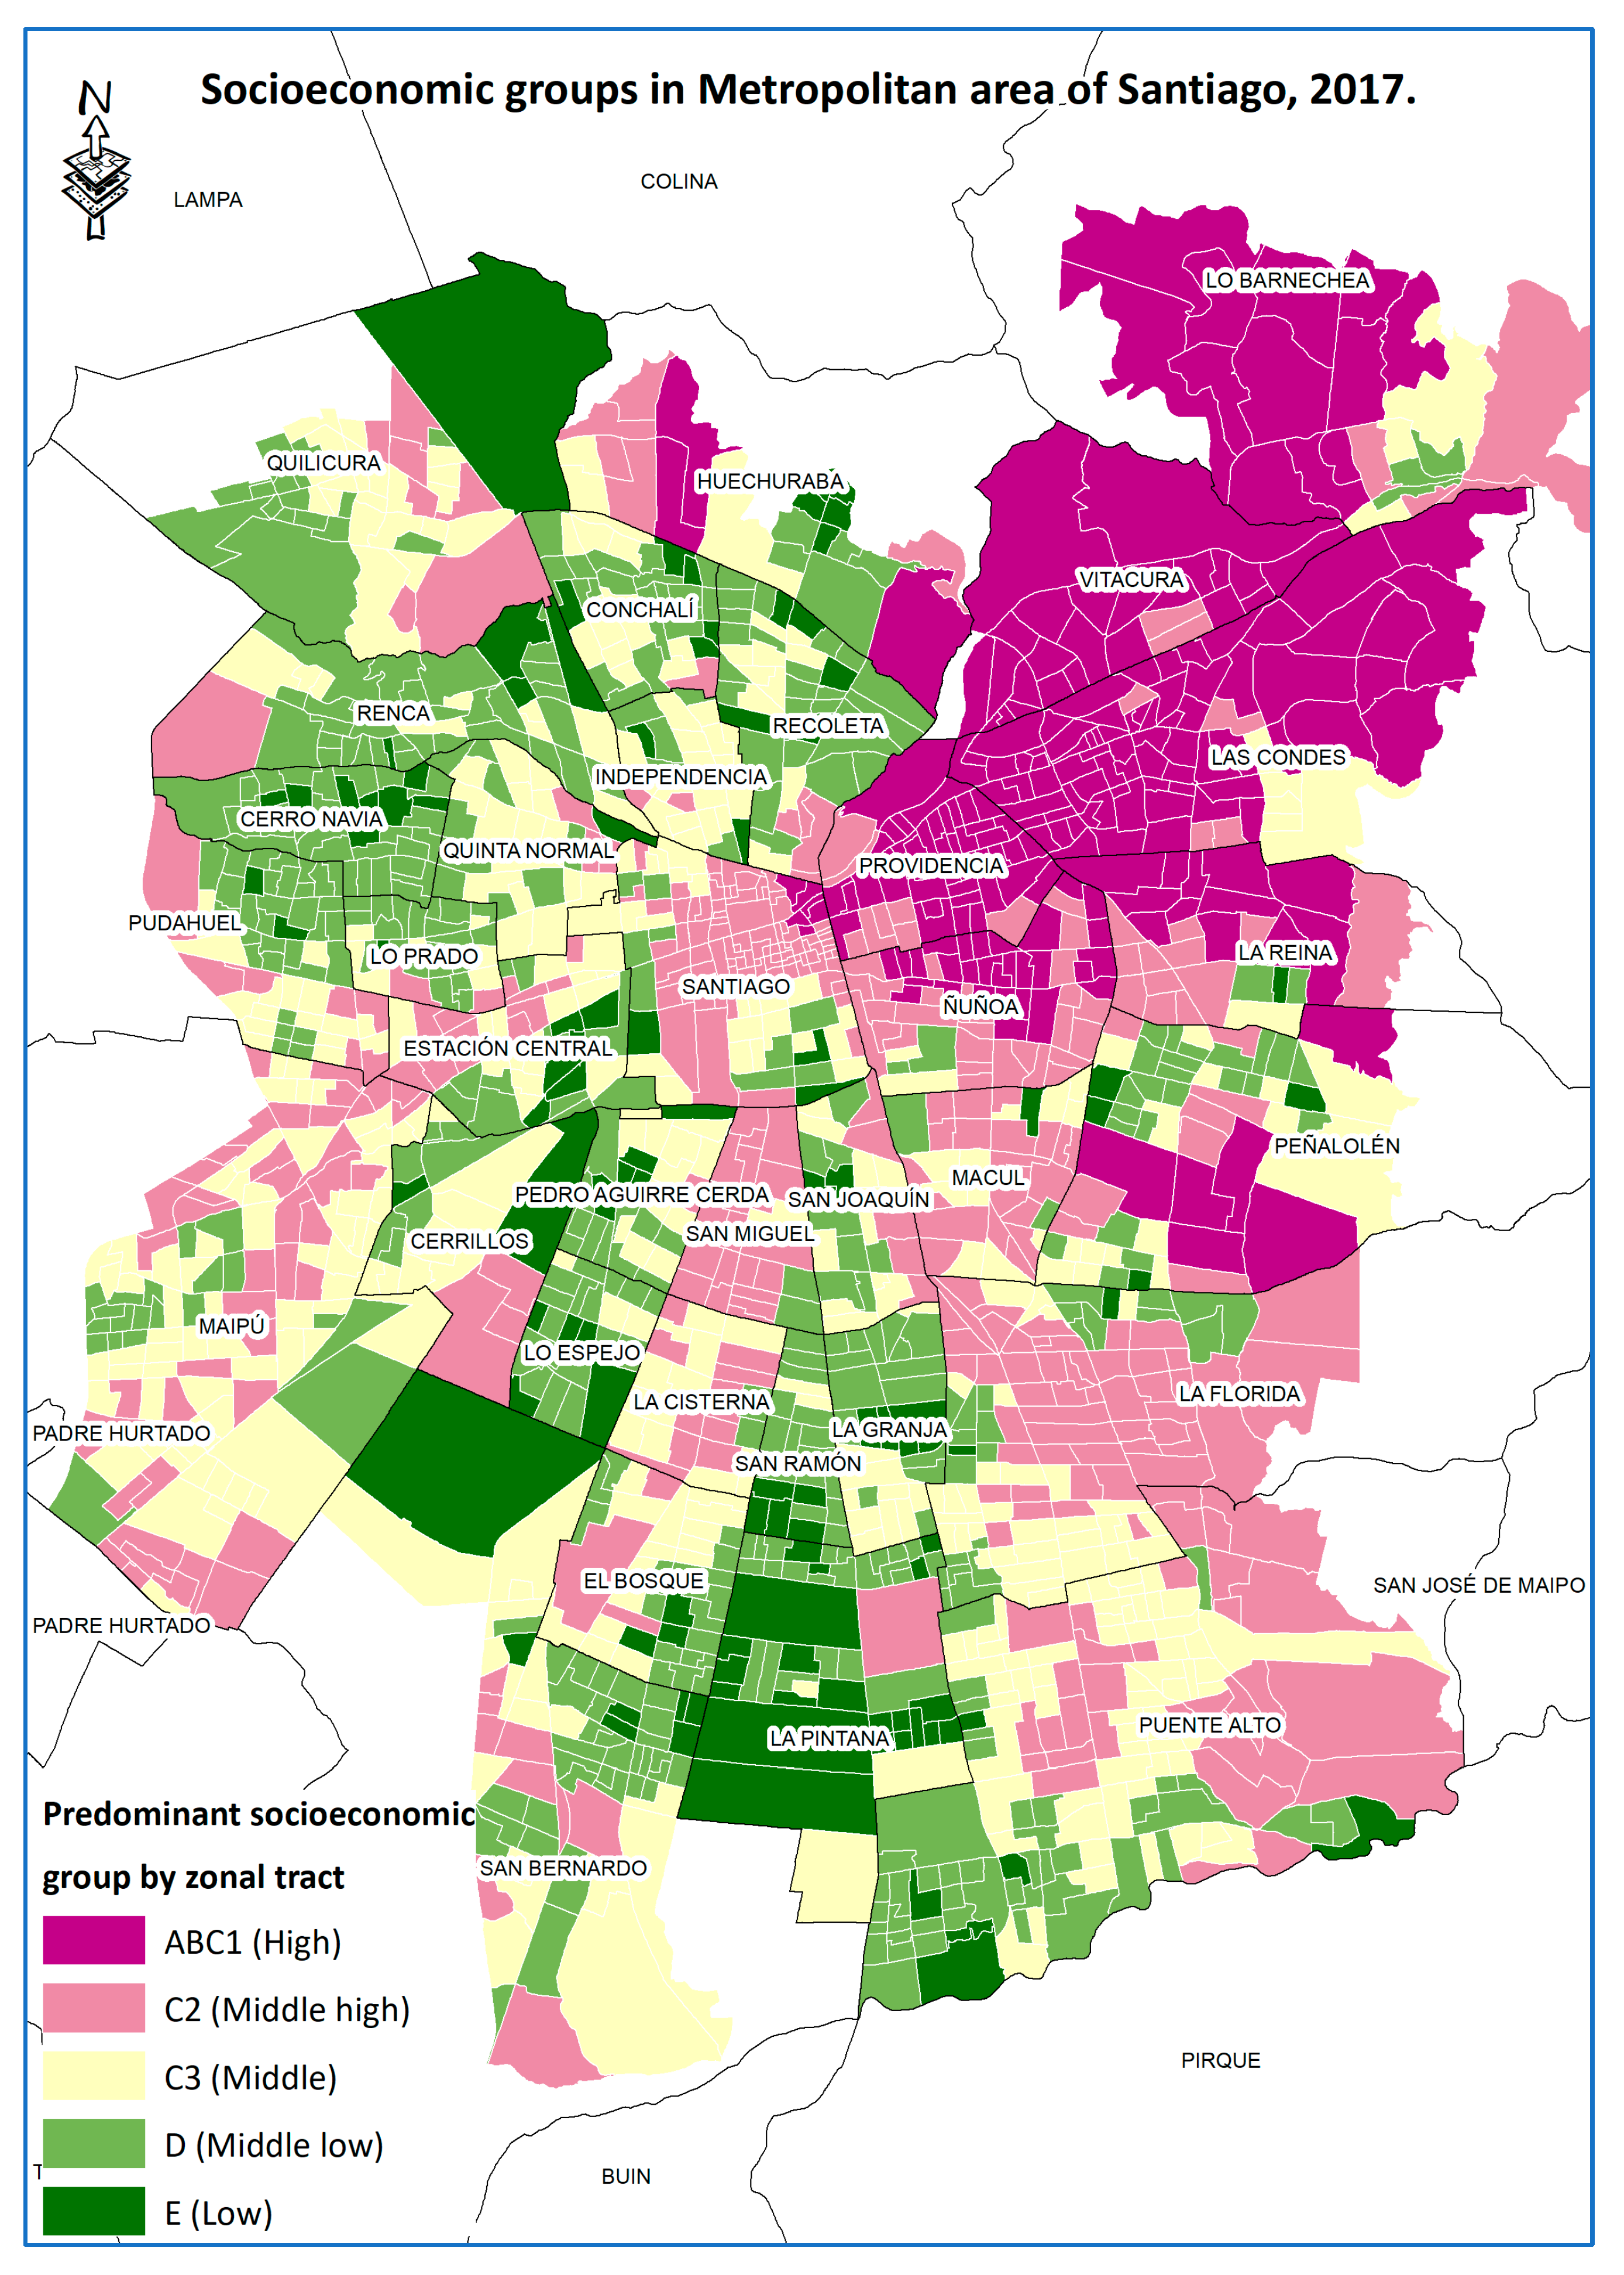
This tends to be strongly associated with the income levels of households residing in different parts of the city, as shown in
Figure 3. The distribution of socio-economic groups in the city of Santiago, which is characterized by its high levels of socio-economic segregation [
53,
54], configuring a city where the north-western and southern periphery is dominated by low and lower-middle income households. The eastern part of the city has a strong concentration of high-income households, which has historically been known as the “high-income cone” [
55].
When analysing the existing spatial relationship by characterizing the spatial units according to the levels of accessibility of older adults, for which the level of accessibility to the city within 15-min and the predominant socio-economic level according to the estimates of the UC Cities Observatory were analysed for each block, obtaining a fairly homogeneous distribution for each income level with respect to the city average (
Table 4).
At a general level, it is observed that almost no socio-economic group concentrates more than 1% of its households in areas of very low accessibility, except for the high stratum (ABC1) which exceeds 4%, but in which case it can be understood that being high-income households, they have greater flexibility in their mobility, but are strongly dependent on the car.
Another relevant element revealed in
Table 4 is that 76.3% of people in Socio-Economic Level E (i.e., the lowest) live in areas with high connectivity and access to urban facilities. This would indicate that this socio-economic group is looking for areas where urban facilities and access are concentrated to provide them with social support, which is provided by formal public and private institutions. The older population needs this type of support, as well as having it nearby, for the development of active ageing [
37].
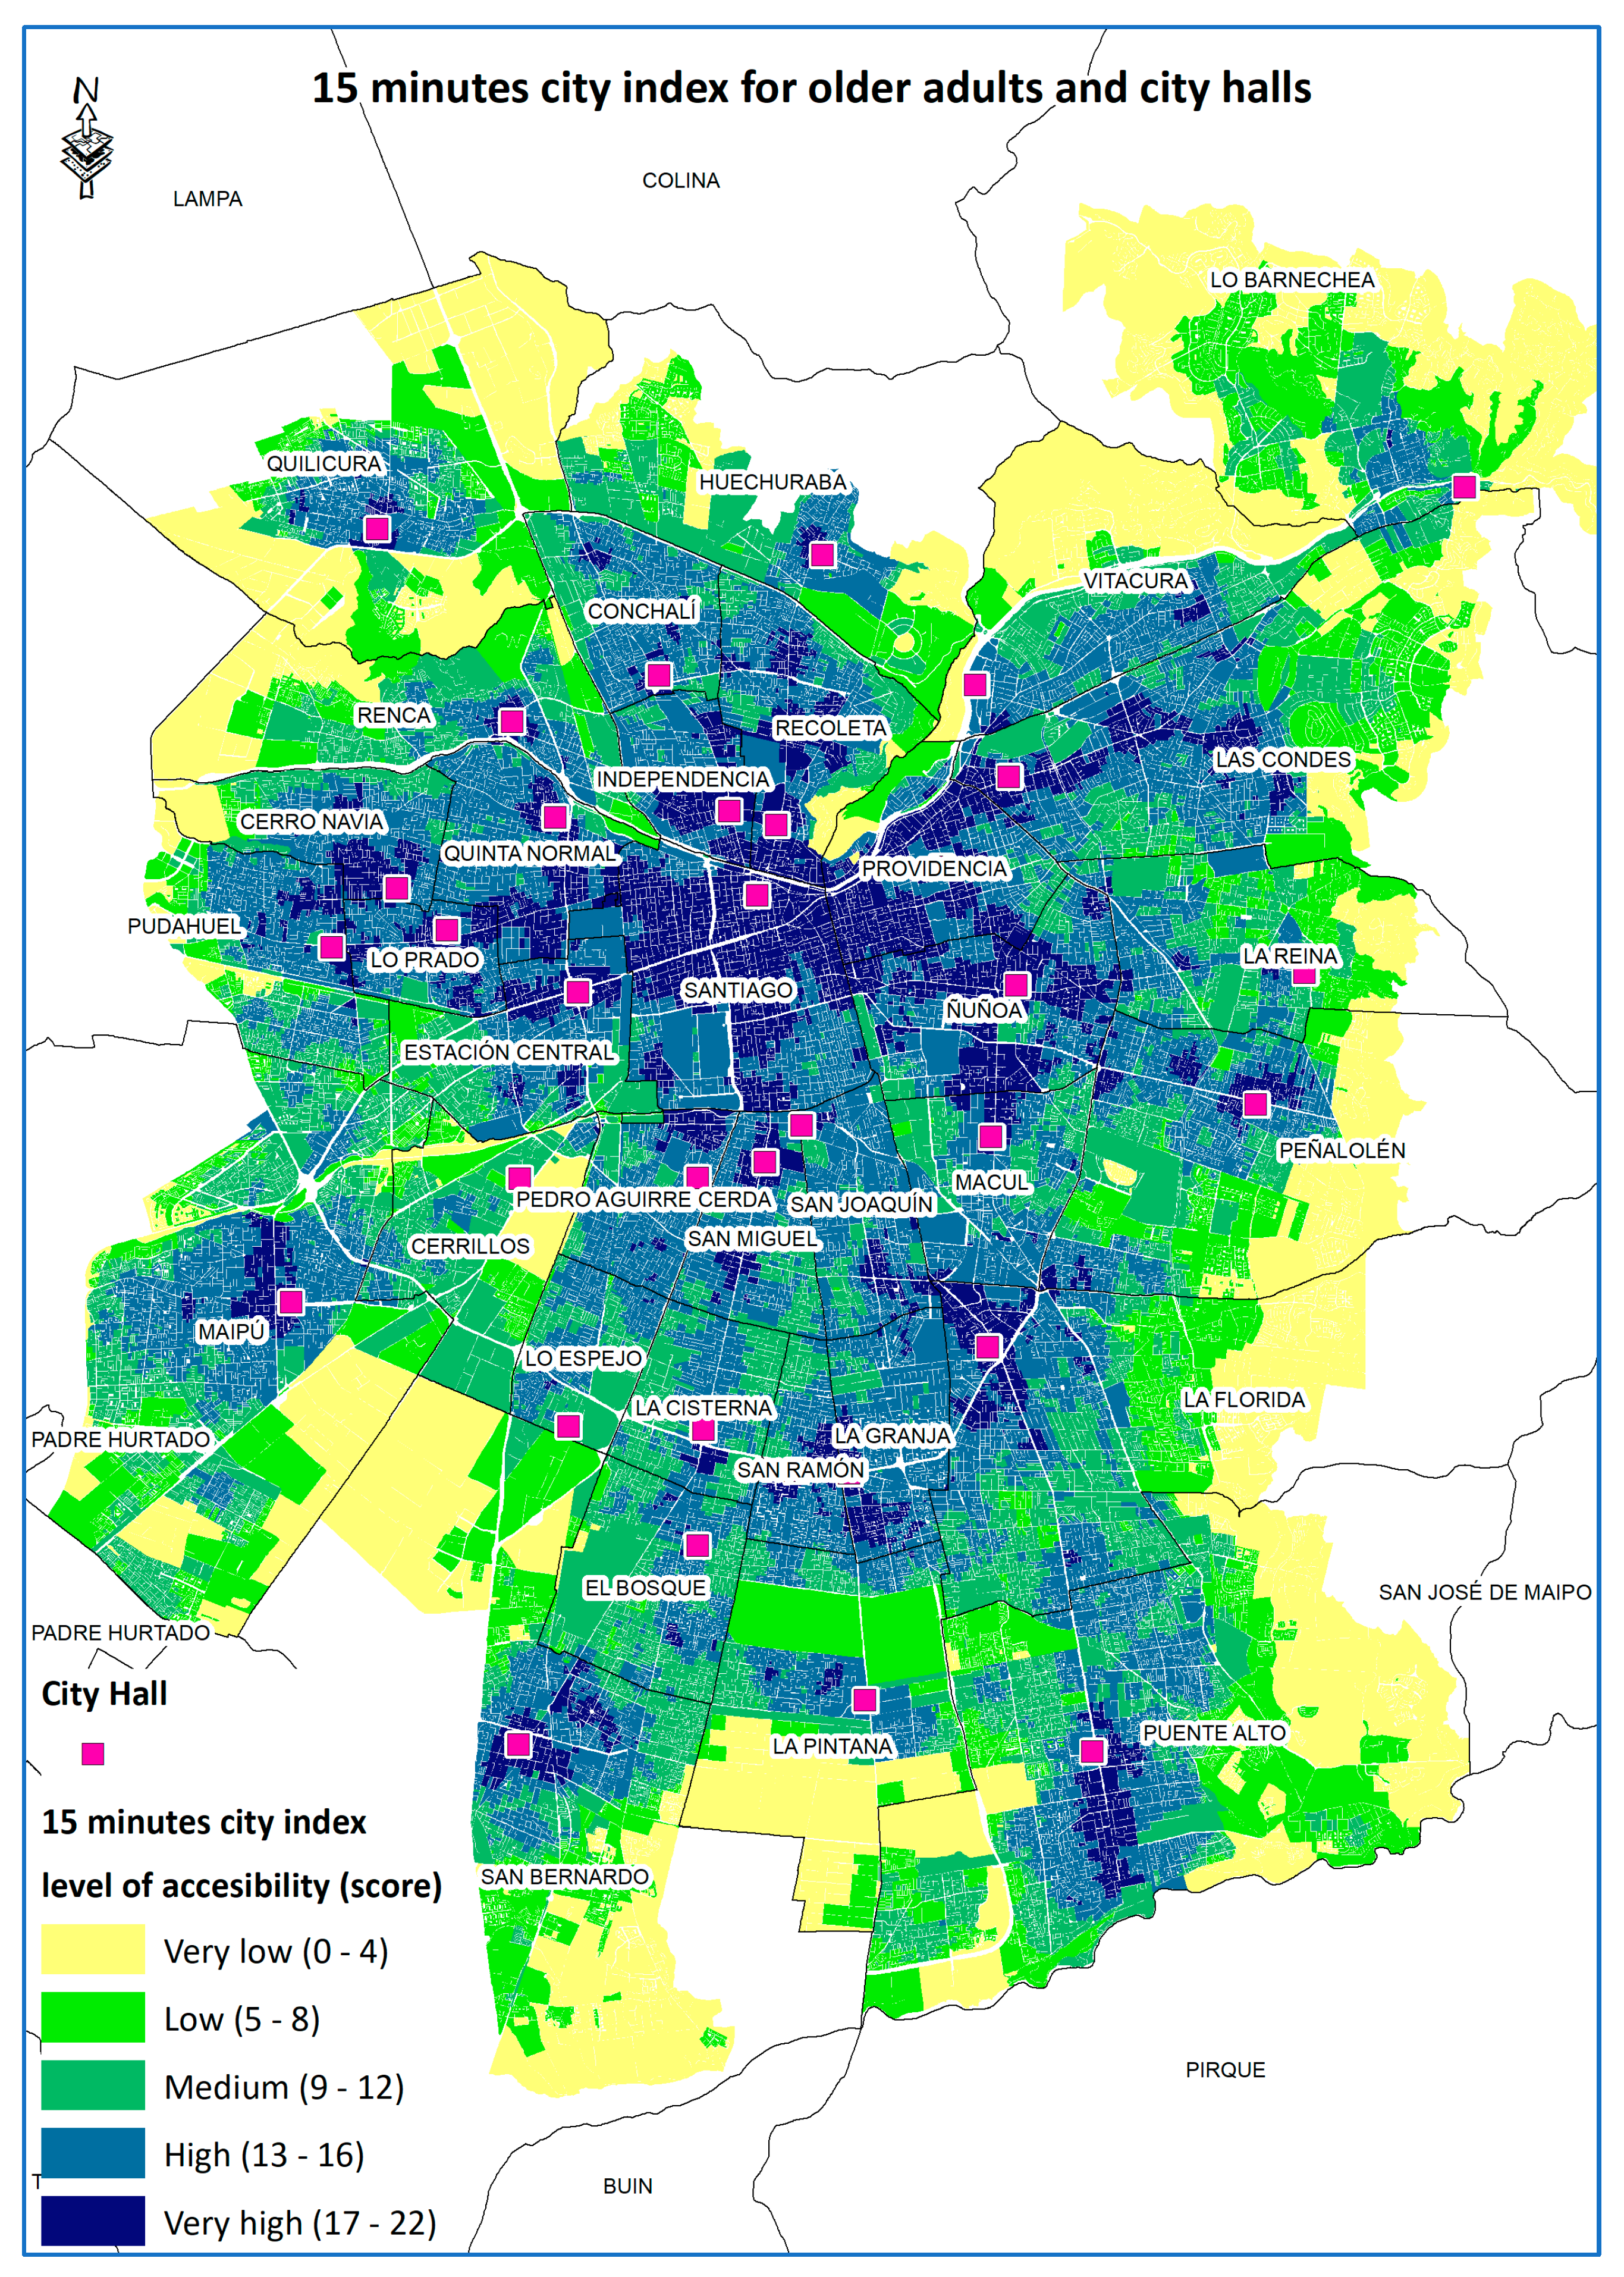
Another relevant result is the importance of municipalities in shaping a city in 15-min for the older population. According to Law No. 18695, article 1, on the constitutional organisation of municipalities, “Municipalities are autonomous corporations under public law, with legal personality and their own assets, whose purpose is to satisfy the needs of the local community and ensure its participation in the economic, social and cultural progress of the respective communes” [
56].
Therefore, we assume the importance of the municipalities for the proper management of the communes, since they are the ones who have first-hand knowledge of the realities and concrete needs of each commune.
Figure 4 indicates how the municipalities are in zones or territories in which urban facilities are concentrated within each commune. With this we understand that, at the city level, municipalities are transformed into attractors of private and public urban facilities, as well as attractors of the elderly population for the development of their lives.
4. Conclusions
The idea of a 15-min city, thanks to the recent health crisis, has been placed as a concept at the centre of transformations for a post-pandemic city, in what could be a true urban revolution. On the potential breakthrough of this 15-min city in Santiago, the findings of this research offer some valuable insights for rethinking the planning of this metropolis in the Global South. First, Santiago can indeed be a 15-min city for older people, as the results indicate that it is a city with more accessible spaces than one might think at first glance, especially for middle- and lower-middle-income households, which account for about 70% of the city’s older adults.
While there are communes in which municipalities are places where the older population tends to frequent, there are also communes such as Santiago Centro where the commune is better connected in terms of urban facilities but has a low density of older population. A policy from this commune to attract new elderly neighbours would be successful given that the urban space would already allow for better living conditions in relation to other communes in the city. Most of the communal territories vary between 0% and 10% of older population in their neighbourhoods, and in contrast to the aforementioned elements, in the case of Santiago Centro, the neighbourhood of the municipality concentrates only between 0% and 5% of older population.
This is a sign of the abandonment of the older population of the historic city centre, which is undergoing a population renewal, driven in part by a series of recent migratory and real estate phenomena. Because it is the oldest commune in the nation, it was probably the older people who have been displaced from these neighbourhoods by real estate pressures, who created a 15-min city that they cannot enjoy today because of the proto-gentrification that the sector is experiencing. Today, the older population does not live in Santiago Centro, despite all the urban facilities available to them there.
On the other hand, communes were identified that offer spaces with high levels of access to urban facilities and that are highly populated by older people. Cases like these are Providencia (high income) or Lo Prado (low income), which are communes with a very high density of elderly population, and which have high and very high qualification in almost all the territories where this population is concentrated. This indicates that the older population is looking for peri-central communes with high levels of urban connectivity in order to settle and develop their old age.
This not only shows the profound urban inequalities that can be seen in the city of Santiago, but also in other cities in the region, which makes us question how effective these 15-min city model is and its real accessibility in the short and medium term, especially if we think about the strong economic and social inequalities that have built these cities. The Chilean state has made a commitment to address the problem of ageing with dignity in Chile, which is hampered by the very poor pension system and the absence of effective social security programs to secure the future. One of the critical aspects of ageing with dignity is secure and well-located housing.
Figure 3 offers clarity to local authorities in thinking about where to develop public housing programs with a focus on older people, thereby seeking to ensure that not only shelter for old age is provided but also centrality to the functions that enable a fulfilling daily life.
This leads us to think that it is not only about the availability and access to certain facilities or urban function in the territory, but also to question other fundamental aspects that are not addressed by this study, such as the conditions of accessibility in situ (condition of the sidewalk, quality of public transport, safety) that shape the travel experience of the EP, and that could affect their mental health.
Another aspect to be explored is how travel experiences or encounters around certain services can deteriorate or strength the social fabric of the communities and EP. Thus, new studies can also apply this methodology and incorporate new perspective to review other factors such as the city of childhood or the same study of older people in other cities in Chile and Latin America, as we have shown, this idea of a walkable city is not an easy goal to achieve, especially after the effects of the SARS-CoV-2 pandemic.

 ,
, 


