
The Future Possibilities and Security Challenges of City Digitalization


Abstract
:1. Introduction
- Define the main framework for the architecture of the city digital platform.
- Define how to deal with gathered data.
- Identify possible security threats.
- Define future trends and military usage.
- Compare Rotterdam and Brno digital platforms.
2. Related Works
3. City Digitalization
- Operational: properties of urban objects and activities, derivation of opportunities for improvement.
- Critical: monitoring and deriving incident or crisis response recommendations.
- Analytical: identifying and assessing patterns to subsequently derive predictions about urban innovation.
- Strategic: assisting in the progress of strategies between goals, plans and decisions in the urban environment.
4. Security Risk and the Potential of Digitalization for the Military
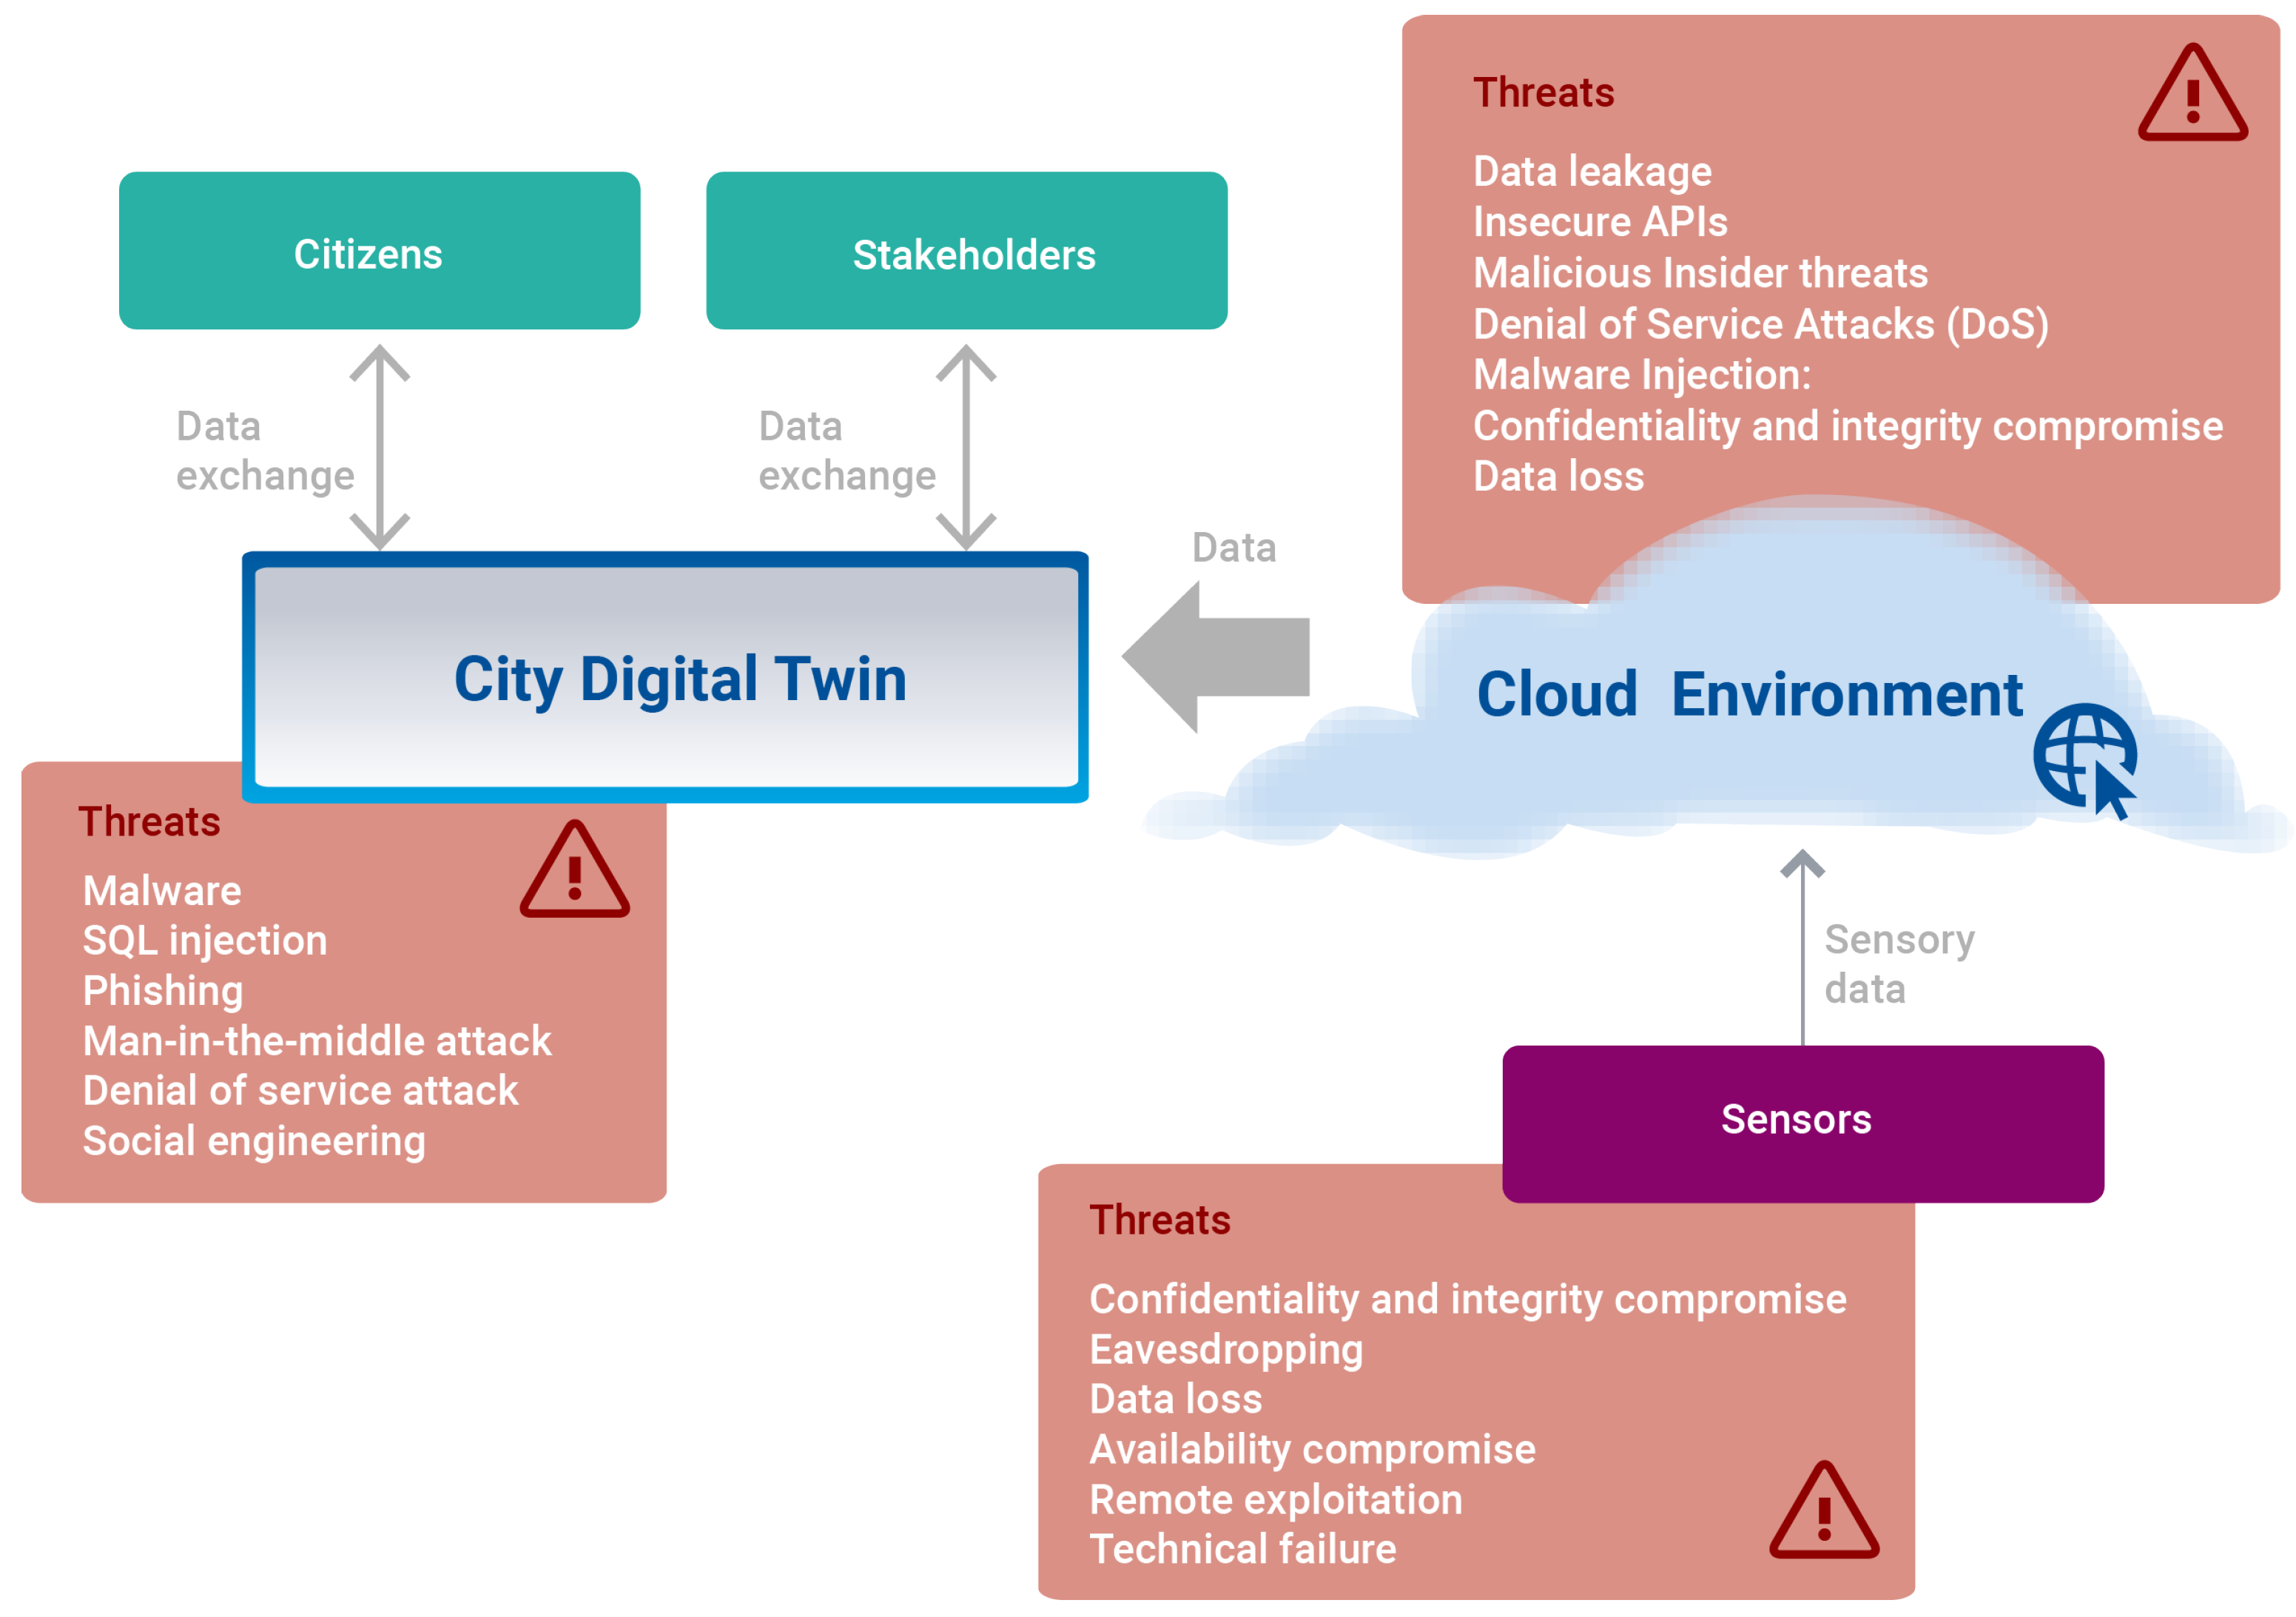
- Confidentiality and integrity compromise: Only authorized devices should have access to stored sensor data. If unauthorized devices gain access to the sensor data, their integrity could be compromised.
- Eavesdropping: The integrity of the transmitted data can be compromised by unsafe communication between individual sensors and the gateway. Unauthorized interception of communication may occur during transmission, which may result in discrediting, manipulation of transmitted data, and improper functioning of the entire system.
- Data loss: Loss or theft of sensitive data and information by attackers can disrupt the operation of a smart city.
- Availability compromise: Established plans and procedures must identify possible sensor failure and prevent a negative impact on the function of the smart city. Sensor failure without established procedures and contingency plans could lead to dangerous and unpredictable situations.
- Remote exploitation: Since the sensor network communicates with the master server, an adversary can gain unauthorized access to the network’s internal systems by exploiting vulnerabilities such as an error in a program or a valid account. Subsequently, an adversary can run unauthorized code to take over the system.
- Data leakage: By managing smart city data with a third-party cloud system, the city loses control over the data, and the data may be stolen by adversaries.
- Insecure APIs: The interaction of the cloud system with user applications is mostly ensured using the API interface. The API interface used must ensure secure communication.
- Malicious Insider threats: A background check of individual employees working for cloud service providers may not reveal unauthorized handling of client data.
- Denial of Service Attacks (DoS): Because the city data cloud is operated by a third party, the smart city system may become inoperable or inaccessible due to a DoS attack.
- Malware Injection: The infrastructure of cloud systems is vulnerable to malware injection attacks. An attacker creates a fraudulent application and injects it into the cloud system. Subsequently, the malicious application is launched as one of the valid instances in the cloud system.
- System and Application vulnerabilities: The city has no control over the processing and security of the data, as they are managed by a cloud system provider. For this reason, the provider must be verified and trustworthy.
- Ensuring protection against malware
- Frequent evaluation of the vulnerability of individual components of intelligent systems
- Implementation of best practice awareness programs for users
- Offering frequent training for employees
- Device monitoring of legacy smart systems
- Being aware of the incompatibility of potential suppliers’ security mitigations
- Securing network communication using a VPN
- Using smart devices to communicate only operational/critical data and not all private consumer information
- Using a public key infrastructure to secure information exchange
- Design and implementation of a network intrusion prevention system
- Permission should only be guaranteed by specifying the correct authentication mechanism and protocols.
- Building a resilient physical network and a secure infrastructure
- Securing components inside and outside
- Protective equipment
- Hard-to-crack devices with built-in security by design
- Ensuring the installation and maintenance of the surveillance mechanism
- Frequent checking of all hardware
Military Usage
- Misuse of the technical infrastructure by the enemy to support their attack. This must be preceded by a successful cyber-attack on the smart city system to take control of the control systems.
- The use of the smart city’s technical infrastructure to support the defence of its own territory when attacked by the enemy.
- Military moves directly into the area of the urban conflict. The main part of the work is carried out by the infantry with the support of the air force and ground vehicles.
- Distant Intelligence, Surveillance and Reconnaissance (ISR). Gaining and maintaining current situational awareness is critical to planning and executing counter and recovery operations.
- Ground support from the infantry/air force that gains support from neutralizing the enemy at long range.
- Sensors deployed in buildings can provide data on air quality, chemical/smoke, radiation, and gas to indicate various types of chemical leaks, explosions, and hostile activities in areas.
- An intelligent traffic management system can guide the navigation of ground assault support so that infantry can move rapidly through the objective area.
- A smart grid and distribution network would allow the military to manage power in the event of outages or intermittent supplies. The military can use smart points/hubs around the city as an alternative source of energy to power their equipment. Likewise, the grid would allow the military to restore power for essential services in the city using its secondary power sources.
- Water quality sensors can be used to detect if the water system of the city has been compromised.
5. Rotterdam vs. Brno Implementation State
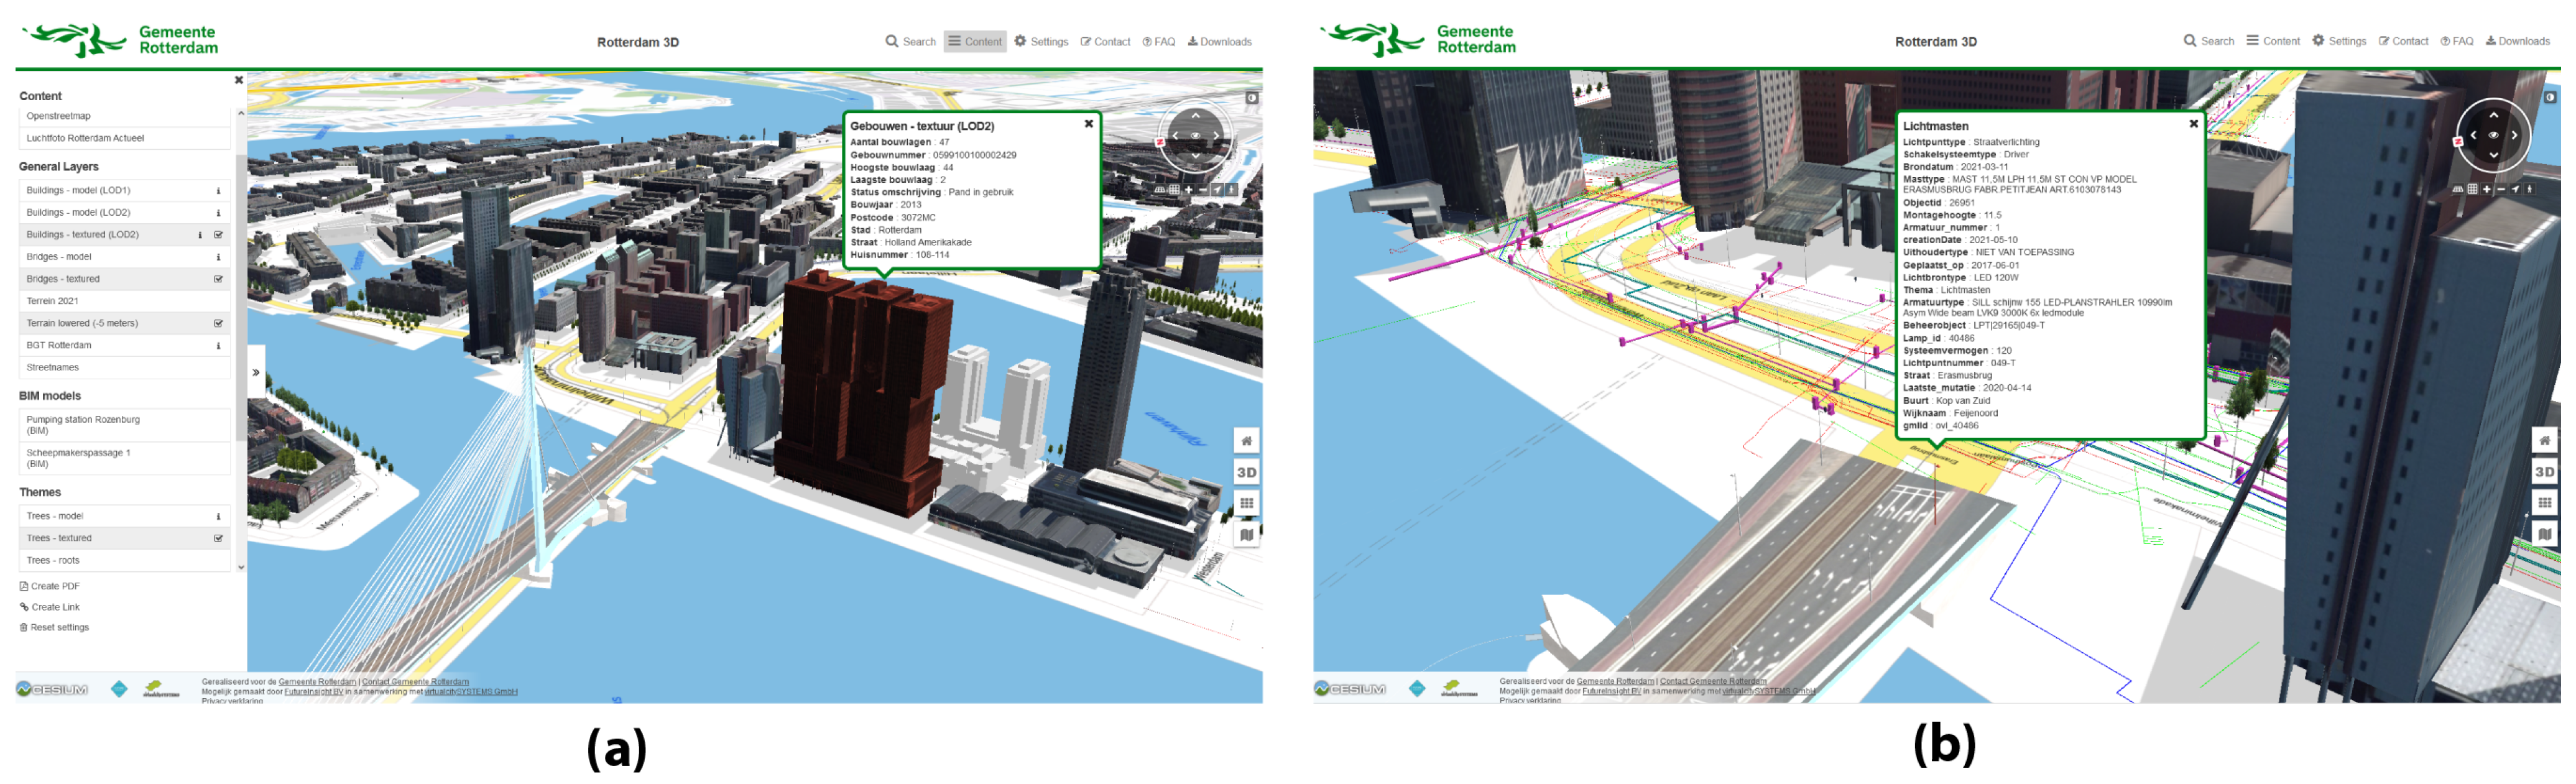
5.1. Rotterdam
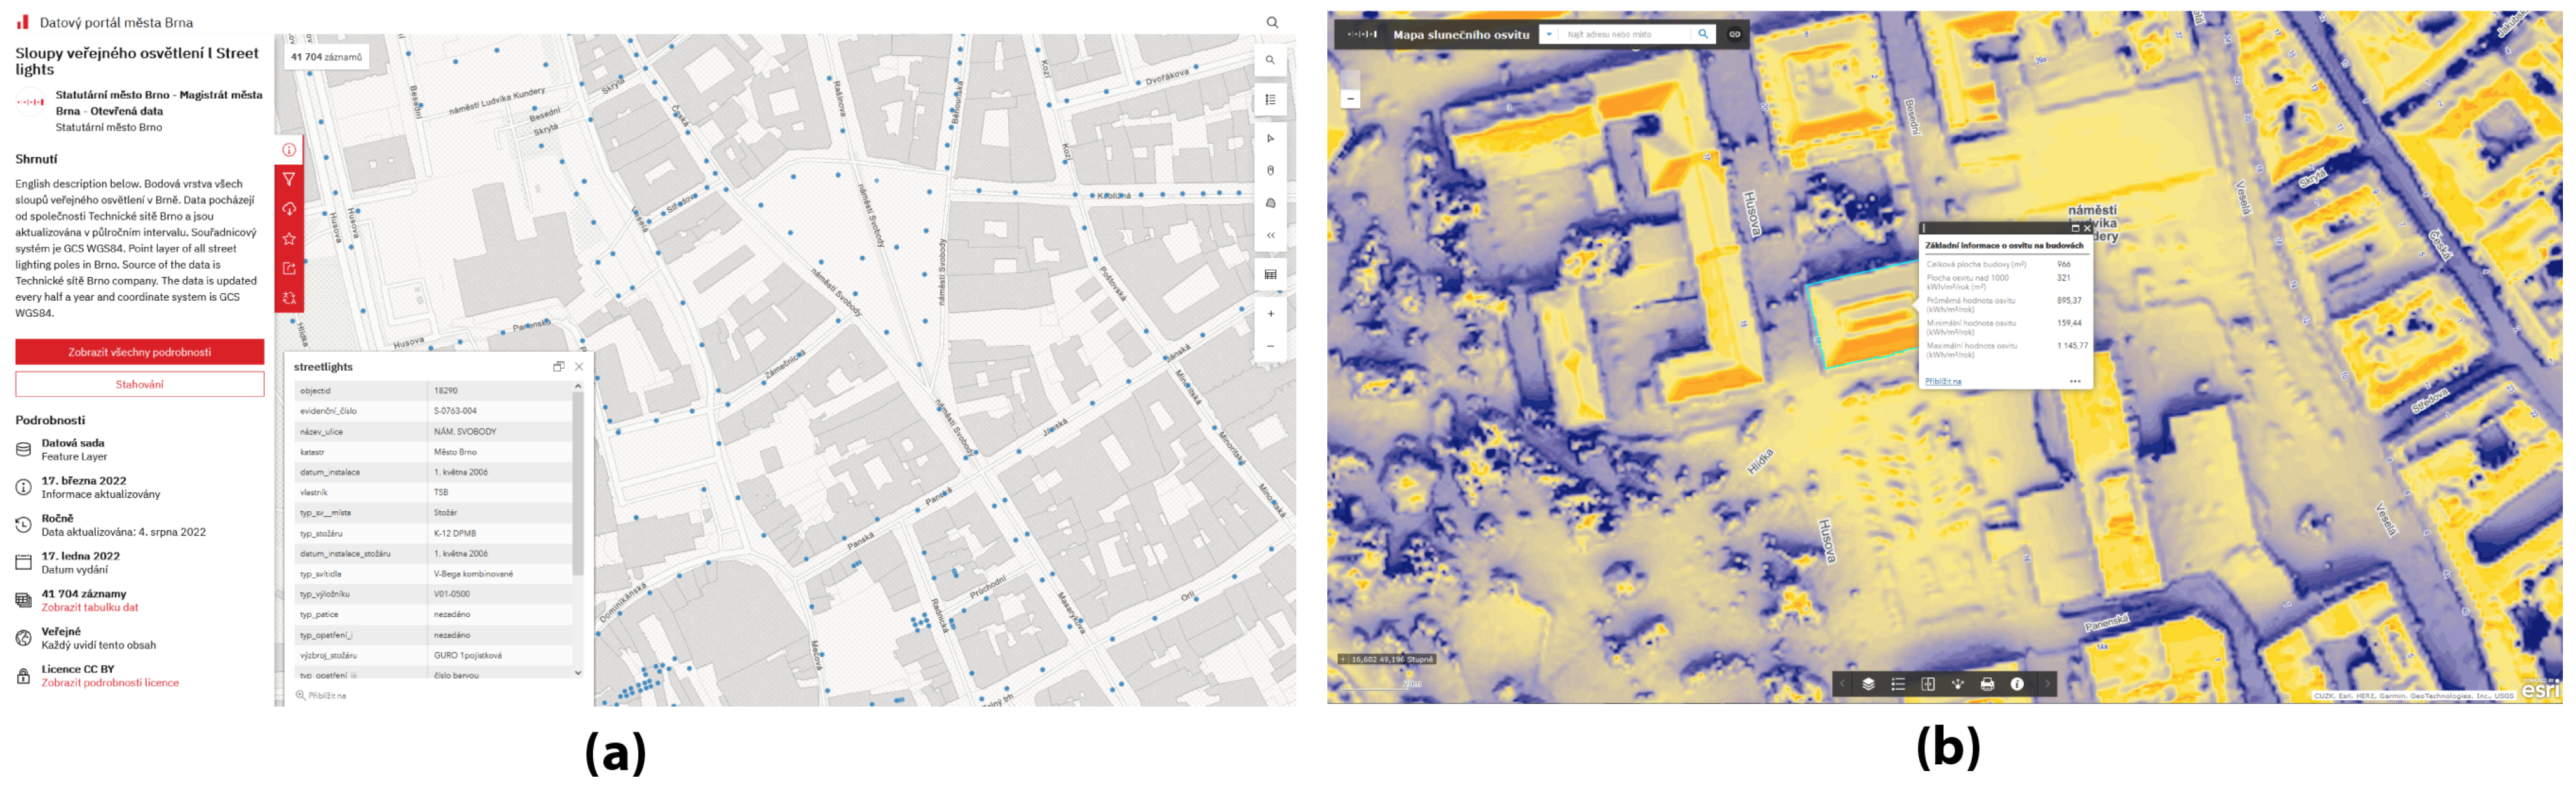
5.2. Brno
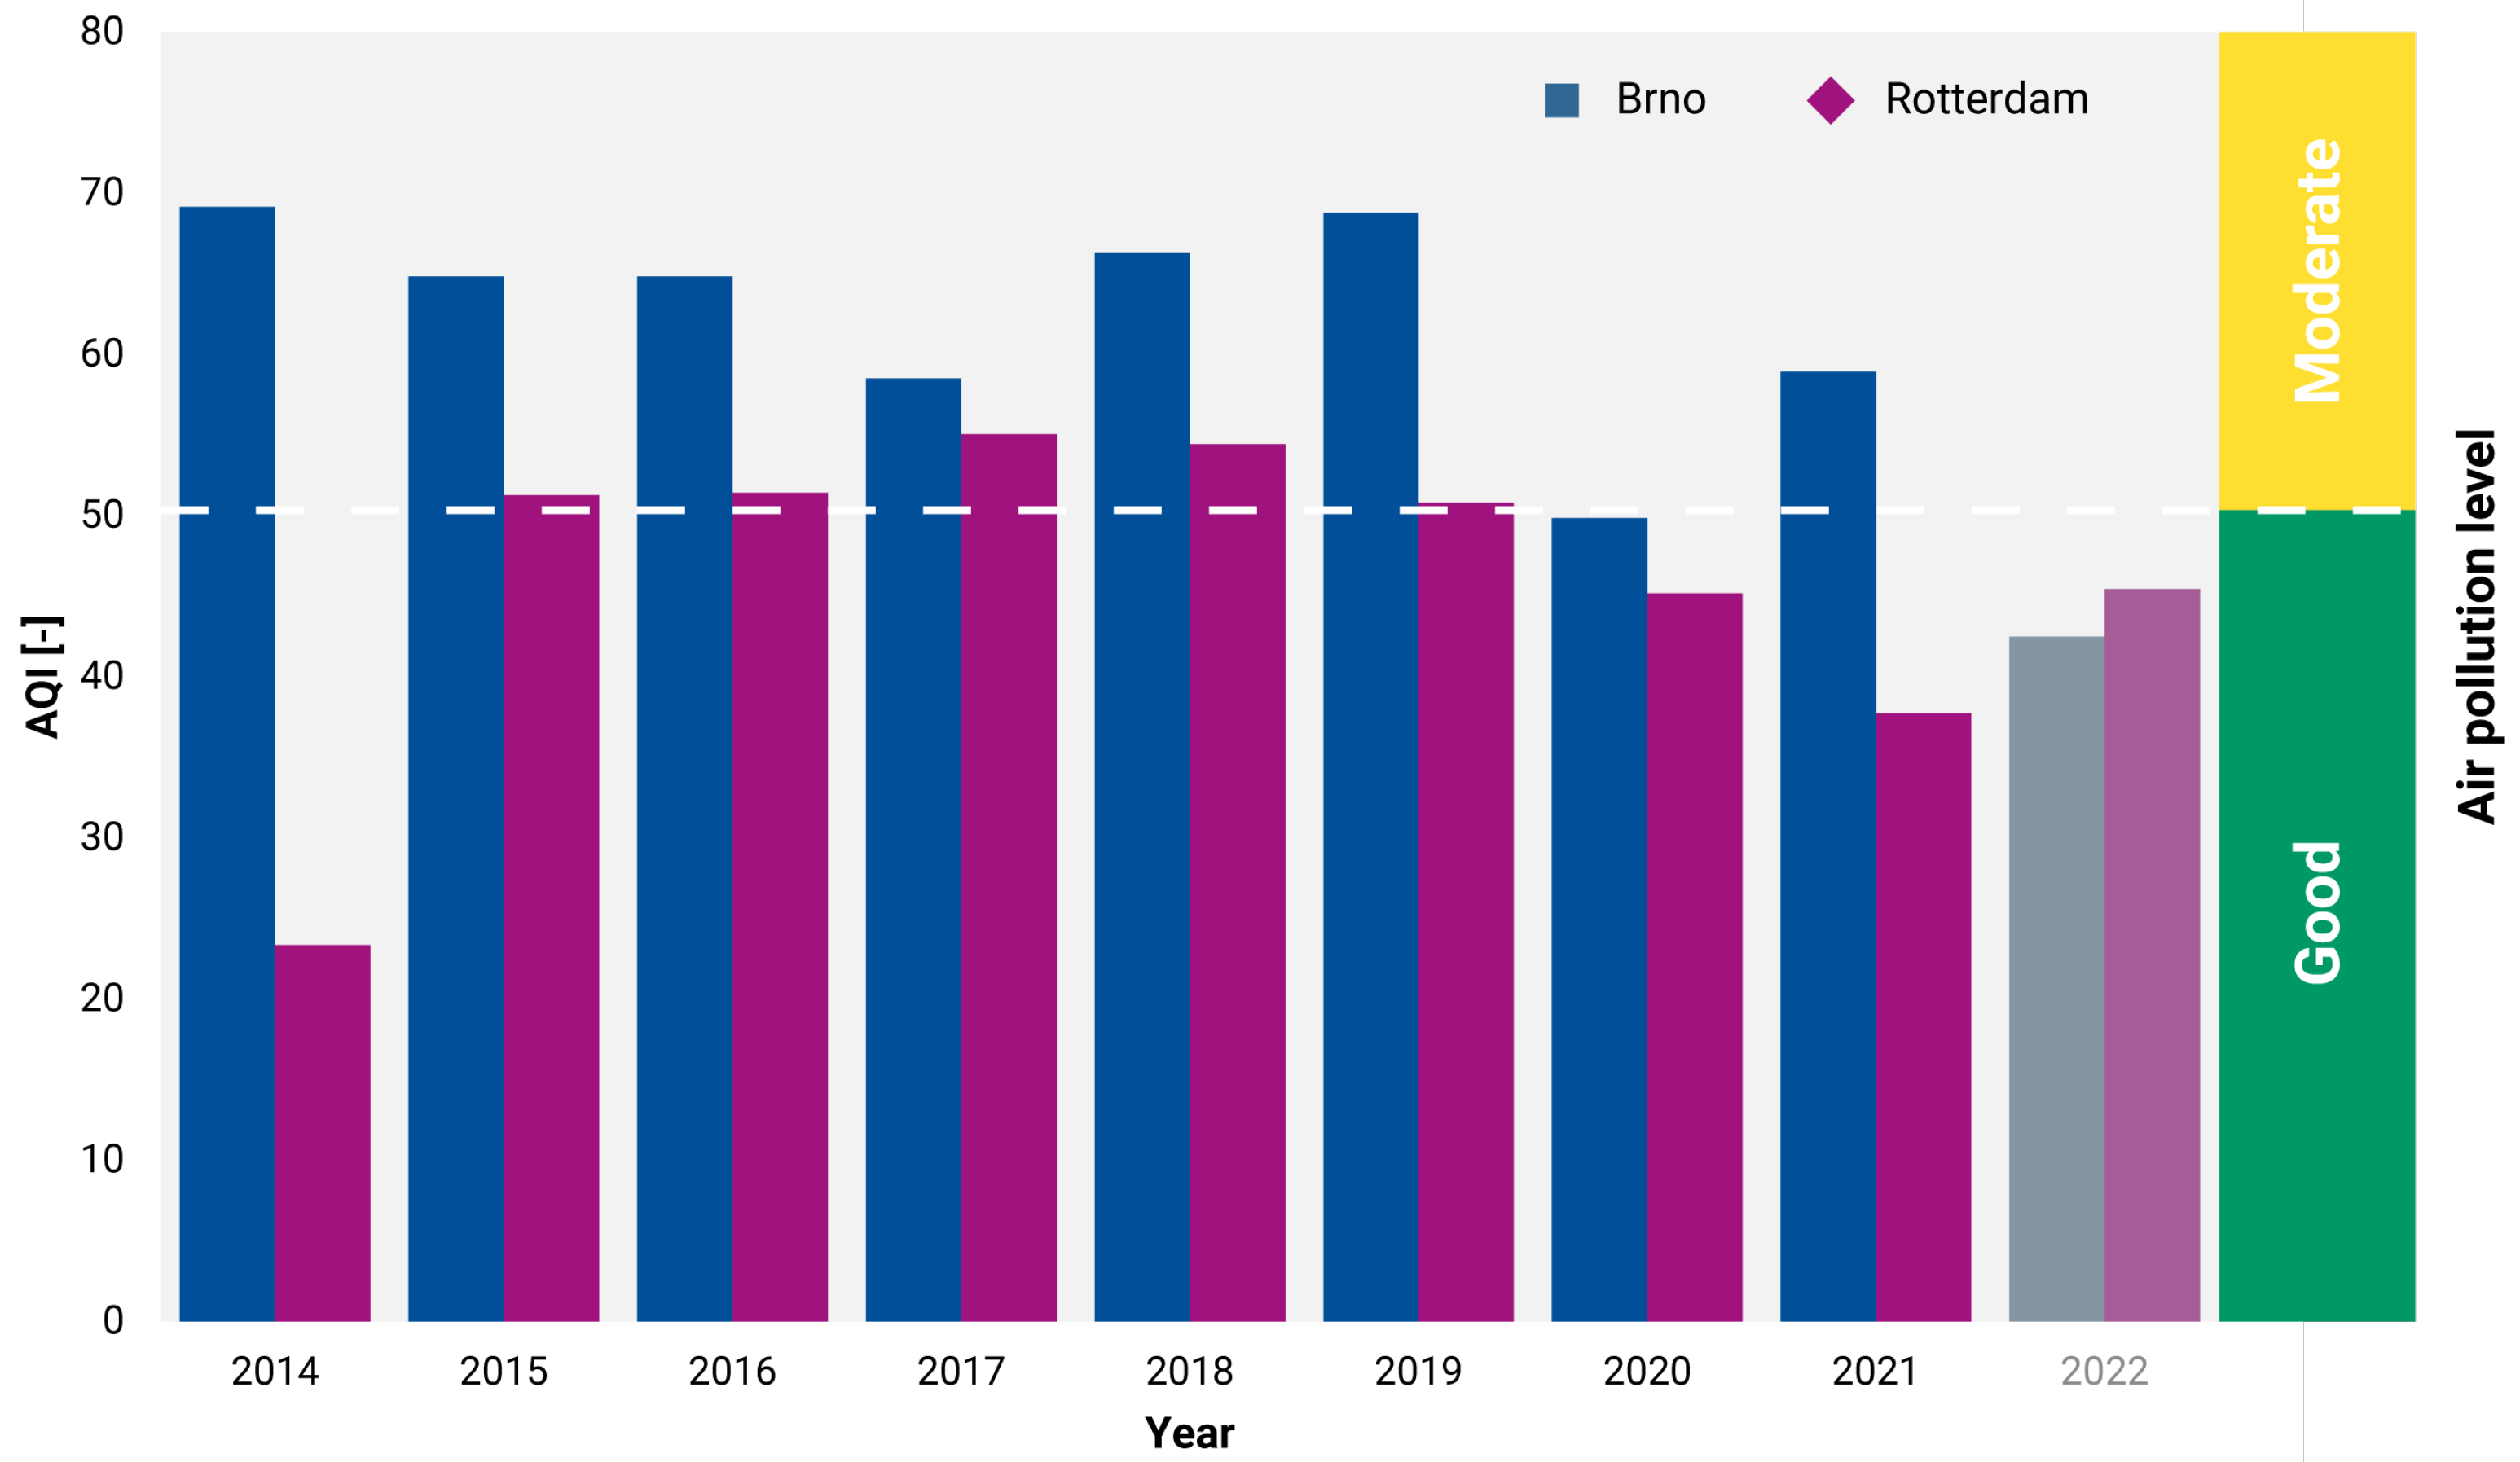
5.3. Urban Data Portals Comparison
6. Discussion
7. Future Trends
8. Conclusions
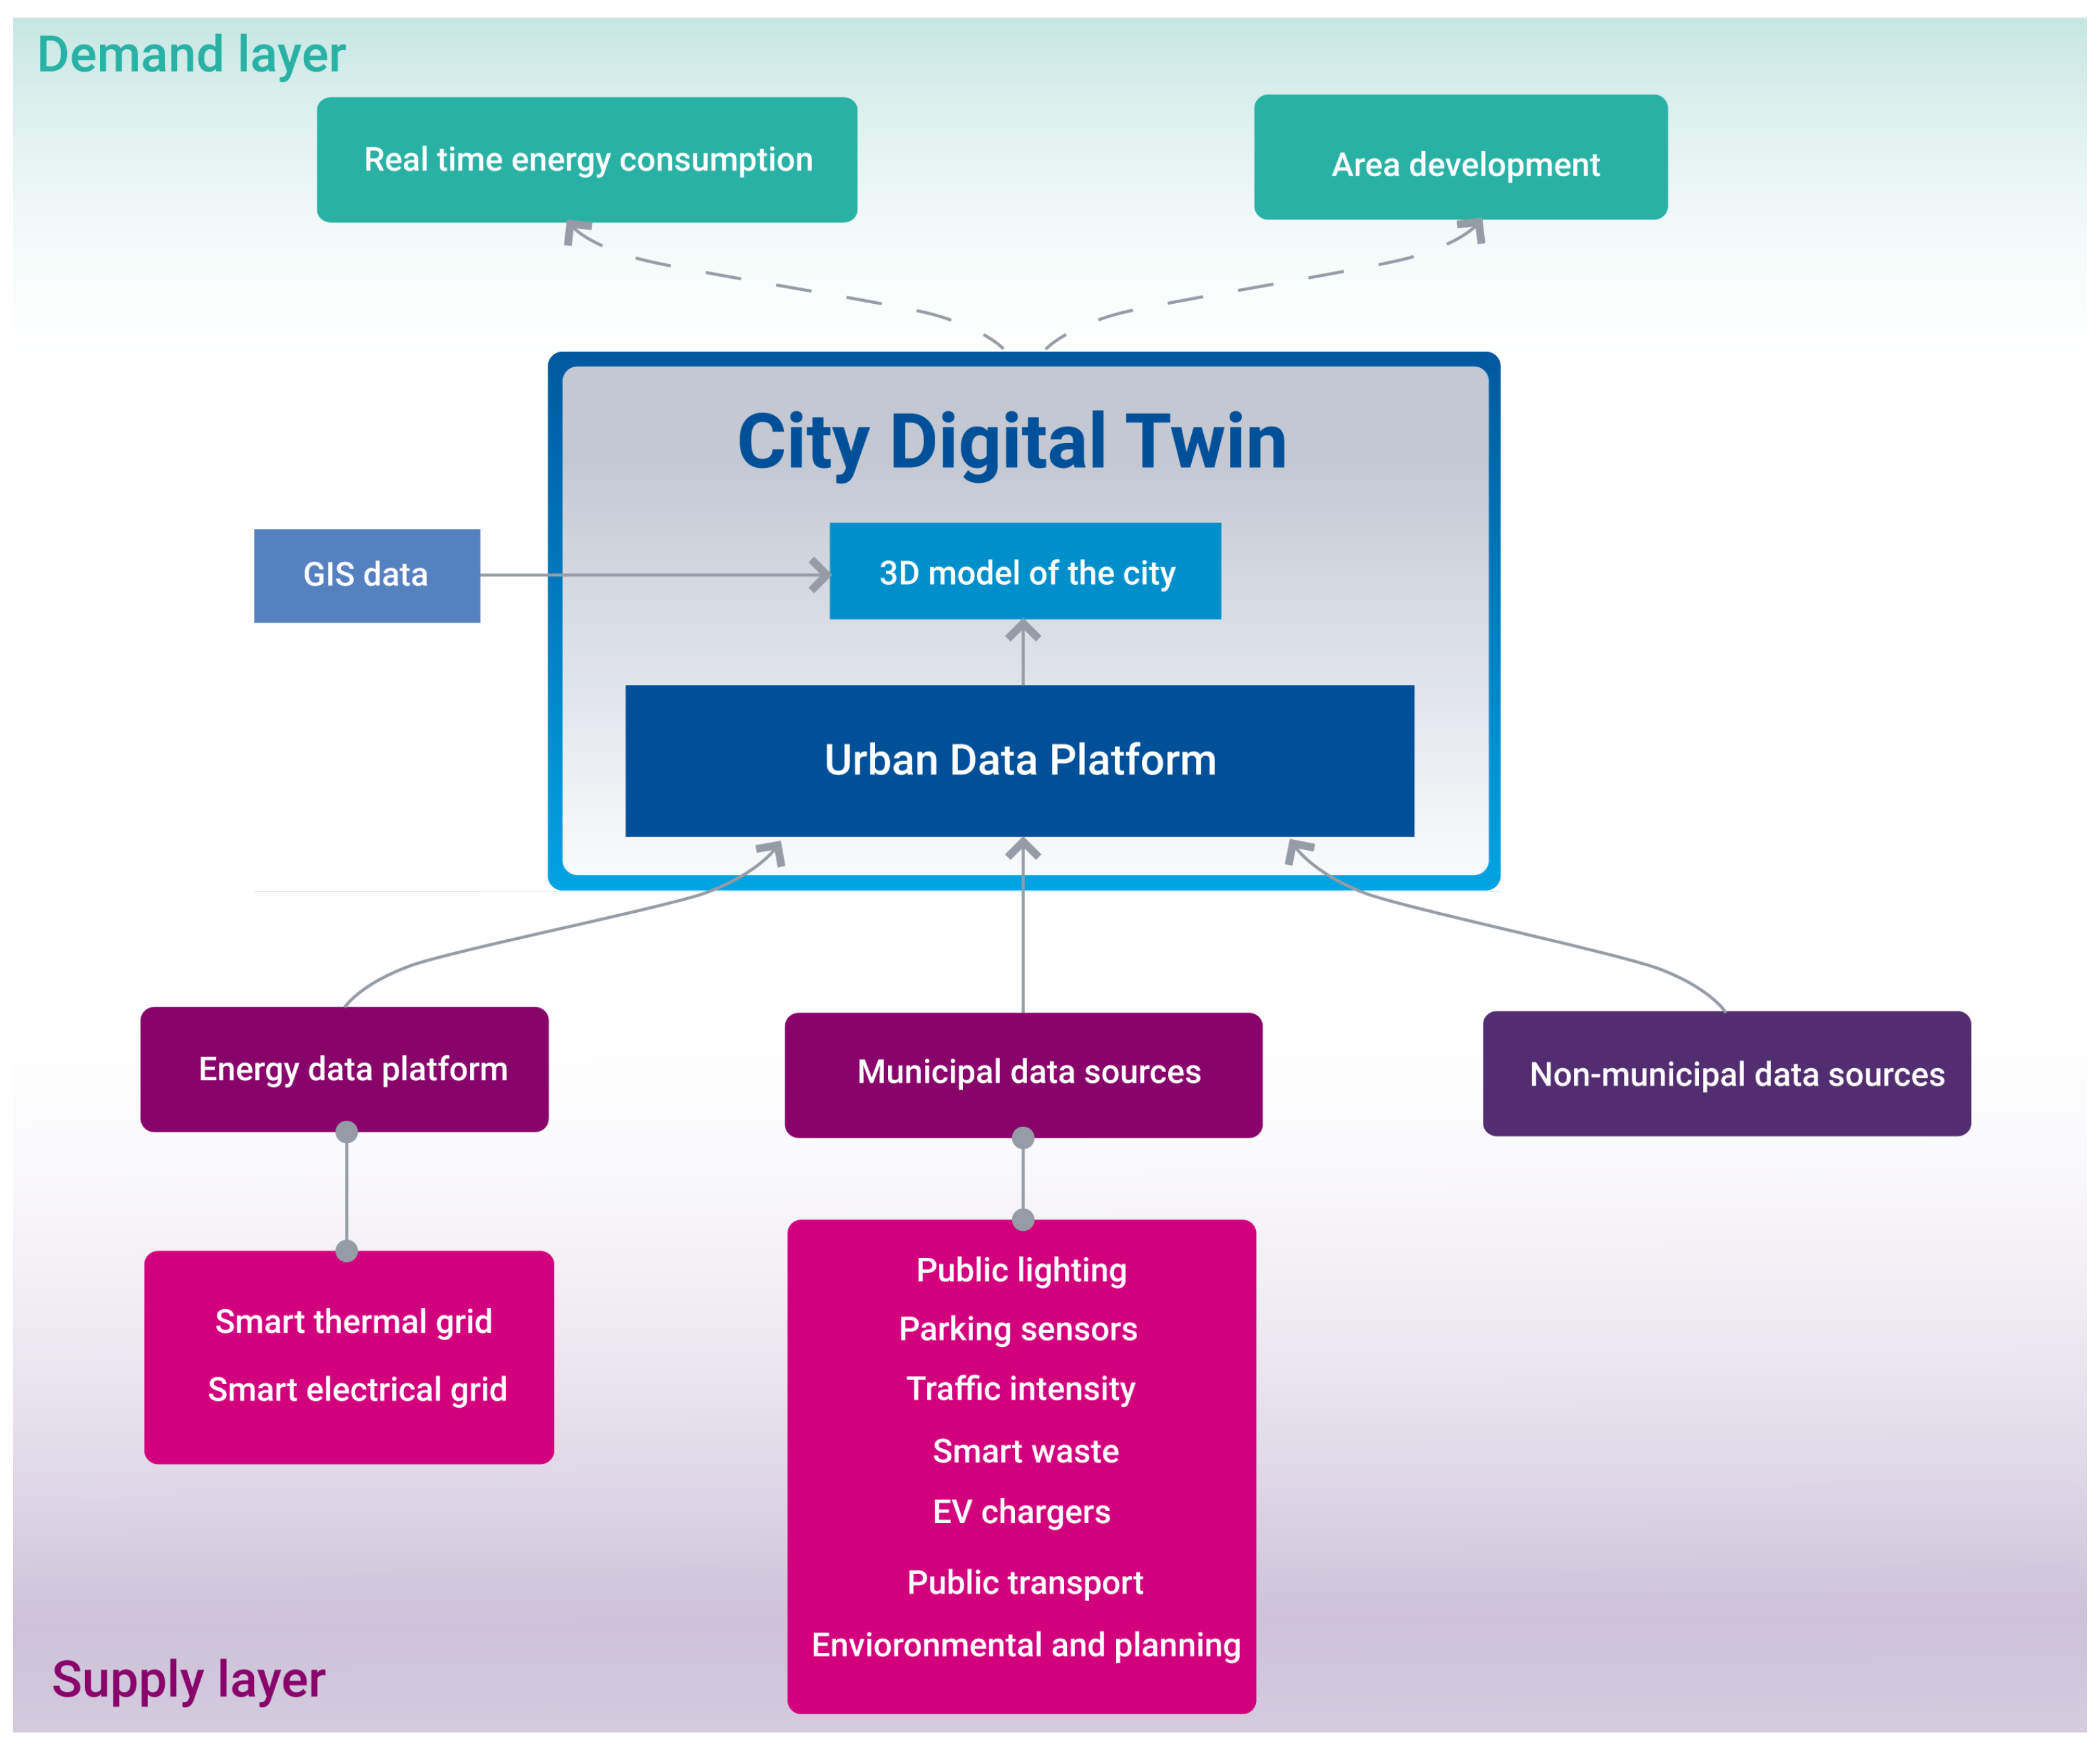
- The platform presented in the third section could be used for designing the basic architecture of the city’s digital twin.
- Before implementing the digital twin of the city, it must be defined who will be responsible for the gathered data to create trust between the city, companies, citizens and research institutes. It is suggested that the municipality should be primarily responsible for the city’s digital platform and open data. The security and privacy of the data must be ensured before importing data into the platform. Open data standards must be unified to make them compatible with the urban data platform.
- Every city has its approach to digitalization, and it is impossible to unify every city’s digitalization process. Rotterdam and Brno choose a different way of visualizing the data. The Rotterdam infrastructure is multi-layered (water canals, bridges, underground), and a 3D visualization platform better represents it.
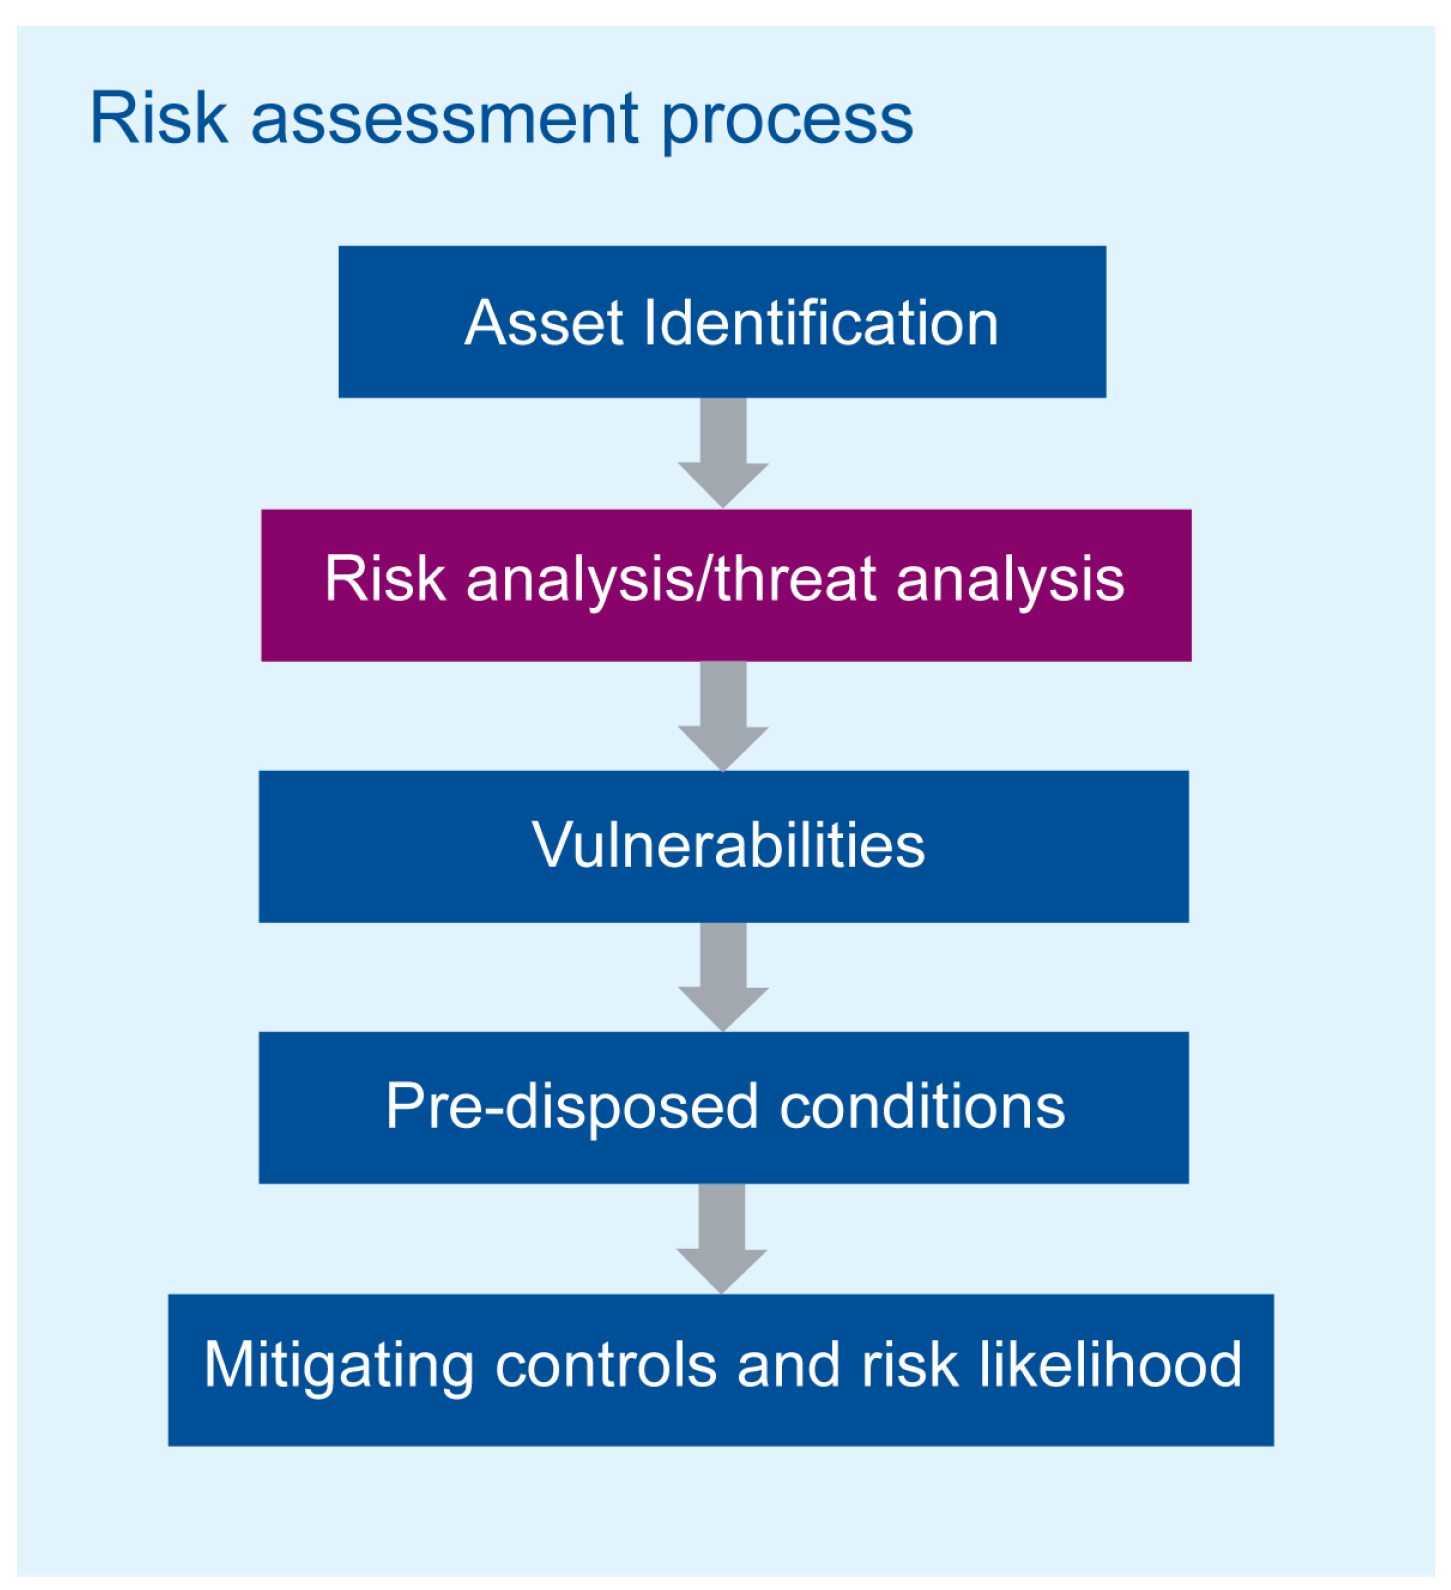
- There are several security threats that a risk assessment must detect before starting the digitalization process of the city. Security threats can be identified using several taxonomies. The article summarizes threats that occur in sensors-cloud architecture.
- Data visualization is well-managed in existing digital platforms, but AI-assisted applications such as self-decision and prediction in city management issues are still not widely implemented.
- The current situation in Europe gives rise to the possibility of using a smart infrastructure and digital twin cities for the protection of the population in the city. It was found that the architecture of the smart cities and military technologies must be developed in mutual compliance to assure interoperability.
- Primary motivation for future trends is to make cities more friendly to people.
Author Contributions
Funding
Data Availability Statement
Acknowledgments
Conflicts of Interest
Abbreviations
| PV | Photovoltaic |
| NOx | The gases nitric oxide and nitrogen dioxide |
| CO2 | Carbon dioxide |
| LED | Light-emitting diode |
| IoT | Internet of Things |
| AI | Artificial Intelligence |
| IGB | Intelligent Green Building |
| LSTM | Long-short term memory |
| UDP | Urban data platform |
| GIS | Geographic information system |
| NIST | The National Institute of Standards and Technology |
| SCCF | Smart Cities and Communities Framework |
| API | Application Programming Interface |
| PM10 | Particulate matter that are generally 10 micrometers and smaller |
| PM2.5 | Particulate matter that are generally 2.5 micrometers and smaller |
| AQI | Air Quality Index |
References
- De Dutta, S.; Prasad, R. Digitalization of Global Cities and the Smart Grid. Wirel. Pers. Commun. 2020, 113, 1385–1395. [Google Scholar] [CrossRef]
- Lv, Z.; Qiao, L.; Kumar Singh, A.; Wang, Q. AI-empowered IoT Security for Smart Cities. ACM Trans. Internet Technol. 2021, 21, 1–21. [Google Scholar] [CrossRef]
- Bellini, P.; Nesi, P.; Pantaleo, G. IoT-Enabled Smart Cities: A Review of Concepts, Frameworks and Key Technologies. Appl. Sci. 2022, 12, 1607. [Google Scholar] [CrossRef]
- Kumar, H.A.; Rakshith, J.; Shetty, R.; Roy, S.; Sitaram, D. Comparison of IoT Architectures Using A Smart City Benchmark. Procedia Comput. Sci. 2020, 171, 1507–1516. [Google Scholar] [CrossRef]
- Kabrane, M. Energy Consumption and Lifetime of Wireless Sensor Networks Applications in Smart Cities: Simulation for Urban Mobility. Int. J. Sens. Sens. Netw. 2017, 5, 14. [Google Scholar] [CrossRef] [Green Version]
- Du, R.; Gkatzikis, L.; Fischione, C.; Xiao, M. On maximizing sensor network lifetime by energy balancing. IEEE Trans. Control Netw. Syst. 2018, 5, 1206–1218. [Google Scholar] [CrossRef] [Green Version]
- Pal, M.S.; Bhatia, M. Lifetime Maximization of Bin Level IoT Sensor and Route Optimization for Smart Waste Management in Hilly City Shimla, India: A Comparative Analysis. In Proceedings of the 2022 2nd International Conference on Advances in Electrical, Computing, Communication and Sustainable Technologies, ICAECT 2022, Bhilai, India, 21–22 April 2022. [Google Scholar] [CrossRef]
- Rajab, A.D. Energy-Efficient Static Data Collector-based Scheme in Smart Cities. Comput. Mater. Contin. 2022, 72, 2077–2092. [Google Scholar] [CrossRef]
- Zhou, M.C.; Mehedi Hassan, M.; Goscinski, A. Emerging edge-of-things computing for smart cities: Recent advances and future trends. Inf. Sci. 2022, 600, 442–445. [Google Scholar] [CrossRef]
- Al Nuaimi, E.; Al Neyadi, H.; Mohamed, N.; Al-Jaroodi, J. Applications of big data to smart cities. J. Internet Serv. Appl. 2015, 6, 1–15. [Google Scholar] [CrossRef]
- Baillieul, J.; Antsaklis, P.J. Control and communication challenges in networked real-time systems. Proc. IEEE 2007, 95, 9–28. [Google Scholar] [CrossRef]
- Ura, S.; Ghosh, A.K. Time latency-centric signal processing: A perspective of smart manufacturing. Sensors 2021, 21, 7336. [Google Scholar] [CrossRef]
- Cirillo, F.; Gómez, D.; Diez, L.; Elicegui Maestro, I.; Gilbert, T.B.J.; Akhavan, R. Smart city IoT services creation through large-scale collaboration. IEEE Internet Things J. 2020, 7, 5267–5275. [Google Scholar] [CrossRef] [Green Version]
- Deren, L.; Wenbo, Y.; Zhenfeng, S. Smart city based on digital twins. Comput. Urban Sci. 2021, 1, 1–11. [Google Scholar] [CrossRef]
- Mahmoodian, M.; Shahrivar, F.; Setunge, S.; Mazaheri, S. Development of Digital Twin for Intelligent Maintenance of Civil Infrastructure. Sustainability 2022, 14, 8664. [Google Scholar] [CrossRef]
- Mylonas, G.; Kalogeras, A.; Kalogeras, G.; Anagnostopoulos, C.; Alexakos, C.; Munoz, L. Digital Twins from Smart Manufacturing to Smart Cities: A Survey. IEEE Access 2021, 9, 143222–143249. [Google Scholar] [CrossRef]
- Guo, J.; Lv, Z. Application of Digital Twins in multiple fields. Multimed. Tools Appl. 2022, 81, 26941–26967. [Google Scholar] [CrossRef]
- Toh, C.K. Security for smart cities. IET Smart Cities 2020, 2, 95–104. [Google Scholar] [CrossRef]
- Pandey, P. Making Smart Cities Cybersecure. Deloitte Insights. Available online: https://www2.deloitte.com/us/en/insights/multimedia/podcasts/making-smart-cities-cybersecure.html (accessed on 8 December 2022).
- Ismagilova, E.; Hughes, L.; Rana, N.P.; Dwivedi, Y.K. Security, Privacy and Risks within Smart Cities: Literature Review and Development of a Smart City Interaction Framework. Inf. Syst. Front. 2022, 24, 393–414. [Google Scholar] [CrossRef]
- Kirimtat, A.; Krejcar, O.; Kertesz, A.; Tasgetiren, M.F. Future Trends and Current State of Smart City Concepts: A Survey. IEEE Access 2020, 8, 86448–86467. [Google Scholar] [CrossRef]
- Konhäuser, W. Digitalization in Buildings and Smart Cities on the Way to 6G. Wirel. Pers. Commun. 2021, 121, 1289–1302. [Google Scholar] [CrossRef]
- Saeed, Z.; Mancini, F.; Glusac, T.; Izadpanahi, P. Future City, Digital Twinning and the Urban Realm: A Systematic Literature Review. Buildings 2022, 12, 685. [Google Scholar] [CrossRef]
- Tao, F.; Qi, Q. Make More Digital Twins. Nature 2019, 573, 490–491. [Google Scholar] [CrossRef] [PubMed] [Green Version]
- RUGGEDISED. FACTSHEET R9: 3-D City Operations Platform. Available online: https://ruggedised.eu/fileadmin/repository/Factsheets/Ruggedised-factsheet-R9-Rotterdam.pdf (accessed on 8 December 2022).
- DImitrov, H.; Petrova-Antonova, D. 3D city model as a first step towards digital twin of Sofia City. Int. Arch. Photogramm. Remote Sens. Spat. Inf. Sci.-ISPRS Arch. 2021, 43, 23–30. [Google Scholar] [CrossRef]
- Hämäläinen, M. Urban development with dynamic digital twins in Helsinki city. IET Smart Cities 2021, 3, 201–210. [Google Scholar] [CrossRef]
- Wan, L.; Nochta, T.; Schooling, J.M. Developing a city-level digital twin - Propositions and a case study. In International Conference on Smart Infrastructure and Construction 2019, ICSIC 2019: Driving Data-Informed Decision-Making; ICE Publishing: London, UK, 2019; pp. 187–193. [Google Scholar] [CrossRef] [Green Version]
- Web Data Portal data.Brno. Available online: https://datahub.brno.cz/ (accessed on 8 December 2022).
- Ferré-Bigorra, J.; Casals, M.; Gangolells, M. The adoption of urban digital twins. Cities 2022, 131, 103905. [Google Scholar] [CrossRef]
- Abdeen, F.N.; Sepasgozar, S.M.E. City Digital Twin Concepts: A Vision for Community Participation. Environ. Sci. Proc. 2022, 12, 19. [Google Scholar] [CrossRef]
- Agostinelli, S.; Cumo, F.; Guidi, G.; Tomazzoli, C. Cyber-physical systems improving building energy management: Digital twin and artificial intelligence. Energies 2021, 14, 2338. [Google Scholar] [CrossRef]
- Agostinelli, S.; Cumo, F.; Nezhad, M.M.; Orsini, G.; Piras, G. Renewable Energy System Controlled by Open-Source Tools and Digital Twin Model: Zero Energy Port Area in Italy. Energies 2022, 15, 1817. [Google Scholar] [CrossRef]
- Box, P.; Lee, A.; Smith, G.; Mackenzie, A.; Sanderson, T.; Reeson, A.; Duenser, A.; Fleet, R. Data Platforms for Smart Cities, A Landscape Scan and Recommendations for Smart City Practice; ANU Research Publications: Canberra, Australia, 2020. [Google Scholar]
- Brunet, P.M.; Baillarin, S.; Lassalle, P.; Weissgerber, F.; Vallet, B.; Christophe, T.; Foulon, G.; Romeyer, G.; Souille, G.; Gabet, L.; et al. AI4GEO: A PATH FROM 3D MODEL TO DIGITAL TWIN. In Proceedings of the IGARSS 2022—2022 IEEE International Geoscience and Remote Sensing Symposium, Kuala Lumpur, Malaysia, 17–22 July 2022; pp. 4728–4731. [Google Scholar]
- Buchinger, M.; Kuhn, P.; Kalogeropoulos, A.; Balta, D. Towards interoperability of smart city data platforms. In Proceedings of the 54th Hawaii International Conference on System Sciences, Honolulu, HI, USA, 4–8 January 2021; pp. 2454–2463. [Google Scholar] [CrossRef]
- Dembski, F.; Wössner, U.; Letzgus, M.; Ruddat, M.; Yamu, C. Urban digital twins for smart cities and citizens: The case study of herrenberg, germany. Sustainability 2020, 12, 2307. [Google Scholar] [CrossRef] [Green Version]
- El-Hallaq, M.A.; Alastal, A.I.; Salha, R.A. Enhancing Sustainable Development through Web Based 3D Smart City Model Using GIS and BIM. Case Study: Sheikh Hamad City. J. Geogr. Inf. Syst. 2019, 11, 321–330. [Google Scholar] [CrossRef] [Green Version]
- Gholami, M.; Torreggiani, D.; Tassinari, P.; Barbaresi, A. Developing a 3D City Digital Twin: Enhancing Walkability through a Green Pedestrian Network (GPN) in the City of Imola, Italy. Land 2022, 11, 1917. [Google Scholar] [CrossRef]
- Jeong, S.; Kim, S.; Kim, J. City data hub: Implementation of standard-based smart city data platform for interoperability. Sensors 2020, 20, 7000. [Google Scholar] [CrossRef] [PubMed]
- Jovanović, D.; Milovanov, S.; Ruskovski, I.; Govedarica, M.; Sladić, D.; Radulović, A.; Pajić, V. Building virtual 3D city model for smart cities applications: A case study on campus area of the university of novi sad. ISPRS Int. J. Geo-Inf. 2020, 9, 476. [Google Scholar] [CrossRef]
- Luo, J.; Liu, P.; Cao, L. Coupling a Physical Replica with a Digital Twin: A Comparison of Participatory Decision-Making Methods in an Urban Park Environment. ISPRS Int. J. Geo-Inf. 2022, 11, 452. [Google Scholar] [CrossRef]
- Morishita-Steffen, N.; Alberola, R.; Mougeot, B.; Vignali, É.; Wikström, C.; Montag, U.; Gastaud, E.; Lutz, B.; Hartmann, G.; Pfaffenbichler, F.X.; et al. Smarter together: Progressing smart data platforms in Lyon, Munich, and Vienna. Energies 2021, 14, 1075. [Google Scholar] [CrossRef]
- Vítor, G.; Rito, P.; Sargento, S.; Pinto, F. A scalable approach for smart city data platform: Support of real-time processing and data sharing. Comput. Netw. 2022, 213, 109027. [Google Scholar] [CrossRef]
- Wang, K.; Hu, Q.; Zhou, M.; Zun, Z.; Qian, X. Multi-aspect applications and development challenges of digital twin-driven management in global smart ports. Case Stud. Transp. Policy 2021, 9, 1298–1312. [Google Scholar] [CrossRef]
- Lin, H.; Xu, B.; Chen, Y.; Li, W.; You, L.; He, J. VGEs as a New Platform for Urban Modeling and Simulation. Sustainability 2022, 14, 7980. [Google Scholar] [CrossRef]
- Yun, Y.; Lee, M. Smart City 4.0 from the perspective of open innovation. J. Open Innov. Technol. Mark. Complex. 2019, 5, 92. [Google Scholar] [CrossRef] [Green Version]
- Obi, T.; Iwasaki, N. Smart Government using Digital Twin in Japan. In Proceedings of the 8th International Conference on ICT for Smart Society: Digital Twin for Smart Society, ICISS 2021—Proceeding, Bandung, Indonesia, 2–4 August 2021; pp. 1–4. [Google Scholar] [CrossRef]
- Yang, B.; Lv, Z.; Wang, F. Digital Twins for Intelligent Green Buildings. Buildings 2022, 12, 856. [Google Scholar] [CrossRef]
- Caprari, G. Digital Twin for Urban Planning in the Green Deal Era: A State of the Art and Future Perspectives. Sustainability 2022, 14, 6263. [Google Scholar] [CrossRef]
- Li, C.Z.; Guo, Z.; Su, D.; Xiao, B.; Tam, V.W.Y. The Application of Advanced Information Technologies in Civil Infrastructure Construction and Maintenance. Sustainability 2022, 14, 7761. [Google Scholar] [CrossRef]
- Henzel, J.; Wróbel, Ł.; Fice, M.; Sikora, M. Energy Consumption Forecasting for the Digital-Twin Model of the Building. Energies 2022, 15, 4318. [Google Scholar] [CrossRef]
- Ma, C. Smart city and cyber-security; technologies used, leading challenges and future recommendations. Energy Rep. 2021, 7, 7999–8012. [Google Scholar] [CrossRef]
- Lee, J.; Kim, J.; Seo, J. Cyber attack scenarios on smart city and their ripple effects. In Proceedings of the 2019 International Conference on Platform Technology and Service, PlatCon 2019—Proceedings, Jeju, Korea, 28–30 January 2019. [Google Scholar] [CrossRef]
- Gautam, B.P.; Norio, S. SUESSA: Sustainable Ultra-Elastic Stack Security Architecture for Securing IoT Networks of Future Smart Cities. In Proceedings of the 2020 8th International Symposium on Computing and Networking Workshops, CANDARW 2020, Naha, Japan, 24–27 November 2020; pp. 387–390. [Google Scholar] [CrossRef]
- Skouloudi, C.; Malatras, A.; Naydenov, R.; Dede, G. Guidelines for Securing the Internet of Things Secure Supply Chain for IoT; European Union Agency for Network and Information Security: Heraklion, Greece, 2020; pp. 1–52. [Google Scholar]
- Bagheri, S.; van Oosterhout, M.P.A. Towards an Energy Transition in the City of Rotterdam: Smart Thermal Grid Initiatives. RSM Case Development Centre. Available online: https://repub.eur.nl/pub/137108 (accessed on 8 December 2022).
- Lévy-Bencheton, C.; Darra, E. Cyber Security for Smart Cities an Architecture Model for Public Transport; European Union Agency for Network and Information Security: Heraklion, Greece, 2015; pp. 1–54. [Google Scholar]
- Mayol, J.; Manzoni, A.; Calcavecchia, F.; Iliev, Y.; Kabisch, B.; Lovis, C.; Morgenstern, M.; Gomes, R.; Gerald, G.; Glynos, D.; et al. Smart Hospitals Security and Resilience for Smart Health Service and Infrastructures; European Union Agency for Network and Information Security: Heraklion, Greece, 2016; pp. 1–56. [Google Scholar] [CrossRef]
- Kovalsky, M.; Ross, R.J.; Lindsay, G. Contesting Key Terrain: Urban Conflict in Smart Cities of the Future. Cyber Def. Rev. 2020, 5, 133–150. [Google Scholar]
- Fiott, D. Protecting Europe in the Age of Quantum Computing and the Cloud; European Union Institute for Security Studies: Paris, France, 2020; pp. 1–8. [Google Scholar]
- Johnsen, F.T.; Zielinski, Z.; Wrona, K.; Suri, N.; Fuchs, C.; Pradhan, M.; Furtak, J.; Vasilache, B.; Pellegrini, V.; Dyk, M.; et al. Application of IoT in military operations in a smart city. In Proceedings of the 2018 International Conference on Military Communications and Information Systems, ICMCIS 2018, Warsaw, Poland, 22–23 May 2018; pp. 1–8. [Google Scholar] [CrossRef]
- Diran, D.; Woestenburg, A.; Kotterink, B.; Slob, A.; van der Heijden, R. Ruggedised D1.6: Guidance on Smart City Design and Decision Platform. Available online: https://ruggedised.eu/fileadmin/repository/Publications/D1.6_-_Guidance_on_Smart_City_Design_and_Decision_Platform.pdf (accessed on 8 December 2022).
- Schieferdecker, I.; Tcholtchev, N.; Lämmel, P. Urban data platforms—An overview. In Proceedings of the Companion to the Proceedings of the 12th International Symposium on Open Collaboration, OpenSym 2016, Berlin, Germany, 17–19 August 2016. [Google Scholar] [CrossRef]
- Liu, X.; Heller, A.; Nielsen, P.S. CITIESData: A smart city data management framework. Knowl. Inf. Syst. 2017, 53, 699–722. [Google Scholar] [CrossRef] [Green Version]
- Launius, S.M. Evaluation of Comprehensive Taxonomies for Information Technology Threats. Available online: https://csiac.org/articles/evaluation-of-comprehensive-taxonomies-for-information-technology-threats (accessed on 8 December 2022).
- Baig, Z.A.; Szewczyk, P.; Valli, C.; Rabadia, P.; Hannay, P.; Chernyshev, M.; Johnstone, M.; Kerai, P.; Ibrahim, A.; Sansurooah, K.; et al. Future challenges for smart cities: Cyber-security and digital forensics. Digit. Investig. 2017, 22, 3–13. [Google Scholar] [CrossRef]
- Griffor, E. Handbook of System Safety and Security: Cyber Risk and Risk Management, Cyber Security, Threat Analysis, Functional Safety, Software Systems, and Cyber Physical Systems, 1st ed.; Syngress: Oxford, UK, 2016; p. 300. [Google Scholar]
- Pradhan, M. A Survey of Smart City Assets for Future Military Usage. In Proceedings of the 2018 International Symposium on Networks, Computers and Communications, ISNCC 2018, Rome, Italy, 19–21 June 2018. [Google Scholar] [CrossRef]
- Abdelwashed, A.; van der Berg, P.L.; Brandt, T. Enabling Sustainable Public Transport in Smart Cities through Real-time Decision Support. In Proceedings of the International Conference on Information Systems, ICIS, Munich, Germany, 15–18 December 2019. [Google Scholar]
- RUGGEDISED. D2.6: Implementation Report Rotterdam. Available online: https://ec.europa.eu/research/participants/documents/downloadPublic?documentIds=080166e5ceb4f776&appId=PPGMS (accessed on 8 December 2022).
- Rotterdam. Rotterdam 3D Model. Available online: www.3drotterdam.nl (accessed on 8 December 2022).
- Spal, R. How Open Data Standards Make Brno a Better City. Available online: https://datahub.brno.cz/pages/article-how-open-data-standards-make-brno-a-better-city (accessed on 8 December 2022).
- AQI. The World Air Quality Project. Available online: www.aqicn.org (accessed on 8 December 2022).
- Antunes, M.E.; Barroca, J.G.; Oliveira, D.G. Urban Future with a Purpose 12 Trends Shaping Human Living. Available online: https://www2.deloitte.com/us/en/insights/industry/public-sector/future-of-cities (accessed on 8 December 2022).
- Evans, N.D.; Sauter, G.; Odeh, I.S. 3 Steps to Build ’Adaptive’ Smart Cities of the Future. Available online: https://www.weforum.org/agenda/2022/09/3-steps-build-adaptive-smart-cities-of-the-future (accessed on 8 December 2022).
- Allam, Z.; Jones, D.S. Future (post-COVID) digital, smart and sustainable cities in the wake of 6G: Digital twins, immersive realities and new urban economies. Land Use Policy 2021, 101, 105201. [Google Scholar] [CrossRef]
- Ahmad, K.A.B.; Khujamatov, H.; Akhmedov, N.; Bajuri, M.Y.; Ahmad, M.N.; Ahmadian, A. Emerging trends and evolutions for smart city healthcare systems. Sustain. Cities Soc. 2022, 80, 103695. [Google Scholar] [CrossRef]


| Reference | Topic/Purpose | Visualization | Scope |
|---|---|---|---|
| [31] | Digital twin concept | - | City |
| [32] | Digital twin | 3D | Infrastructure |
| [33] | Use a Digital Twin | 3D | Port |
| [34] | Data Platforms for Smart Cities | - | City |
| [35] | Developing 3D digital model | 3D | City |
| [36] | Taxonomy | - | City |
| [37] | Urban digital twin | 3D | City |
| [38] | Web Based 3D Smart City Model | 3D | City |
| [39] | 3D city model of park | 3D | Infrastructure |
| [27] | Concept of digital twin | 3D | City |
| [40] | Smart City Data Platform | - | City |
| [41] | Virtual 3D city model | 3D | Campus |
| [42] | Digital twin of park | 3D | Infrastructure |
| [43] | Smart Data Platform | 3D/2D | City |
| [44] | Smart city data platform | 2D | Campus |
| [45] | Overview of digital twin | 3D | Port |
| Rotterdam | Brno | |
|---|---|---|
| Visualization | 3D | 2D |
| API for downloading the data | No | Yes |
| Possibility of participation | Yes | No |
| Augmented reality | Yes | No |
| Underground layers | Yes | No |
| Information from the city council | No | Yes |
| Real-time datasets | Yes (limited) | Yes (limited) |
| Additional applications and further analysis | No | Yes |
Disclaimer/Publisher’s Note: The statements, opinions and data contained in all publications are solely those of the individual author(s) and contributor(s) and not of MDPI and/or the editor(s). MDPI and/or the editor(s) disclaim responsibility for any injury to people or property resulting from any ideas, methods, instructions or products referred to in the content. |
© 2022 by the authors. Licensee MDPI, Basel, Switzerland. This article is an open access article distributed under the terms and conditions of the Creative Commons Attribution (CC BY) license (https://creativecommons.org/licenses/by/4.0/).
Share and Cite
Barcik, P.; Coufalikova, A.; Frantis, P.; Vavra, J. The Future Possibilities and Security Challenges of City Digitalization. Smart Cities 2023, 6, 137-155. https://doi.org/10.3390/smartcities6010008
Barcik P, Coufalikova A, Frantis P, Vavra J. The Future Possibilities and Security Challenges of City Digitalization. Smart Cities. 2023; 6(1):137-155. https://doi.org/10.3390/smartcities6010008
Chicago/Turabian StyleBarcik, Peter, Aneta Coufalikova, Petr Frantis, and Jiri Vavra. 2023. "The Future Possibilities and Security Challenges of City Digitalization" Smart Cities 6, no. 1: 137-155. https://doi.org/10.3390/smartcities6010008